1. Introduction
Extended reality (XR) refers to a set of technologies that alter a user’s perception of the physical environment by adding digital content or replacing the environment with a computer-generated one. Milgram and Kishino organized these technologies along a virtuality–reality continuum, ranging from a completely real environment to a completely virtual environment, with mixed-reality located somewhere between the two endpoints [
1]. Augmented reality (AR) supplements the environment with virtual objects, and as characterized by Azuma, AR systems contain three defining properties: combining real and virtual content, supporting real-time interaction, and registering content in three-dimensional space [
2]. Virtual reality (VR) is located at the virtual endpoint, and it immerses the user in an interactive synthetic environment. This can often produce a sense of presence, described as a subjective sensation of being located inside the displayed environment [
3]. These properties have made VR particularly relevant to entertainment, education, professional training, and healthcare, among others [
3].
Difficulty in VR games differs from difficulty in conventional games because of the interaction medium. The head-mounted display (HMD) and tracked hand controllers force the player to maintain coordinated head, hand, and body movements. A single task may combine visual attention, reaction speed, aiming precision, spatial coordination, and physical effort [
4,
5]. Additionally, player performance may vary across these components, even among users who obtain similar overall scores. This matters in VR because changes to target behavior, movement speed, or spatial layout can alter several task demands simultaneously [
5]. Moreover, predetermined difficulty settings and progression curves cannot respond to differences in initial ability or changes in performance during play.
Dynamic difficulty adjustment (DDA) provides a means of adapting game challenges to the individual player. Zohaib defines DDA as the automatic, real-time modification of game features, behaviors, and scenarios according to the player’s skill [
6]. Similarly, Hunicke presents DDA as an interactive process that adjusts the game systems during play without disrupting the core player experience [
7]. The common objective among these methods is to maintain a suitable relationship between the demands imposed by the game, and the abilities demonstrated by the player. More recent work frames DDA around a design objective, a mechanism for evaluating objective and subjective game difficulty, and a mechanism for modifying game tasks to achieve the desired difficulty progression [
8]. This framing distinguishes the objective difficulty created by the game parameters from the difficulty experienced by the player.
One important aspect of DDA is converting observation of player behavior into a representation that can guide adaptation. Many existing systems combine several observations into one global performance value, skill class, or player state [
9,
10]. While this global representation provides a compact control signal, it can also conceal uneven abilities across separate mechanics. For instance, in a game that combines shooting with obstacle avoidance, strong shooting performance may compensate numerically for poor movement performance. Therefore, two players with different ability profiles may receive similar difficulty adjustments. Skill-specific modeling takes a different approach by maintaining separate classifications for individual task demands. For example, Chrysafiadi et al. estimated battle and maze-navigation abilities separately and used each estimate to adapt the corresponding game mechanics [
11].
Limited evidence is available on whether complete progression strategies built around global and skill-specific player models produce different gameplay or player-experience outcomes. DDA studies vary considerably in their objectives, input signals, game mechanics, and evaluation procedures [
9]. Also, the reported changes in achieved difficulty, performance, and subjective experience do not align consistently [
8,
10]. Most existing research tends to compare adaptive and static difficulty, to contrast alternative input signals, or to evaluate one proposed controller in isolation. Direct comparisons of complete progression strategies based on global and skill-specific player models within the same game, hardware configuration, and measurement procedure remain rare. This gap is especially relevant to VR games, where one activity can depend on several perceptual and physical capabilities.
To examine this issue, we developed Pulse Run, a short-form arcade VR game that combines color-matched target shooting with physical obstacle avoidance. Each run lasts 210 s, during which players must shoot red and blue targets using the corresponding projectile color and physically avoid approaching walls through lateral and vertical movement. The gameplay is organized into authored patterns spanning five overall difficulty tiers. Each pattern contains separate ratings for its aiming, movement, and color-selection demands. Scroll speed and distance between successive patterns provide further control over gameplay pacing.
The experimental design provides an exploratory comparison of three progression strategies. Fixed Time-Based Progression changes pacing and available pattern difficulty according to a predetermined schedule. Performance-Based DDA combines shooting performance, wall avoidance, and player stability into one global performance estimate that controls pattern eligibility, scroll speed, and pattern gap. Skill-Specific DDA maintains separate estimates for aiming, movement, and color matching, then uses these estimates to control which patterns are suitable for the player. Within the primary analysis, the game environment, headset model, rendering configuration, pattern library, run duration, task rules, and measurement procedure remained consistent across the three strategies. Both adaptive strategies used a 15 s rolling window, a 12 s warm-up period, a 2 s evaluation interval, a ±0.08 dead zone, and common definitions for target hit rate, shot accuracy, movement safety, and normalized stability.
During gameplay, the system records many variables such as score, shooting accuracy, target completion, color matching, wall contact duration, achieved pacing, and distribution of presented pattern difficulties. Additionally, post-run ratings capture perceived difficulty, enjoyment, and frustration. The main goal of the study is to compare the content delivery, gameplay performance, and player-rating profiles produced by the three progression strategies.
3. Methodology
This section presents the study design and methodology used to compare three difficulty progression strategies implemented in Pulse Run VR. First, the experimental design, participant sample, and strategy-allocation methods are presented. It is then followed by the VR game itself and its shared game mechanics. The difficulty model and the three progression strategies are then presented in detail. The remaining subsections describe the experimental setup and procedure, data collection, and the methods used to process and statistically analyze the resulting analytics.
Figure 1 provides a high-level overview of the study workflow. Each participant entered their age and previous VR experience, completed a 10 s height-calibration phase, and then completed a short interactive tutorial covering the main game mechanics. Participants were assigned to one of three difficulty progression strategies using a round-robin allocation procedure: Fixed Time-Based Progression, Performance-Based DDA, or Skill-Specific DDA. Participants then completed a single Pulse Run VR session lasting approximately 3.5 min, combining color-matched target shooting with physically avoiding approaching walls. During the session, the system automatically recorded gameplay performance, obstacle avoidance and movement, and exposure to different difficulty parameters. After completing the run, participants rated its difficulty, enjoyment, and frustration, and reported whether they experienced motion sickness. The collected data were stored as individual JSON files, screened for valid sessions, and processed to derive the metrics used to compare the three strategies.
3.1. Study Design and Participants
The study followed a between-subject design in which each participant completed one recorded Pulse Run VR session using a single difficulty progression strategy. This design reduced the influence of practice, fatigue, and familiarity that could appear if participants completed the same task several times using different strategies. Strategies were assigned through round-robin strategy allocation. On each headset, each successive participant received the next strategy in a repeating sequence, keeping the three groups approximately equal in size throughout data collection. The allocation order was fixed and not randomized. Because the allocation cycles ran separately on each headset and data collection ended after different numbers of sessions, the procedure did not guarantee equal final group sizes.
Participants were recruited through convenience sampling. Adolescent participants took part during organized educational activities and attended in groups accompanied by adult supervisors. Participants in these activities required prior permission from a parent or legal guardian, and the supervisors remained present during the VR sessions. Young adult participants, primarily aged 18–23, were students recruited from the same university. No previous VR experience was required. Before the recorded session, participants were informed about the study and the collected data and could proceed only after confirming consent through the in-game interface.
The primary analyzed sample comprised 28 participants, with 7 assigned to Fixed Time-Based Progression, 10 to Performance-Based DDA, and 11 to Skill-Specific DDA. Verified participant ages ranged from 16 to 26 years (M = 19.2, SD = 2.7). Only age, previous VR experience, gameplay telemetry, and post-run feedback were collected, and all data was anonymized. No names, contact details, audio, or video recordings, or other direct identifiers were stored. Each session was saved using an automatically generated participant identifier that was not linked to the participant’s identity.
The study was exploratory, and the sample size was determined by participant availability during the scheduled data-collection activities; no a priori power analysis was conducted. As an approximate sensitivity benchmark, a conventional three-group one-way ANOVA with N = 28, α = 0.05, and 80% power would detect an effect of approximately Cohen’s f = 0.62 (η2 = 0.28).
3.2. Pulse Run VR Game
Pulse Run VR is a first-person VR game developed in Unity 6.4.5f1 as an experimental platform for comparing three difficulty progression strategies. The player remains in a fixed position inside a continuously scrolling environment, with targets and wall obstacles moving towards them, similar to other popular VR games such as Beat Saber. No controller-based locomotion was used, and all movement was performed physically by the player. Each recorded gameplay run lasts 210 s. Third-party visual and audio assets, including 3D models, sound effects, and music, were obtained from the Unity Asset Store and other asset repositories and used under their respective licenses.
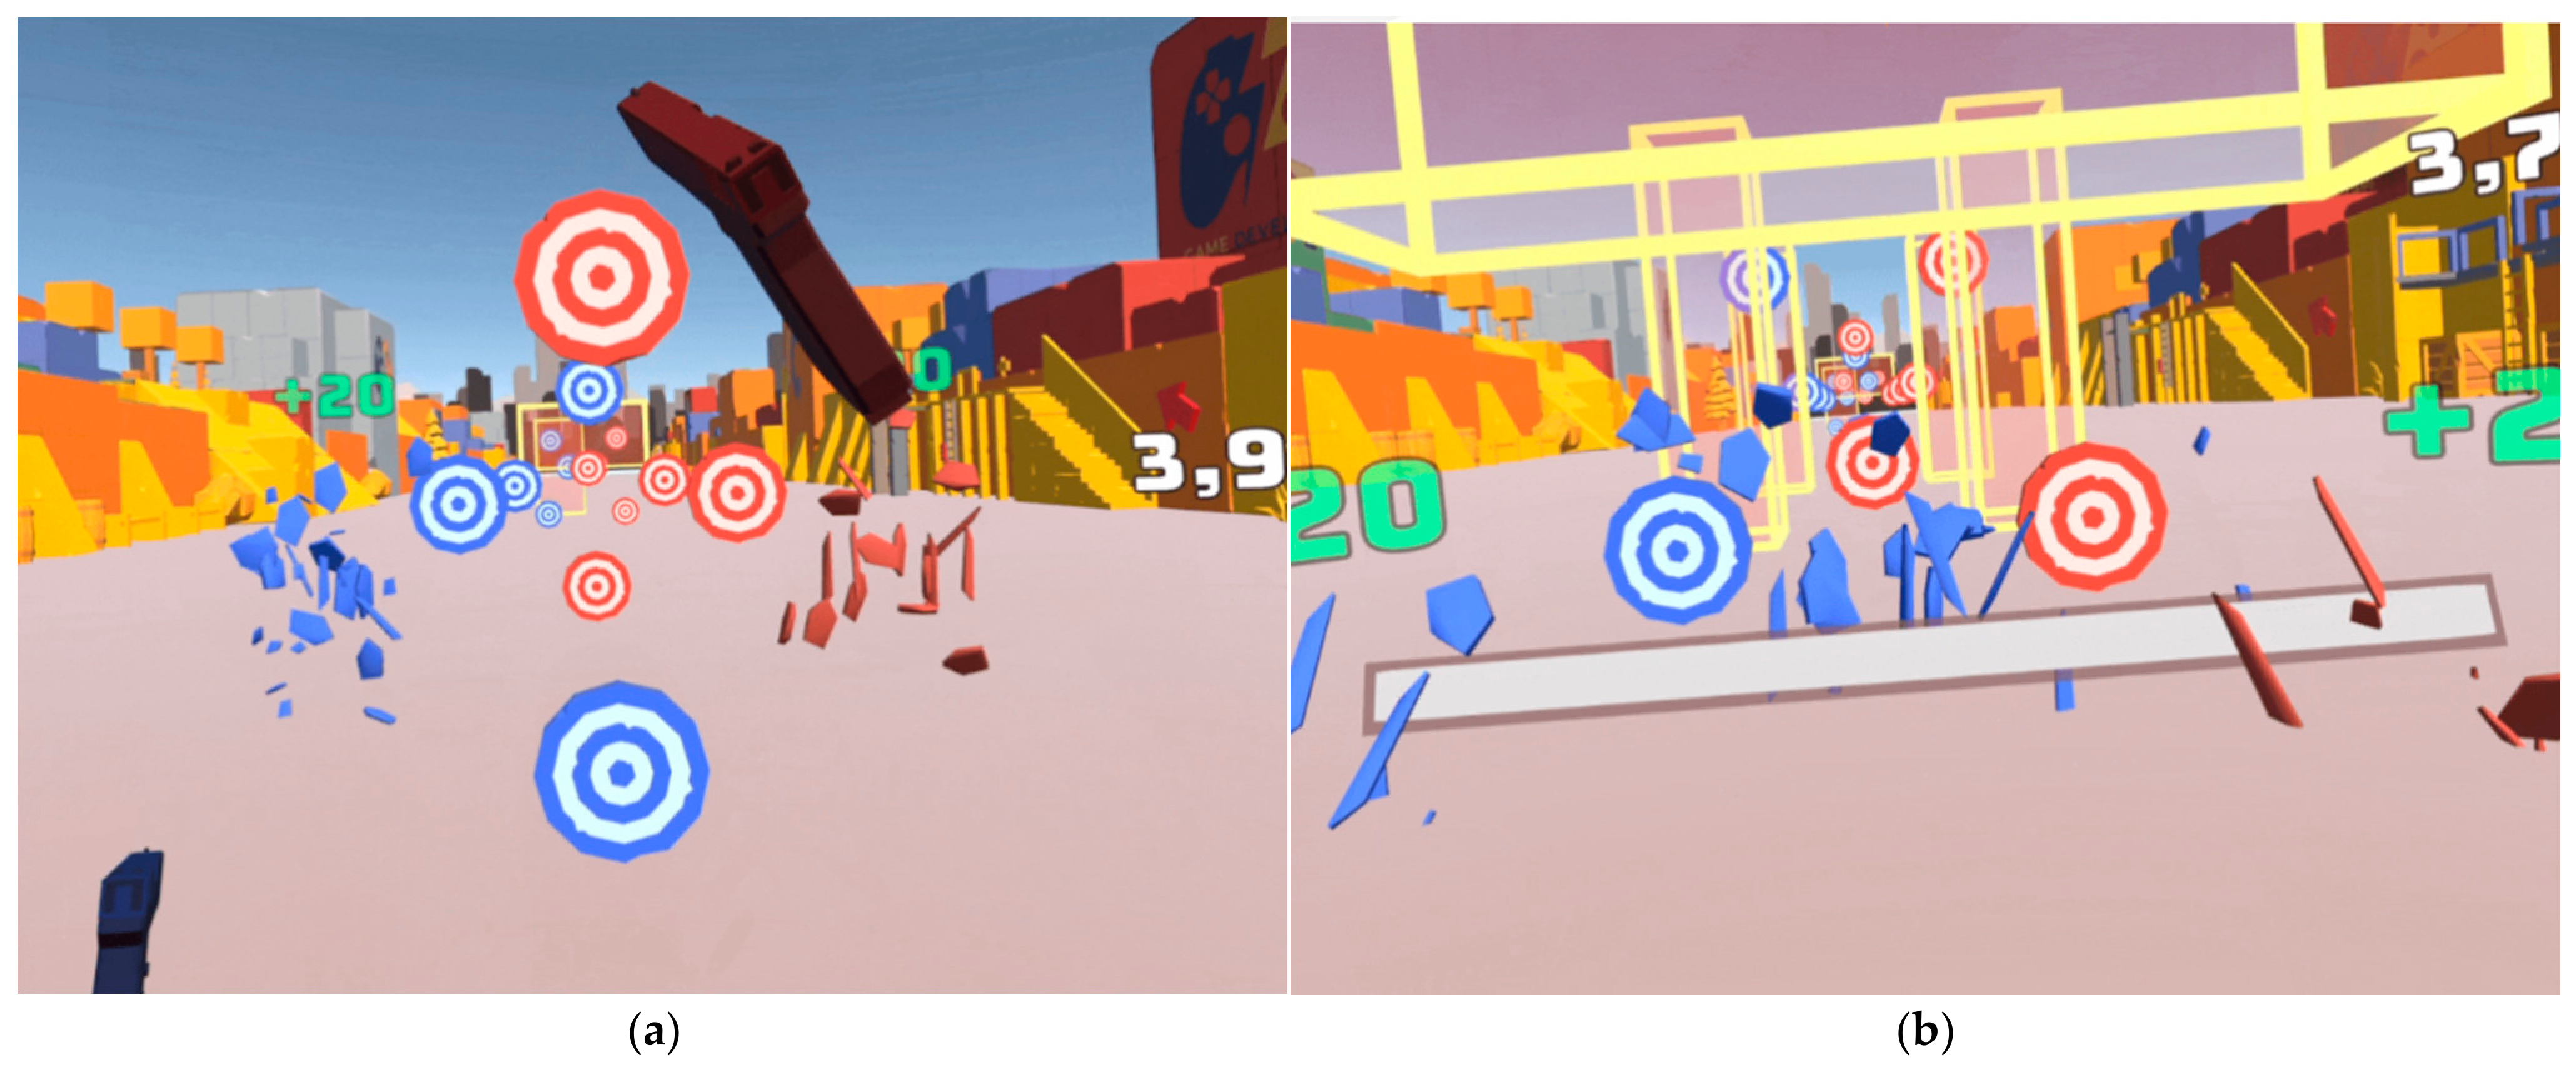
The player uses two virtual pistols, one firing red projectiles, and the other firing blue projectiles. Either the trigger or the grip button can be used to fire the corresponding pistol. Red and blue targets appear at different horizontal and vertical positions in front of the player. Some targets remain stationary, whereas others move horizontally or vertically along predefined paths. Projectiles follow a slightly curved trajectory under reduced gravity. Hitting a target awards 10 points, and the reward increases to 20 when the projectile and target colors match. A successful hit removes the target regardless of color. Targets that pass the player without being hit are registered as missed. The shooting is also combined with physical obstacle avoidance. Approaching walls contain openings that require the player to step to the left, step to the right, or crouch. Wall contact is detected using the position of the VR headset. Additionally, contact produces a visual warning overlay and an accompanying sound.
Figure 2 presents representative screenshots from the Pulse Run VR environment and active gameplay.
Player status is represented through a stability meter initialized at 100 points. Missing a target removes 5 stability points and contact with a wall reduces stability continuously at a rate of 35 points per second. Each successful target hit restores one stability point. Reaching zero stability, however, does not end the run, allowing participants who complete the game to receive the gameplay duration. The UI displays the current score and remaining stability during gameplay, supported by score popups, target-breaking effects, firing sounds, and warning feedback.
Gameplay content is organized into reusable patterns containing predefined arrangements of targets, moving target paths, and wall obstacles. During play, a queue of patterns is maintained in front of the player. Each new pattern is positioned after the preceding pattern according to its length and current gap between patterns. All active patterns move toward the player at a shared scrolling speed. Patterns that pass behind the player are removed and replaced, creating a continuous sequence assembled from the available pattern library. Each pattern was assigned to one of five overall difficulty tiers: Very Easy, Easy, Medium, Hard, or Expert. Additionally, each pattern was also assigned to a separate aiming, movement, and color difficulty rating, used later by the Skill-Specific DDA strategy. When a new pattern is required, the active progression strategy determines which patterns are currently compatible. One pattern is then selected from the compatible set using weighted random selection, with immediate repetition of the same pattern prevented whenever another compatible option is available. The complete difficulty model and the rules used by each progression strategy are further presented in
Section 3.3.
3.3. Difficulty Progression Strategies
The three difficulty progression strategies controlled three aspects of the generated course: pattern scroll speed, the gap between consecutive patterns, and which patterns could spawn. Elapsed progress was normalized as
where
represents elapsed gameplay time and
represents the total run duration.
Each authored pattern was assigned an overall difficulty category from 1 to 5, corresponding to Very Easy, Easy, Medium, Hard, and Expert. Patterns received separate ratings on the same scale for aiming, movement, and color-matching difficulty. The overall category represented the combined difficulty of the pattern. The separate ratings described the demands placed on each gameplay skill and were used by the Skill-Specific DDA strategy.
At each spawn event, the active strategy determined the permitted overall difficulty range and any mechanic-specific restrictions. A pattern was then selected from the compatible set using its assigned probability weight. Immediate repetition of the preceding pattern was prevented when another compatible pattern was available. If filtering produced no compatible pattern, the spawner selected a pattern from the closest lower overall difficulty category. A final unrestricted fallback prevented the pattern queue from being interrupted if no lower-category pattern was available.
Both adaptive strategies evaluated recent gameplay using a 15 s rolling window, following a 12 s warm-up period, with adaptation updates performed every 2 s.
3.3.1. Fixed Time-Based Progression
Fixed Time-Based Progression served as a nonadaptive baseline. Scroll speed, pattern gap, and eligible pattern categories were determined solely by elapsed time. Player performance had no effect on the progression. Scroll speed increased from 2.0 to 5.5 m/s, and the gap between patterns decreased from 3.0 to 2.2 m. Both values followed a smooth ease-in and ease-out curve E(p):
where
represents the current scroll speed and
represents the current pattern gap.
The range of patterns permitted to spawn changed at five predefined points in the run, as shown in
Table 1.
The exact sequence could differ between participants through weighted pattern selection. The permitted difficulty range, scroll speed, and pattern gap followed the predetermined schedule in every run associated with this strategy.
3.3.2. Performance-Based DDA
Performance-Based DDA maintained a single global estimate of player performance. This estimate adjusted scroll speed, pattern gap, and the range of patterns permitted to spawn. Performance was calculated from gameplay events recorded during the previous 15 s. Adaptation began after a 12 s warm-up period and was evaluated every 2 s. An evaluation required at least four resolved targets, six projectiles fired, or 0.15 s of wall contact within the current window.
The global performance score
combined target hit rate
, shot accuracy
, movement safety
and normalized remaining stability
:
Target hit rate represented the proportion of resolved targets that were successfully hit. Shot accuracy represented successful hits divided by all projectiles fired. Normalized stability represented current stability divided by its maximum value.
Movement safety was derived from wall-contact duration and wall-related stability loss. A wall-contact ratio of 3% or lower represented safe movement, and a ratio of 12% or higher represented poor movement performance. Wall-related stability-loss rates between 0.5 and 4 stability points per second were mapped across the same range. The larger of the two resulting movement penalties determined the movement-safety value.
The target global performance score was 0.75. A dead zone of ±0.08 prevented small variations from changing the strategy. Scores from 0.67 to 0.83 produced no adjustment. Scores outside this interval modified an adaptive progress offset (a). The base adaptation step was 0.025 and was scaled according to the distance between the current and target scores. Negative adjustments were multiplied by 1.5, permitting difficulty reductions to occur faster than difficulty increases. The offset was restricted to:
The offset was then added to normalized elapsed progress to obtain effective progress:
Effective progress determined which overall pattern categories were permitted to spawn, as shown in
Table 2.
Negative offsets were applied in full to pattern eligibility, scroll speed, and pattern gap. Positive offsets were applied in full to pattern eligibility and at half strength to speed and gap progression. At the maximum positive offset, the endpoint of the scroll-speed curve increased from 5.5 to 7.0 m/s, and the endpoint of the pattern-gap curve decreased from 2.2 to 1.9 m.
Expert patterns remained subject to extra restrictions. They could become eligible only after effective progress reached 0.82. At least 75% of the run had to have elapsed, the adaptive offset had to be at least 0.08, the latest global performance score had to be at least 0.72, and the latest evaluation could not have been classified as an emergency.
A temporary recovery response was activated when the wall-contact ratio reached 12%, wall-related stability loss reached 4 stability points per second, or remaining stability fell to 35% or less. A global performance score of 0.57 or lower also started the recovery period. Recovery remained active for 8 s and restricted pattern selection to Very Easy, Easy, and Medium patterns. An emergency activation immediately decreased the adaptive offset by 0.05 and suppressed positive speed and gap adaptation during the recovery period.
3.3.3. Skill-Specific DDA
Skill-Specific DDA maintained separate performance estimates for aiming, physical movement, and color matching. Scroll speed and pattern gap followed the predetermined curves defined for Fixed Time-Based Progression in
Section 3.3.1. Player performance modified pattern eligibility only. Performance was calculated from gameplay events recorded during the previous 15 s. Adaptation began after a 12 s warm-up period and was evaluated every 2 s.
Aiming performance
, movement performance
, and color-matching performance
were calculated as:
where
,
,
, and
represent target hit rate, shot accuracy, movement safety, and normalized remaining stability, respectively. These measures followed the definitions used for Performance-Based DDA.
represents the proportion of successful hits made using a projectile whose color matched the target.
Aiming performance was updated when the rolling window contained at least four resolved targets or six fired projectiles. Color-matching performance was updated after at least three targets had been hit. Movement performance was evaluated at every adaptation interval.
Each skill had a target score of 0.70. A dead zone of ±0.08 prevented small variations from changing the corresponding skill offset. Scores from 0.62 to 0.78 produced no adjustment. Scores outside this interval modified one of three independent adaptive offsets:
,
, or
. The offsets were restricted to
where
represents aiming, movement, or color matching. The base adaptation step was 0.03 and was scaled according to the distance between the current skill score and its target. Negative aiming and movement adjustments were multiplied by 1.5, permitting their difficulty reductions to occur faster than their increases. Negative color-matching adjustments were multiplied by 1.25.
The movement dead zone was overridden when the wall-contact ratio reached 12%, wall-related stability loss reached 4 stability points per second, or remaining stability fell to 35% or less. Each evaluation meeting one of these conditions immediately reduced the movement offset by twice the base adaptation step:
This reduction remained subject to the minimum offset of −0.30.
For each skill
, effective skill progress was calculated as
where
represents normalized elapsed progress and
represents aiming, movement, or color matching. Effective skill progress below 0.18 permitted mechanic-specific difficulty ratings up to 2. The maximum permitted rating increased to 3 at an effective progress of 0.18 and to 4 at 0.38. The mechanic-specific cap increased to 5 only when effective skill progress reached at least 0.75 and the shared Expert gate was open. This gate required elapsed progress of at least 0.75, at least one of the three skill offsets to be 0.08 or higher, and the most recently calculated aiming and movement scores to each be at least 0.68.
The weakest effective skill-progress value was calculated as
This value controlled the minimum permitted overall difficulty category. Very Easy patterns remained eligible when was below 0.38. The minimum category increased to Easy when reached 0.38. If reached 0.65, the minimum category remained Easy until elapsed progress reached 0.70, after which it increased to Medium.
The maximum permitted overall difficulty category followed elapsed progress. Easy was the maximum category when was below 0.18. The maximum increased to Medium at and to Hard at . Expert patterns remained ineligible before . From onward, Expert became the maximum category only when the shared Expert gate was open. Hard remained the maximum when its requirements were not satisfied.
At each spawn event, a pattern was considered compatible when its overall difficulty category fell between the current minimum and maximum categories and none of its aiming, movement, or color difficulty ratings exceeded the corresponding mechanic-specific cap. The overall category range and the three skill caps were applied together. This permitted participants with different performance profiles to receive different pattern combinations. For example, strong aiming performance combined with weaker obstacle avoidance could permit patterns with greater aiming demands while continuing to exclude patterns with movement demands above the participant’s current movement cap.
3.4. Experimental Setup and Procedure
Data collection took place in university laboratories using two Meta Quest 3 headsets and one Meta Quest 2 headset with their corresponding controllers. Pulse Run VR ran directly on each headset as a standalone application, without a connected computer. The same gameplay content, progression logic, session timing, and data-collection functions were used across all devices. The Quest 3 version used a render scale of 1.25 and 8× multisample anti-aliasing, whereas the Quest 2 version used a render scale of 1.0 and 4× multisample anti-aliasing to maintain acceptable performance. Both versions used a 72 Hz refresh rate.
All participants played the game while standing in a cleared play area that allowed them to step laterally and crouch. Before participants played, the researchers demonstrated a test run. The demonstration covered firing the two pistols, matching projectile and target colors, avoiding walls through physical movement, and interacting with the in-game interface. Participants were also shown how to select their age and previous VR experience, which controller inputs to use, and how to provide the post-run feedback.
The participants were told that the game would increase in difficulty as they played, however, they were not informed about the three progression strategies, the presence of performance-based adaptation, or which strategy they received.
After putting on the headset and selecting their age and previous VR experience, each participant was assigned one of the three strategies through Round-Robin Strategy Allocation. A 10 s calibration phase sampled the vertical position of the headset and adjusted the height of the gameplay patterns and interface elements for that participant.
Participants then completed a short interactive tutorial covering a shooting task and a wall-avoidance task. During the tutorial, patterns would stop moving until the participant performed the required action. Tutorial score and stability changes were reset before the recorded gameplay phase.
Each participant completed one full playthrough lasting 210 s. At the end of the run, the final score was displayed, followed by a feedback interface to their right. Participants rated the perceived difficulty, enjoyment, and frustration of the session on a five-point scale and reported whether they had experienced motion sickness. All participant information, gameplay measurements, and post-run responses were collected and stored within the application.
After the participant completed the feedback questionnaire, the supervising researcher held the A and B buttons on the right-hand controller for 5 s to activate an operator’s reset shortcut. The shortcut saved the current run, including the post-run responses, advanced the Round-Robin sequence to the next strategy, and reloaded the scene. The application then returned to the participant setup interface, ready for the next session. The saved records contained session-level aggregates rather than timestamped histories of controller evaluations, performance estimates, adaptive offsets, or recovery states.
3.5. Data Collection
Study data were collected entirely within Pulse Run VR. Participant characteristics and post-run responses were entered through the in-game interfaces, and gameplay telemetry was recorded automatically. Telemetry collection began at the start of the recorded gameplay phase, after tutorial completion, and ended when the run finished. Event-based measurements were updated throughout the session.
The participant and session variables retained for analysis comprised age, self-reported previous VR experience, assigned progression strategy, and actual run duration. Each participant and gameplay run received an automatically generated identifier. Run duration was retained to identify incomplete sessions and normalize time-dependent measures.
Gameplay performance data included final score, shots fired, targets hit, targets missed, correct-color hits, and wrong-color hits. Wall-contact duration and total time spent at zero stability were recorded to represent obstacle-avoidance performance and stability failure. These measurements were used to calculate the normalized scoring efficiency, target hit rate, shot accuracy, color-match rate, wall-contact percentage, and the percentage of the run spent at zero stability, as described in
Section 3.6.
The difficulty delivered during each session was characterized using the maximum scroll speed reached, minimum pattern gap reached, total number of patterns spawned, and number of spawned patterns belonging to each overall difficulty tier. The tier counts covered Very Easy, Easy, Medium, Hard, and Expert patterns. These values permitted analysis of the spawned pattern composition and the proportion of patterns classified as Hard or Expert.
After each run, participants provided three ratings using five-point scales. Perceived difficulty ranged from 1, “Much too easy,” to 5, “Much too difficult.” Enjoyment ranged from 1, “Not enjoyable,” to 5, “Extremely enjoyable,” and frustration ranged from 1, “Not frustrating,” to 5, “Extremely frustrating.” Participants provided a binary response indicating whether they experienced motion sickness during the session.
Each saved run was appended to a JSON log stored locally on the headset. The gameplay telemetry, participant characteristics, assigned strategy, and post-run responses were saved within the same record, with numeric values rounded to three decimal places. No names, contact information, audio recordings, video recordings, or continuous tracking trajectories were collected. The application recorded further diagnostic telemetry that was not included in the statistical analysis.
3.6. Data Processing and Statistical Analysis
Separate JSON logs were exported from each headset after data collection. Each log contained a runs array holding the saved gameplay records. The runs arrays from these logs were merged into one consolidated dataset and converted into a table structure with one row per saved run. Headset model and session type were assigned during manual review. Internal algorithm identifiers were mapped to Fixed Time-Based Progression, Performance-Based DDA, and Skill-Specific DDA. For validation, duplicate run identifiers, repeated participant identifiers, consent status, tutorial completion, gameplay duration, questionnaire ranges, score calculations, and strategy labels were checked. The source JSON files remained unchanged.
The primary analysis was restricted to sessions conducted using Meta Quest 3, since relatively few participant sessions were conducted using Quest 2. This also ensured that the headset model and rendering settings remained consistent across the analyzed sessions. A run qualified for the primary analysis when it belonged to a recruited high-school or university student, contained recorded consent, followed a completed tutorial, used one of the three recognized strategies, and contained at least 209 s of active gameplay data. Known researcher tests, staff or demonstration sessions, informal play, interrupted runs, corrupted records, and duplicate run identifiers were excluded.
To assess whether the headset restriction affected the findings, a separate sensitivity analysis retained all otherwise eligible participant sessions conducted using Meta Quest 2 or Meta Quest 3. This analysis repeated the comparisons for the five primary outcomes using the same omnibus tests and Holm correction. It did not replace the Meta Quest 3 primary analysis.
When multiple attempts were recorded for the same participant, the first valid attempt was retained. A later attempt replaced it only when the earlier attempt ended through a documented interruption or technical failure. Missing questionnaire responses excluded a record only from analyses involving the missing response. Gameplay telemetry from the same session remained eligible. Missing values were not imputed, and valid participant sessions were not removed based on unusually high or low outcome values.
All analyzed percentages were recalculated from the raw counts and durations rather than taken from the percentage fields stored by the application. Time-based measures used the run duration directly. A resolved target was defined as a target that was either hit or registered as missed. The derived measures and their calculations are presented in
Table 3.
In the equations below, represents the final score, the number of targets hit, the number of targets missed, the number of projectiles fired, and the number of correct-color hits. represents run duration, represents wall-contact duration, and represents time spent at zero stability. , , and represent the numbers of Hard patterns, Expert patterns, and total patterns spawned. represents the participant’s perceived difficulty rating.
The normalized target score represented the percentage of the maximum score obtainable across all resolved targets, with 20 points being the maximum score for each target. Final score and normalized target score were interpreted together. Final score represented the outcome displayed to the player. The normalized measure accounted for differences in the number of targets encountered under each strategy. Target hit rate, shot accuracy, and color-match rate provided separate measures of shooting performance.
Wall-contact percentage represented obstacle-avoidance performance. Zero-stability percentage represented the proportion of active gameplay spent in a failure state. Perceived difficulty suitability was evaluated using the absolute deviation from the scale midpoint. A difficulty-rating midpoint deviation of 0 represented the intended midpoint response, 1 represented a one-point deviation, and 2 represented a two-point deviation. The original difficulty responses were retained to distinguish runs perceived as too easy from those perceived as too difficult.
The Hard/Expert pattern proportion was the primary content delivery outcome. Total patterns spawned and resolved target count were treated as secondary exploratory outcomes. Maximum scroll speed, minimum pattern gap, and the complete spawned-pattern category distribution were reported descriptively. Pattern counts described spawned content and could include patterns queued shortly before the session ended.
Enjoyment and frustration were analyzed using their original five-point responses. Difficulty-rating midpoint deviation was used for inferential comparisons, while raw perceived-difficulty ratings were retained for descriptive reporting. Motion sickness was summarized using the number and percentage of sessions containing an affirmative response. The remaining sessions were not described as explicit negative responses since “No” was the interface default.
Participant age was summarized using the mean, standard deviation, and observed range. Previous VR experience was reported using counts and percentages. Continuous outcomes were summarized for each strategy using means, standard deviations, and 95% confidence intervals. Median and interquartile range were included for visibly skewed measures. Ordinal outcomes were reported using response frequencies, percentages, medians, and interquartile ranges. Distribution plots displayed the individual participant observations.
Approximately continuous gameplay and content delivery outcomes were compared across the three independent progression strategies using one-way Welch analyses of variance. Difficulty-rating midpoint deviation, enjoyment, frustration, and zero-stability percentage were compared using Kruskal–Wallis tests.
The five primary outcomes were normalized target score, wall-contact percentage, Hard/Expert pattern proportion, difficulty-rating midpoint deviation, and enjoyment. Holm correction was applied across the five primary omnibus comparisons. Secondary exploratory outcomes comprised final score, target hit rate, shot accuracy, color-match rate, zero-stability percentage, total patterns spawned, resolved targets, and frustration. Their omnibus p-values were reported without cross-outcome adjustment. Maximum scroll speed, minimum pattern gap, the complete spawned-pattern category distribution, raw difficulty-rating distributions, and motion-sickness responses were reported descriptively.
Pairwise comparisons were conducted for a primary outcome only when its Holm-adjusted omnibus p-value was significant. Secondary exploratory outcomes received pairwise comparisons when their unadjusted omnibus p-value was significant. Games–Howell comparisons followed Welch ANOVA, and Dunn comparisons with Holm-adjusted p-values followed Kruskal–Wallis tests. Pairwise comparisons were not performed following nonsignificant omnibus results.
Effect sizes were reported with the significance tests. Welch ANOVA results included eta-squared, with Hedges’ g used for pairwise effects. Kruskal–Wallis results included epsilon-squared, with Cliff’s delta used for pairwise effects. Pairwise effect sizes were accompanied by 95% confidence intervals estimated using the percentile bootstrap with 5000 resamples. All statistical tests were two-sided and used α = 0.05. Group distributions, residual Q–Q plots, and influential observations were inspected before inference. Participant records were not removed solely to improve statistical assumptions. All data processing, statistical analyses, and visualizations were performed in Python 3.12.10 using NumPy 2.5.1, pandas 2.3.3, SciPy 1.18.0, and Matplotlib 3.11.1.
4. Results
This section reports the results for the three difficulty progression strategies. It begins with data screening and participant characteristics, followed by pacing and spawned pattern composition, gameplay performance, and post-run ratings. Descriptive statistics, inferential tests, confidence intervals, and effect sizes are reported where applicable. Interpretation of the findings is reserved for
Section 5.
4.1. Data Screening and Participant Characteristics
A total of 38 saved runs were exported from the study headsets. Four nonparticipant runs generated during researcher, staff, demonstration, or informal use were excluded. Six otherwise eligible Meta Quest 2 sessions were excluded from the primary analysis. No runs were excluded as interrupted or incomplete sessions, duplicate or invalid records, or for other eligibility reasons. The final Meta Quest 3 sample comprised 28 participants: 7 assigned to Fixed Time-Based Progression, 10 to Performance-Based DDA, and 11 to Skill-Specific DDA. Complete post-run difficulty, enjoyment, and frustration responses were available for all 28 participants.
Participant characteristics by difficulty progression strategy are presented in
Table 4. Participants were between 16 and 26 years old, with a mean age of 19.2 years (SD = 2.7). Mean age ranged from 18.7 to 19.8 years across the three strategies. In the complete sample, 12 participants (42.9%) reported no previous VR experience, 13 (46.4%) reported some previous VR experience, and 3 (10.7%) reported high previous VR experience. Previous VR experience was unevenly distributed across strategies. Participants with no previous VR experience represented 71.4% of the Fixed Time-Based Progression group, compared with 40.0% of the Performance-Based DDA group and 27.3% of the Skill-Specific DDA group.
4.2. Pacing and Spawned Pattern Composition
Pacing and spawned pattern outcomes are presented in
Table 5. The mean participant-level proportion of Hard and Expert patterns was 41.0% (SD = 6.7) for Fixed Time-Based Progression, 27.4% (SD = 10.9) for Performance-Based DDA, and 28.7% (SD = 7.1) for Skill-Specific DDA. A statistically significant difference was found across strategies, Welch’s F(2, 15.32) = 8.07, Holm-adjusted
p = 0.020,
η2 = 0.33. Games–Howell comparisons showed that Fixed Time-Based Progression produced 13.7 percentage points more Hard/Expert patterns than Performance-Based DDA, 95% CI [2.6, 24.8],
p = 0.016, Hedges’
g = 1.38, 95% CI [0.85, 2.88], and 12.3 percentage points more than Skill-Specific DDA, 95% CI [3.7, 21.0],
p = 0.006, Hedges’
g = 1.70, 95% CI [0.99, 2.97]. Performance-Based DDA and Skill-Specific DDA did not differ significantly,
p = 0.941.
The mean number of patterns spawned was 41.1 (SD = 0.9) for Fixed Time-Based Progression, 41.1 (SD = 5.5) for Performance-Based DDA, and 40.5 (SD = 0.5) for Skill-Specific DDA. No statistically significant evidence of a strategy difference was found, Welch’s F(2, 11.79) = 1.23, p = 0.326, η2 = 0.01. Mean resolved target counts were 314.0 (SD = 16.7), 282.0 (SD = 58.9), and 289.8 (SD = 14.3), respectively. This exploratory comparison was statistically significant, Welch’s F(2, 13.65) = 5.09, p = 0.022, η2 = 0.11. Games–Howell testing identified one significant pairwise difference: Fixed Time-Based Progression produced 24.2 more resolved targets than Skill-Specific DDA, 95% CI [3.6, 44.7], p = 0.022, Hedges’ g = 1.51, 95% CI [0.64, 3.04]. The remaining pairwise comparisons were not statistically significant.
All Fixed Time-Based Progression and Skill-Specific DDA sessions reached a maximum scroll speed of 5.50 m/s and a minimum pattern gap of 2.20 m. Performance-Based DDA reached a mean maximum speed of 5.93 m/s (SD = 0.74) and a mean minimum gap of 2.12 m (SD = 0.16). These pacing outcomes were reported descriptively.
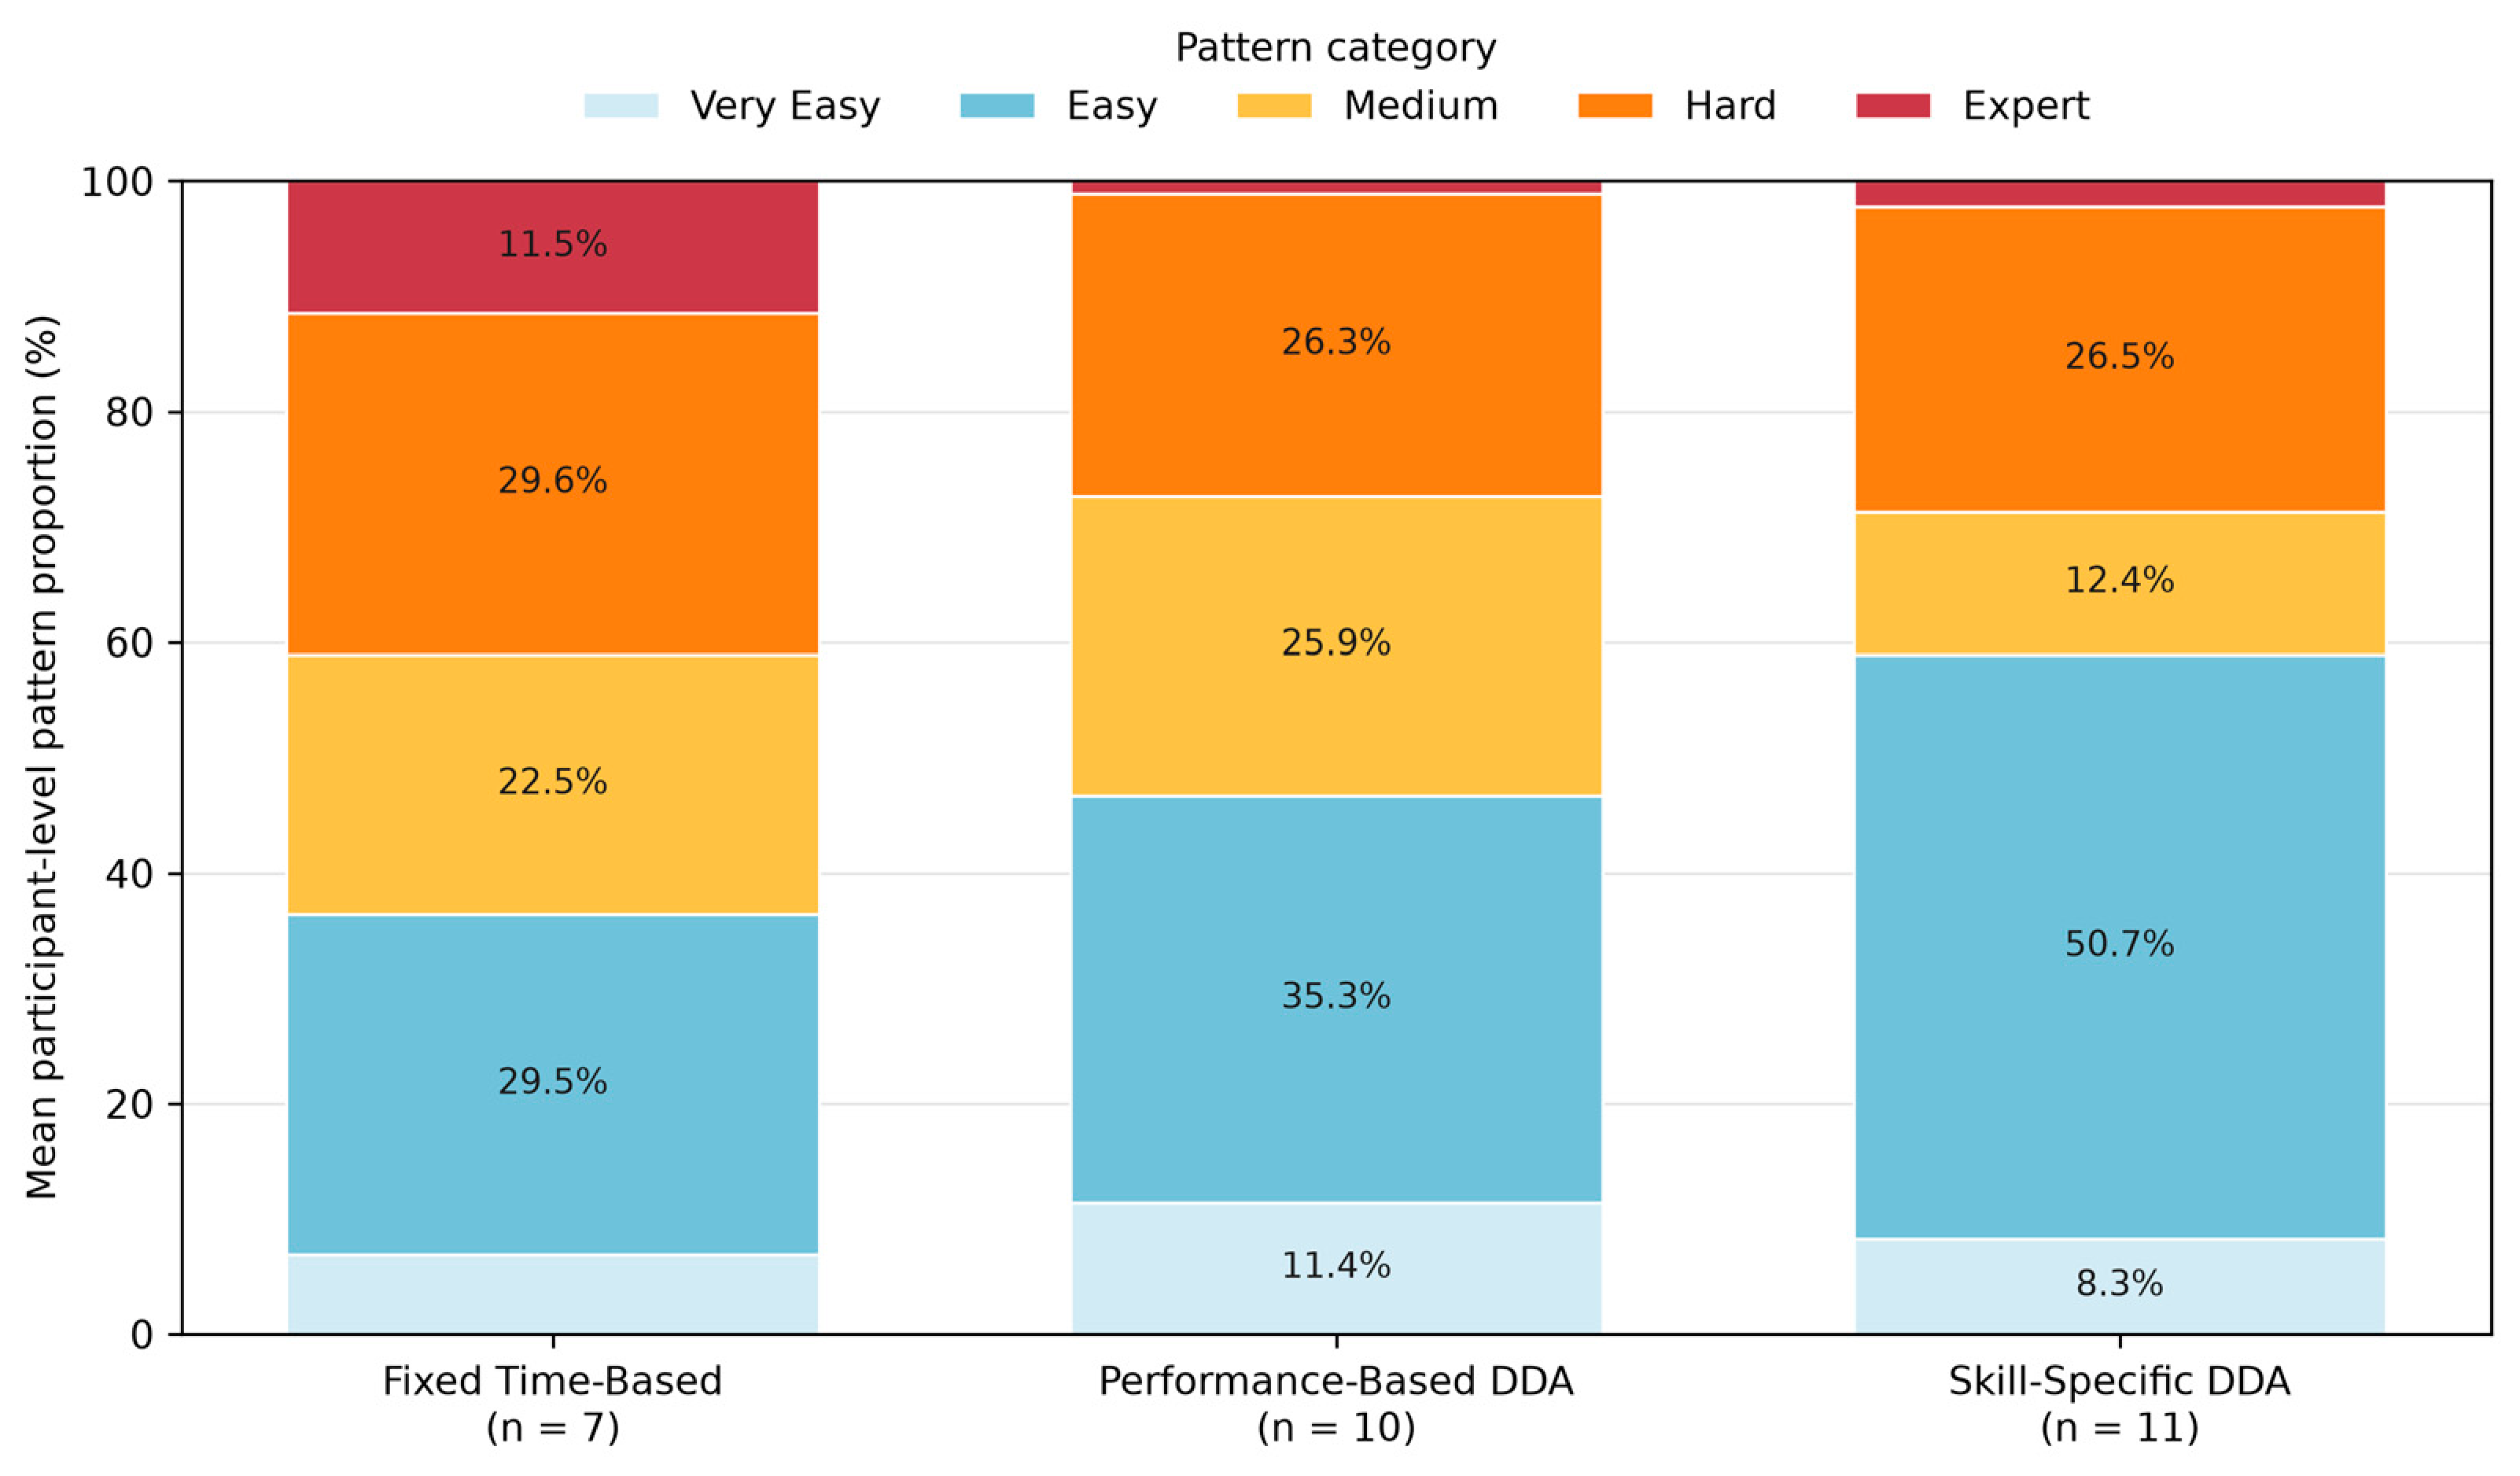
The complete participant-level mean pattern composition is shown in
Figure 3. Hard patterns represented 29.6%, 26.3%, and 26.5% of spawned patterns for Fixed Time-Based Progression, Performance-Based DDA, and Skill-Specific DDA, respectively. Expert patterns represented 11.5%, 1.1%, and 2.2%. Skill-Specific DDA produced the largest proportion of Easy patterns (50.7%) and the smallest proportion of Medium patterns (12.4%).
4.3. Gameplay Performance
Gameplay performance outcomes are presented in
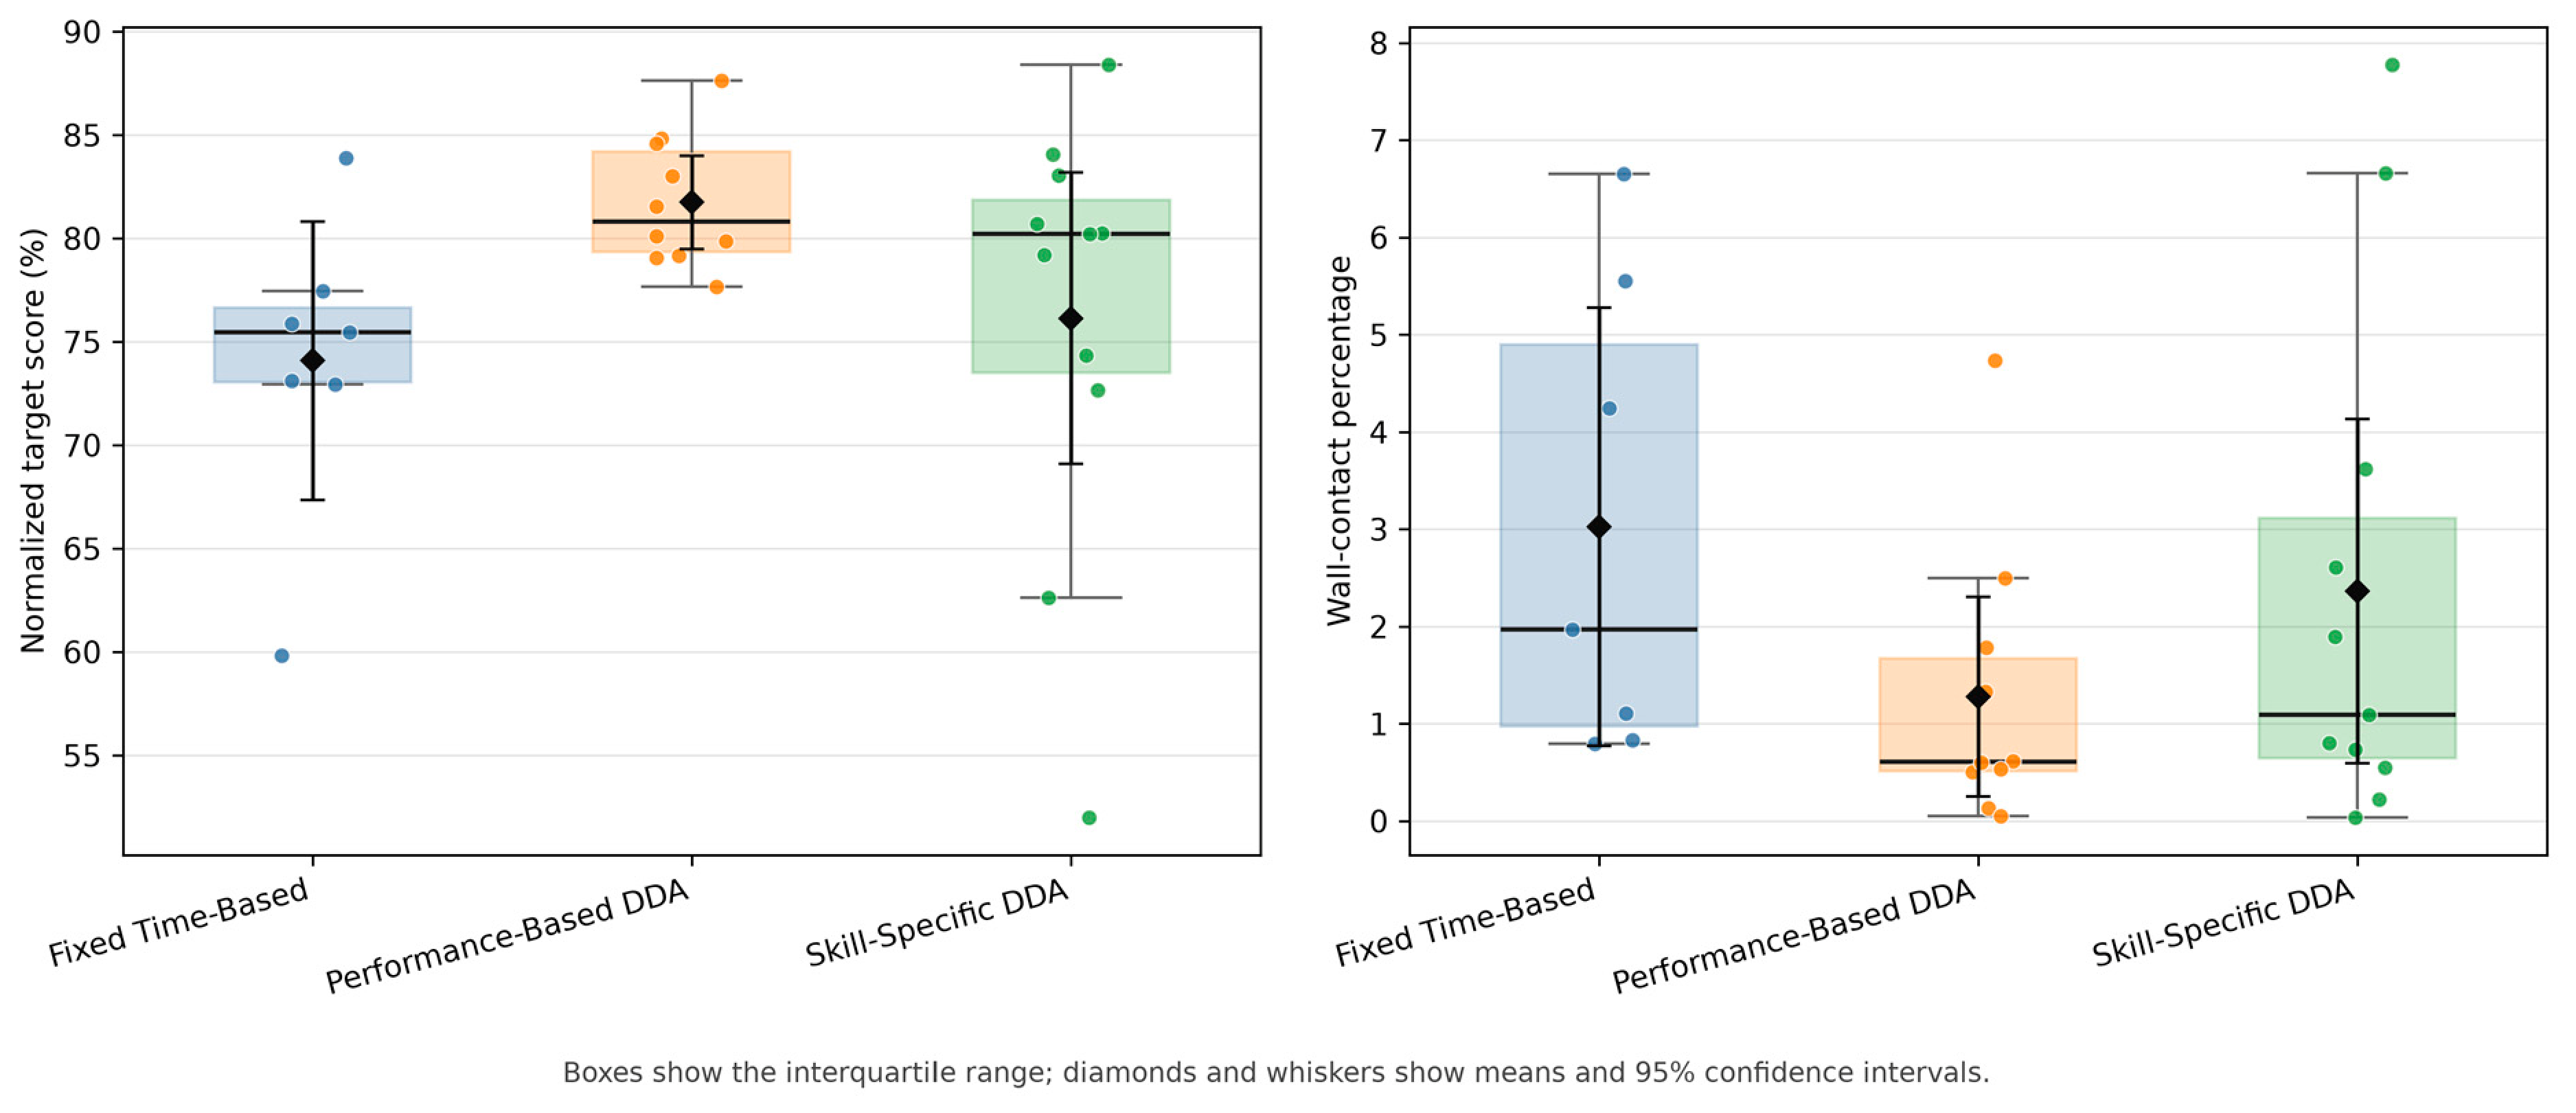
Table 6. The mean normalized target score was 74.1% (SD = 7.3) for Fixed Time-Based Progression, 81.7% (SD = 3.2) for Performance-Based DDA, and 76.1% (SD = 10.5) for Skill-Specific DDA. No statistically significant evidence of a strategy difference remained after Holm correction, Welch’s F(2, 12.06) = 4.20, Holm-adjusted
p = 0.165,
η2 = 0.16. Mean wall-contact percentages were 3.0% (SD = 2.4), 1.3% (SD = 1.4), and 2.4% (SD = 2.6), respectively. No statistically significant evidence of a strategy difference was found for this outcome, Welch’s F(2, 13.58) = 1.71, Holm-adjusted
p = 0.596,
η2 = 0.10. Participant-level distributions for both primary performance outcomes are shown in
Figure 4.
Mean final scores were 4655.7 (SD = 546.2) for Fixed Time-Based Progression, 4606.0 (SD = 929.8) for Performance-Based DDA, and 4422.7 (SD = 691.6) for Skill-Specific DDA. The exploratory comparison found no statistically significant evidence of a strategy difference, Welch’s F(2, 15.99) = 0.32, p = 0.729, η2 = 0.02. Mean target hit rates were 84.4% (SD = 7.7), 87.0% (SD = 3.8), and 84.4% (SD = 13.1), respectively. No statistically significant evidence of a difference was found, Welch’s F(2, 12.39) = 0.46, p = 0.641, η2 = 0.02.
Mean shot accuracy was 32.0% (SD = 16.3) for Fixed Time-Based Progression, 48.2% (SD = 20.4) for Performance-Based DDA, and 36.2% (SD = 17.0) for Skill-Specific DDA. The strategy comparison was not statistically significant, Welch’s F(2, 15.36) = 1.71, p = 0.214, η2 = 0.13. Mean color-match rates were 75.8% (SD = 12.6), 88.2% (SD = 9.0), and 81.2% (SD = 8.9), respectively. No statistically significant evidence of a strategy difference was found, Welch’s F(2, 13.90) = 2.89, p = 0.089, η2 = 0.21.
The median zero-stability percentage was 2.7% [IQR: 0.7–6.8] for Fixed Time-Based Progression, 0.2% [IQR: 0.0–1.6] for Performance-Based DDA, and 1.4% [IQR: 0.2–4.7] for Skill-Specific DDA. No statistically significant evidence of a strategy difference was found, H(2) = 2.16, p = 0.339, ε2 = 0.01. No pairwise comparisons were conducted because none of the gameplay performance omnibus tests met the applicable significance criterion.
4.4. Post-Run Ratings
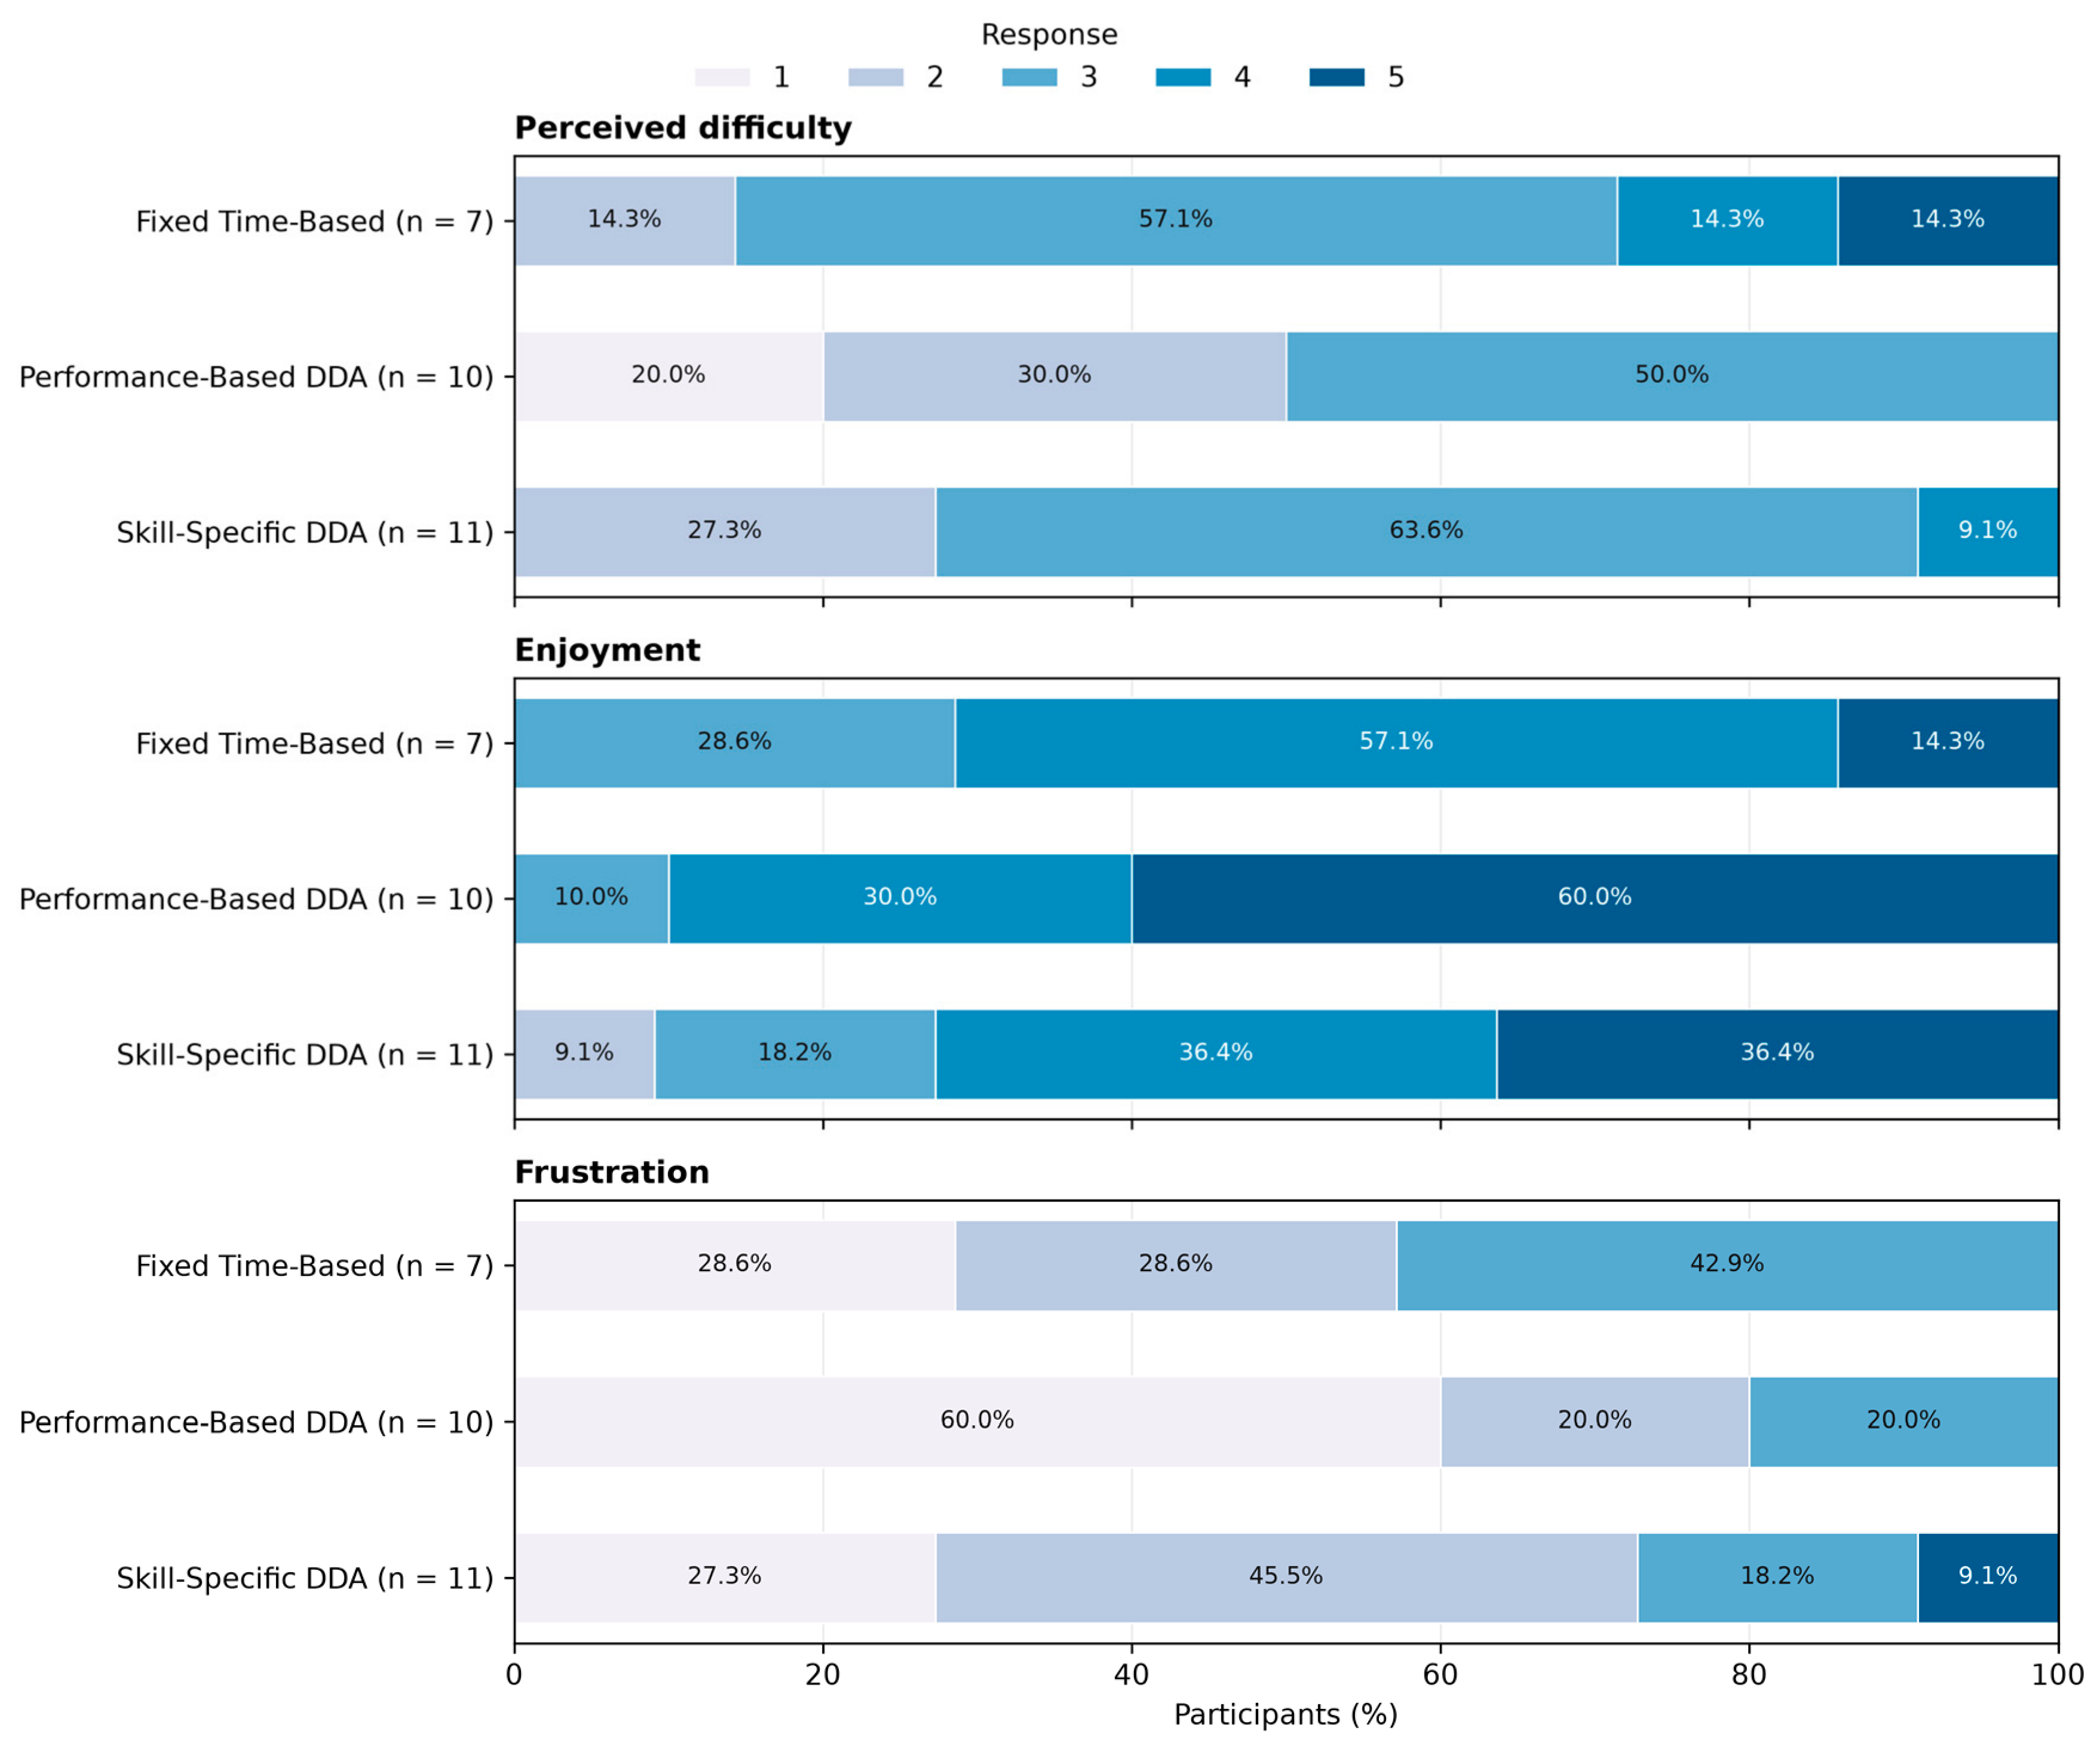
Post-run responses are presented in
Table 7, with the complete rating distributions shown in
Figure 5. Median perceived-difficulty ratings were 3.0 [IQR: 3.0–3.5] for Fixed Time-Based Progression, 2.5 [IQR: 2.0–3.0] for Performance-Based DDA, and 3.0 [IQR: 2.5–3.0] for Skill-Specific DDA. The midpoint rating of 3 was the most frequent response in each group, selected by 57.1%, 50.0%, and 63.6% of participants, respectively. Ratings below the midpoint accounted for 14.3%, 50.0%, and 27.3% of responses. Ratings above the midpoint accounted for 28.6%, 0.0%, and 9.1%.
Median absolute deviations from the difficulty midpoint were 0.0 [IQR: 0.0–1.0] for Fixed Time-Based Progression, 0.5 [IQR: 0.0–1.0] for Performance-Based DDA, and 0.0 [IQR: 0.0–1.0] for Skill-Specific DDA. No statistically significant evidence of a strategy difference was found, H(2) = 0.85, Holm-adjusted p = 0.655, ε2 = 0.00.
Median enjoyment ratings were 4.0 [IQR: 3.5–4.0], 5.0 [IQR: 4.0–5.0], and 4.0 [IQR: 3.5–5.0], respectively. No statistically significant evidence of a strategy difference remained after Holm correction, H(2) = 3.23, Holm-adjusted p = 0.596, ε2 = 0.05. Median frustration ratings were 2.0 [IQR: 1.5–3.0], 1.0 [IQR: 1.0–2.0], and 2.0 [IQR: 1.5–2.5], respectively. The exploratory comparison found no statistically significant evidence of a strategy difference, H(2) = 2.21, p = 0.331, ε2 = 0.01.
Motion sickness was reported by 5 of the 28 participants (17.9%). Reports were recorded for 2 of 7 participants assigned to Fixed Time-Based Progression (28.6%), 2 of 10 assigned to Performance-Based DDA (20.0%), and 1 of 11 assigned to Skill-Specific DDA (9.1%). No pairwise comparisons were conducted since none of the post-run rating omnibus tests met the applicable significance criterion.
The six additional Quest 2 sessions were evenly distributed across the strategies, with two sessions added to each group. The all-headset sensitivity analysis included 34 eligible participants: 9 assigned to Fixed Time-Based Progression, 12 to Performance-Based DDA, and 13 to Skill-Specific DDA. The strategy difference in Hard/Expert pattern proportion remained statistically significant, Welch’s F(2, 19.46) = 12.92, Holm-adjusted p = 0.001, η2 = 0.37. Normalized target score differed significantly across strategies, Welch’s F(2, 18.25) = 8.30, Holm-adjusted p = 0.011, η2 = 0.25. Performance-Based DDA produced a normalized target score 9.8 percentage points higher than Fixed Time-Based Progression, 95% CI [3.1, 16.4], p = 0.005, Hedges’ g = 1.71, 95% CI [1.07, 2.87]. The remaining primary outcomes were not statistically significant, with Holm-adjusted p-values of 0.551.
5. Discussion and Conclusions
The three progression strategies produced distinct profiles rather than a single winner across all outcomes. Fixed Time-Based Progression delivered the greatest exposure to advanced content: Hard/Expert patterns represented 41.0% of spawned patterns on average, compared with 27.4% for Performance-Based DDA and 28.7% for Skill-Specific DDA. Performance-Based DDA showed favorable descriptive values for normalized target score, shot accuracy, color-match rate, wall-contact percentage, and zero-stability percentage. Skill-Specific DDA produced the highest concentration of perceived-difficulty ratings at the midpoint, with 63.6% of participants selecting 3, corresponding to “just right.” After Holm correction in the Quest 3 sample, Hard/Expert pattern proportion was the sole primary outcome with a statistically significant strategy difference. The findings indicate that delivered content, gameplay performance, and perceived challenge differed across the evaluated strategy profiles. Prior DDA comparisons have reported similar divergence between controller behavior, performance, and player experience [
8,
10,
21].
There is no single controller that made the game the hardest or easiest. Fixed Time-Based Progression generated more Hard and Expert patterns, including a much larger Expert share. Performance-Based DDA could exceed the fixed pacing schedule, reaching a mean maximum speed of 5.93 m/s and a mean minimum gap of 2.12 m. Pattern categories represented demands from aiming, obstacle avoidance, and color selection. Scroll speed and pattern gap controlled temporal pressure and encounter spacing. Research on VR content generation and real-time task assessment has found comparable divergence among objective, performance-based, cognitive, and perceived measures of difficulty [
5,
22]. Difficulty-curve shape can affect motivation [
32], and faster pacing in a VR exergame was associated with greater enjoyment together with higher perceived workload [
33]. Pulse Run’s adaptive strategies can be described as delivering less advanced pattern content, but not as creating uniformly easier sessions.
Performance-Based DDA produced a mean normalized target score of 81.7%, compared with 74.1% under Fixed Time-Based Progression and 76.1% under Skill-Specific DDA. It had the highest mean shot accuracy and color-match rate, plus the lowest mean wall-contact percentage and median zero-stability percentage. The normalized score result did not remain significant after correction in the Quest 3 primary analysis. In the all-headset sensitivity analysis, the overall strategy difference was significant, and Performance-Based DDA exceeded Fixed Time-Based Progression by 9.8 percentage points. The Quest 3 analysis remains primary because it used a common headset model and rendering configuration. The change in inference may reflect the six added participants, headset-related differences, or both. The sensitivity analysis therefore indicates a possible short-term performance difference, although confirmation under standardized hardware is needed. Robb and Zhang found that performance-based DDA improved game performance with no significant differences in enjoyment or flow [
34]. Sharek and Wiebe similarly reported better progression and performance under adaptive gameplay with no reduction in overall affect or self-reported engagement [
35]. Han et al. reported higher performance and significantly more neutral detected emotions under timer-based DDA in an immersive VR exergame, although the performance difference was not statistically significant [
36].
The raw final score did not follow the normalized score pattern. Fixed Time-Based Progression provided more scoring opportunities, with a mean of 314.0 resolved targets compared with 282.0 under Performance-Based DDA and 289.8 under Skill-Specific DDA. Similar final scores could result from different combinations of target availability and performance quality. Normalized target score partly compensated for this variation by expressing the obtained score relative to the maximum available score across resolved targets. It still depended on the task mixture selected by each controller. Current performance changed later difficulty under the adaptive strategies, and later difficulty then affected subsequent performance observations. A common challenge block after the adaptive phase would provide a cleaner controller-independent assessment. The distinction between player evaluation and difficulty adjustment proposed by Guo et al. supports this separation [
8].
The most notable descriptive pattern for Skill-Specific DDA concerned perceived challenge calibration. Seven of 11 participants selected the midpoint difficulty rating. The same response was selected by 4 of 7 participants under Fixed Time-Based Progression and 5 of 10 under Performance-Based DDA. Performance-Based DDA leaned toward being too easy: five participants rated it below the midpoint, and none rated it above. Fixed Time-Based Progression produced a wider spread, with one response below and two above the midpoint. The omnibus comparison of absolute deviation from the midpoint was not significant, so the distributions do not confirm a calibration advantage. They identify a pattern worth testing in a larger sample. The separation between objective game difficulty and perceived difficulty agrees with studies showing that objective challenge can change without a corresponding change in subjective difficulty [
14,
22]. This pattern supports goal-based DDA designs that distinguish perceived challenge from performance as an adaptation target [
8,
17].
Skill-Specific DDA did not produce a corresponding gameplay performance advantage during the 210 s session. Its generated content was conservative, with 50.7% Easy patterns, 12.4% Medium patterns, and 2.2% Expert patterns. The controller combined separate aiming, movement, and color-matching estimates with mechanic-specific caps, a weakest-skill rule, an Expert gate, and a finite authored pattern library. These components may have restricted the compatible pattern set, especially early in the run. Prior systems have connected separate ability estimates to corresponding game elements [
11,
27], and deeper player models have been evaluated across repeated or longer-term play [
26]. More observation time could stabilize the skill estimates in Pulse Run. Longer exposure alone would not address restrictive thresholds or sparse authored content across skill combinations. The present result concerns this controller and session length, not the general value of skill-specific player modeling.
The experiment compared complete progression strategies rather than player-model granularity in isolation. Performance-Based DDA adjusted scroll speed, pattern gap, and pattern eligibility. Skill-Specific DDA adjusted pattern eligibility, with speed and gap following the fixed schedule. Observed differences may therefore reflect both how performance was represented and how it was used to regulate progression. A matched comparison could hold the progression rules and adjustable game parameters constant while varying only the player-model structure. A factorial design could separate the effect of player-model structure from the effect of adjustment scope. Such a design would test whether separate skill estimates provide incremental value when controllers have equal access to the same game features [
8].
Post-run ratings indicated a favorable experience across all three strategies. Median enjoyment was 4.0 under Fixed Time-Based Progression, 5.0 under Performance-Based DDA, and 4.0 under Skill-Specific DDA. Median frustration was low at 2.0, 1.0, and 2.0, respectively. Fixed Time-Based Progression paired high enjoyment with substantially greater exposure to advanced patterns. Performance-Based DDA showed the highest enjoyment and lowest frustration descriptively, yet half of its participants rated the run below the difficulty midpoint. This combination suggests that performance, enjoyment, and challenge suitability can favor different controller settings. Nagle et al. found greater performance under task-guided adaptation and greater enjoyment under user-guided difficulty control [
37]. Denisova and Cairns reported greater immersion after performance-based timer adjustment [
38], and Ang and Mitchell found that DDA implementations produced different player-experience profiles [
39]. Alexander et al. showed that difficulty preferences varied with gaming experience rather than measured ability alone [
40]. Previous VR experience was unevenly distributed across the present groups, and the sample was too small to test it as a moderator.
The strategies did not produce statistically distinguishable wall-contact or zero-stability outcomes. These tests had limited precision and cannot establish equivalent obstacle-avoidance performance. Motion sickness was reported by five participants and was treated descriptively. The binary item recorded the presence of symptoms but not their type, severity, or change from a pre-exposure baseline. Future studies could use baseline and post-exposure versions of the Virtual Reality Sickness Questionnaire [
41] or the Cybersickness in Virtual Reality Questionnaire [
42]. A workload or exertion measure would help determine whether the pacing and pattern differences changed physical demand.
The results illustrate two design considerations. First, delivered difficulty in multidimensional VR games can be described through separate dimensions. Advanced-pattern exposure, encounter density, speed, gap, aiming demand, movement demand, and color-selection demand need not rise together. Second, the primary adaptation objective should be stated explicitly. A controller optimized for normalized performance may produce a different experience from one optimized for perceived-challenge calibration or advanced-content exposure. Each player estimate should map to a defined control channel, and that mapping should be evaluated separately from prediction or classification accuracy [
8,
21,
27]. A skill-specific controller needs adequate authored content across combinations of skill demands. Even accurate skill estimates may have limited influence when the compatible content set is too narrow.
Future telemetry should store player estimates, target values, adaptive offsets, recovery states, and selected game adjustments at every update. These traces would enable calculation of time within the target range, absolute target deviation, convergence time, adaptation oscillation, and the number and duration of recovery activations. Compatible candidate-set sizes, filtering rejections, and selected patterns would further explain why a controller produced a given course. The DDA-MAPEKit framework offers a useful structure for separating monitoring, analysis, planning, and execution in this process [
28]. A follow-up study could pair this telemetry with repeated sessions and a common evaluation block containing identical content for every participant.
Several limitations constrain the precision and generalizability of the findings. The Quest 3 groups were relatively small and unequal, with seven participants under Fixed Time-Based Progression. The approximate sensitivity benchmark indicates that the primary analysis was mainly capable of detecting large effects, while estimates of smaller differences remain imprecise. Allocation followed a fixed round-robin sequence rather than randomization. Consequently, systematic differences associated with participant order, recruitment setting, or baseline characteristics cannot be excluded. Previous VR experience was unevenly distributed across the groups and may have influenced the between-strategy comparisons. The sample consisted of adolescents and young adults. Each participant completed one short run in a between-subjects design, which prevented within-player strategy comparisons and assessment of learning across sessions. Although the gameplay logic and session timing were identical, Quest 2 and Quest 3 used different rendering settings, and frame-time telemetry was not recorded. The change in the normalized-score inference may therefore reflect the additional participants, headset-related differences, or both. Brief post-run ratings and aggregate session logs limited the analysis of controller behavior; target-range occupancy, absolute target deviation, convergence, oscillation, and recovery duration could not be reconstructed from the recorded data. These constraints widen uncertainty and prevent nonsignificant outcomes from being interpreted as evidence of equivalence.
This exploratory study compared fixed progression, global performance-based adaptation, and skill-specific adaptation within the same arcade VR task. The three strategies produced different content delivery, gameplay performance, and player rating profiles. Fixed Time-Based Progression delivered significantly more advanced content. Performance-Based DDA produced the strongest short-session performance pattern, although its significant normalized-score advantage over Fixed Time-Based Progression appeared only in the all-headset sensitivity analysis. Skill-Specific DDA descriptively produced the highest percentage of “just right” difficulty ratings. No strategy consistently outperformed the others across all outcomes. These findings reinforce the importance of evaluating delivered content, gameplay performance, and perceived challenge as distinct aspects of adaptive gameplay. Larger studies using standardized hardware, randomized allocation, matched progression rules and adjustable game parameters, and repeated sessions are needed to determine whether the observed patterns represent consistent differences between strategies.