Article

Duality-Derived Electromagnetic Modeling of an On-Board Traction Transformer Under Power-Frequency Overexcitation

1
School of Electrical Engineering, China University of Mining and Technology, Xuzhou 221116, China
2
State Grid Jiangsu Electric Power Co., Ltd., Fengxian County Power Supply Branch, Xuzhou 221700, China
3
Electric Power Research Institute, State Grid Ningxia Electric Power Co., Ltd., State Grid Corporation of China, Yinchuan 750002, China
*
Author to whom correspondence should be addressed.
Electronics 2026, 15(17), 3793; https://doi.org/10.3390/electronics15173793 (registering DOI)
Submission received: 27 July 2026 / Revised: 20 August 2026 / Accepted: 22 August 2026 / Published: 24 August 2026
(This article belongs to the Section Power Electronics)

Abstract

Power-frequency overexcitation increases the voltage-to-frequency ratio applied to a transformer core and may drive the core into saturation, resulting in substantial distortion of the no-load current. This paper presents a duality-derived electromagnetic model for an on-board traction transformer by combining a sixth-order Foster network identified through vector fitting with a Jiles–Atherton hysteresis operator. The proposed model preserves the physical correspondence between magnetic-flux paths and equivalent-circuit elements while accounting for history-dependent core hysteresis and frequency-dependent core impedance. The model is implemented and numerically evaluated in MATLAB/Simulink R2024a, and experimental validation is performed on a 250 kVA prototype under rated power-frequency excitation and power-frequency overexcitation. Under rated excitation, the RMS relative error and NRMSE of the no-load current are 0.09% and 0.96%, respectively, with a maximum relative error of 2.90%. Under power-frequency overexcitation, the NRMSE is 4.14% and the maximum relative error is 9.37%. The results show that the proposed model accurately reproduces the nonlinear no-load current response associated with core saturation and hysteresis within the investigated power-frequency excitation range.

1. Introduction

On-board traction transformers are key power-conversion components in high-speed electric multiple units, and their operating performance directly affects the reliability and safety of the traction system. During practical operation, variations in the traction power supply may increase the voltage-to-frequency ratio applied to the transformer. When this ratio exceeds its rated value, the transformer operates under power-frequency overexcitation. Under such conditions, the core flux density increases and may approach or exceed the saturation region of the magnetization curve, leading to a substantial increase in the no-load current and pronounced waveform distortion.
Power-frequency overexcitation imposes increased electromagnetic and thermal stresses on the transformer core. Because the secondary-side loads may be disconnected under certain operating conditions, the transformer can operate at no load while being subjected to an elevated excitation voltage. The resulting core saturation and no-load current distortion may increase core losses, local heating, vibration, and electromagnetic stress. Accurate characterization of the core response under power-frequency overexcitation is therefore important for evaluating the operating performance of on-board traction transformers.
Research on the transient characteristics of electrical equipment generally relies on theoretical modeling, finite element simulation, and field testing. However, given the computational cost of simulations and the practical constraints of field testing, establishing accurate equivalent circuit models has become a widely adopted approach in the fields of equipment condition monitoring and insulation coordination. The soft magnetic materials—such as grain-oriented silicon steel sheets—employed in transformer cores exhibit complex nonlinear characteristics during the excitation process, resulting in pronounced nonlinear and frequency-dependent electromagnetic behavior under different excitation conditions [1,2].
Under rated power-frequency excitation, the transformer core generally operates below or near the knee of the magnetization curve, and linear inductors or simplified single-valued nonlinear inductance models may provide acceptable accuracy for engineering calculations. Under power-frequency overexcitation, however, the increase in the applied voltage-to-frequency ratio raises the peak core flux density and drives the operating point further into the saturation region. The magnetizing current then becomes highly nonlinear and exhibits substantial peak-current growth and waveform distortion. Moreover, the magnetization state depends on the preceding excitation history because of magnetic hysteresis. Conventional single-valued nonlinear inductance models cannot adequately represent this history-dependent behavior or the associated hysteresis-loop evolution. Therefore, an accurate model for power-frequency overexcitation should account for both core hysteresis nonlinearity and frequency-dependent core losses.
Extensive research has been conducted on transformer electromagnetic modeling, and existing approaches can be broadly classified into three categories. The first category comprises terminal-measurement or data-driven models, which identify equivalent parameters from measured voltage and current signals and are attractive for their low computational cost and ease of implementation [3,4]. However, core nonlinearity is often represented by simplified single-valued magnetization characteristics, limiting their ability to reproduce history-dependent hysteresis and strong saturation.
The second category consists of high-frequency or wide-band network models, which account for distributed winding parameters and frequency-dependent characteristics and are effective for analyzing transformer responses over an extended frequency range [2,5,6]. However, the core is commonly treated using linear or simplified nonlinear representations, making these models less suitable for accurately predicting nonlinear exciting-current distortion. Recent studies on high-frequency electromagnetic energy-transfer systems have further shown that winding symmetry and resonant-network configuration can significantly affect electromagnetic coupling and spatial EMF/EMI characteristics [7,8].
The third category comprises physics-based models derived from electromagnetic duality or magnetic equivalent circuits. These models preserve the physical correspondence between magnetic-flux paths and equivalent-circuit elements, providing a suitable framework for representing core saturation and leakage flux. Nevertheless, conventional implementations often use single-valued nonlinear inductances or simplified loss branches, and therefore have limited capability to represent hysteresis history and frequency-dependent core behavior [9,10,11,12,13,14].
To address the limitations of existing models in accurately describing the nonlinear magnetization behavior and frequency-dependent core characteristics of on-board traction transformers, this paper proposes an improved duality-derived electromagnetic modeling approach. The proposed approach integrates the physical topology of the transformer magnetic system with a Jiles–Atherton (J–A) hysteresis operator and a frequency-dependent Foster network, enabling a more comprehensive representation of core nonlinear characteristics and impedance behavior. Through this integration, the proposed model preserves the physical interpretability of magnetic-circuit-based models while describing the dynamic magnetization behavior that is difficult to accurately capture using conventional equivalent circuit models.
The proposed model is developed based on the physical correspondence between the transformer magnetic circuit and its dual electrical circuit. First, a magnetic-circuit duality-derived topology is established according to the transformer structure and electromagnetic duality principle, providing a physically interpretable relationship between magnetic flux paths and circuit elements. Second, a J–A hysteresis operator [15] is incorporated into the low-frequency branch of the Foster equivalent circuit, while the frequency-dependent parameters of the Foster network are identified using an improved vector fitting method. This formulation enables the model to simultaneously consider history-dependent hysteresis evolution, nonlinear saturation characteristics, and frequency-dependent core impedance behavior. Finally, the proposed model is evaluated through numerical simulations and experimentally validated using a 250 kVA prototype under rated power-frequency excitation and power-frequency overexcitation conditions.

2. Construction of the Duality-Derived Magnetic-Circuit Model for the On-Board Traction Transformer

Accurately characterizing the nonlinear magnetization behavior of the core is a central challenge in transformer electromagnetic modeling. Traditional equivalent circuit models often employ single-valued nonlinear inductors, which struggle to accurately describe the core’s hysteresis effects and broadband loss characteristics. This may lead to appreciable errors under strongly nonlinear excitation conditions [9,10,11,12,13,14].
This section develops a magnetic circuit duality-derived model for on-board transformers based on the electromagnetic duality principle. First, starting from the physical structure of the core, the initial magnetic circuit and its dual equivalent circuit, comprising the main magnetic flux and multiple leakage flux components, are derived. Subsequently, addressing the complex electromagnetic characteristics of the core, a comprehensive topological optimization scheme integrating frequency-dependent eddy current losses and magnetic hysteresis nonlinearity is proposed: an improved vector fitting method constructs a Foster circuit to precisely fit the core’s wide-frequency impedance characteristics; simultaneously, the J–A hysteresis model is embedded into the critical branches of the Foster circuit to characterize the core’s magnetic hysteresis nonlinearity and saturation properties. Finally, the optimized core model is integrated with an ideal transformer to establish a complete duality-derived electromagnetic model of the on-board traction transformer. Its response under different excitation conditions is evaluated through numerical simulation. The subsequent subsections detail the derivation of the equivalent magnetic circuit, the topology optimization incorporating the J–A hysteresis operator, and the integration of the complete duality-derived electromagnetic model, thereby establishing a systematic framework for capturing the core’s nonlinear and frequency-dependent behavior under transient excitation.

2.1. Equivalent Circuit of the On-Board Traction Transformer Core

The on-board traction transformer studied in this paper is a single-phase shell-type transformer with a rated capacity of 6300 kVA, a primary rated voltage of 27.5 kV, and four secondary windings rated at 1.85 kV each. Its critical parameters are summarized in Table 1.
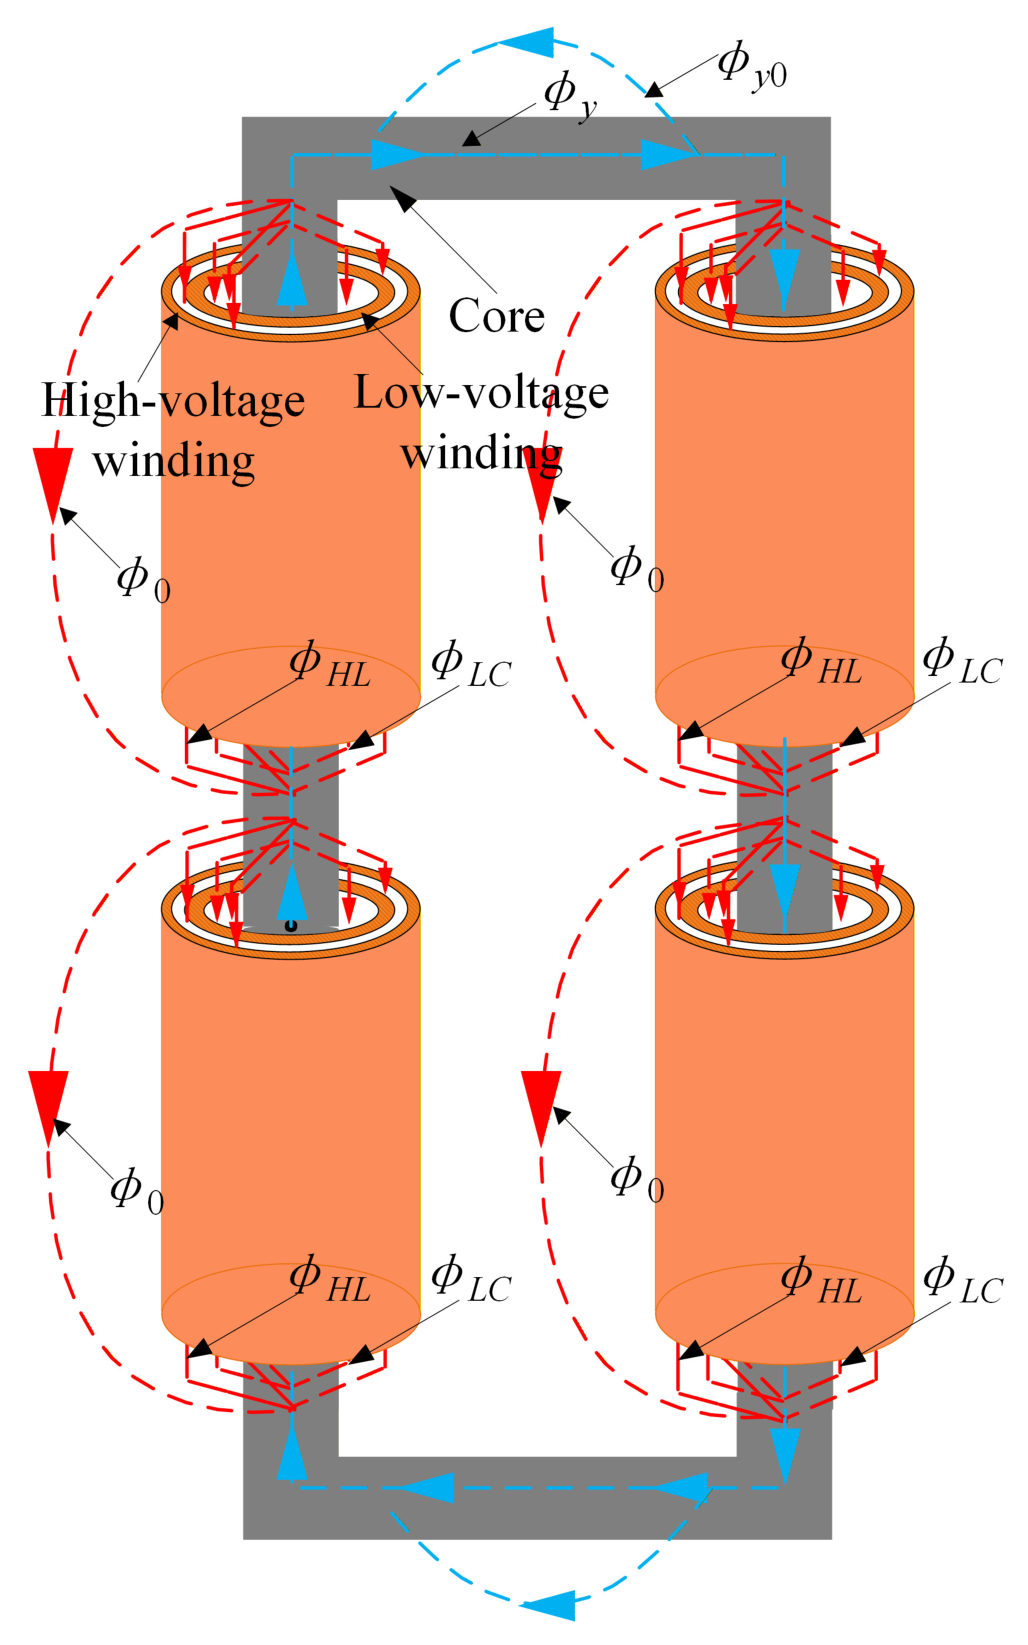
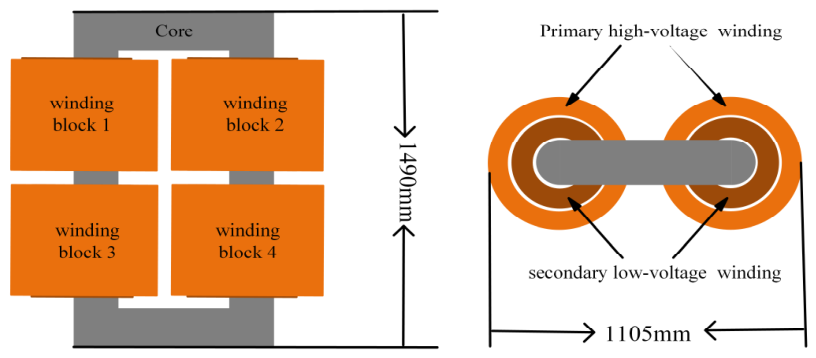
The core structure of the on-board traction transformer is first represented as shown in Figure 1 and Figure 2. The high-voltage winding is arranged in an external winding configuration, while the low-voltage winding is positioned adjacent to the inner layer of the core columns. This model accounts for five flux components within the on-board transformer core: the closed main flux Φy within the core, the leakage flux Φ0 through the core-side leakage path, the leakage flux ΦLC between the core columns and the low-voltage windings, the leakage flux ΦHL between the high- and low-voltage windings, and the leakage flux Φy0 through the yoke-side leakage path.
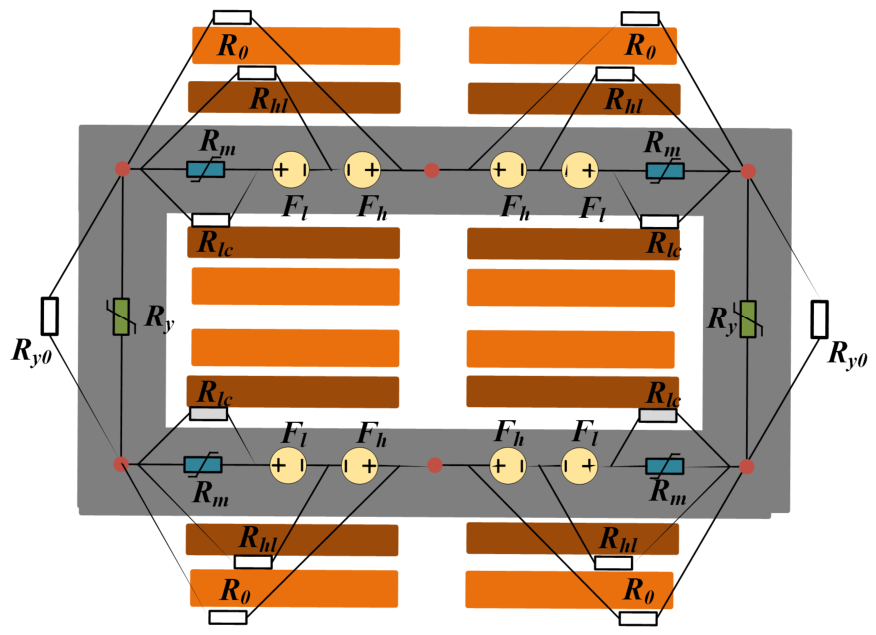
The established equivalent magnetic circuit is shown in Figure 3. Fh and Fl represent the magnetomotive forces of the high/low-voltage windings, respectively. Rm and Ry characterize the nonlinear magnetic reluctance of the core columns and yoke sections, respectively. R0, Rlc, Rhl, and Ry0 correspond to the linear magnetic reluctance associated with each leakage magnetic flux, respectively [9,11].
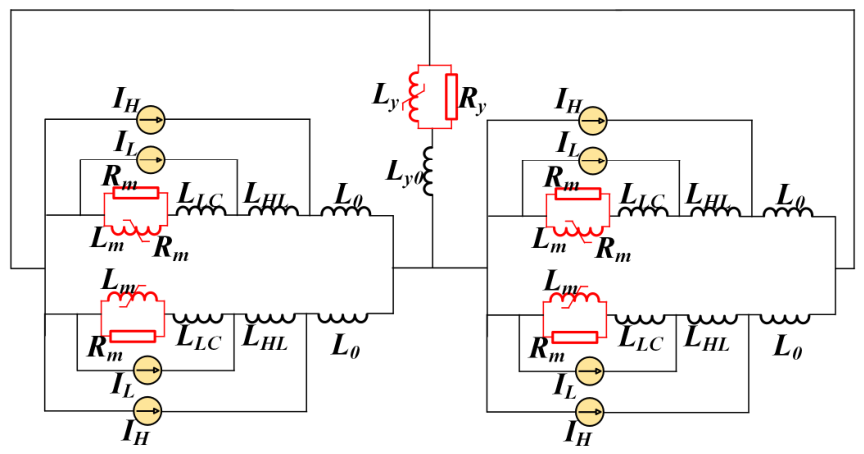
After merging the symmetrical magnetic cores via electromagnetic duality transformation, the equivalent circuit shown in Figure 4 is obtained. Here, IH and IL are current sources corresponding to the magnetomotive forces of the high- and low-voltage windings, respectively. L0, LLC, LHL, and Ly0 denote the leakage inductances associated with R0, Rlc, Rhl, and Ry0, respectively. The parallel combination of resistor Rm and nonlinear inductance Lm characterizes the magnetic core columns and yoke.

2.2. Topology Optimization Considering Core Hysteresis Nonlinearity

The magnetic hysteresis nonlinearity in transformer cores originates from the irreversible motion of microscopic magnetic domains within ferromagnetic materials. This phenomenon can be explained by the principle of minimizing domain energy. Ferromagnetic materials consist of numerous spontaneously magnetized domains. Within each domain, atomic magnetic moments align parallel to one another due to exchange interactions, while the orientation of magnetic moments between different domains is jointly regulated by the anisotropy field and the demagnetizing field. When subjected to an external magnetic field, magnetic domains dynamically adjust their magnetic moment orientation to minimize system energy. However, energy dissipation associated with domain wall motion causes the magnetization state to lag behind magnetic field changes, forming macroscopic hysteresis loops.
This irreversible domain-level behavior constitutes the physical origin of magnetic hysteresis and the history-dependent evolution of the hysteresis loop. An accurate macroscopic model must therefore embed a mathematical description that captures both the instantaneous magnetization state and its dependence on the magnetization history. The Jiles–Atherton model, which formulates the hysteretic relationship through physically motivated differential equations, provides a suitable framework for this purpose [15,16,17].
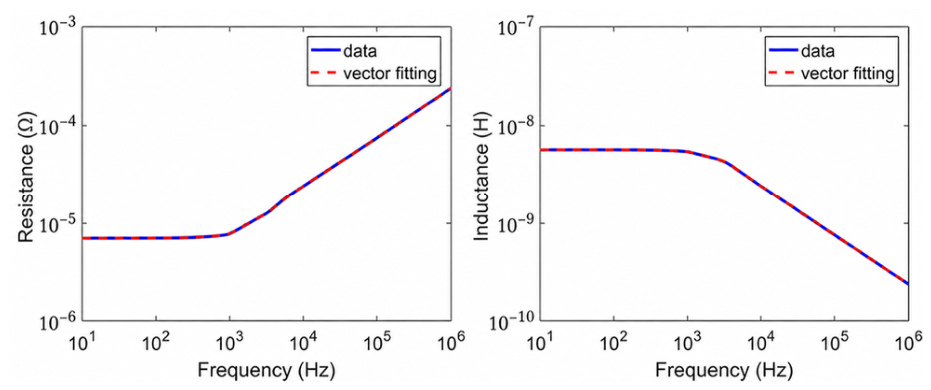
To achieve accurate representation of the frequency-dependent core impedance, an improved vector fitting method [18] was employed for high-order rational function fitting. This approach configures initial poles with equal logarithmic spacing and constrains the model structure to exclude constant and proportional terms, thereby eliminating the risk of low-frequency distortion. Convergence was deemed reached when the maximum relative change in pole locations between two successive iterations fell below 5 × 10⁻⁴. The final frequency response matching results are shown in Figure 5. The fitted response agrees closely with the target data, with a relative fitting error below 0.5% over 10 Hz–1 MHz. The fitted rational representation is subsequently used to synthesize the Foster network.
The fitted results were implemented using a parallel Foster circuit. Based on the component parameter calculation method for circuit implementation derived from vector fitting results, the fitted admittance is represented by the following rational function (where s denotes the Laplace operator):
f ( s ) k = 1 6 c k s a k
In this fitting, the order was set to six, with no constant or proportional terms included. Six sets of numerical solutions for poles and residues were obtained. The branch element parameters corresponding to the kth (k = 1, 2, …, 6) pole and residue are:
R k = a k c k , L k = 1 c k
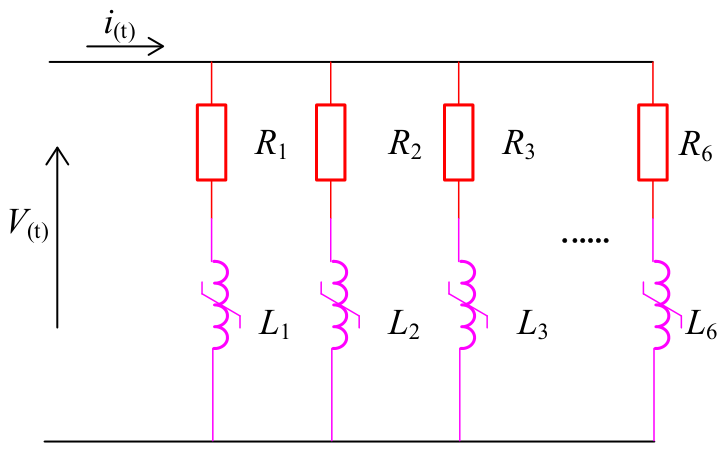
Based on the circuit synthesis method, each pole–residue pair obtained from the rational function fitting is transformed into a series Rk–Lk branch. The six series Rk–Lk branches are then connected in parallel to form the sixth-order Foster network shown in Figure 6, which is used to represent the frequency-dependent impedance characteristics of the transformer core over a wide frequency range [19,20,21].
The synthesized circuit parameters are listed in Table 2.
Based on the circuit parameters listed in Table 2, R6 is considerably smaller than the resistances of the other Foster branches, indicating that the sixth branch contributes predominantly to the low-frequency response of the synthesized network. The individual Rk and Lk values are equivalent network-synthesis parameters and should not be interpreted as discrete physical resistances or inductances located in the core. The history-dependent hysteresis behavior is represented separately by the J–A operator embedded in the low-frequency branch. The frequency-dependent eddy-current behavior of transformer cores is also strongly affected by core geometry, magnetic flux density, and excitation frequency [22].
The J–A hysteresis operator is embedded into the low-frequency Foster branch to represent history-dependent hysteresis and saturation, while the remaining Foster branches preserve the frequency-dependent core-impedance representation. This approach avoids excessive model complexity that could hinder solution feasibility. Traditional single-valued nonlinear inductance models exhibit limitations in characterizing core hysteresis, leading to fitting errors in both hysteresis and saturation nonlinearities. To address this, this section introduces a novel inductance model based on the J–A hysteresis model. This model incorporates a dynamic coupling relationship between magnetization and magnetic field strength to represent the core’s hysteretic nonlinear characteristics.
Prior to embedding the J–A hysteresis operator into the Foster network, its parameters must be determined for the B30P105 grain-oriented silicon steel used in this study. The parameters of the scalar J–A model were identified from the magnetic characteristics of B30P105 grain-oriented electrical steel using particle swarm optimization. The identified parameters are Ms =1.56 × 10⁶ A/m, a = 24.2 A/m, k = 22.8 A/m, c = 0.185, and α = 0.92 × 10⁻⁴; the corresponding differential equations are solved using a fourth-order Runge–Kutta method, while the frequency-dependent core behavior is represented separately by the Foster network.
The particle swarm optimization (PSO) algorithm is employed for parameter identification, where the objective function is defined as a weighted sum of the errors in flux density, field strength, and hysteresis loop area, based on the measured magnetization and loss curves of the material. The swarm size was set to 50, and the weighting coefficients of the objective function were set to 0.5, 0.3, and 0.2 for flux density, field strength, and hysteresis loop area, respectively.
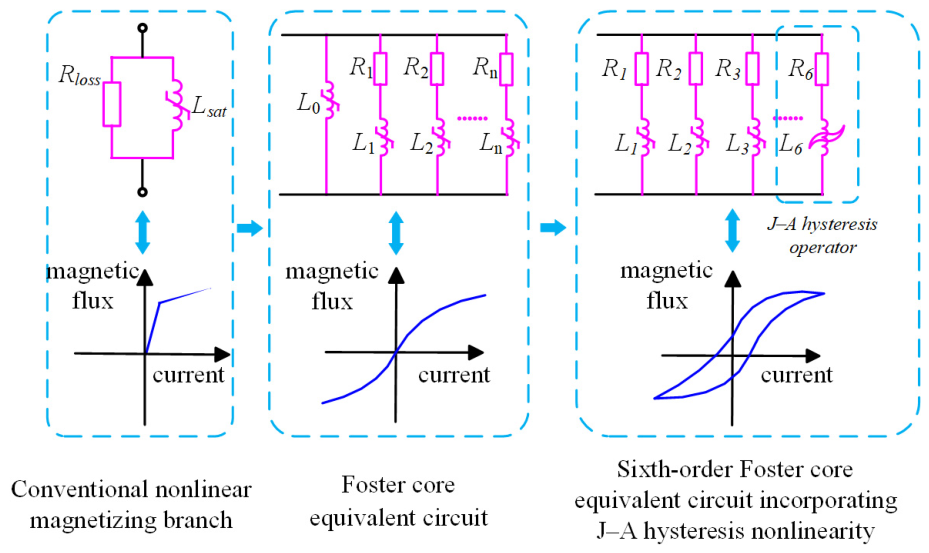
Based on the parameter identification of the classical J–A hysteresis model, this study further improves the topology of the core Foster equivalent circuit. Specifically, the J–A hysteresis operator is incorporated into the low-frequency magnetization branch of the Foster network to describe the history-dependent nonlinear magnetization behavior of the core, while the remaining Foster branches are retained to represent the frequency-dependent impedance characteristics. The evolution from the conventional nonlinear magnetizing branch to the proposed Foster-based core equivalent circuit is illustrated in Figure 7.
In Figure 7, Rloss and Lsat denote the conventional equivalent core-loss resistance and nonlinear saturation inductance, respectively, while Rk and Lk denote the resistance and inductance of the k-th Foster branch. The low-frequency branch represents the fundamental magnetization process of the core, where the J–A hysteresis operator is introduced to characterize the history-dependent nonlinear magnetization behavior.
A J–A-based nonlinear inductance model is implemented in MATLAB to evaluate its hysteretic response under different excitation conditions. The applied excitation is processed through the hysteresis nonlinear inductance calculation to control the output current of the controlled current source.
(1)
Sine Voltage Excitation Test
After applying a 25 V sinusoidal voltage, the B-H hysteresis loop output from the J–A nonlinear inductor demonstrates that the nonlinear inductor incorporating the J–A hysteresis model accurately represents the core’s magnetic hysteresis characteristics.
(2)
Rising Sine Wave Excitation Test
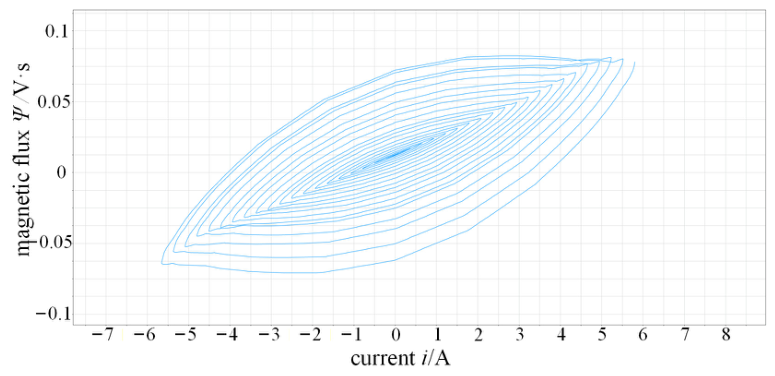
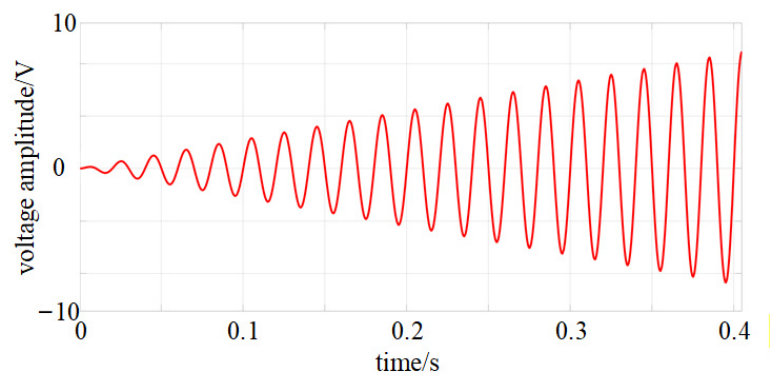
In the rising sine excitation test circuit, the rising sine excitation voltage US = 25tsin(100πt) is applied. Figure 8 shows the voltage excitation waveform. As the voltage amplitude continuously increases over time, the test results indicate that the area of the hysteresis loop gradually expands. This indicates that the nonlinear inductor can synchronously adapt to changes in excitation levels and the hysteresis loop evolves accordingly with the increasing excitation level.
Figure 9 shows the corresponding hysteresis-loop evolution under the rising sinusoidal excitation.
(3)
Harmonic excitation test
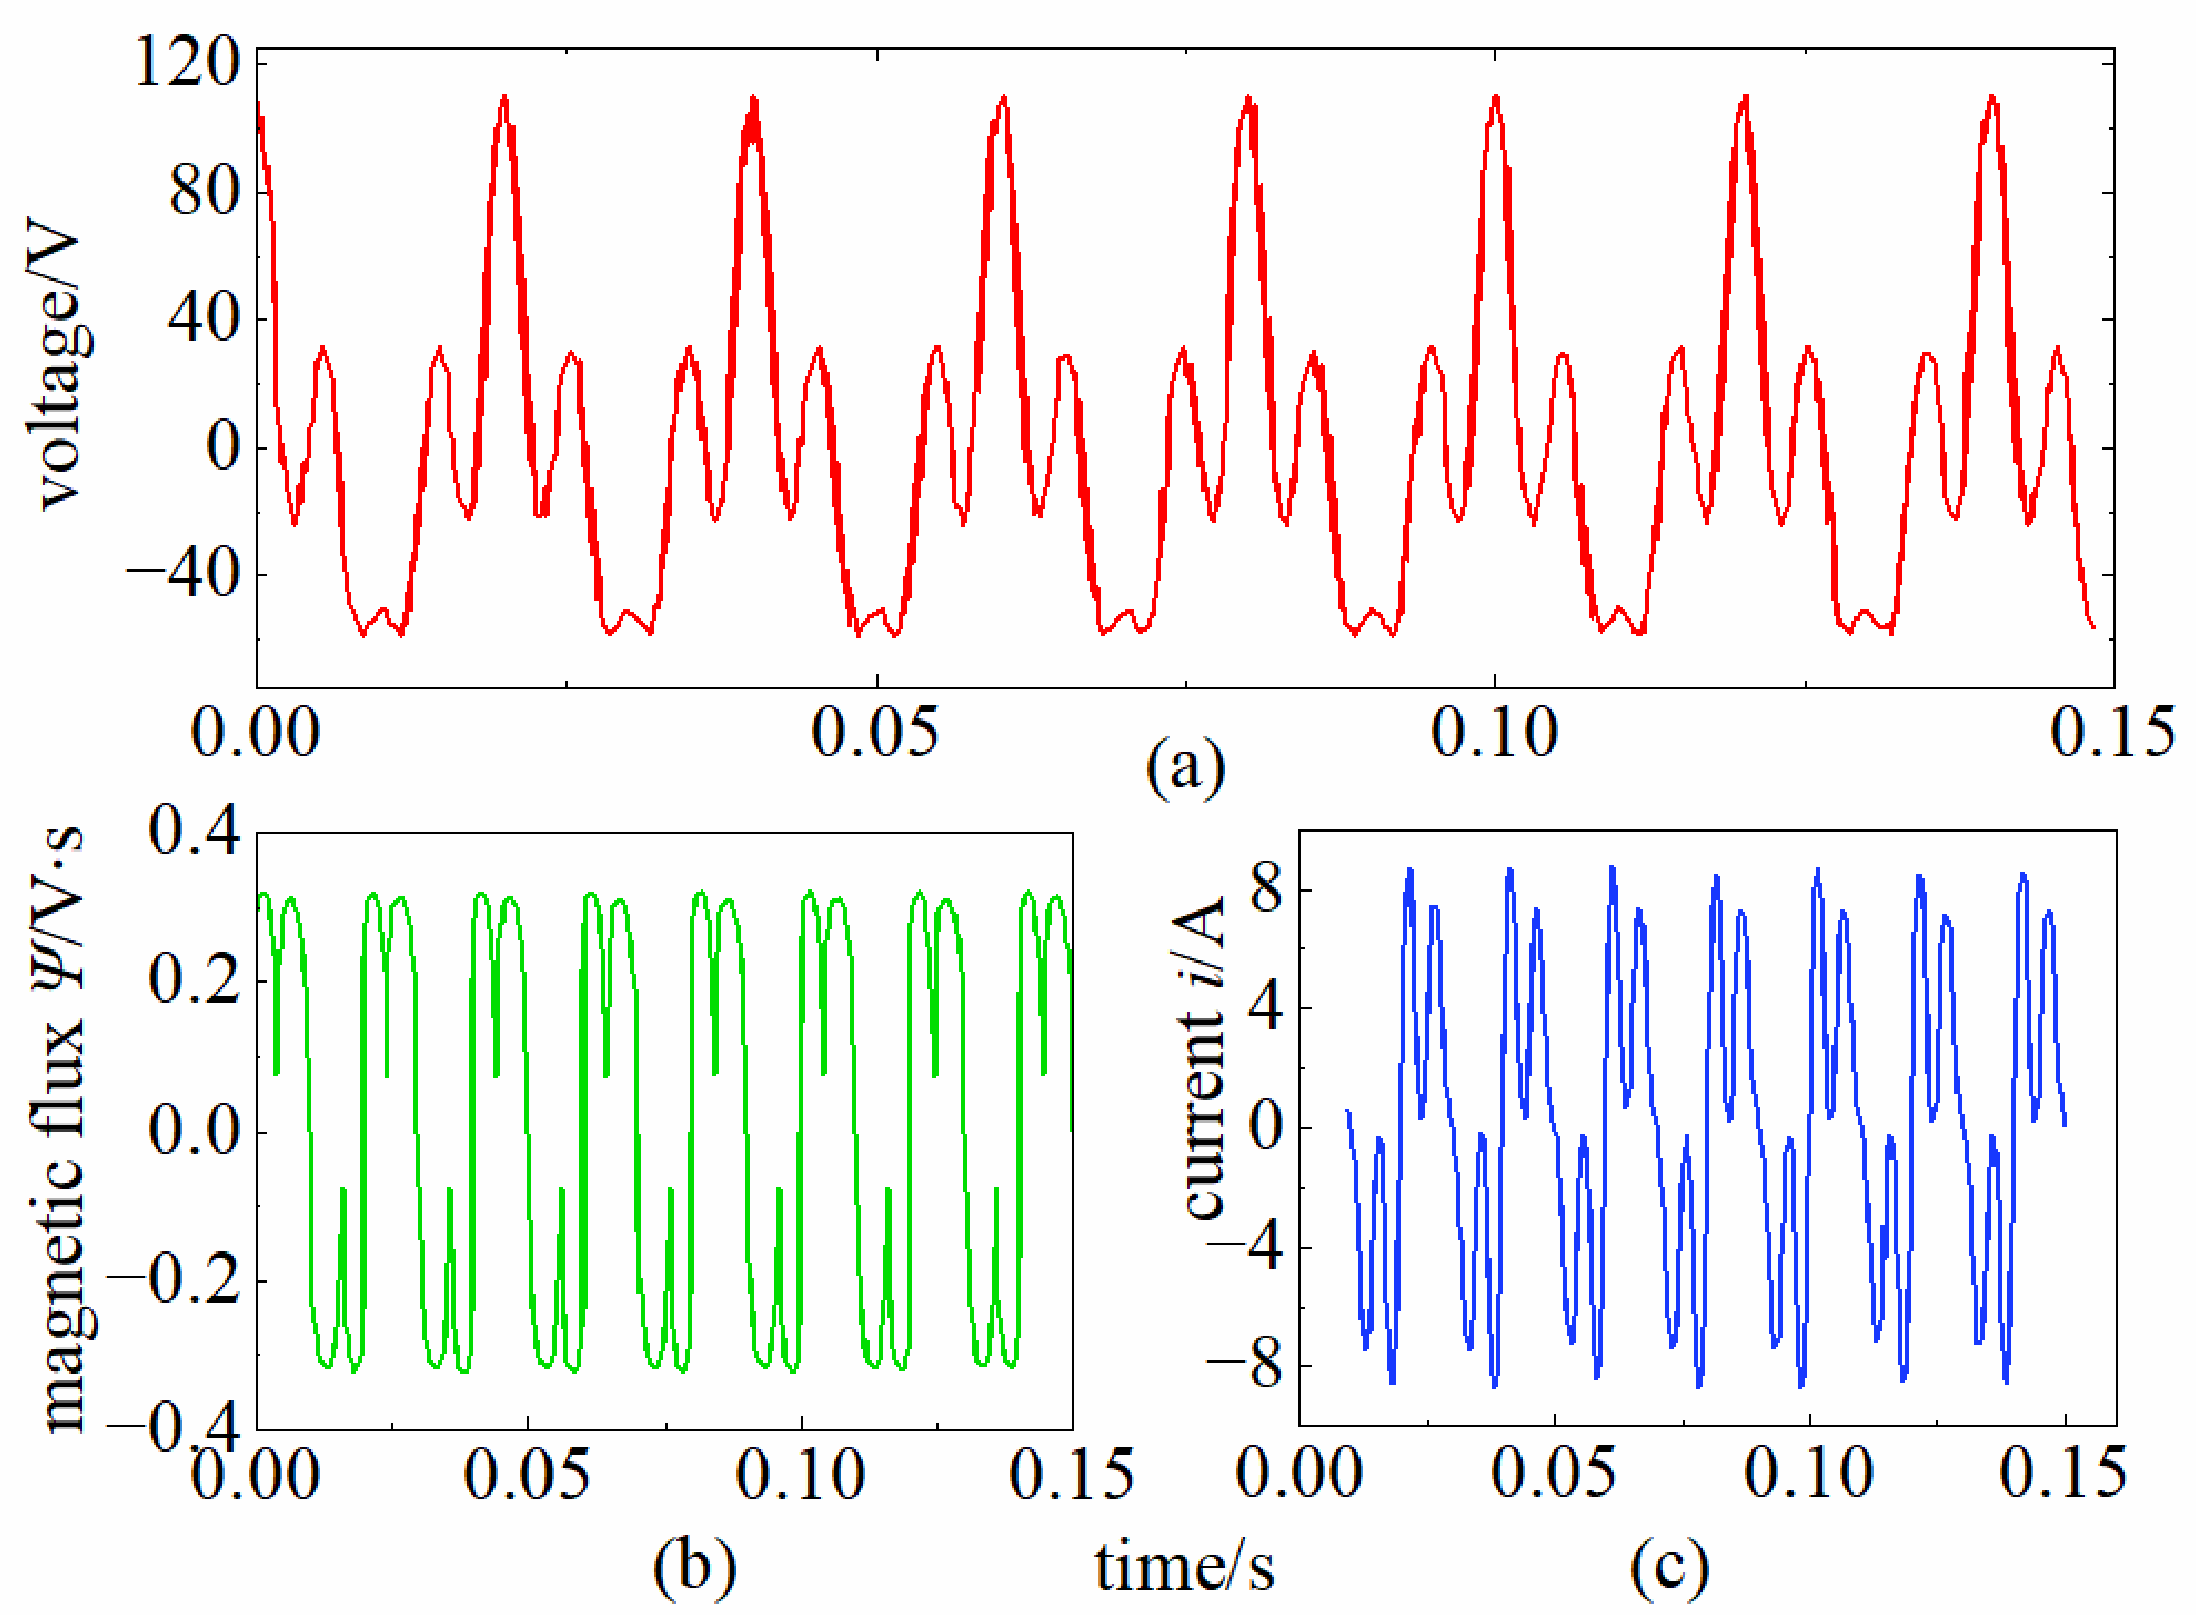
A harmonic component was further introduced into the excitation voltage to evaluate the response of the J–A-based nonlinear inductance under asymmetric excitation, as shown in Figure 10. It can be observed that the J–A hysteresis nonlinear inductance operates stably under harmonic excitation conditions. As the excitation voltage amplitude and phase vary, corresponding nonlinear hysteresis effects occur in the current and magnetic flux linkage.

2.3. Duality-Derived Electromagnetic Model of On-Board Transformers Based on Ideal Transformer Connections

In the preceding analysis, a core model for the on-board transformer was established, and a topology optimization considering core hysteresis and saturation nonlinearities was performed. This section electromagnetically couples the previously developed models of the on-board transformer’s components to establish a complete duality-derived electromagnetic model.
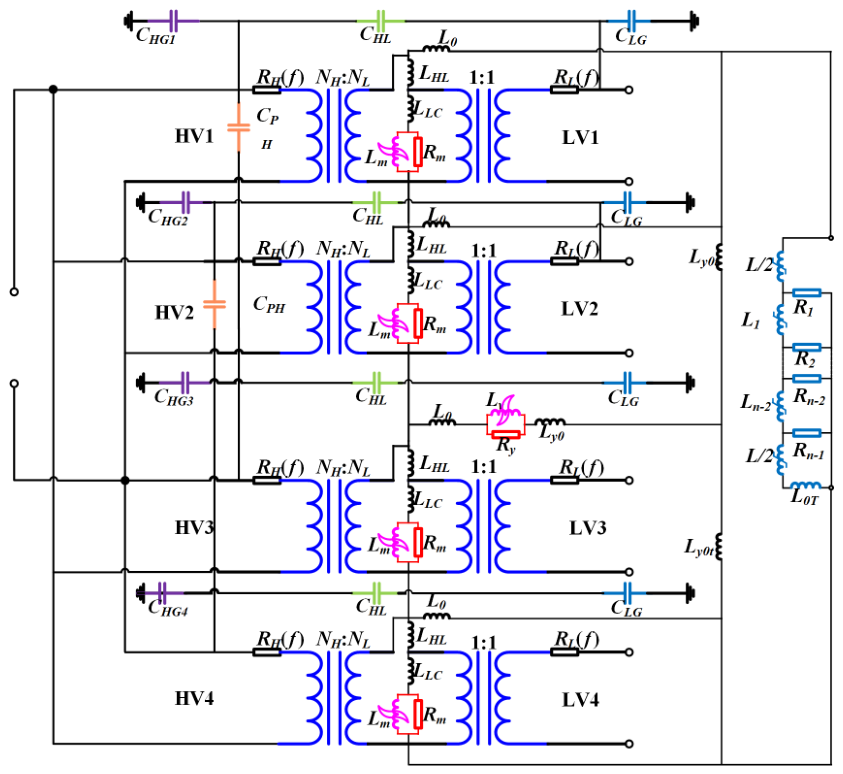
To incorporate the fundamental voltage transformation characteristics of the transformer, an ideal transformer is added to the primary and secondary equivalent models, respectively, to simulate the transformer’s voltage transformation ratio characteristics. Furthermore, when leakage inductance and core parameters are scaled to the primary side, the introduced ideal transformer ratio can be set to 1:1 and NH:NL. When scaled to the secondary side, the ideal transformer ratio can be set to NH:NL and 1:1.
After introducing the ideal transformer, the established electromagnetic transient duality-derived model for the on-board transformer is shown in Figure 11. Figure 11 illustrates the topology of the proposed duality-derived electromagnetic model. The electrical, capacitive, magnetic, and frequency-dependent core-loss components represent the corresponding physical effects and their equivalent relationships within the model. The parallel combination of core resistance and nonlinear inductance is replaced by the optimized Foster equivalent circuit established earlier, with leakage inductance and core parameters being the values scaled to the secondary side. In Figure 11, HV1–HV4 denote four equivalent sections of the single physical high-voltage winding introduced to establish the correspondence with the four local magnetic-circuit branches. These sections share the same external primary terminals and are therefore connected to the same primary electrical port in the equivalent circuit. In contrast, LV1–LV4 represent the four physical secondary windings, which remain electrically independent and are open-circuited under the no-load condition considered in this study. Through the duality transformation, each inductive and resistive element in the equivalent circuit retains a clear physical correspondence to a specific flux path or core section, thereby preserving the inherent nonlinearity distribution across the transformer geometry. This topology ensures that the model can seamlessly transition between linear magnetization, saturation knee, and deep saturation regions as the excitation level varies, without requiring switching of circuit configurations or recalibration of parameters.
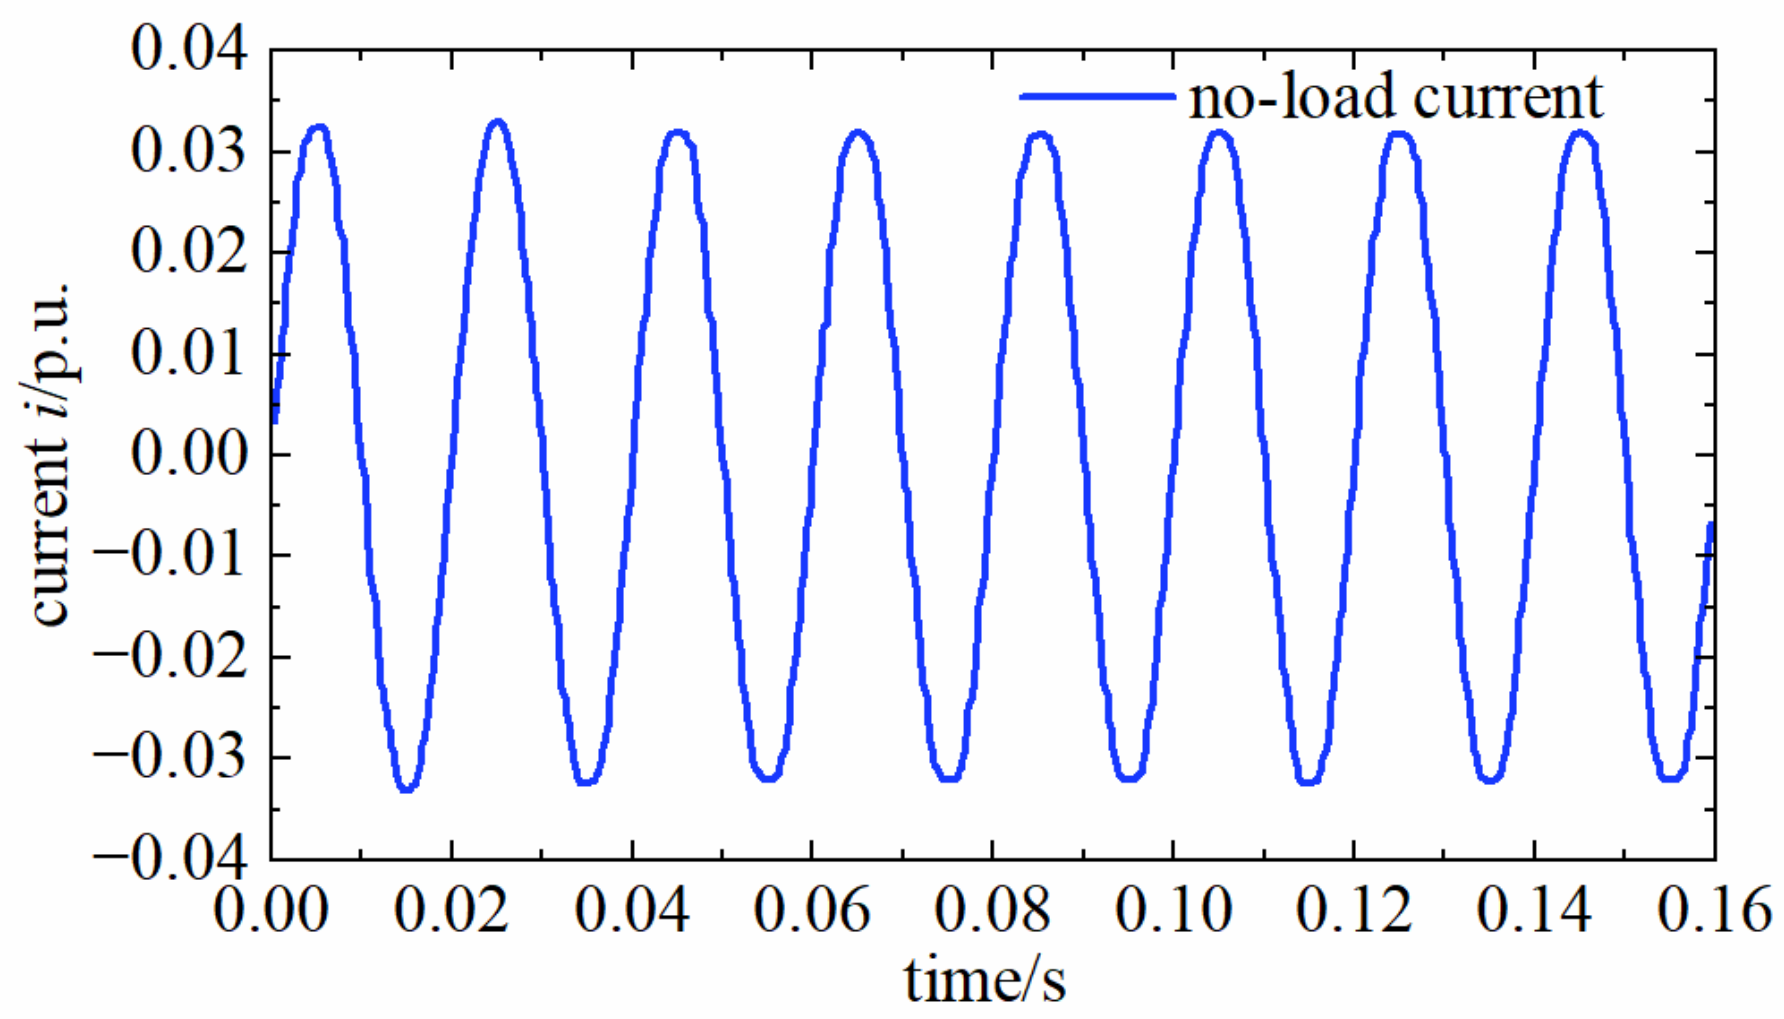
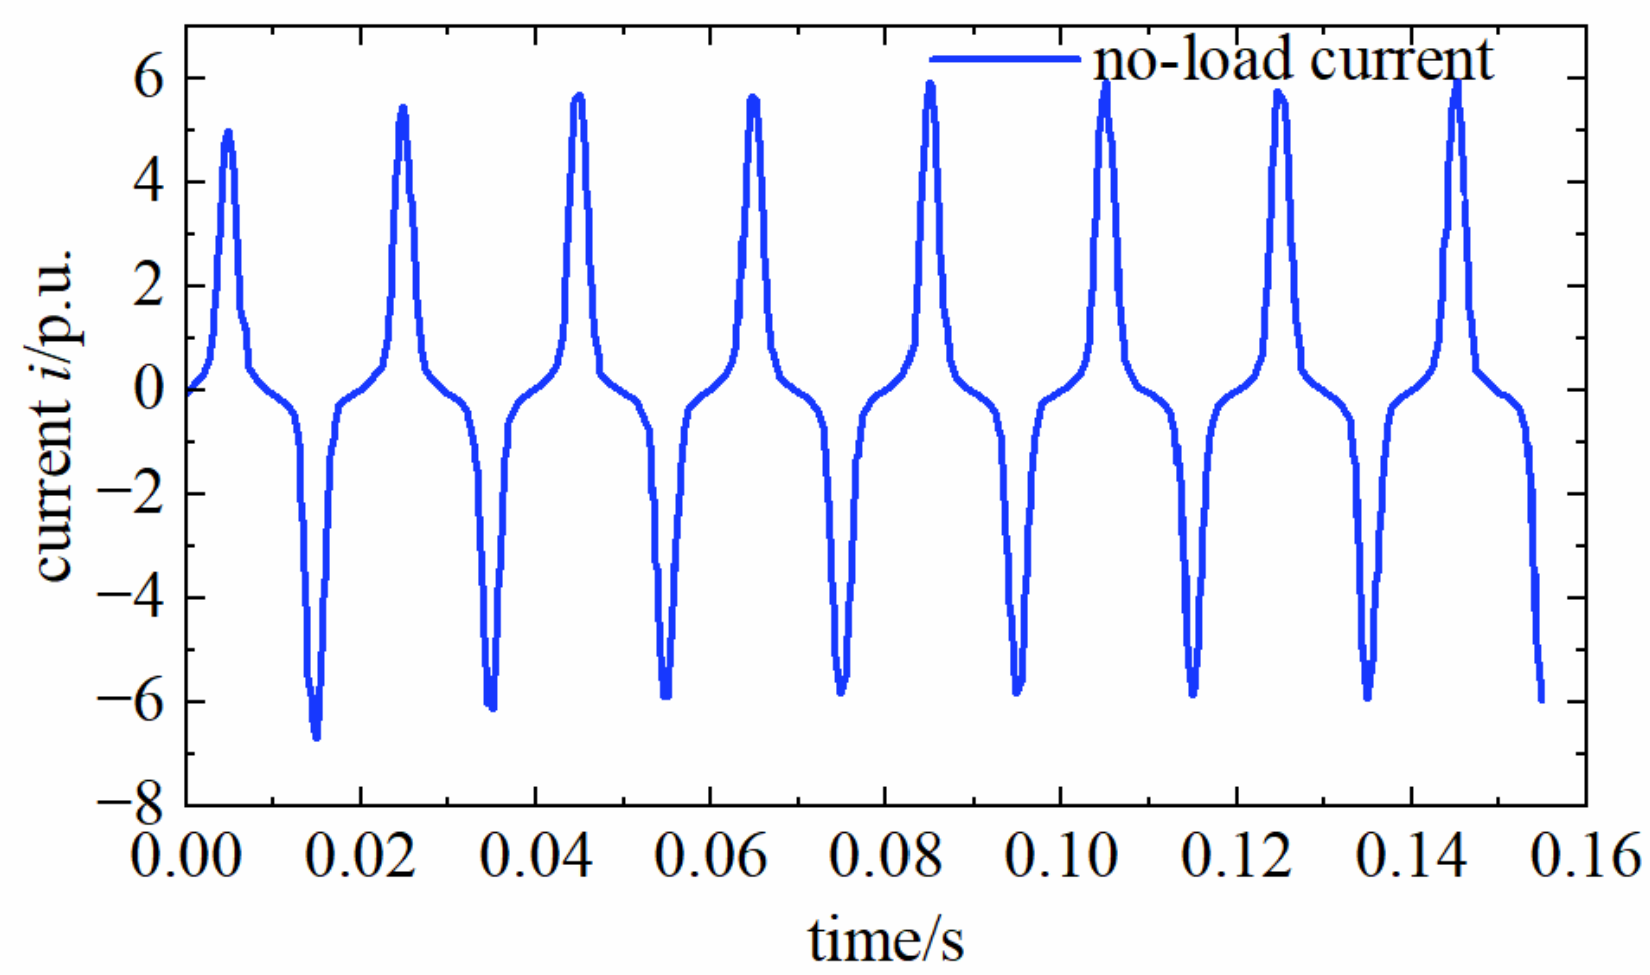
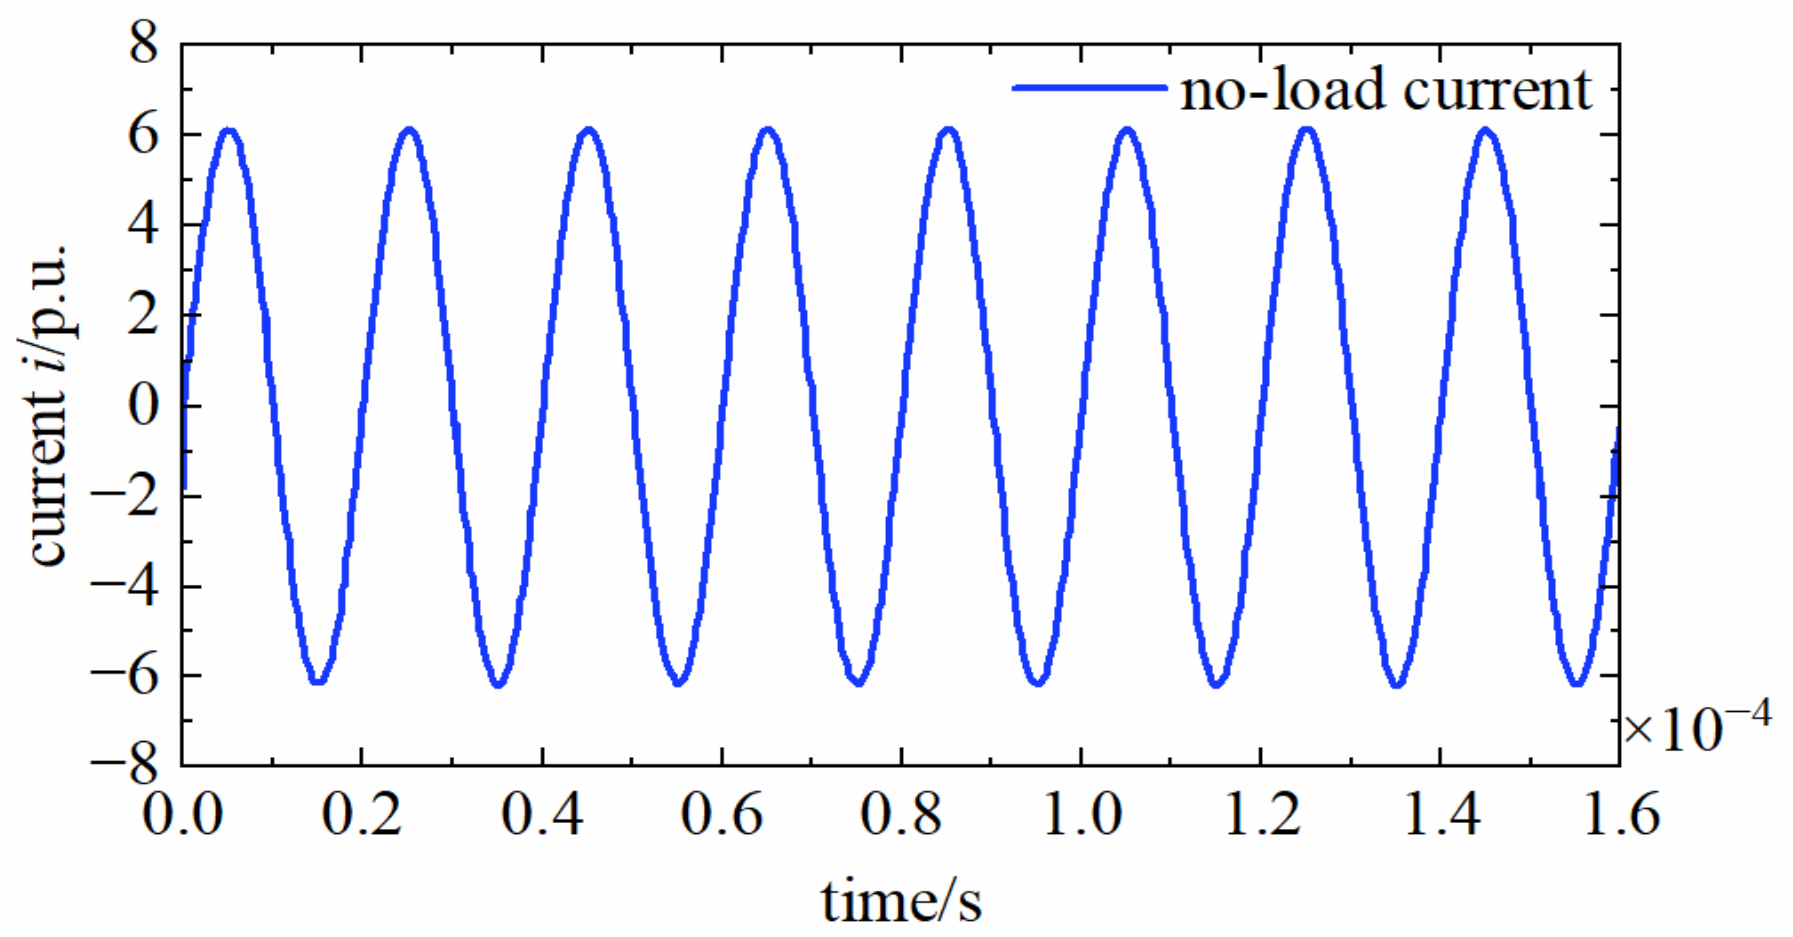
The electromagnetic model developed in this section was implemented in MATLAB/Simulink with an excitation frequency of 50 Hz. The no-load current response was evaluated under different excitation amplitudes. First, the rated primary voltage of 27.5 kV was applied to obtain the no-load current response shown in Figure 12. The primary-side RMS voltage was then increased to 33 kV while maintaining the excitation frequency at 50 Hz to establish the power-frequency overexcitation condition shown in Figure 13.
These results confirm that the proposed model reproduces the progressive intensification of nonlinear distortion as the excitation voltage rises under power-frequency conditions. To further examine the frequency sensitivity of the complete model response, an additional simulation was performed at an elevated excitation frequency while maintaining a constant voltage amplitude.
It can be seen that the established duality-derived electromagnetic model simulation circuit accurately reflects the operating state of the core. As the voltage amplitude increases, the operating point of the core moves along the hysteresis loop toward the saturation region, with nonlinear effects gradually intensifying, which is a key characteristic of the transformer magnetization process. Subsequently, the excitation frequency was increased from 50 Hz to 50 kHz while the voltage amplitude remained constant, as shown in Figure 14.
It should be emphasized that this case does not maintain a constant V/f ratio. For sinusoidal excitation, the peak core flux density is approximately inversely proportional to the excitation frequency when the voltage amplitude remains constant. Therefore, the substantial increase in frequency markedly reduces the peak core flux density and moves the operating point away from the saturation region. As a result, the nonlinear distortion of the no-load current is significantly weakened and the waveform becomes approximately sinusoidal. In summary, under power-frequency excitation, the proposed electromagnetic model effectively captures the nonlinear saturation behavior of the core magnetization process, including the distortion of the no-load current caused by core saturation. Under high-frequency excitation with a constant voltage amplitude, the model reflects the combined effects of the increased excitation frequency and the corresponding reduction in peak core flux density. Therefore, this case provides a constant-voltage frequency-sensitivity analysis of the model response. In addition, the Foster network fitted up to 1 MHz provides a frequency-dependent impedance representation of the transformer core, enabling the model to account for the variation in core impedance over a wide frequency range.


3. Experimental Validation of the Proposed Electromagnetic Model

To validate the proposed electromagnetic model, experimental measurements obtained from the 250 kVA prototype under controlled excitation conditions are compared with the corresponding simulation results.

3.1. Establishment of Electromagnetic Parameter Measurement Platform

The experimental validation in this study focuses on two 50 Hz excitation conditions: rated excitation and power-frequency overexcitation. These two conditions are used to evaluate the model response in the normal magnetization region and in the pronounced nonlinear saturation region, respectively. A 250 kVA small-scale prototype was selected for model validation according to the rated design parameters and constraints of the on-board traction transformer.
A no-load test platform was established using the 250 kVA on-board traction-transformer prototype. The measured primary-side current waveforms were compared directly with the corresponding model predictions under different excitation levels. The design parameters of the prototype are shown in Table 3 and Table 4.
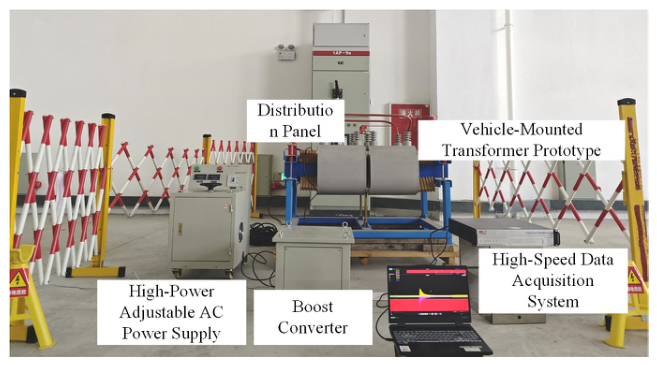
This test platform measures relevant electromagnetic parameters of on-board traction transformer prototypes under both rated power-frequency excitation and power-frequency overexcitation, verifying the accuracy of the duality-derived electromagnetic model established in this paper. The electromagnetic parameter measurement platform primarily comprises a power supply system, a compact prototype of the on-board traction transformer, and a high-speed data acquisition system, as shown in Figure 15. The power supply system includes a distribution box, a high-power adjustable AC power supply, and a boost converter. The acquired waveforms are displayed and recorded on a PC.

3.2. Experimental Validation of the Duality-Derived Electromagnetic Model

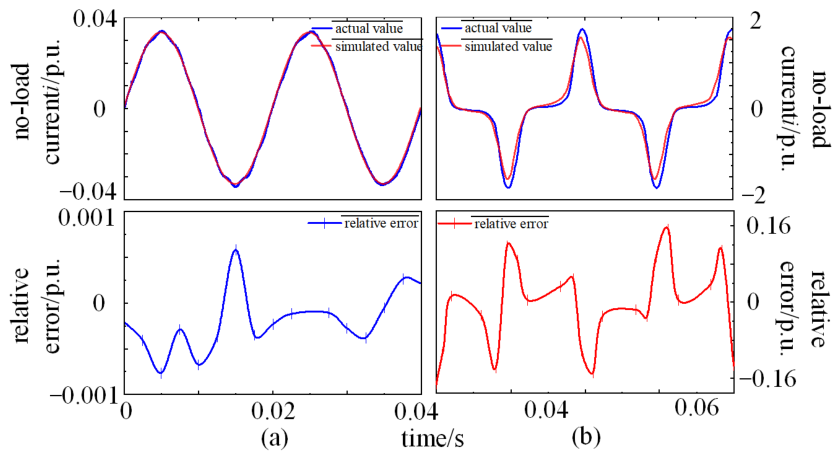
The 250 kVA on-board traction-transformer prototype serves as an electromagnetically representative experimental platform for validating the proposed modeling methodology. The electromagnetic design-base voltage of the prototype is 25 kV. In practical traction power-supply systems, the terminal voltage is commonly raised to 27.5 kV to compensate for voltage drop along the traction power-supply line. Accordingly, 27.5 kV is adopted as the reference operating voltage in the present experiment, and the term “rated-voltage excitation” used in the following analysis refers to this 27.5 kV terminal-voltage condition. To validate the accuracy of the established duality-derived electromagnetic model, the excitation was first set to a 27.5 kV sinusoidal voltage at power frequency. With the secondary side of the prototype kept unloaded, the data acquisition system captured the steady-state no-load current waveform data on the primary side. Then, while maintaining the excitation frequency at 50 Hz, the voltage amplitude was increased to establish the power-frequency overexcitation condition, and the corresponding primary-side no-load current waveform was recorded. Finally, these results were compared with the simulation results from the duality-derived electromagnetic model. The waveform results and error trends obtained from simulation and testing are shown in Figure 16. To quantitatively evaluate the agreement between simulation and experiment, the RMS relative error, normalized root-mean-square error (NRMSE), and maximum relative error were employed.
Under rated power-frequency excitation, the simulated no-load current waveform agrees closely with the measured waveform. Under rated power-frequency excitation, the RMS relative error and NRMSE are 0.09% and 0.96%, respectively, while the maximum relative error is approximately 2.90%. The close agreement indicates that the proposed model accurately reproduces the measured no-load current characteristics under rated excitation. Furthermore, by increasing the voltage excitation amplitude and comparing the primary-side no-load current response waveform with simulation, it is evident that under power-frequency overexcitation, the simulation values exhibit greater error fluctuations compared to steady-state conditions. Under power-frequency overexcitation, the NRMSE increases to 4.14%, while the maximum relative error reaches 9.37% near the distorted current peak. Compared to steady-state responses, power-frequency overexcitation produced stronger core saturation and more pronounced nonlinear current distortion, resulting in more severe distortion of the no-load current waveform. Overall, the simulated no-load current waveforms agree well with the experimental measurements obtained from the prototype test platform under both rated power-frequency excitation and power-frequency overexcitation. The close agreement demonstrates that the proposed nonlinear transformer model can accurately reproduce the no-load current response within the investigated excitation range.
4. Conclusions

This study developed a duality-derived electromagnetic model for an on-board traction transformer under power-frequency overexcitation conditions. By incorporating a J–A hysteresis operator into a frequency-dependent Foster network, the proposed model simultaneously represents core hysteresis nonlinearity, saturation characteristics, and frequency-dependent losses within an equivalent-circuit framework. This approach provides a physically interpretable method for describing the nonlinear electromagnetic response of traction transformers under different excitation conditions.
The proposed model was evaluated through simulations and experimental tests using a 250 kVA prototype. Under 50 Hz rated excitation, the maximum relative error between the simulated and measured no-load current waveforms was 2.90%. Under power-frequency overexcitation conditions, the maximum relative error was 9.37%. The results demonstrate that the proposed model can effectively reproduce the increase in current distortion and peak-current variation caused by core saturation.
From an engineering application perspective, the proposed model provides an efficient approach for analyzing the electromagnetic response of on-board traction transformers under overexcitation conditions. By accurately describing core hysteresis behavior and frequency-dependent loss characteristics, it can support transient analysis and performance evaluation of traction transformers. Meanwhile, the equivalent-circuit-based formulation avoids the high computational cost associated with detailed electromagnetic field calculations, providing higher computational efficiency.
It should be noted that the proposed model is developed for the investigated on-board traction transformer. When applied to transformers with different configurations, the corresponding magnetic-circuit topology and electrical parameters need to be recalculated according to the specific transformer characteristics. For example, extending the model to three-phase traction transformers requires further consideration of phase coupling and magnetic-circuit characteristics.

Author Contributions

Conceptualization, L.W.; data analysis and interpretation, L.W. and X.Z.; writing—original draft preparation, Y.Y.; writing—review and editing, L.W.; data curation, Y.Y. and X.C.; visualization, Y.Y. and X.C.; experimental setup and data acquisition, H.Z.; validation, H.Z.; parameter optimization, X.Z.; experimental assistance and data verification, T.T.; literature search and organization, Y.Y., X.C. and T.T. All authors have read and agreed to the published version of the manuscript.

Funding

This research received no external funding.

Data Availability Statement

The data presented in this study are available on request from the corresponding author.

Conflicts of Interest

Author Hailong Zhang was employed by State Grid Jiangsu Electric Power Co., Ltd., Fengxian County Power Supply Branch. Authors Xiu Zhou and Tian Tian were employed by Electric Power Research Institute, State Grid Ningxia Electric Power Co., Ltd., State Grid Corporation of China. The remaining authors declare that the research was conducted in the absence of any commercial or financial relationships that could be construed as a potential conflict of interest.

Abbreviations

The following abbreviations are used in this manuscript:
J–AJiles–Atherton
PSOParticle Swarm Optimization
RMSRoot mean square
NRMSENormalized root mean square error

References

  1. Du, X.; Pan, J.; Guzzomi, A. Modeling the Hysteresis Characteristics of Transformer Core under Various Excitation Level via On-Line Measurements. Electronics 2018, 7, 390. [Google Scholar] [CrossRef] [Scilit]
  2. Wang, L.; Li, Z.; Lu, H.; Zhou, F.; Diao, Y. Modeling and Simulation of Wide-Frequency Characteristics of Electromagnetic Standard Voltage Transformer. Electronics 2024, 13, 4206. [Google Scholar] [CrossRef] [Scilit]
  3. Bhowmick, S.; Nandi, S. Online Detection of an Interturn Winding Fault in Single-Phase Distribution Transformers Using a Terminal Measurement-Based Modeling Technique. IEEE Trans. Power Deliv. 2015, 30, 1007–1015. [Google Scholar] [CrossRef] [Scilit]
  4. Fu, Q.; Zhu, J.; Mao, Z.-H.; Zhang, G.; Chen, T. Online Condition Monitoring of Onboard Traction Transformer Core Based on Core-Loss Calculation Model. IEEE Trans. Ind. Electron. 2018, 65, 3499–3508. [Google Scholar] [CrossRef] [Scilit]
  5. Wu, Y.; Che, Y.; Wang, Q.; Zhang, J.; Li, X.; Tang, X. A Wide-Band Modeling Research of Voltage Transformer in EMU. Electronics 2023, 12, 2844. [Google Scholar] [CrossRef] [Scilit]
  6. Liu, Y.; Li, C.; Guo, Z.; Ren, F.; Liu, F.; Fu, Y.; Zhu, Y.; Wang, X. Broadband Modelling of Power Transformers for Sweep Frequency Impedance Studies on Winding Short-Circuit Faults. Electronics 2023, 12, 4068. [Google Scholar] [CrossRef] [Scilit]
  7. Li, T.; Li, S.; Liu, Z.; Lu, S.; Qiao, Y.; Xia, J.; Li, Z. Design and Optimization of a Perfectly Symmetric Planar Spiral Receiving Coil with Low E-Field Exposure for Large-Space WPT. IEEE J. Emerg. Sel. Top. Power Electron. 2025, 13, 4086–4097. [Google Scholar] [CrossRef] [Scilit]
  8. Woo, S.; Shin, Y.; Rhee, J.; Huh, S.; Ahn, S. Design of Resonant Circuit Components to Suppress Both EMF and EMI in Wireless Power Transfer Systems for Electric Vehicles. IEEE J. Emerg. Sel. Top. Power Electron. 2025, 13, 4358–4368. [Google Scholar] [CrossRef] [Scilit]
  9. Jazebi, S.; Zirka, S.E.; Lambert, M.; Rezaei-Zare, A.; Chiesa, N.; Moroz, Y.; Chen, X.; Martinez-Duro, M.; Arturi, C.M.; Dick, E.P.; et al. Duality Derived Transformer Models for Low-Frequency Electromagnetic Transients—Part I: Topological Models. IEEE Trans. Power Deliv. 2016, 31, 2410–2419. [Google Scholar] [CrossRef] [Scilit]
  10. Jazebi, S.; Rezaei-Zare, A.; Lambert, M.; Zirka, S.E.; Chiesa, N.; Moroz, Y.I.; Chen, X.; Martinez-Duro, M.; Arturi, C.M.; Dick, E.P.; et al. Duality-Derived Transformer Models for Low-Frequency Electromagnetic Transients—Part II: Complementary Modeling Guidelines. IEEE Trans. Power Deliv. 2016, 31, 2420–2430. [Google Scholar] [CrossRef] [Scilit]
  11. Pordanjani, S.R.; Naïdjate, M.; Bracikowski, N.; Fratila, M.; Mahseredjian, J.; Rezaei-Zare, A. Electromagnetic Modeling of Transformers in EMT-Type Software by a Circuit-Based Method. IEEE Trans. Power Deliv. 2022, 37, 5402–5413. [Google Scholar] [CrossRef] [Scilit]
  12. Sima, W.; Peng, D.; Yang, M.; Sun, P.; Zou, B.; Xiong, Z. Reversible Wideband Hybrid Model of Two-Winding Transformer Including the Core Nonlinearity and EMTP Implementation. IEEE Trans. Ind. Electron. 2021, 68, 3159–3169. [Google Scholar] [CrossRef] [Scilit]
  13. Yang, M.; Kazemi, R.; Jazebi, S.; Deswal, D.; de León, F. Retrofitting the BCTRAN Transformer Model with Non-Linear Magnetizing Branches for the Accurate Study of Low-Frequency Deep Saturating Transients. IEEE Trans. Power Deliv. 2018, 33, 2344–2353. [Google Scholar] [CrossRef] [Scilit]
  14. Liu, J.; Dinavahi, V. Nonlinear Magnetic Equivalent Circuit-Based Real-Time Sen Transformer Duality-derived electromagnetic model on FPGA for HIL Emulation. IEEE Trans. Power Deliv. 2016, 31, 2483–2493. [Google Scholar] [CrossRef] [Scilit]
  15. Jiles, D.C.; Atherton, D.L. Theory of Ferromagnetic Hysteresis. J. Magn. Magn. Mater. 1986, 61, 48–60. [Google Scholar] [CrossRef] [Scilit]
  16. Zirka, S.E.; Moroz, Y.I.; Moses, A.J.; Arturi, C.M. Static and Dynamic Hysteresis Models for Studying Transformer Transients. IEEE Trans. Power Deliv. 2011, 26, 2352–2362. [Google Scholar] [CrossRef] [Scilit]
  17. Kuznetsov, V. Improved Jiles–Atherton Magnetic Core Model and Its SPICE Implementation. Electronics 2026, 15, 1009. [Google Scholar] [CrossRef] [Scilit]
  18. Gustavsen, B.; Semlyen, A. Rational Approximation of Frequency Domain Responses by Vector Fitting. IEEE Trans. Power Deliv. 1999, 14, 1052–1061. [Google Scholar] [CrossRef] [Scilit]
  19. Avila-Rosales, J.; Alvarado, F.L. Nonlinear Frequency Dependent Transformer Model for Electromagnetic Transient Studies in Power Systems. IEEE Trans. Power Appar. Syst. 1982, PAS-101, 4281–4288. [Google Scholar] [CrossRef] [Scilit]
  20. de León, F.; Semlyen, A. Time Domain Modeling of Eddy Current Effects for Transformer Transients. IEEE Trans. Power Deliv. 1993, 8, 271–280. [Google Scholar] [CrossRef] [Scilit]
  21. Avila-Rosales, J.; Semlyen, A. Iron Core Modeling for Electrical Transients. IEEE Trans. Power Appar. Syst. 1985, PAS-104, 3189–3194. [Google Scholar] [CrossRef] [Scilit]
  22. Li, W.; Zhou, L.; Chen, J.; Liu, B.; Gao, S.; Zhang, C.; Wang, D. Numerical Model for Eddy-Current Loss of Wound Core in Single-Phase Transformer. IEEE Trans. Transp. Electrif. 2024, 10, 150–162. [Google Scholar] [CrossRef] [Scilit]
Figure 1. The configuration of the traction transformer with the critical structural parameters.
Electronics 15 03793 g001
Figure 2. Physical structure of the on-board traction transformer.
Electronics 15 03793 g002
Figure 3. Equivalent magnetic circuit of the on-board traction transformer.
Electronics 15 03793 g003
Figure 4. Duality-derived equivalent circuit of the on-board traction transformer.
Electronics 15 03793 g004
Figure 5. Vector-fitting results for the frequency-dependent core impedance.
Electronics 15 03793 g005
Figure 6. Sixth-order Foster network representing the frequency-dependent core impedance.
Electronics 15 03793 g006
Figure 7. Optimized core equivalent topology incorporating the J–A hysteresis model.
Electronics 15 03793 g007
Figure 8. Rising sinusoidal excitation voltage waveform.
Electronics 15 03793 g008
Figure 9. Hysteresis loop under rising sinusoidal excitation.
Electronics 15 03793 g009
Figure 10. Asymmetric harmonic excitation test results. (a) Voltage. (b) Magnetic flux. (c) Current.
Electronics 15 03793 g010
Figure 11. Duality-derived electromagnetic model of the on-board traction transformer with ideal-transformer connections.
Electronics 15 03793 g011
Figure 12. No-load current response under rated power-frequency excitation.
Electronics 15 03793 g012
Figure 13. No-load current response under power-frequency overexcitation.
Electronics 15 03793 g013
Figure 14. No-load current response under 50 kHz excitation with a constant voltage amplitude.
Electronics 15 03793 g014
Figure 15. Electromagnetic-parameter measurement platform for the on-board traction-transformer prototype.
Electronics 15 03793 g015
Figure 16. Comparison between simulated and measured primary-side no-load current waveforms. (a) Under power-frequency rated voltage excitation. (b) Under power-frequency overexcitation.
Electronics 15 03793 g016
Table 1. Critical parameters of the traction transformer.
PrimarySecondary
Rated Voltage (kV)27.54 × 1.85
Rated Current (A)2344 × 790
Rated Capacity (kVA)63004 × 1575
Stray Capacitance (nF)4.882.79
Resistance (Ω)10.480.038
Leakage Inductance (mH)2901.65
Number of Turns20004 × 150
Height (mm)440450
Inner diameter of winding (mm)400270
External diameter of winding (mm)540385
Table 2. Foster equivalent circuit element parameters.
OrderRk (Ω)Lk (H)
16.8786 × 1061.0038 × 10−3
21.9430 × 1064.6966 × 10−3
39.3120 × 1041.6296 × 10−2
41.0802 × 1042.5205 × 10−2
51.3419 × 1032.7202 × 10−1
61.4341 × 10−48.0250 × 10−1
Table 3. Structural parameters of the 250 kVA small-scale prototype.
ParameterValue
Core diameter120 mm
High-voltage winding conductor cross-sectional area0.22 mm2
Low-voltage winding conductor cross-sectional area1.91 mm2
High-voltage winding turns5158
Low-voltage winding turns392
Table 4. Electrical parameters of the 250 kVA small-scale prototype.
ParameterPrimarySecondary
Rated voltage (kV)254 × 1.9
Rated current (A)1032.895
Rated capacity (kVA)2504 × 62.5005
Frequency (Hz)50
Disclaimer/Publisher’s Note: The statements, opinions and data contained in all publications are solely those of the individual author(s) and contributor(s) and not of MDPI and/or the editor(s). MDPI and/or the editor(s) disclaim responsibility for any injury to people or property resulting from any ideas, methods, instructions or products referred to in the content.