1. Introduction
Issues regarding the analysis of the DC link in frequency converters represent one of the most critical research topics in electromobility and converter-fed drives today, especially in FTC (fault-tolerant control) systems. While modern electric vehicles (EVs) increasingly utilize active front-end (AFE) topologies for on-board applications, uncontrolled diode rectifiers remain highly relevant and widely deployed. They are the industry standard for general-purpose industrial variable-frequency drives (VFDs) due to their robust design, cost-effectiveness, and simplicity. Moreover, in the broader context of electromobility, off-board high-power DC fast-charging infrastructures still frequently rely on diode- or thyristor-based front-ends for the primary AC/DC rectification stage before the DC/DC conversion. Therefore, condition monitoring of DC-link capacitors in diode-based topologies directly addresses the reliability needs of both widespread industrial automation and critical high-power EV charging infrastructure.
Conventional electrolytic capacitors, which feature a finite lifespan, require continuous monitoring, as their failure can lead to severe damage to power electronic devices. According to reports available in the literature, capacitor failures account for nearly 30% of all breakdowns in power electronic systems [
1,
2,
3] (
Table 1).
The diagnostic issues surrounding DC-link circuits are well-established and have been extensively investigated by numerous research centers worldwide [
1,
2,
3,
4,
5,
6,
7,
8,
9,
10,
11,
12,
13,
14,
15,
16,
17,
18,
19,
20,
21,
22,
23,
24].
In the rapidly growing field of electromobility, both onboard converters and off-board charging infrastructures operate under severe environmental and electrical stress. Thermal stress and power losses significantly accelerate the degradation of power electronic components. For instance, recent power loss analyses and thermal assessments on wireless electric vehicle charging technologies have highlighted that the over-temperature risk of ground assemblies requires critical attention to prevent premature system failure [X]. Similarly, in conventional converters, elevated temperatures exponentially accelerate the evaporation of the electrolyte in DC-link capacitors, leading to a capacitance drop and an ESR increase. Thus, accurately monitoring these parameters is vital to maintaining overall system reliability [
25,
26,
27].
Prior studies have comprehensively analyzed voltage supply asymmetry and its direct impact on the state variables within the DC link [
5,
14]. Furthermore, the literature has addressed the influence of specific load profiles and pulsating operational modes on the resulting DC-link voltage and current waveforms [
11]. Significant research effort has been dedicated to estimating capacitor capacitance (C) and equivalent series resistance (ESR) [
1,
2,
3,
7,
8,
9,
10,
11,
12,
13,
14,
15,
16,
17,
18,
19,
20,
21,
22,
23,
24]. The methodologies proposed in these works typically rely on mathematical models—characterized by varying degrees of simplification—to estimate these core parameters. Fast Fourier Transform (FFT) analysis is frequently utilized as a baseline tool for examining variable-frequency signals [
8,
15,
21]. Additionally, several studies have leveraged higher-order statistics (HOS) [
4,
5,
6,
8,
12,
18,
19,
20] or artificial intelligence (AI) techniques [
6,
7,
22,
23].
Although this research domain experienced intense development during the 1990s and early 2000s, as evidenced by the literature [
1,
2,
3,
4,
5,
6,
7,
8,
9,
10,
11,
12,
13,
14,
15,
16,
17,
18,
19,
20,
21,
22,
23,
24], a misconception has emerged that existing capacitance estimation tools are sufficiently optimized and require no further advancement. However, the recent evolution of microprocessor systems, AI, and advanced time–frequency analysis methods enables the development of more robust estimation techniques. These modern approaches can track capacitance variations even under highly dynamic grid or load disturbances [
5]. Historically, bispectrum and wavelet analyses were not widely adopted for DC-link diagnostics [
5]. Driven by technological advancements, this paradigm is shifting; recent publications demonstrate that higher-order methods can successfully transcend traditional algorithmic frameworks and simple FFT metrics. Accordingly, this work utilizes wavelet and bispectrum analyses to detect supply grid asymmetry directly within DC-link signals [
5]. While grid asymmetry might initially appear to be a trivial issue, it is systematically overlooked in many diagnostic frameworks; conventional literature predominantly evaluates capacitance degradation using waveforms that assume ideal, undistorted diode rectifier operations.
Furthermore, DC-link diagnostics are often isolated from research communities focused on electrical machinery diagnostics. This disconnect frequently leads to false-positive conclusions during the frequency-domain analysis of inverter output signals [
6]. For instance, a diagnosed 100 Hz spectral component may be erroneously attributed to bearing, stator, or rotor faults, whereas it actually stems from supply grid asymmetry. Such asymmetry forces a three-phase diode rectifier into an unintended two-pulse operation mode rather than its nominal six-pulse behavior [
5,
6]. Consequently, these interrelated diagnostic phenomena are highly significant and warrant deeper investigation.
Regardless of the capacitor type, the wear-out process manifests as a decrease in the capacitance value, which consequently weakens the voltage ripple damping capabilities of the DC link.
This paper presents a novel approach to monitoring the technical condition of DC-link capacitors in three-phase frequency converters.
An algorithm based on higher-order statistics (HOS) for the DC bus voltage ripple signal is proposed.
The paper demonstrates that linear spectral coherence analysis allows for effective separation of capacitor aging effects from varying load operating conditions. Despite the development of various condition monitoring techniques, existing methods present significant trade-offs between computational burden and estimation accuracy.
Table 2 provides a quantitative and qualitative comparison of the proposed integrated time–frequency slope analysis against established prior methods.
Standard FFT methods offer low computational complexity but suffer from estimation errors up to 10% due to spectral leakage under varying load conditions. Conversely, artificial intelligence (AI) and data-driven approaches achieve excellent accuracy (errors often below 3%) but require extensive pre-training datasets and high-performance hardware, limiting their deployment in cost-effective industrial drives. The proposed method bridges this gap. By combining DC-bus voltage ripple slope analysis with targeted harmonic decomposition, it eliminates the need for large datasets and complex neural networks, maintaining low computational requirements suitable for standard digital signal processors (DSPs) while maintaining the capacity estimation error at a satisfactory level.
The method was validated in the MATLAB (R2024b) environment, demonstrating high sensitivity to changes in the C and ESR (equivalent series resistance) parameters. The simulation results were verified on an experimental setup that allows for the analysis of capacitance changes in DC-link circuits.
2. Introduction to the DC-Bus Voltage Circuit Analysis
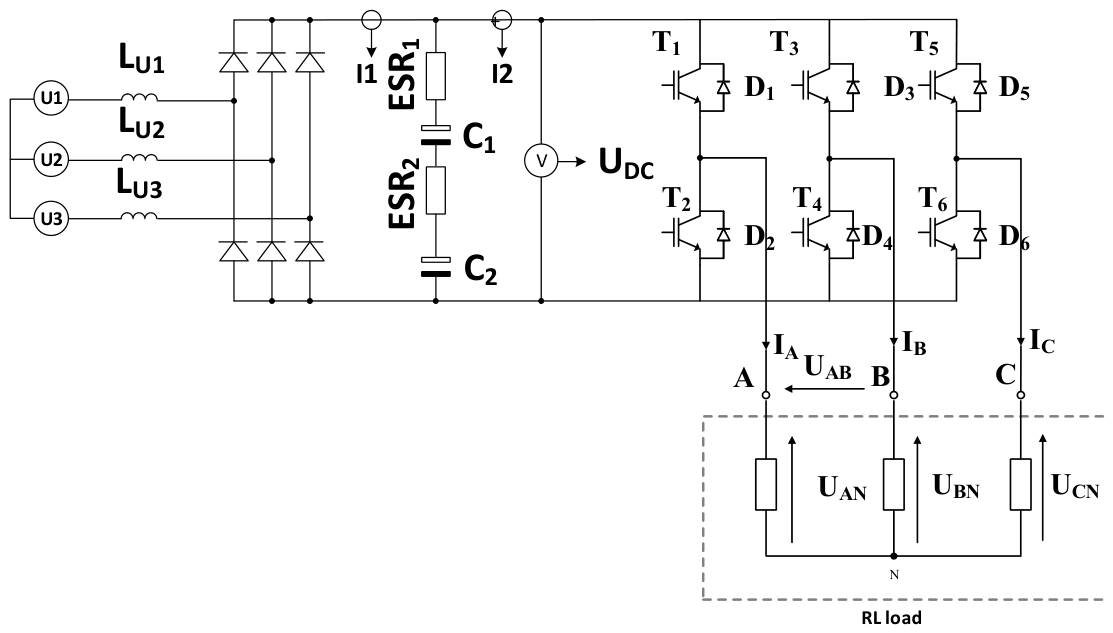
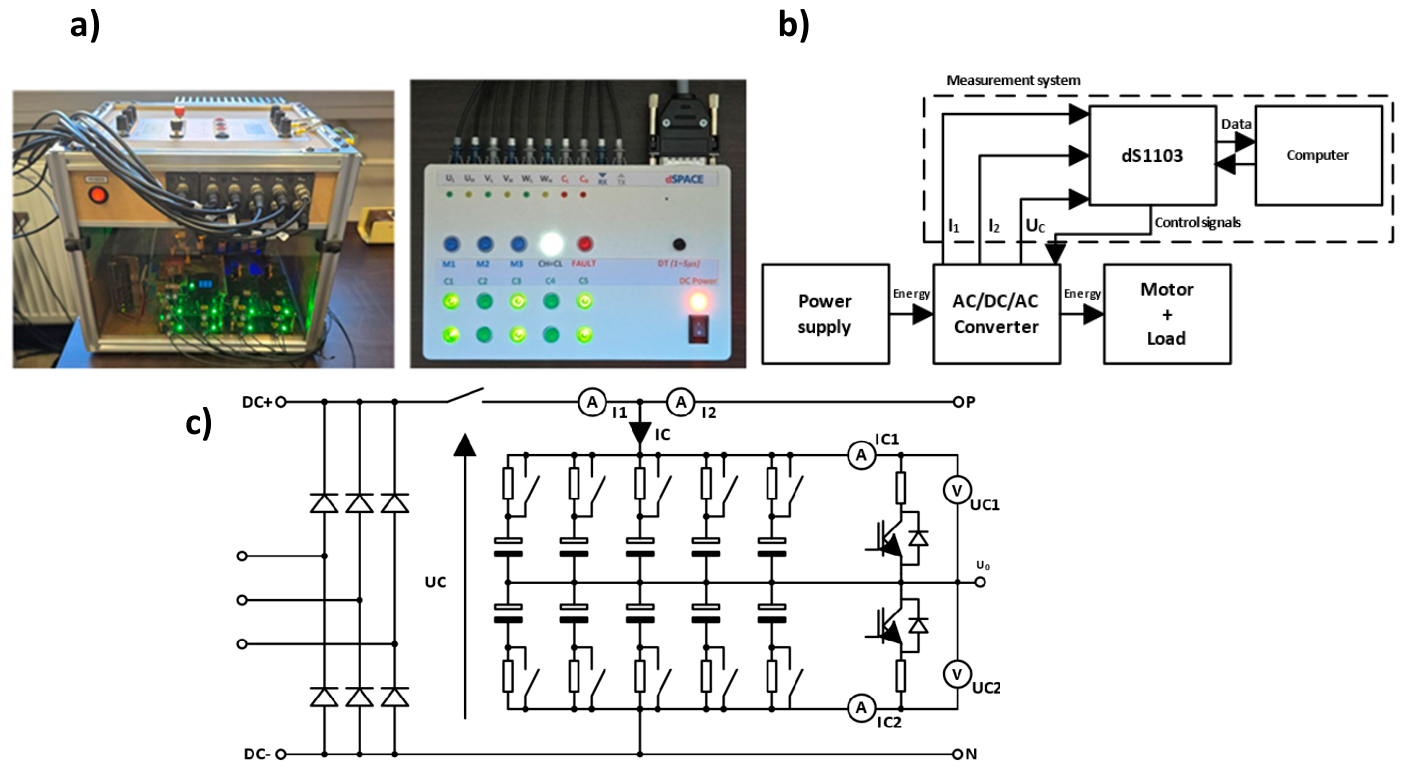
The test object was a frequency converter with a classic six-pulse diode rectifier. The output stage was a two-level voltage inverter with an RL load. A detailed diagram of the converter is shown in
Figure 1.
The output signal from an uncontrolled diode rectifier, depending on the load, is very characteristic. The pulse values depend on the capacitance values of the capacitors in the intermediate circuit. Analyzing the pulse trend allows detecting changes in capacitor capacitance. These changes are also determined by changes in the internal resistance (ESR), which in turn is naturally related to the aging of these components. A previous study [
5] presents the effect of capacitance on the shape of the output DC voltage. Analysis of the shape itself can be used as a diagnostic signal indicating the ongoing degradation process in the DC circuit. However, the shape of the output voltage pulse envelope does not provide clear information about the capacitor’s capacitance value.
This article attempts to utilize both the shape of the UDC voltage pulses and their rate of change by analyzing the so-called sliding regression trend of voltage changes—analyzing changes in the dUDC/dt signal. This approach allows for the fastest detection of aging changes while minimizing the impact of changes in the ESR value.
For the UDC voltage, as previously mentioned, the characteristic signal is a 300 Hz signal. Both asymmetry in the power supply circuit and capacitance changes (or ESR) influence changes in this frequency band. Therefore, it seems that frequency-selective analysis based on the analysis of the 6 × fsN signal may be crucial in diagnosing the intermediate circuit in frequency converters.
In order to conduct a detailed analysis of the phenomena occurring in the intermediate circuit, a detailed description of this part of the frequency converter is necessary. This real capacitor model enables the representation of the relationship between its terminal voltage
u and current
i and the incorporation of the capacitance
C and the equivalent series resistance
ESR, as shown in (1). Furthermore, the magnitude of the impedance ∣
Z∣ can be described in the frequency domain as a function of the angular frequency
ω (2). By combining the mathematical models of the DC-link capacitors (1) and (2) with the impedance magnitude derived from the root-mean-square (RMS) or mean values of voltage
UDC and current
I (3), it is demonstrated that the synchronized analysis of these two signals is sufficient for accurate capacitance and
ESR assessment [
16]:
where
i—current,
u—voltage,
I—mean current,
UDC—mean voltage,
C—capacitance,
ESR—equivalent series resistance,
Z—impedance,
ω—electrical pulsation, and
t—time.
In the proposed model, the DC-link parameters are represented by capacitance (
C) and equivalent series resistance (
ESR) components. Other adjustable parameters include line inductances and supply voltages, as the converter is fed via a three-phase autotransformer. In this study, the intermediate DC-link circuit is assumed to consist of two electrolytic capacitors connected in series. Each unit is modeled according to relations (1)–(3), incorporating its individual capacitance Cn and equivalent series resistance
ESRn. In this configuration, the equivalent parameters of the entire bank are determined by the summation of the individual component impedances. The total system impedance
Zt and the resultant parameters
ESRt and
Ct are defined by the following relations:
The dynamics of the current
i(
t) flowing through the DC-link branch, expressed as a function of the terminal voltage
UDC(t), can be represented by the following first-order differential equation:
In order to simplify the mechanism of estimating the capacitance in the intermediate circuit, the voltage drop across the ESR resistance in Equation (1) can be neglected. With this simplification, the equation describing the dependence of the current on the voltage and capacitance takes the following form:
To correctly estimate the capacitance of a capacitor, the current flowing through its branch during the discharge phase should be analyzed. At this point, the capacitor is the source of energy for the load. The capacitor current at this operating point is approximately equal to the load current, which allows the capacitor capacitance to be determined from the following relationship:
where
determines the discharge slope of the capacitor.
Additionally, for a system with a six-pulse rectifier, a relationship will be provided that will allow for demonstrating the dependence of the estimated capacitance on the ESR value:
This relationship implies that analyzing only the ripple amplitude does not allow for precise determination of the capacitor’s capacitance. It is also necessary to analyze the steepness of the slope at the moment of capacitor discharge.
3. Capacity Estimation Algorithm
The method described in this article is a highly technical method that requires proper signal preparation. This solution is ideal for industrial applications.
STAGE 1: Removal of the DC component from the analyzed UDC signal.
STAGE 2: Stroboscopic segmentation. The measured UDC voltage, with the DC component eliminated, is divided into windows with a length equal to the supply voltage period (20 ms).
STAGE 3: Independent analysis is performed for each window, evaluating both the voltage signal amplitude (pulse height) and the slope (slew rate) during the capacitor discharge phase.
STAGE 4: Calculation of the capacitor current. The UDC voltage, which exhibits a pulsed nature under an inverter-type load, is filtered to eliminate the frequencies associated with semiconductor switching.
STAGE 5: Determination of the discrete derivative based on the following relationship:
STAGE 6: The calculated values are scanned to find the minimum value, which occurs at the moment of capacitor discharge.
STAGE 7: Elimination of the
ESR effect on the estimated capacitance value according to the following relationship:
STAGE 8: Auto-calibration and offset elimination.
Window Selection and Synchronization Error Analysis
A fundamental challenge in stroboscopic segmentation is the assumption of a strictly constant grid frequency (e.g., exactly 50 Hz, corresponding to a 20 ms period). Under practical industrial conditions, the grid frequency fluctuates, and applying a fixed 20 ms window leads to a cumulative phase-shift error.
Let Δt denote the synchronization error between the assumed fixed window and the actual grid period. Because the proposed algorithm relies on the maximum derivative of the voltage during the discharge phase, sampling at an offset Δt can shift the measurement window towards the charging commutation point.
A synchronization error as small as 1 ms can cause the algorithm to capture the diode conduction phase rather than the pure capacitor discharge phase, leading to severe estimation inaccuracies. To resolve this, the proposed strategy replaces the fixed window with a dynamically adjusted period (Twindow). In practical drive systems, this is achieved by utilizing grid-side Zero-Crossing Detection (ZCD) or a Software Phase-Locked Loop (SPLL). By continuously updating Twindow = 1/fgrid, the algorithm ensures that the stroboscopic grid remains perfectly aligned with the actual converter commutation cycles, rendering the estimation robust against varying grid frequencies and fluctuating load profiles.
4. Analysis of the Performance of the Capacity Estimation Algorithm
To evaluate the performance of the DC-link capacitance analysis method, the proposed algorithm was tested through simulation studies and validated on an experimental test bench.
- A.
Simulation environment
The simulation studies were conducted in the MATLAB environment. The system presented in
Figure 1 was modeled with precise consideration of the
C and
ESR values. The model parameters are specified in
Table 3.
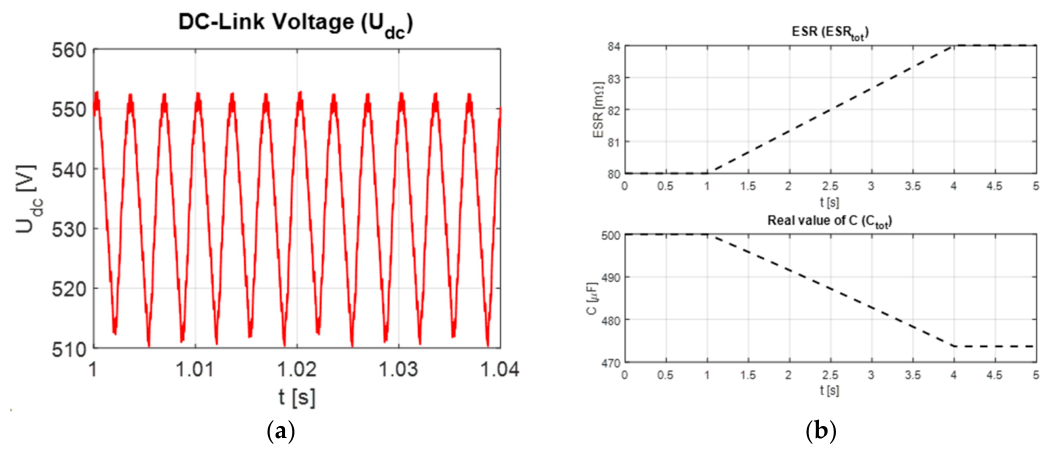
The DC-link voltage is presented in
Figure 2a. To illustrate the exact waveform shape, only a 40 ms time window is shown. It can be observed that under the nominal capacitance, the pulse shape is determined by both the capacitance value and the nature of the load.
In the study, it was assumed that the capacitor aging process begins at 1 s and ends after 4 s (
Figure 2b). The target capacitance value is reduced by 10%. Concurrently, the ESR value changes, increasing linearly by 10% over the same time interval. The behavior of the capacitance and
ESR variations is illustrated in
Figure 2b.
It is important to note that while initial degradation stages exhibit mild parameter variations, real electrolytic capacitors nearing their end-of-life (EOL) typically experience a 200% to 300% exponential increase in ESR. A key advantage of the proposed dU/dt slope estimation method over traditional amplitude-based monitoring is its inherent resilience to such severe ESR variations. Traditional methods relying on peak-to-peak voltage ripple (ΔuDC) are heavily skewed by the instantaneous voltage drop across the ESR (ΔuESR = iC ESR). In contrast, the proposed strategy analyzes the derivative of the voltage strictly during the continuous discharge phase. Because the slope du/dt is primarily governed by C and the load current, the estimation remains robust even when the ESR has doubled or tripled.
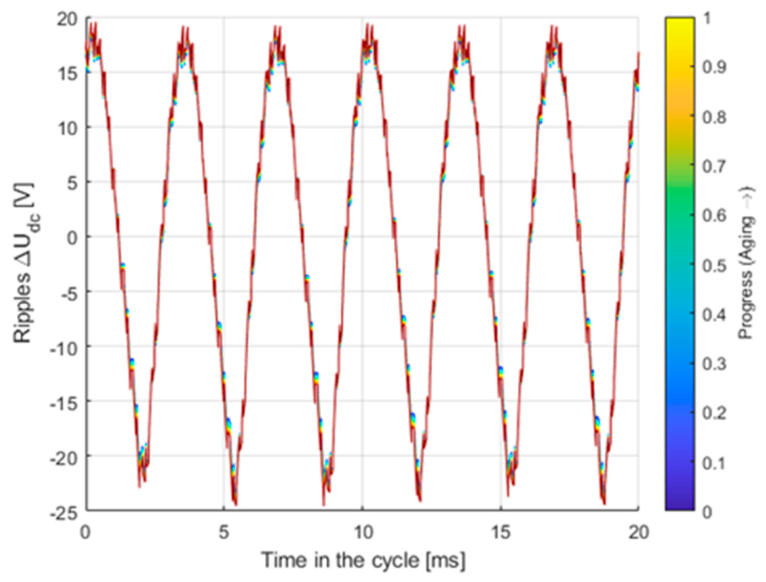
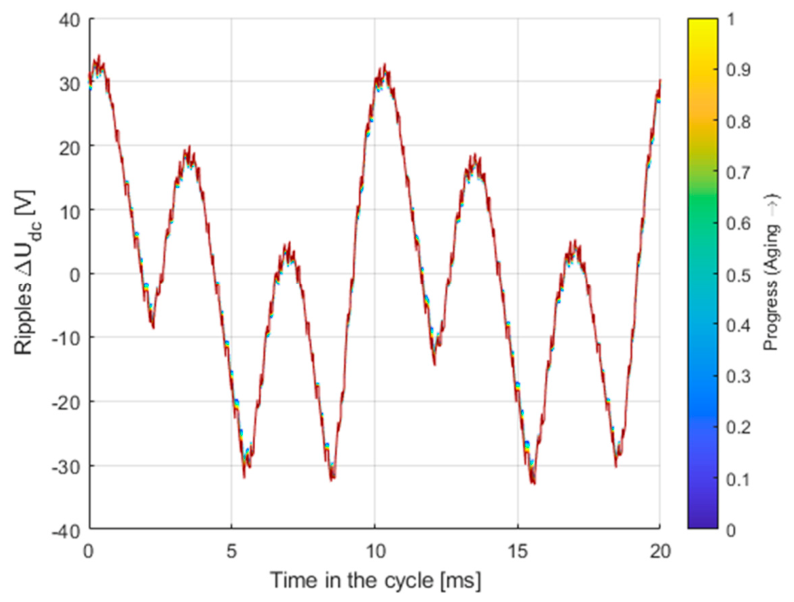
For the adopted capacitor aging scenario in the DC-link, stroboscopic segmentation was applied, enabling the observation of differences in the voltage pulses for time-synchronized waveforms during the degradation process. This analysis is presented in
Figure 3.
Superimposing the pulses enables the observation of pulse amplitude variations as the aging process progresses. However, to effectively detect these amplitude differences, it is necessary to employ alternative methods that can more clearly illustrate the variations in the
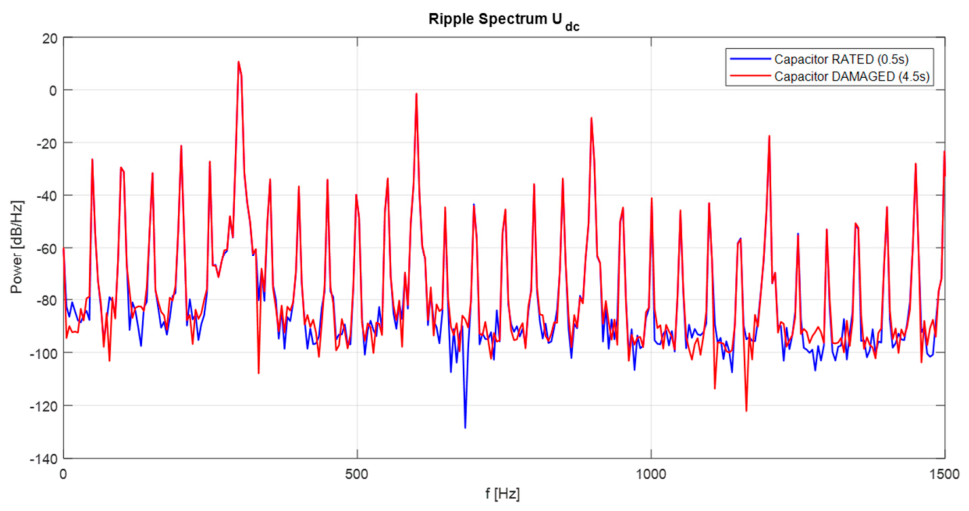
UDC voltage waveform. One of the analytical tools commonly utilized for time-domain waveform analysis is the Fast Fourier Transform (FFT). The spectrum of the
UDC voltage is presented in
Figure 4.
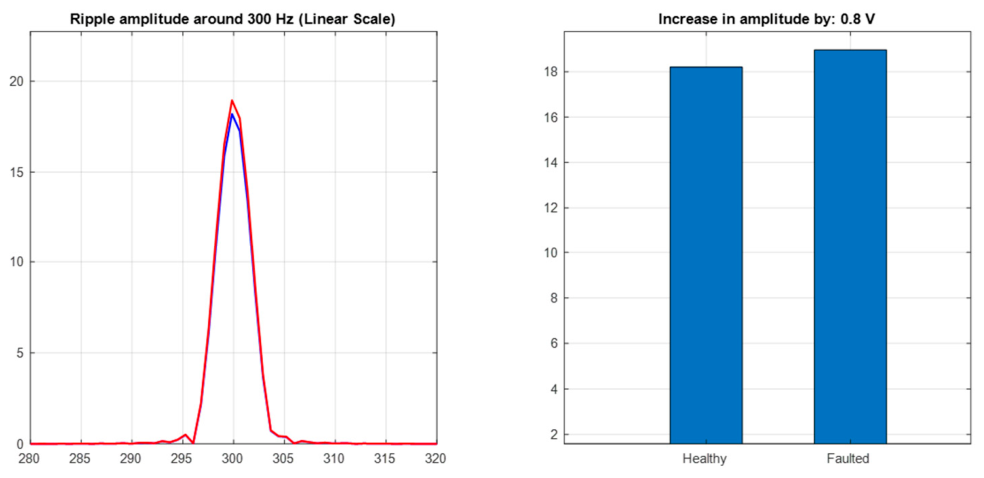
To demonstrate the variation in amplitude, the RMS values of the voltage pulses were calculated for both the nominal and degraded states. The results are presented in
Figure 5.
It can be observed that despite a relatively large change in capacitance (10%), the amplitude value increases by only 4%. Although this variation appears minor, it represents a sufficiently significant shift—as demonstrated later in this paper—to enable the estimation of the DC-link capacitance based on this parameter.
This is illustrated in detail in
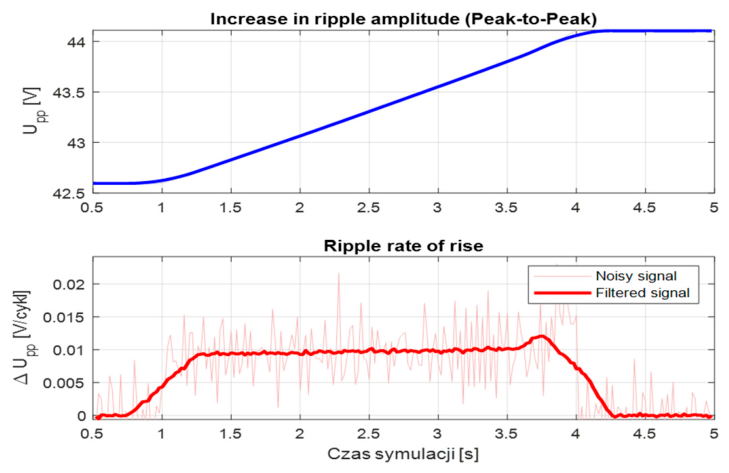
Figure 5, which shows a distinct increase of 0.8 V in the amplitude of the 300 Hz harmonic. By analyzing the ripple amplitude variations in accordance with the previously described stages, the trajectory of these changes can be observed, as presented in
Figure 6.
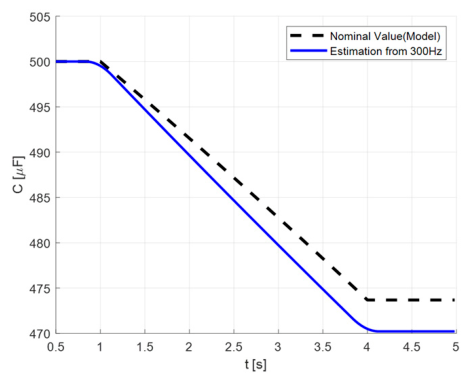
By analyzing the amplitude and its variation, the rate of change in the signal during individual cycles (where 1 cycle = 20 ms) can be determined. To eliminate the noise resulting from the differentiation of the pulse amplitude signal, signal filtering is introduced. Consequently, the rate of capacitance change becomes clearly visible. Based on this analysis, it is possible to determine the actual capacitance value in the system. In accordance with the described stages, the rate of change on the falling edge is calculated for each cycle during the analysis. Following the removal of noise (i.e., filtering out irrelevant out-of-band frequencies), this method enables the diagnosis of the DC-link circuit. The estimation results are presented in
Figure 7.
Although the proposed method does not guarantee a 100% convergence between the estimated value and the actual capacitance, it serves as a viable diagnostic tool for monitoring trends within the DC link. The estimated parameter values and the corresponding estimation errors are summarized in
Table 4. Tests were performed for variations in capacitance C
1 ranging from −5% to −50%. It can be observed that the threshold limit for accurate estimation using the described method occurs at a capacitance drop of approximately 30% to 40%, beyond which the error increases significantly. However, it should be noted that in practical applications, such a substantial change in capacitance would necessitate taking the system out of service.
An error of 0.73% is minor for the diagnosis of a parameter as difficult to estimate as capacitance. Furthermore, it should be highlighted that only the value of C1 was varied during these tests. The proposed algorithm does not differentiate between individual capacitor faults and only determines the equivalent capacitance of the DC link.
Subsequent tests were conducted, and the results are summarized in
Table 3 for various changes in capacitance C
1.
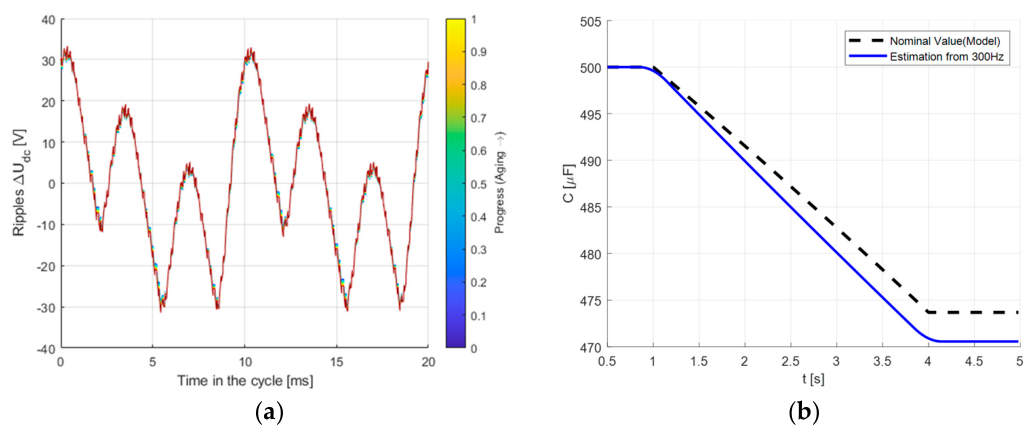
To verify the robustness of the capacitance estimation method under varying operating conditions, a supply voltage asymmetry was simulated, defined as
UA = 0.95
UAN,
UB = 1.05
UBN, and
UC = UCN. This supply voltage unbalance has a significant impact on the
UDC voltage waveform, as illustrated in
Figure 8a.
Regardless of the voltage waveform shape, synchronizing the repetitive pulses within the 20 ms time window eliminates the issues of varying voltage levels caused by the asymmetry. The slope of the pulses remains unaffected, and it is this parameter that determines the estimated capacitance value. The resulting estimation is presented in
Figure 8b. The estimation error is 0.66%.
In the event of additional load disturbances (i.e., load asymmetry), the estimated capacitance values also remain highly accurate. For a 5% load asymmetry in each phase, defined as
RA = 0.9
RAN, RB = 0.95
RBN, and
RC = 1.05
RCN, the estimation error is 0.59%, which represents an excellent result. It is clearly visible that the proposed method is robust against disturbances originating from both the grid side and the load side. The
UDC voltage waveform is shown in
Figure 9.
- B.
Experimental system
The laboratory test bench utilized to investigate the effects of DC-link capacitance variations consists of an adjustable voltage source capable of simulating supply voltage asymmetries, a six-pulse diode rectifier, a complex DC-link circuit, and a two-level voltage source inverter (VSI). The entire system is controlled via a DS1103 rapid prototyping board from dSPACE (dSPACE Group SE & Co., Paderborn Germany). An induction motor operating under open-loop constant volts-per-hertz U/f = const control serves as the system load. The schematic diagram of this test bench is shown in
Figure 10a.
Figure 10b illustrates the constructed frequency converter and the control system for varying the DC-link capacitance, while
Figure 10c presents a detailed view of the DC-link architecture, which is pivotal to the analysis described in this paper.
The motor supplied by the constructed converter is coupled via a rigid shaft to another motor acting as a load generator. The machines are 1.1 kW Besel induction motors, models Sh 80X-4C (main motor) and Sh 80X-4D (load motor) (BESEL, Brzeg, Poland). Detailed parameters of the motor are presented in
Table 5.
The load motor is controlled by a commercial Danfoss FC302 inverter. During the operation of the main drive, the load motor runs at varying speeds to establish specific load conditions. The custom-designed AC/DC/AC converter (
Figure 10) features a DC-link configured as a 2 × 5 electrolytic capacitor matrix. Each individual 470 mF capacitor can be disconnected from the circuit using a dedicated interface. To eliminate the influence of a specific capacitor on the voltage ripple damping, its corresponding relay is opened. This operation forces the current to bypass the capacitor and flow through a series-connected 1 kW resistor; this effectively renders the capacitive component of that particular DC-link cell negligible while keeping the disconnected capacitor charged to the voltage level present in the active branches of the circuit. Furthermore, a DC-link discharge circuit is implemented, equipped with sensors that enable continuous monitoring of the capacitor discharge process. The data analyzed in this paper were originally collected during the study presented in [
5].
In the experimental study, five test cycles were conducted for various capacitance values in the DC link. Since perfectly symmetrical supply voltages cannot be guaranteed under laboratory conditions, 30 measurements were performed for each capacitance value to eliminate errors resulting from grid disturbances. In all tests, an RLE load in the form of an induction motor was utilized.
Two operational scenarios were implemented—with inverter output frequencies of 20 Hz and 25 Hz—to demonstrate the influence of inverter operation on the performance of the capacitance estimation algorithm.
As demonstrated in simulation studies, the load on the voltage inverter side has no significant effect on the capacitance estimation process. Changing the frequency within the range of 0–50 Hz cannot cause anomalies in the DC link. Therefore, it was assumed that only two frequencies, 20 Hz and 25 Hz, would be tested. For other values, the results must be consistent. Resistance and inductance on the load side have a greater impact on the DC link, particularly when their asymmetry occurs. In this work, the effect of such asymmetry on the estimator’s performance was examined in simulation studies. This is difficult in experimental studies due to the use of a symmetrical three-phase induction motor.
The experimental matrix comprised 30 measurements for each of the analyzed DC-link capacitance values: 705 mF, 881 mF, 940 mF, 1044 mF, and 1175 mF.
Each measurement under identical operating parameters was designated with the index nX. These tests were replicated across both stator current frequencies. In the first stage of the evaluation, the performance of the previously described estimation mechanism was verified for the output frequency f1 = 20 Hz.
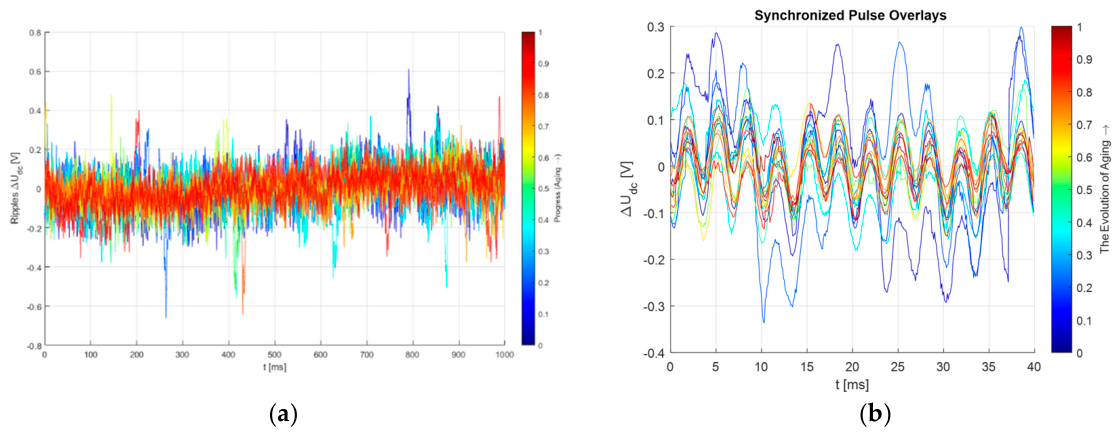
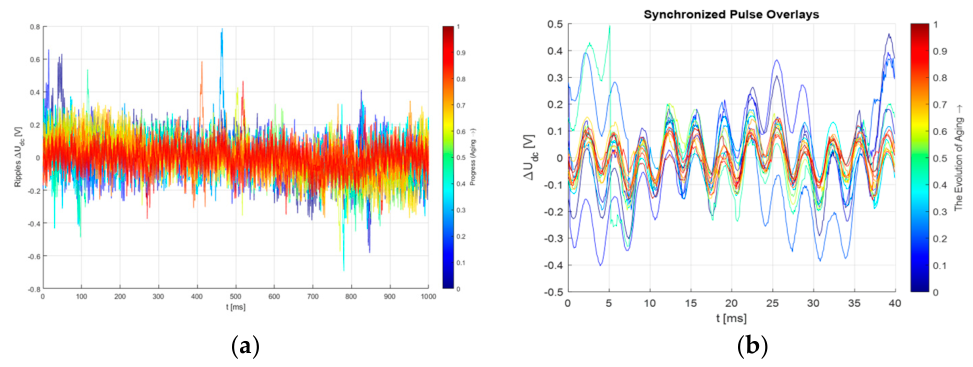
Figure 11a presents the recorded voltage waveforms in the DC link. The DC component was eliminated in accordance with the algorithm assumptions. It can be observed that certain signals exhibit significantly larger measurement errors compared to others; for this reason, 30 measurement cycles were performed.
To thoroughly analyze the estimated capacitance value, a 40 ms time window of the
UDC voltage was examined. The results are presented in
Figure 11b. As previously noted, it is apparent that one of the measurements was recorded under a relatively high supply voltage asymmetry. To monitor this disturbance, the Voltage
Unbalance
Factor (UF), as described in [MD PED], was evaluated.
Since the mechanism is based on the assumption that the primary diagnostic signal is the
UDC voltage—specifically, the 6th harmonic at 300 Hz—
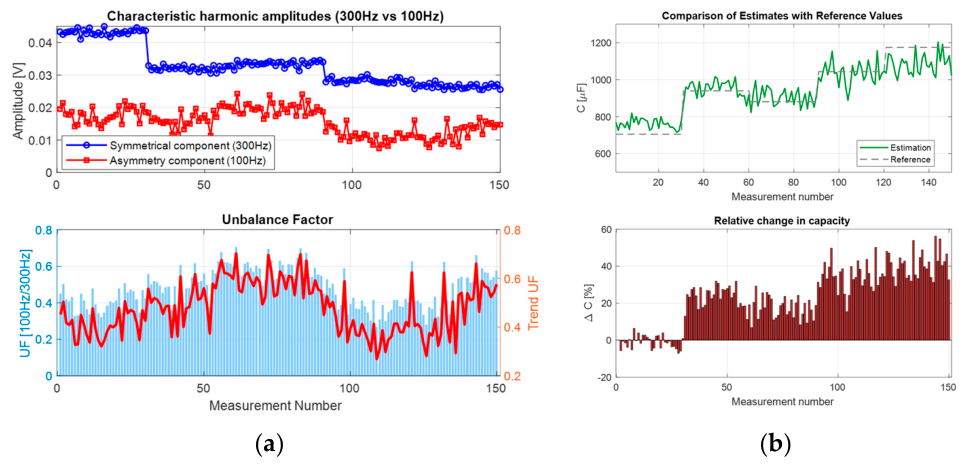
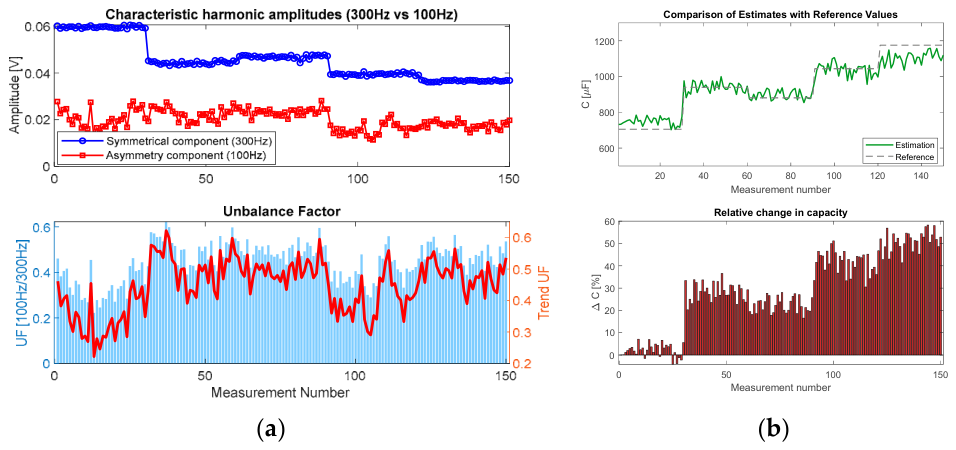
Figure 12 illustrates the amplitude variations of both the 300 Hz and 100 Hz harmonics. The latter increases in the presence of supply voltage asymmetry. It can be observed that while the 300 Hz harmonic varies with changes in capacitance (as expected), the 100 Hz harmonic remains virtually unchanged; consequently, the UF variations are minor, indicating the absence of significant grid voltage asymmetry.
Figure 12b presents the estimated capacitance values across all conducted tests. It is apparent that the capacitance is tracked with a relatively small error, though this error increases for both extremely high and extremely low capacitance values. Nevertheless, tracking the variation trend is paramount for diagnostic systems, and the proposed method can be successfully utilized for continuous capacitance monitoring. In the next stage, the tests were replicated for a different load-side frequency, which was increased to 25 Hz. The corresponding results are presented in
Figure 13 and
Figure 14.
It can be observed that in the case of the second measurement dataset, as many as two measurements exhibit significant deviations from the norm. Nevertheless, the estimation process proceeds correctly, and the resulting error is comparable to that observed in the initial analyses. To illustrate the measurement data and their distribution,
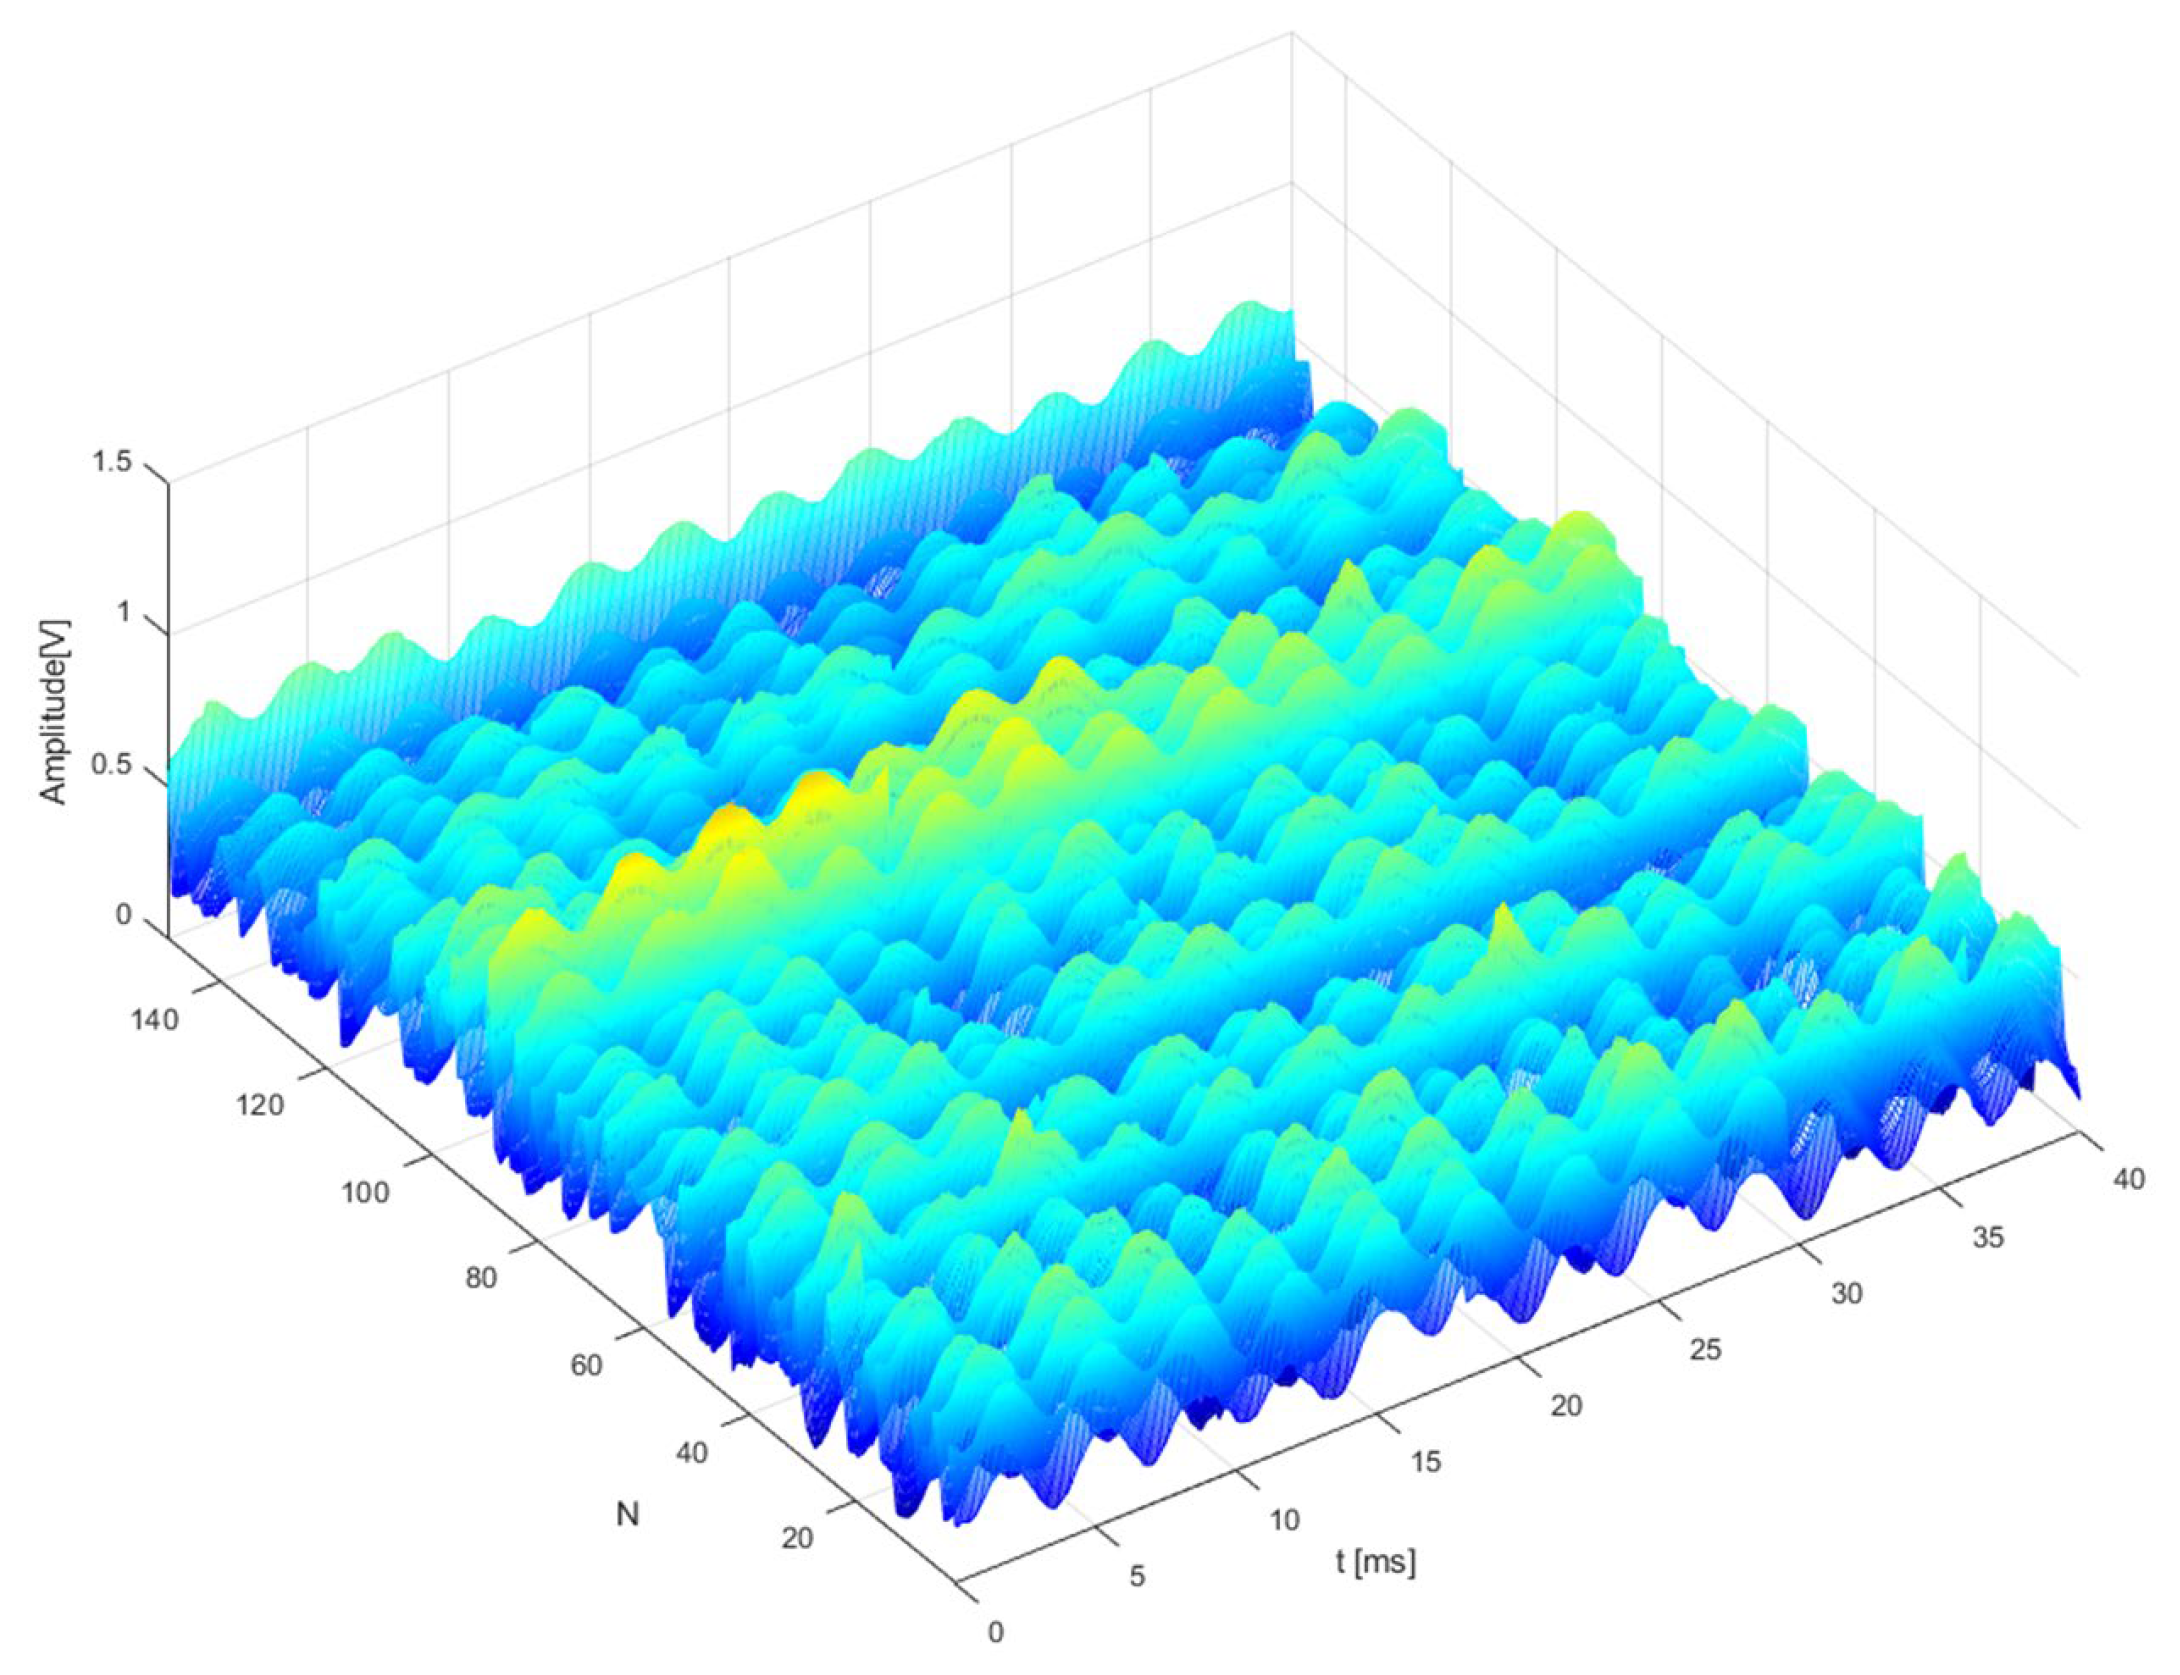
Figure 15 presents the complete dataset comprising 150 measurements in a 3D plot.
5. Conclusions
It is clearly evident that for the capacitance estimation mechanism to operate correctly, all stages described in the preceding sections must be executed with high precision. Synchronization of the waveforms with the grid voltage and the analysis of the exact same sequence of cycles in consecutive measurements appear to be critical. Faulty synchronization can lead to an incorrect calculation of the pulse slope during the capacitor discharge phase, ultimately resulting in an erroneous capacitance estimation. Although the mechanism can be implemented for online operation, the measurement data must be buffered, meaning that the estimation result will be delayed by a duration equal to the data acquisition time—which, in the analyzed case, is 40 ms. The experimental results indicate a noticeable growth in estimation error when the capacitance drop exceeds the 30–40% threshold. From an engineering and predictive maintenance perspective, this behavior perfectly aligns with industrial requirements. The universally accepted end-of-life (EOL) criterion for aluminum electrolytic capacitors is a 20% reduction from their nominal capacitance value. Because the proposed algorithm maintains high accuracy well beyond this EOL boundary, it provides reliable monitoring throughout the entire critical lifespan of the component. The degradation of accuracy at 40% capacitance loss occurs in a region where the capacitor is already considered critically failed and should have been replaced, thus not limiting the practical applicability of the method.
The main novelty and original contributions of this paper are summarized as follows:
Integrated Frequency and Pulse-Shape Analysis: Development of a diagnostic framework that combines frequency-domain analysis with DC-voltage pulse-shape characterization for accurate capacitor capacitance estimation.
Validation via a Custom Prototype Testbed: Verification of the simulation models using a specialized experimental laboratory setup equipped with a prototype inverter that features a dynamically adjustable DC-link capacitor bank—a hardware capability rarely implemented in existing literature.
Robustness Under Supply and Load Asymmetries: Comprehensive validation of the proposed estimator under both grid-side voltage supply asymmetry and load-side imbalances, addressing a critical operating condition that has been systematically overlooked in prior capacitance estimation studies.
Industrial Viability and Seamless Integration: The methodology is structurally practical, making it highly suitable for direct integration into commercial, industrial-grade diagnostic systems without requiring structural modifications.
Single-Sensor Cost-Effective Implementation: The diagnostic algorithm relies exclusively on a single measurement signal. Because this voltage parameter is already inherently monitored in standard variable-frequency drives (VFDs) and power electronic systems, the method eliminates the need for additional sensor hardware, significantly minimizing implementation costs.