1. Introduction
Under the dual pressure of global climate change and intensified human activities, the loss of biodiversity has become a global environmental crisis. According to the Earth vitality report 2024, the global wildlife population size has decreased sharply in the past few decades [
1]. Building a scientific and efficient wildlife dynamic monitoring system has become an important part of the United Nations Sustainable Development Goals (SDGs). The large-scale, long-term and low interference inspection of wildlife populations not only helps to master the migration laws and habitat preferences of endangered species, but also provides data support for the formulation of ecological protection policies [
2].
For a long time, wildlife monitoring mainly relied on ground survey, line transect method and infrared camera traps. Although the infrared camera can realize non-invasive long-term monitoring, it faces many bottlenecks in practical application: first, the equipment layout is greatly limited by the terrain (such as cliffs, dense forests, wetlands), and the coverage is limited; Secondly, the massive images generated by infrared cameras often contain a large number of “aerial photos” triggered by plant shaking, and the manual screening cost is very high, which is difficult to meet the real-time requirements. In addition, the limitation of fixed perspective makes it difficult to capture the overall picture and spatial dynamic distribution of the population.
In recent years, unmanned aerial vehicle (UAV)—as a new remote sensing platform—has shown great application potential in the field of ecology by virtue of its high flexibility, wide observation perspective and strong permeability to complex terrain. The UAV equipped with high-resolution optical sensors can obtain a wide range of high-definition images from the air, greatly expanding the geographical boundary of monitoring. Research shows that, compared with low altitude unmanned aerial vehicles or satellite remote sensing, medium and low altitude unmanned aerial vehicles can obtain centimeter resolution images without significantly interfering with animal behavior, providing an ideal data source for automatic intelligent recognition.
Although the hardware platform is becoming more and more mature, how to automatically and accurately identify wild animals from massive and complex aerial images is still a difficulty in the field of computer vision. Unlike general data sets (such as COCO [
3] and ImageNet), UAV aerial images of wild animals have the following characteristics: (1) Due to the high flight altitude, animals occupy very low pixels in the image, and the feature information is extremely weak, which is easily lost in the process of sampling under the characteristics of the deep network. (2) Vegetation, rocks, rivers and other elements in the natural environment are highly similar to animals in color and texture, forming a serious “camouflage effect”. (3) Animals’ running, lying, and other postures are highly uncertain, and are often partially obscured by forest vegetation, making it difficult for traditional algorithms to accurately extract the bounding box. Furthermore, the successful application of multi-source data spatio-temporal reconstruction and fusion methods in complex system prediction has provided new insights for the integration of cross-domain monitoring data [
4]. Meanwhile, the effectiveness of time-frequency collaborative modeling methods in time series analysis also provides a theoretical reference for handling the dynamic changes in wildlife activity rhythms.
Among many deep learning target detection algorithms, YOLO series [
5,
6] has become the first choice for UAV embedded devices because of its excellent balance between detection speed and accuracy. As the latest representative work of this series, YOLOv8 has been optimized in the design of decoupling head, anchor free mechanism and other aspects. Among them, the YOLOv8n model has attracted much attention due to its extremely low computational overhead. However, it still has problems such as insufficient positioning accuracy and high misjudgment rate when processing wildlife aerial photos with high dynamic background and small targets. Regarding lightweight network design, existing research has made progress in industrial scenarios such as infrared image detection of power equipment [
7] and defect detection of nickel-plated steel strips [
8]. These methods are of reference value for model lightweighting on UAV embedded platforms. In addition, the plug and play lightweight module design for YOLO series models [
9] and the general optimization method for YOLO series object detection in remote sensing images [
10] provide important references for model optimization on unmanned aerial vehicle embedded platforms in this paper. Recent comprehensive reviews of YOLO-based object detection models have systematically summarized their architectural evolution and application scenarios [
11], further validating the rationality of our improvement direction. Related studies on lightweight ship detection [
12], cow behavior recognition [
13], tea bud detection [
14], and crack identification [
15] based on improved YOLOv8n have also demonstrated the broad applicability of this architecture across diverse domains.
In recent years, attention mechanisms and hierarchical optimization strategies have shown strong potential in various perception tasks. Li et al. proposed a fiber optic intelligent carpet dual-mode attention network, which achieves cross modal deep fusion of mechanical signals and spatial contours through strain map attention modules and pressure gradient guided non local modules [
16]. Sun et al. proposed a Perceived Hash Hypernetwork Personalized Federated Learning (PHH-FL) to enhance personalization and generalization capabilities [
17]. The above work indicates that the dual focus on “key features” and “key positions”, as well as the optimization strategy of “layered processing and tailored to each layer”, can effectively improve perceptual performance. The multi-scale spatial pyramid attention mechanism [
18] further demonstrates that hierarchical attention designs can effectively improve image recognition performance across varying scales. Research on the synergistic effects between spatial and channel attention further confirms that the combination of these two attention mechanisms can effectively enhance feature representation [
19]. End-to-end multi-scale residual networks with parallel attention mechanisms [
20] have also demonstrated the effectiveness of attention-based feature enhancement in handling noise and small sample conditions. Inspired by this, this article applies the above ideas to unmanned aerial vehicle (UAV) wildlife detection tasks, and designs targeted improvement modules for three aspects: small target feature loss, complex background camouflage, and occlusion localization drift. Through collaborative optimization, joint enhancement of feature extraction, calibration, and localization is achieved.
In view of the above difficulties, we propose an improved YOLOv8n model. For the problem of small target detail loss, we introduce dynamic upsampling convolution (DySample) [
21,
22]. The traditional class nearest neighbor or bilinear interpolation upsampling cannot perceive the semantic content, but DySample makes the sampling points automatically fit the effective area of the target by adjusting the dynamic offset, accurately reconstructing the target details, and greatly reducing the interference of background noise. Inspired by the detection method for small infrared targets [
23], we further enhance the response of small-scale targets in the feature extraction stage.
In order to enhance the feature extraction ability of the model in a complex background, we integrated the Convolutional Block Attention Module (CBAM) [
24]. Through the series channel attention and spatial attention modules, the model can automatically identify and suppress the weight of redundant channels such as trees and rivers, and strengthen the effective signals such as animal limb characteristics and skin texture, so as to greatly improve the detection accuracy. AIN-YOLO [
25], a lightweight YOLO network with attention-based InceptionNext and knowledge distillation for underwater object detection, similarly demonstrates the effectiveness of efficient attention mechanisms in resource-constrained environments, which provides additional support for our approach in challenging wildlife monitoring environments.
For the problem of boundary box regression instability in occluded scenes, we use the MPDIoU loss function [
26]. Compared with the traditional CIoU or DIoU, MPDIoU—based on the minimum point distance theory—solves the problem of frame dislocation caused by target rotation or partial occlusion by directly aligning the foot points of the prediction box and the real box, which accelerates the convergence speed of the model and improves the positioning accuracy. Other improved IoU-based loss functions, such as N-IoU [
27] and Diag-IoU [
28], have also attempted to address similar limitations from different perspectives, yet they still face challenges in handling severe occlusion and scale variation simultaneously. The adaptive occlusion object detection algorithm based on OL-IoU [
29] further underscores the importance of designing loss functions specifically for occluded scenarios.
The originality of this work lies in the first revelation of the intrinsic collaborative mechanism of the three modules “DySample”, “CBAM”, and “MPDIoU” for the specific task of “UAV wildlife detection”, and the construction of a complete logical chain of “preservation → calibration → localization”. The three improvements are applied to three different stages: feature extraction, feature screening, and regression optimization, forming a closed loop, and the functions of the three are orthogonal and conflict free. Each choice is supported by task level necessity justification and ablation data.
2. Methods
2.1. Improved YOLOv8n Model
When using a deep convolutional neural network to recognize wild animals, it is often faced with the problems of feature loss of recognition object and vulnerability to complex background noise [
30]. The traditional down sampling operation often leads to a significant decline in the spatial resolution of the image, resulting in too low small target pixels, which makes it difficult to extract enough target features. The field environment is usually complex and changeable, and the detection target is affected by factors such as illumination, vegetation occlusion, variable target shape, mutual occlusion of targets, color and texture similarity between the target and the environment, which is very likely to lead to missed detection, false detection, large deviation of detection frame and other problems. Although the existing universal detection models (such as the original YOLOv8n) have excellent performance in public data sets (such as COCO and Pascal VOC), they often show low recall rate and positioning accuracy in the face of tiny targets and complex backgrounds from the perspective of aerial photography [
31,
32]. For the above pain points, this study uses YOLOv8n released by Ultralytics as the baseline model [
33]. As the representative work of the current single-stage target detector, YOLOv8 adopts the structure of anchor free detection head and decoupled head, which achieves a good balance between inference speed and accuracy. However, in order to make it suitable for the UAV wildlife inspection task, we carried out in-depth optimization from the four dimensions of feature retention, attention enhancement, multi-scale fusion and loss function [
34].
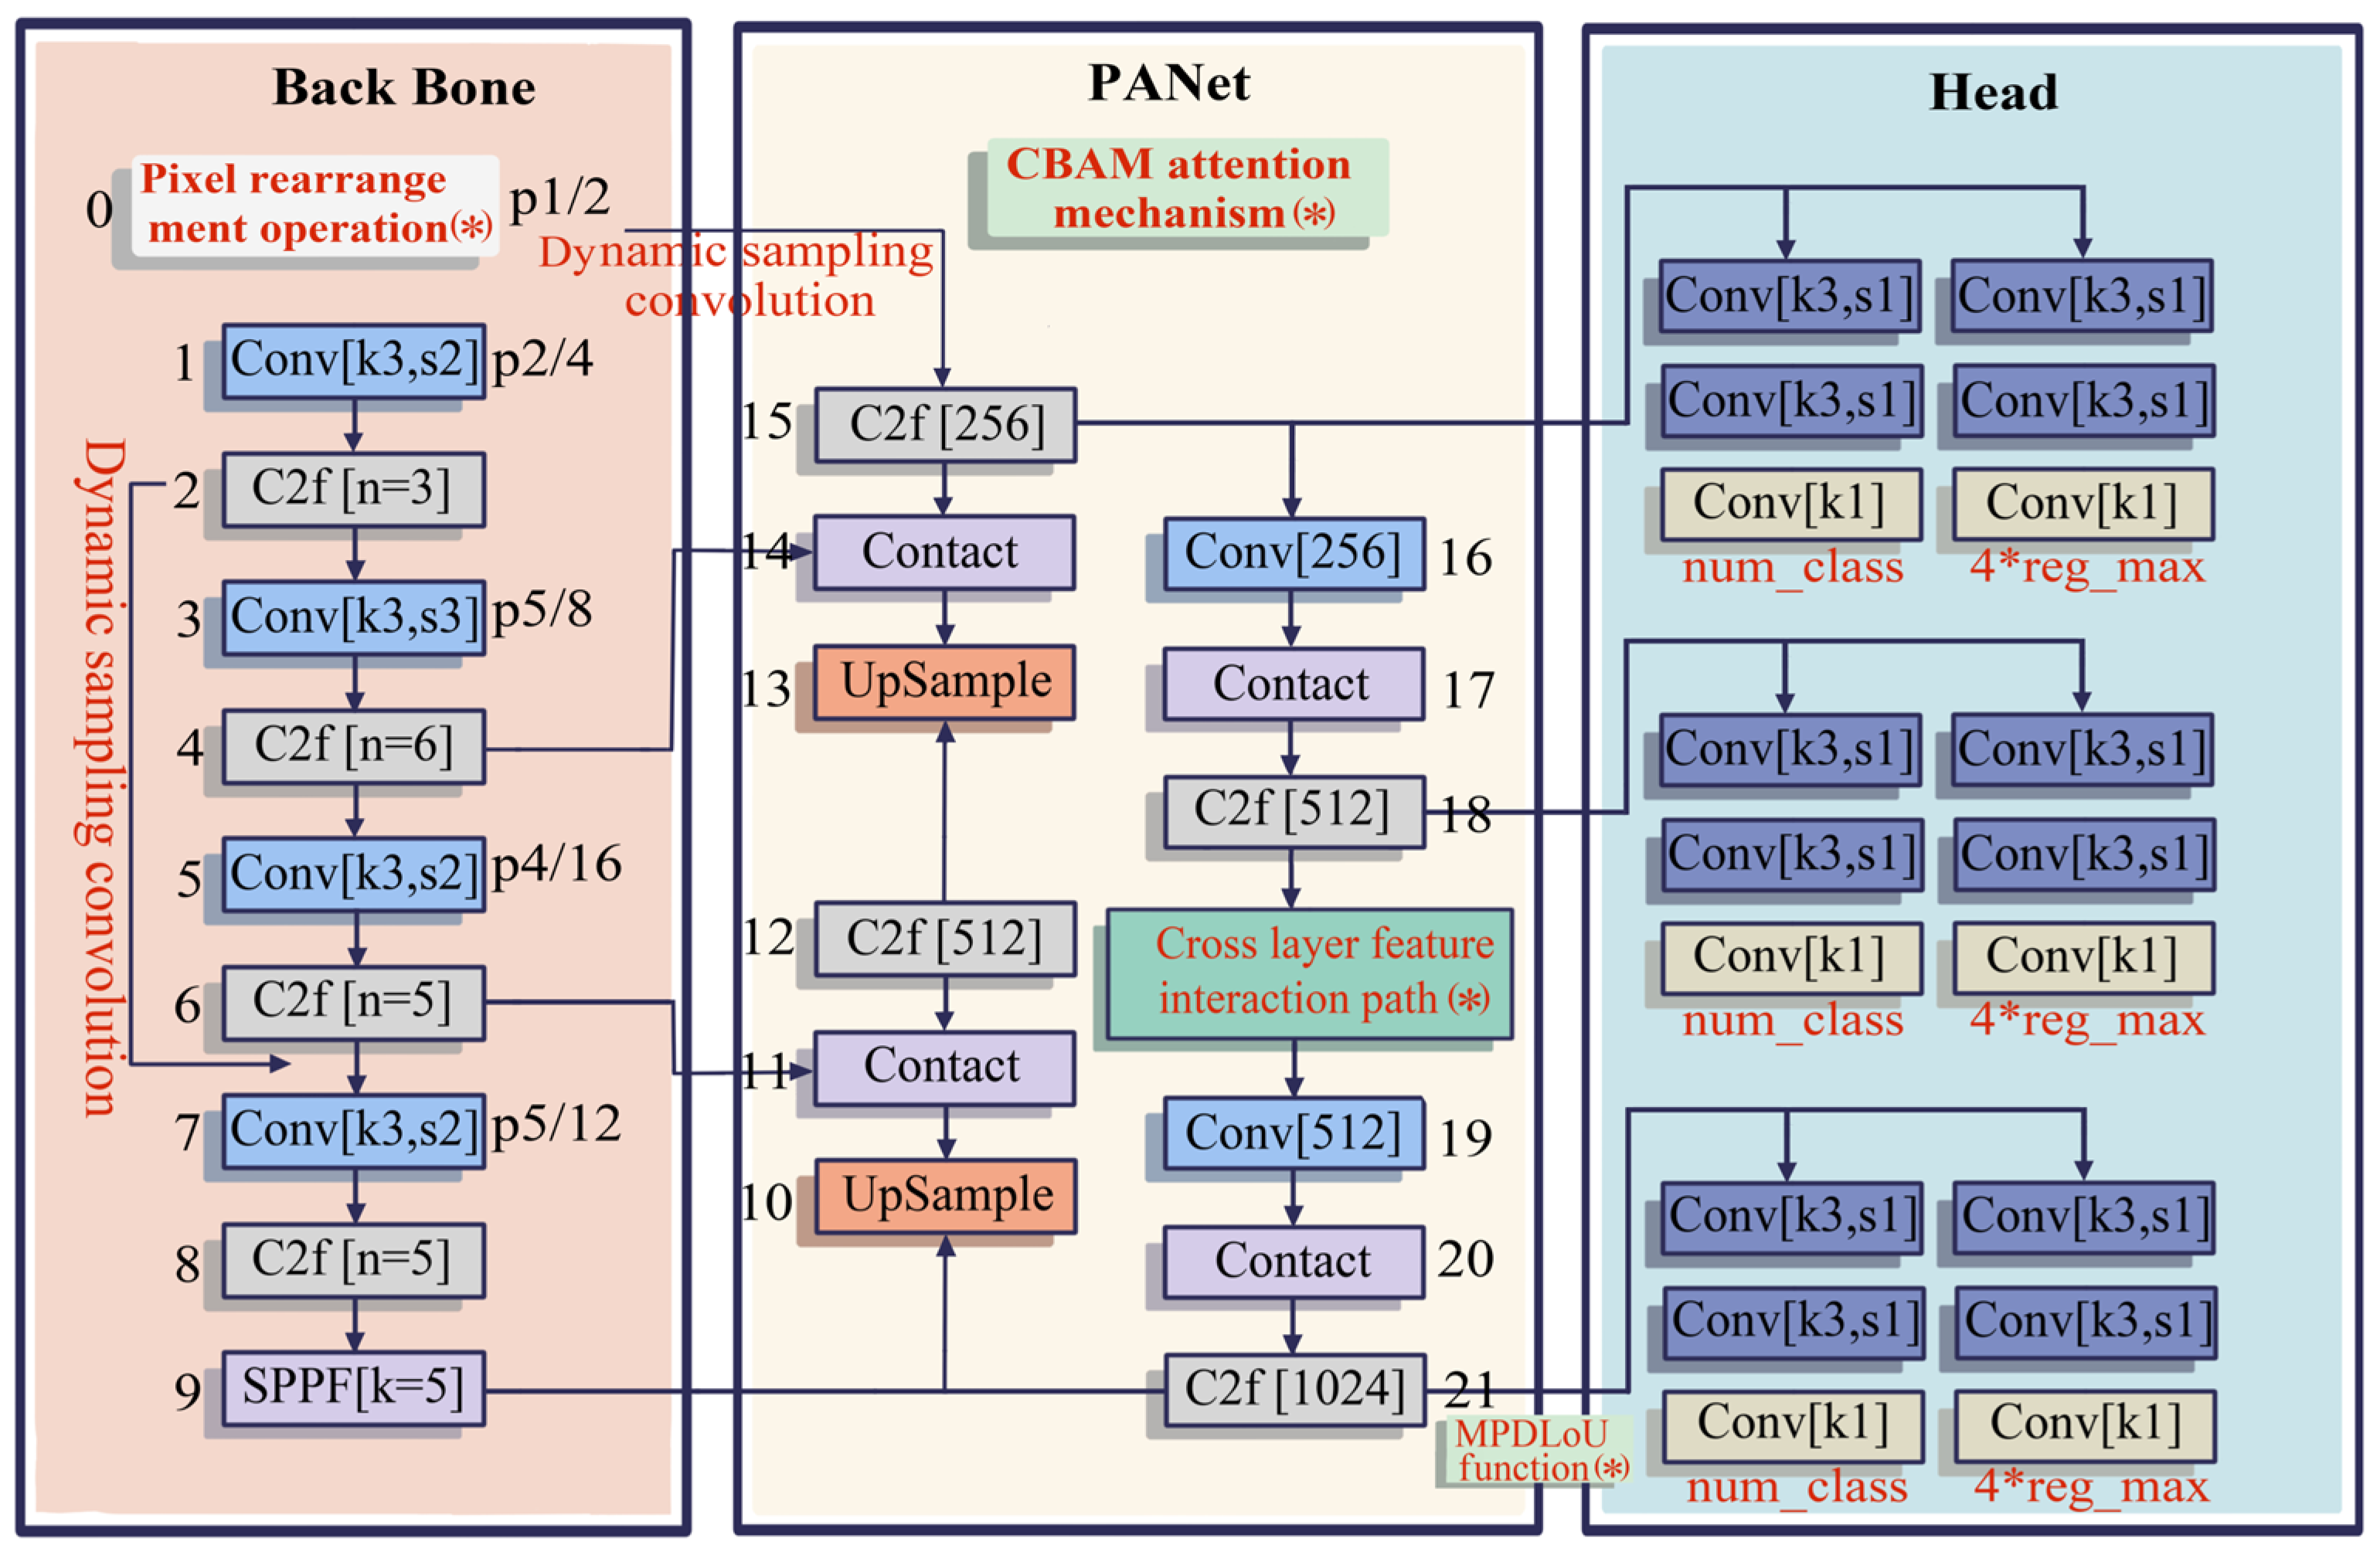
As shown in
Figure 1, the improved YOLOv8n model introduces pixel rearrangement and dynamic sampling convolution in the backbone network to replace the original fixed step down sampling and upsampling methods. Pixel rearrangement remaps spatial information to the channel dimension, avoiding information the loss of small target features during down sampling. Dynamic sampling convolution adaptively aggregates sampling points in the target contour area through the content aware offset, accurately reconstructing the detailed features of small targets. In the neck network (PANet) section, we embed the CBAM attention mechanism into the cross scale fusion path of the feature pyramid, and use its concatenated channel attention and spatial attention to perform dual calibration on the feature map—channel attention suppresses redundant responses of background textures, and spatial attention focuses on the limbs and edge regions of animals, making the features transmitted to the detection head have a higher signal-to-noise ratio. At the loss function level, MPDIoU is used to replace the original CIoU. By optimizing the direct distance between the four corner points of the predicted box and the real box, the localization stability in occluded and overlapping scenes is enhanced. This series of improvement measures fundamentally solves the problem of missed and false detections in long-distance wildlife detection while maintaining the advantages of YOLOv8n’s lightweight and easy deployment on unmanned aerial vehicle embedded platforms. LUFFD-YOLO [
35], a lightweight model for UAV remote sensing forest fire detection based on attention mechanism and multi-level feature fusion, similarly demonstrates the effectiveness of such optimization strategies in UAV-based detection tasks.
2.2. Dynamic Sampling Convolution
In the target detection architecture, the front-end of the backbone network usually depends on increasing the convolution stride to realize the down sampling of the feature map. However, this operation inevitably results in permanent loss of fine-grained information, which is particularly unfavorable for maintaining the structural feature of small targets. Inspired by the idea of spatial depth convolution (SPD-Conv) [
36], this paper adopts pixel rearrangement operation to alleviate this problem. By rearranging the spatial dimension information and mapping it to the channel dimension, this operation can complete the down sampling without sacrificing any original pixel data, so as to ensure that the deep network can still capture the fine features of small targets and provide richer underlying information for the subsequent recognition stage.
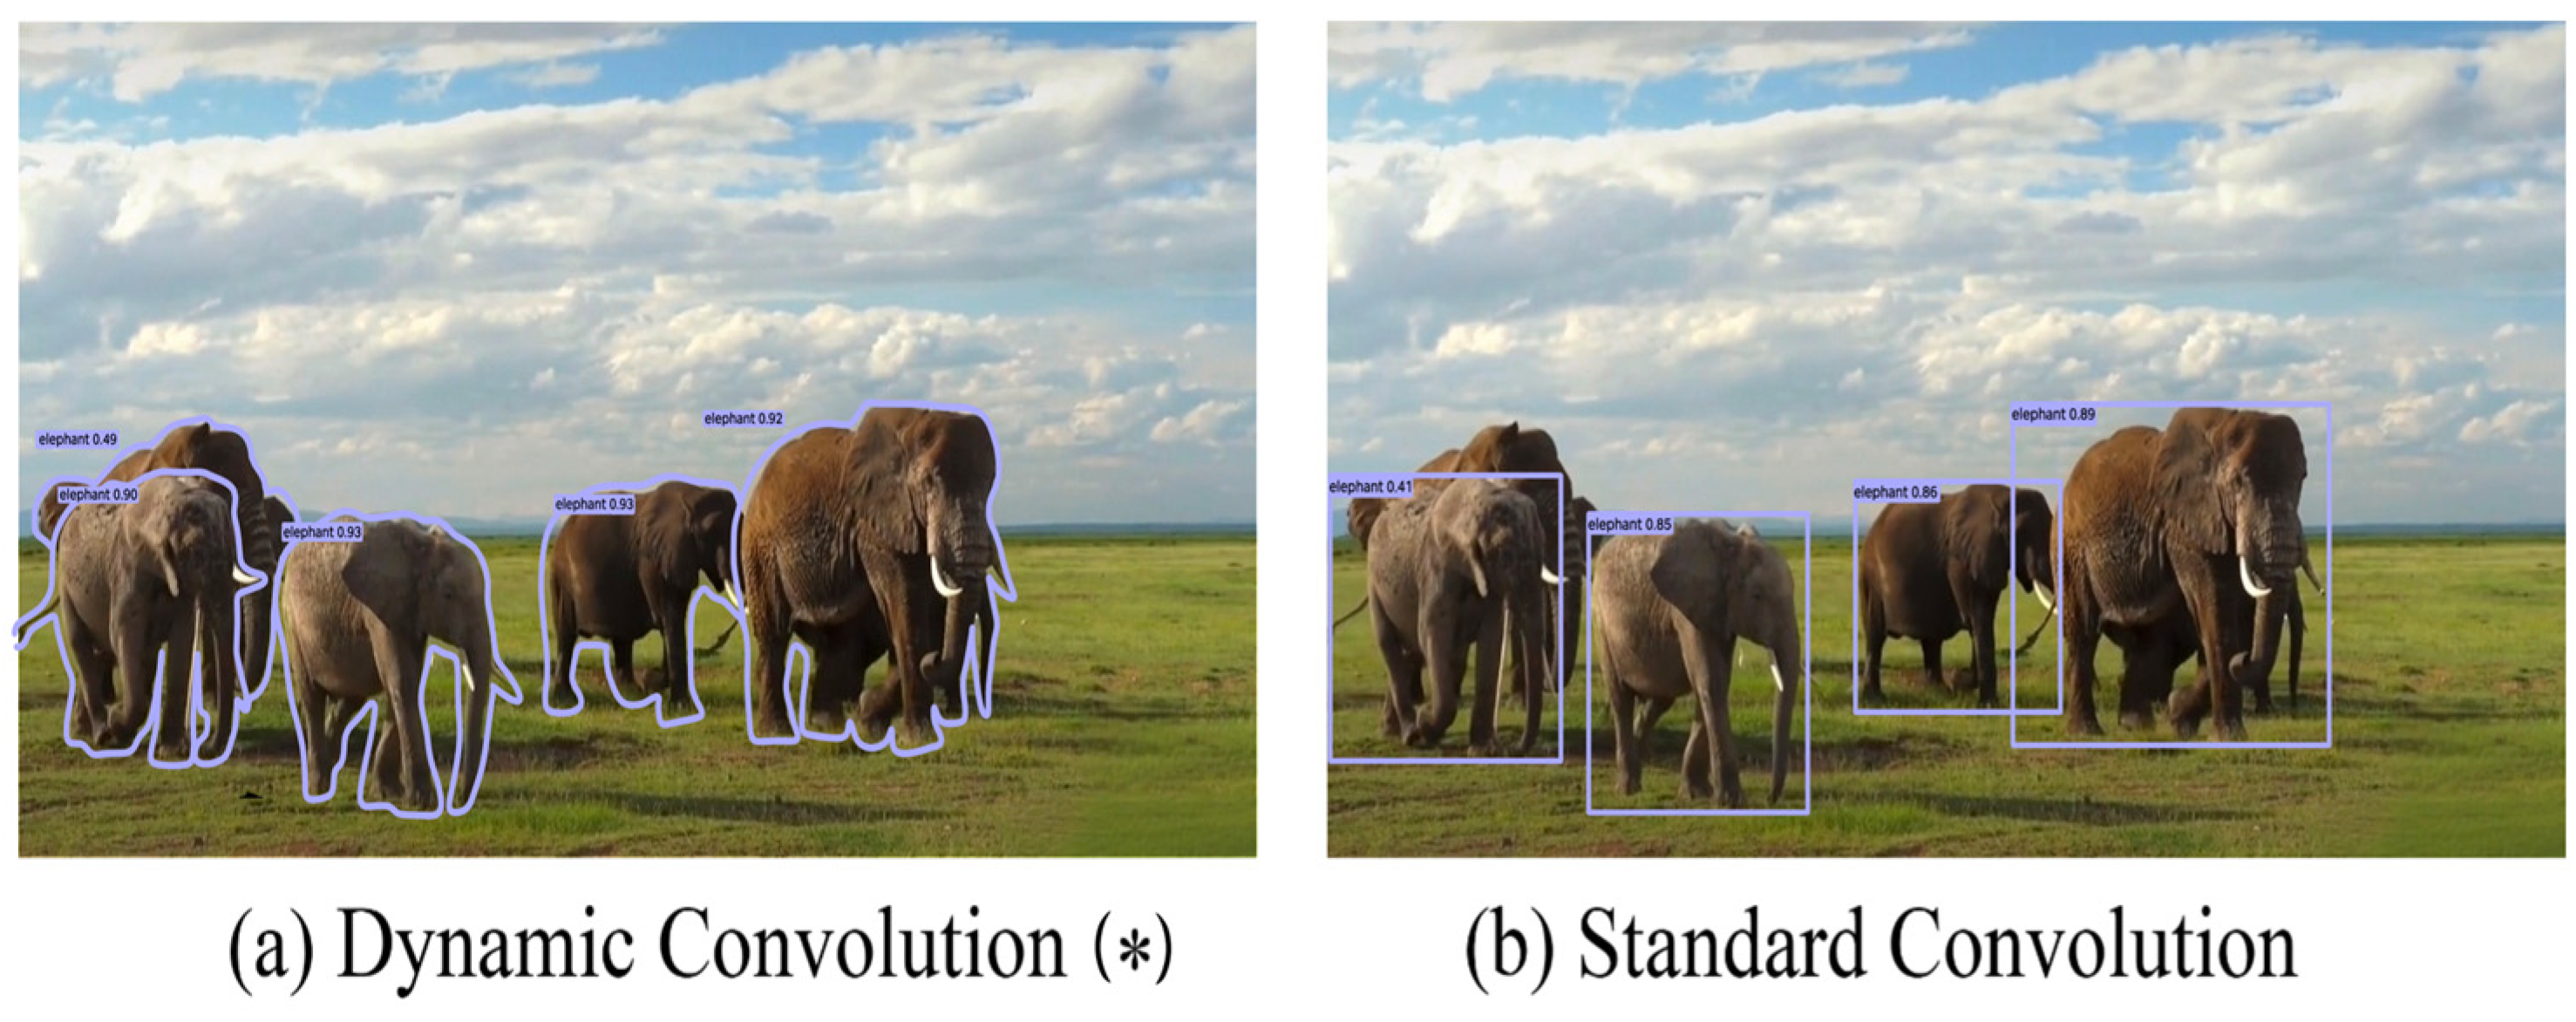
In UAV aerial imagery, animal targets typically occupy a very low pixel ratio, typically less than 32 × 32 pixels. For feature map resolution restoration, traditional upsampling methods such as nearest neighbor interpolation and bilinear interpolation rely on fixed interpolation kernels and lack content adaptation capabilities when fusing shallow spatial information and advanced semantic information. Therefore, these methods often encounter misalignment issues during the feature fusion process. To address this issue, we have introduced a dynamic upsampling convolution mechanism. DSConv uses content aware offset learning to cluster sampling points towards the direction of maximum feature response gradient. The feature response area of small targets originally only has a few pixels, and fixed sampling points are prone to “missing” into the background, while dynamic offset allows sampling points to accurately shrink into the effective area of the target. Specifically, this mechanism adaptively adjusts sampling weights by learning local masks, thereby achieving accurate reconstruction of feature resolution. As shown in
Figure 2, compared with the standard convolution (
Figure 2b), the dynamic convolution (
Figure 2a) can more effectively focus on the key feature regions of small targets, while suppressing background noise interference, significantly improving the quality of feature reconstruction.
It should be noted that while other dynamic upsampling methods—such as CARAFE—also possess content-aware capability, they incur substantially higher computational overhead, making them difficult to deploy on UAV embedded platforms. We conducted a preliminary comparative analysis and found that CARAFE increased inference latency by approximately 17% relative to the baseline, whereas DySample incurred only a 4.7% increase under equivalent conditions. This validates that, under embedded deployment constraints, DySample represents the optimal choice in the accuracy—speed trade-off for UAV-based wildlife detection tasks.
In order to enhance the effectiveness of multi-scale feature fusion, this paper optimizes the connection path between feature pyramid network (FPN) and path aggregation network (PAN), and designs an enhanced cross layer feature interaction path. By introducing jump connection, the path ensures that the subtle features contained in small targets can be effectively transmitted and saved in the deep layer of the network. Hyper-YOLO [
37] further demonstrates that integrating hypergraph computation with multi-scale feature fusion can significantly improve detection performance, which provides additional theoretical support for our design.
When applied to wildlife monitoring scenes, image quality often deteriorates due to complex meteorological conditions, environmental interference and other factors, which are manifested as blurring, noise, color distortion or high similarity between target and background. These degradation phenomena make it difficult for the traditional YOLOv8n network to extract features with strong discrimination. The dynamic upsampling convolution mechanism adopted in this paper can dynamically adjust the upsampling process according to the content of the input features, so as to significantly improve the resolution and reconstruction ability of the model to the contour and detail features of small targets in the case of image degradation, and finally enhance the robustness and accuracy of the detection model.
2.3. Convolutional Block Attention Module (CBAM)
In aerial wildlife monitoring scenarios, targets are often highly integrated with complex backgrounds such as dense vegetation and exposed rocks, and are subject to interference from factors such as occlusion, camouflage, and image degradation. In response to this challenge, feature extraction networks need to maximize their discriminative power within limited computing resources. Therefore, this article embeds a CBAM in the backbone network.
The choice of CBAM stems from strict accuracy efficiency trade-off verification. The embedded platform for UAV has strict real-time requirements (usually ≥30 FPS). We compared six mainstream attention mechanisms under the same conditions, and the results showed that although the Window Transformer had the highest accuracy, its inference delay was significant and could not meet real-time requirements. Although ECA is lightweight and efficient, its APS is relatively small, which limits its ability to improve small target features. The improvement of SE accuracy is limited, while the DANet attention and SK attention mechanisms have the problem of poor efficiency. In contrast, CBAM significantly improves the accuracy of small target detection (APS) at a moderate cost, while maintaining a high FPS. It is the only attention mechanism that maintains FPS above 45 while meeting the accuracy threshold (APS ≥ 0.340), occupying the optimal position on the precision efficiency Pareto front suitable for UAV deployment.
The reason why CBAM can achieve effective gain at a lower computational cost is due to its “channel–spatial “ dual attention design. The core idea of this module is to guide the model to adaptively learn “which feature channels are important” (What) and “which spatial positions are important” (Where), in order to achieve accurate calibration of the feature map, suppress background noise (such as redundant channels corresponding to vegetation and rock textures), and enhance target response (such as key areas corresponding to animal contours and limb edges).
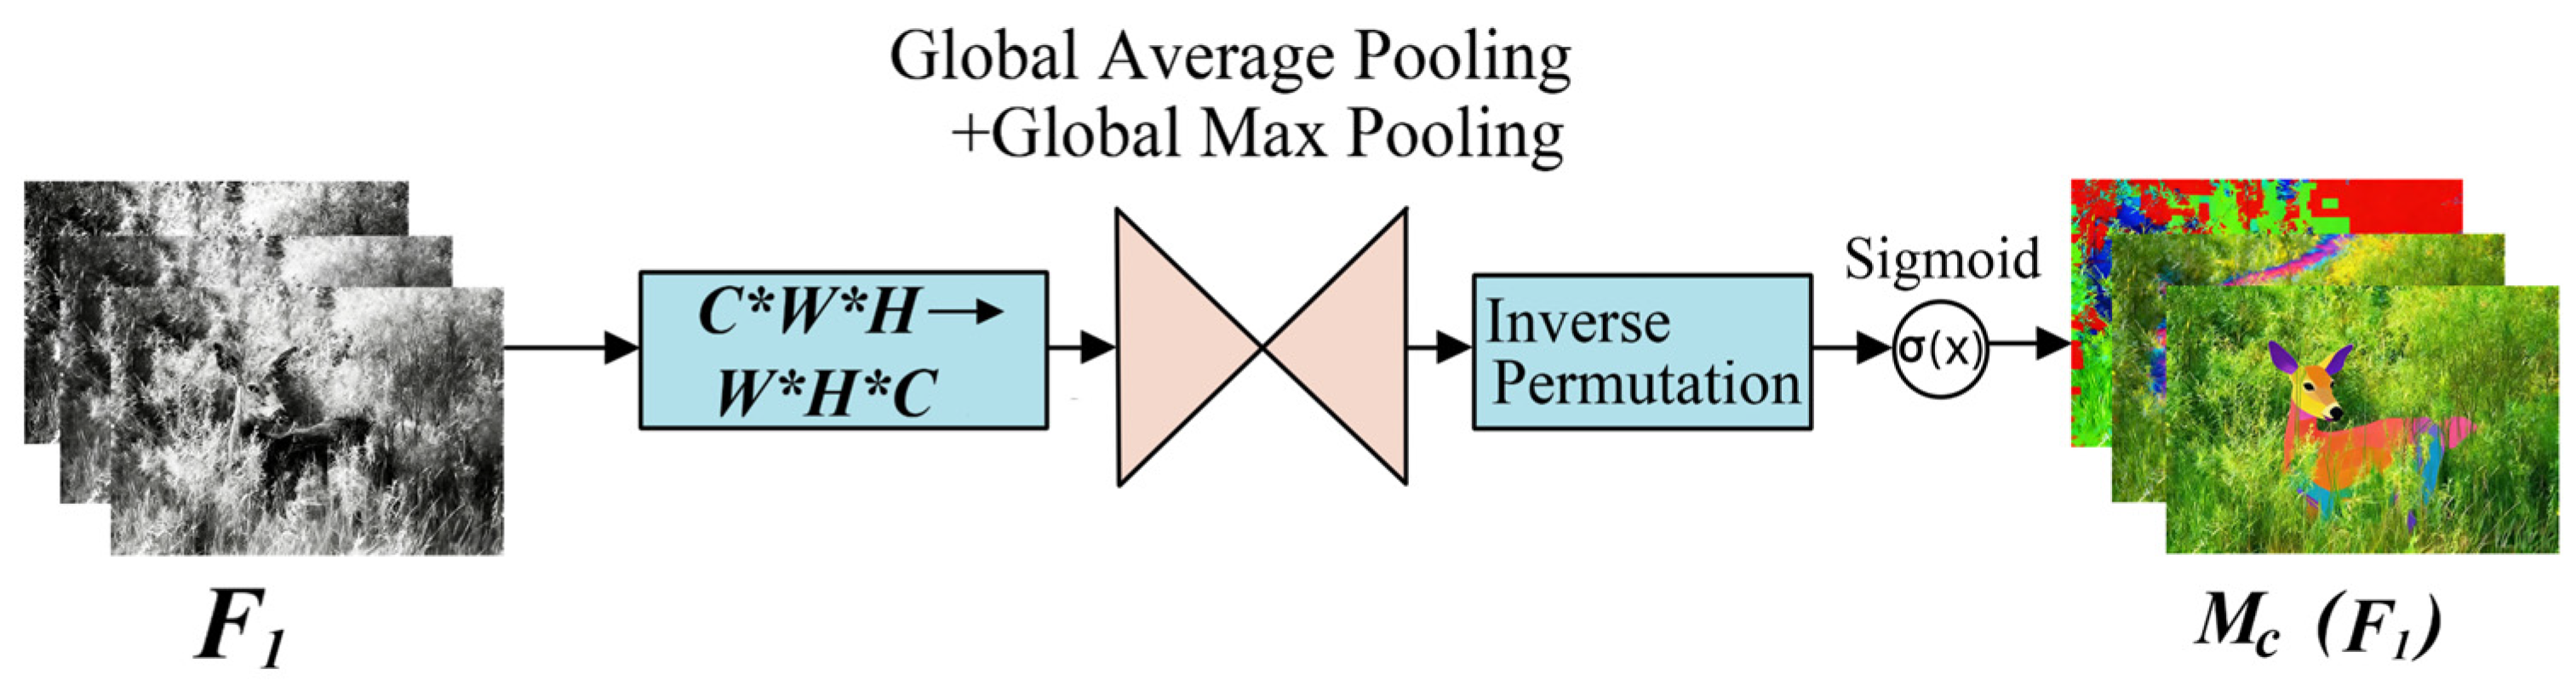
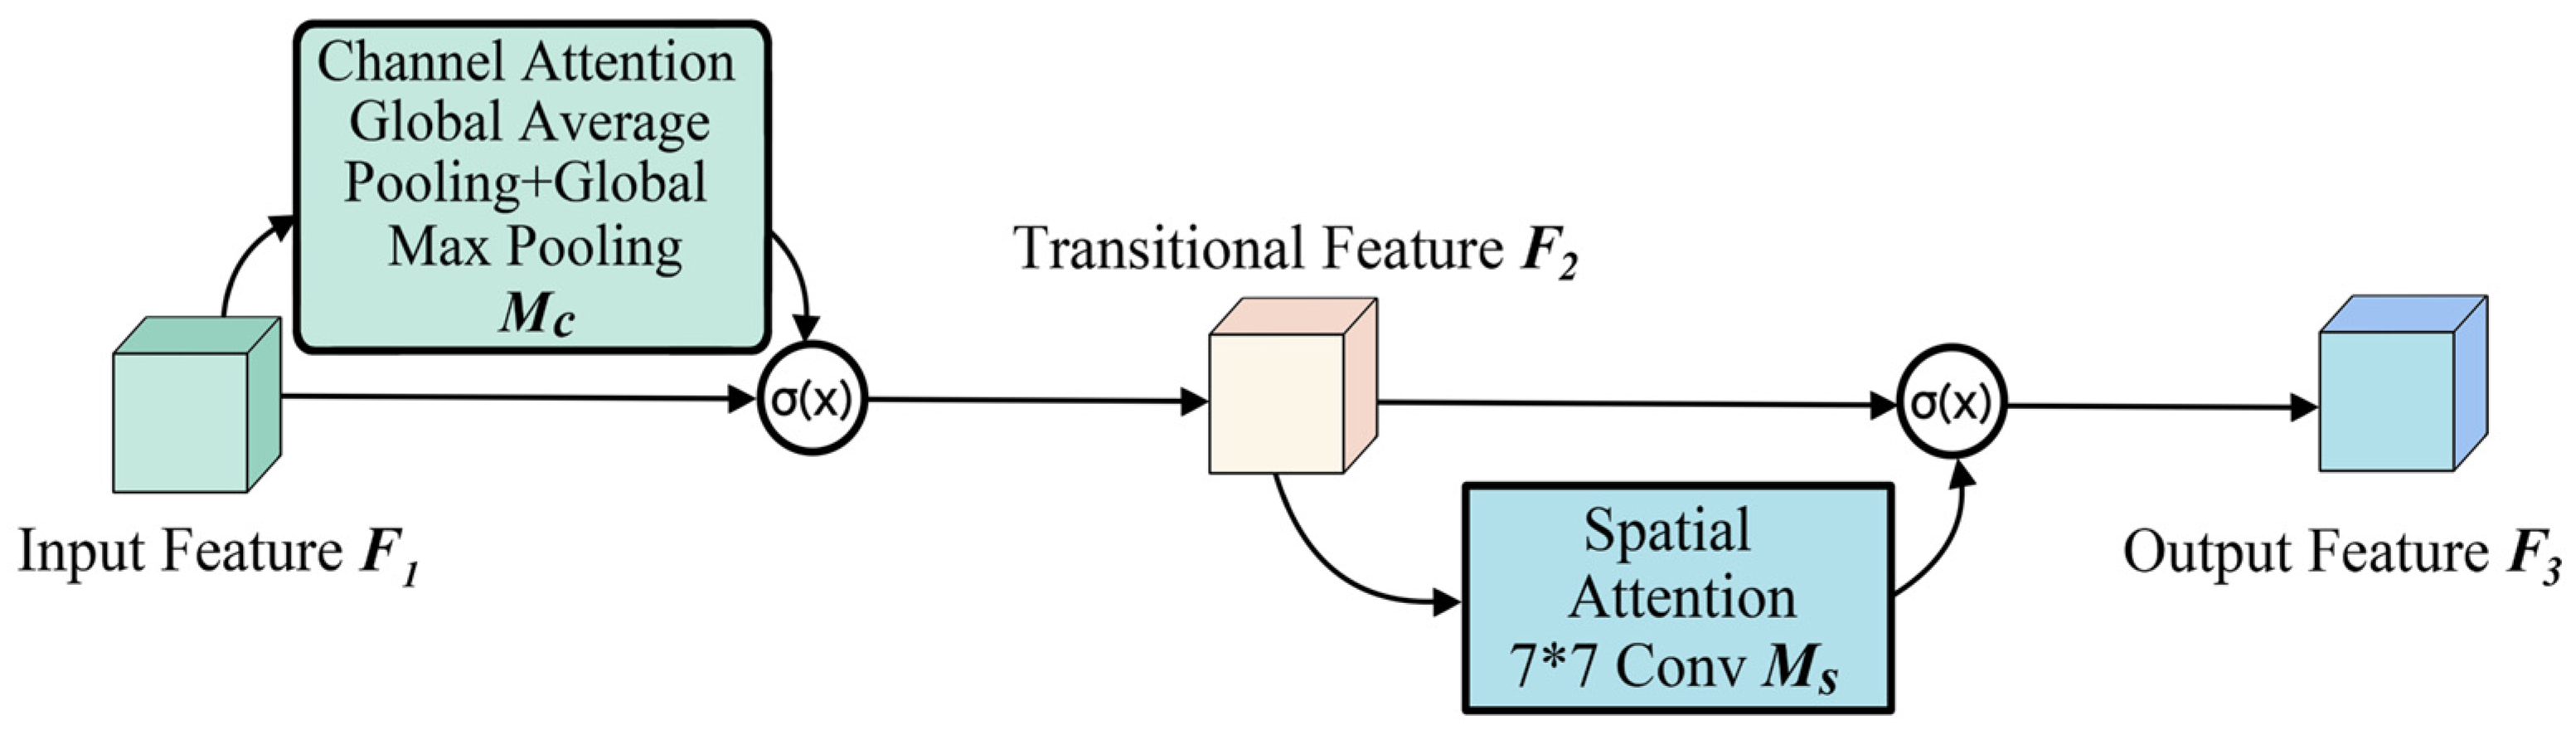
The channel attention mechanism is used to extract the correlation between different channels in image features, helping the network better focus on important feature information. As shown in
Figure 3, the channel attention module first performs global average pooling (GAP) and global maximum pooling (GMP) on the input feature map at the same time to aggregate the spatial information of the feature channel. These two pooling methods respectively capture the global context and significant local details of features, forming complementarities. Then, the pooled features are sent to a multi-layer perceptron (MLP) with shared parameters. The nonlinear relationship between channels is learned through the full connection layer, and finally the channel attention weight vector is generated through the sigmoid activation function. The weight vector is multiplied by the original input feature map channel by channel, so as to enhance the feature channel related to the target semantics and suppress the response of unrelated or noisy channels. This process can be expressed as Equation (1):
where
F1 is the input characteristic map and
Mc is the generated channel attention map. The input characteristic map is
, where
C is the number of channels,
H is the height, and
W is the width.
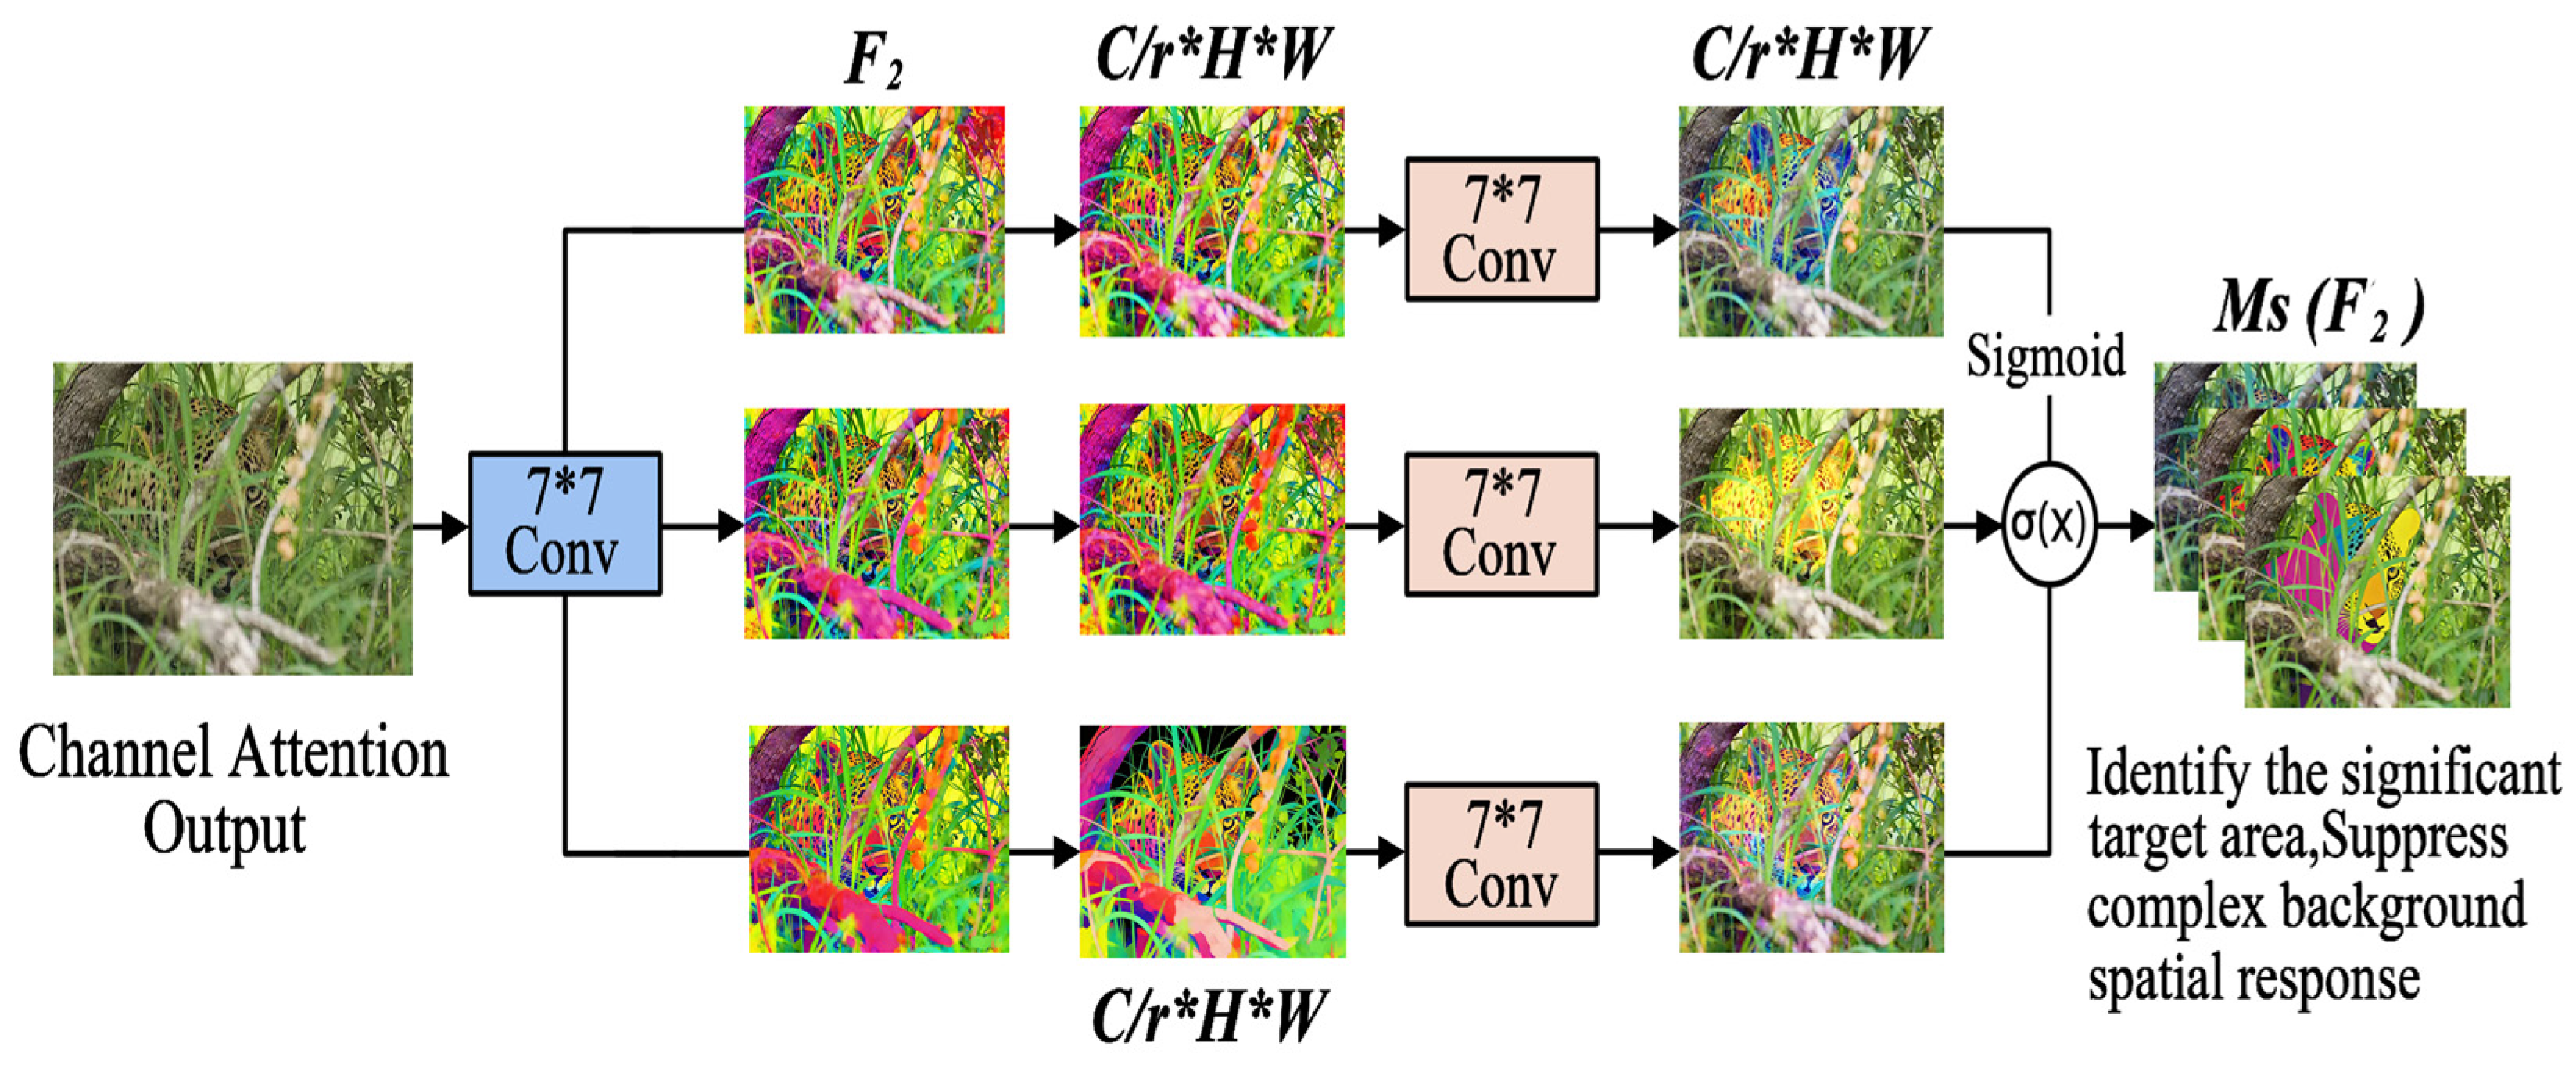
Spatial attention aims to focus on the key spatial areas of the feature map. As shown in
Figure 4, the characteristic map output by the module in the previous stage is used as the input. First, average pooling and maximum pooling are used for compression in the channel dimension to generate two spatial feature descriptors. After splicing the two, the spatial context information is extracted through a convolution layer and fused into a single feature map. Finally, a two-dimensional spatial attention weight map is generated by sigmoid function, which quantifies the importance of each spatial position. By multiplying it with the input feature map element by element, the feature intensity of the target area (such as animal contour) can be enhanced and the background clutter area can be suppressed. This process can be expressed as Equation (2):
where
is the generated spatial attention map.
The overall structure of CBAM is based on the principle of series design and follows the processing sequence of “channel first, spatial second”. The specific process is shown in
Figure 5. The input feature is calibrated by the channel attention module, and then readjusted by the spatial attention module, so the feature re calibration is realized. The calculation process can be expressed as Equation (3):
This step-by-step processing scheme makes it easier for the model to screen out better feature channels, so as to determine more meaningful spatial regions in each channel, and finally realize the progressive focus from semantic screening to spatial positioning.
Compared with attention models that only focus on channels, CBAM has an additional spatial attention path, allowing the model to focus on “which features are important” and “where are the features important”. This design does not increase the computational burden, but the effect is obviously improved. Especially in the complex scene of wildlife identification, photos are often disturbed by weather and chaotic background. CBAM can automatically enhance the contour and texture of animal targets, and suppress irrelevant clutter in the background. Therefore, even if the detected object is small, partially occluded, or not obvious, the model can find it more stably and accurately.
2.4. MPDIoU Loss Function
The accuracy of bounding box regression is the key factor affecting the positioning ability of target detection model. In the wild animal monitoring task based on UAV, a large number of clustered animals are often observed, and there are serious overlaps and occlusions between detection targets, which puts forward higher requirements for the robustness and accuracy of bounding box regression.
In order to supervise the regression process, the original YOLOv8 model selected the CIoU (complete intersection over union) loss function, which constrained the regression of the bounding box by coordinately optimizing the consistency of the overlapping area (IoU), the distance between the center points and the aspect ratio. Its specific definition is shown in Equation (4):
where
is the square of Euclidean distance between the center point of the prediction box (
) and the real box
,
is the diagonal length of the minimum circumscribed rectangle, and
measures the difference in length width ratio.
Although CIoU comprehensively considered a variety of geometric factors, it still had obvious limitations in dealing with complex natural scenes in the wild: (1) Optimization goal conflict. The optimization of the aspect ratio term is not always consistent with the optimization goal of IoU itself. This parametric coupling may produce contradictory gradient directions at the initial stage of training or when the target shape is changeable, resulting in the instability of the optimization process and the slow convergence speed. (2) Scale sensitivity. Its aspect ratio penalty term is sensitive to the absolute scale of the target, and it is difficult to balance the regression weight of targets with different scales when the scales of large and small targets in aerial images are widely distributed, which is particularly unfavorable to the accurate positioning of small-scale and partially occluded targets.
In order to overcome the above defects, this study introduces MPDIoU (minimum point distance IOU) loss function. This function directly calculates the Euclidean distance difference between the two pairs of diagonal vertices between the prediction frame and the real frame to measure their similarity and discards the explicit constraint on the aspect ratio, thus alleviating the conflict in the optimization process, making the gradient update more stable and promoting the rapid convergence of the model. At the same time, its high sensitivity to the vertex distance enables it to more accurately describe the target position deviation, which is particularly conducive to improving the positioning ability of the model for small-scale targets and partially overlapping targets. At the same time, the multi-level feature fusion mechanism constructed in this paper, the introduction of MPDIoU, further enhances the positioning robustness of the model in complex natural scenes at the loss calculation level, and realizes the collaborative enhancement of feature expression and loss optimization, thus providing a more stable and accurate target detection basis for UAV wildlife patrol mission.
Given the prediction box
and the real box
, the MPDIoU loss function aims to minimize the sum of the squares of Euclidean distances between two pairs of corresponding vertices, as shown in Equation (5):
The MPDIoU metric value is calculated as Equation (6), and the higher the value, the better the match between the two:
where
c2 is the square of the diagonal length of the smallest circumscribed rectangle covering the prediction box and the real box, which is used to normalize the distance term. The final MPDIoU loss function is defined as Equation (7):
The core of the design of MPDIoU loss function is that its optimization process for the variable essentially completes the collaborative optimization of the central point distance and width height deviation of the boundary box. This is because the coordinates of the center point and the width and height dimensions of the bounding box can be derived linearly from its vertex coordinates. Based on this principle, MPDIoU uses a unified, concise and differentiable geometric distance measure to constrain the position, scale and shape of the boundary box in an implicit and coordinated way, thus achieving a more direct and stable geometric alignment effect than CIoU.
The introduction of MPDIoU loss function into the aerial wildlife detection task actually solves several practical problems. On the one hand, it simplifies the optimization objective to the vertex distance, which is much smarter than the previous method that also considers the overlapping area and balances the aspect ratio. Because these parameters are often involved with each other, it is easy to make the model “in a dilemma” when updating; while, MPDIoU makes the gradient direction uniform, and the training is not only fast convergence, but also very stable. On the other hand, this constraint method directly for vertex coordinates is extremely sensitive to subtle changes in position. Especially in UAV aerial photography, it is common for small target animals to crowd together or be blocked. MPDIoU can dig out their positions more accurately. Combined with the multi-level feature fusion and attention mechanism we mentioned earlier, the whole model shows strong robustness in the face of complex illumination and background interference in the field, making the final individual identification and quantity statistics more reliable. In addition, the relevant theories of key node mining in complex networks also provide methodological references for understanding the identification of key individuals in wildlife populations.
4. Experimental Results and Analysis
4.1. Comparative Experiments of Different Convolutional Structures
In order to systematically compare the practical effects of different convolution structures in the lightweight wildlife detection model, this study takes YOLOv8n as the basic model, and under the condition that the main framework of the backbone network and the training settings are basically the same, four designs of dynamic sampling convolution, deformable convolution, PConv (partial convolution) and PWConv (point-wise convolution) are introduced for comparison.
Table 4 summarizes the quantitative results of each comparison model in terms of detection accuracy and calculation efficiency.
In terms of model efficiency and lightweight, dynamic sampling convolution (DSConv) shows obvious advantages. Compared with the benchmark model, the variant using DSConv has been optimized in many efficiency indexes: the number of parameters has been reduced to 2.68 M, a decrease of about 10.7%; the volume of the model was compressed to 5380 KB, which was reduced by about 11.9%; the amount of calculation (measured by GFLOPs) decreased to 7.3—a decrease of nearly one tenth. In terms of inference speed, the forward propagation time of single image processed by the model is about 1.2 ms, and the post-processing time is about 0.6 ms, which is increased by 25% and 45.5% respectively compared with the original model. These data show that the pixel rearrangement and dynamic upsampling mechanism adopted by DSConv can effectively simplify the calculation and optimize the memory access mode while retaining the feature information, thus improving the hardware execution efficiency and real-time processing ability.
In terms of detection accuracy, DSConv has also brought a comprehensive improvement. The experimental results showed that the precision reached 93.1%, the recall rate reached 90.2%, and mAP@0.5 reached 95.0%, which was 1.6, 2.6 and 1.4 percentage points higher than the benchmark model. Compared with several other lightweight convolution structures, DSConv remains ahead in all core accuracy indicators. For example, although PWConv is close to it in model size and inference speed, its mAP@0.5 was 94.6%, slightly lower than DSConv. This confirms that DSConv’s adaptive sampling strategy can more effectively focus on the key areas of the target and improve the feature extraction ability of the model for multi-scale targets (especially small targets), rather than at the cost of accuracy decline in exchange for speed.
Overall, DSConv achieved the best balance between accuracy and efficiency in this comparison. It can significantly reduce the model complexity and inference delay, and achieve the highest average accuracy improvement. Precision of deformable convolution (mAP@0.5 is 94.9%) is close to DSConv, but its calculation cost (8.5 GFLOPs) and inference time (2.3 ms) are higher; PConv and PWConv are slightly less accurate. Therefore, DSConv has been identified as the key structure to achieve model lightweight and performance improvement in this study by virtue of its “high precision, low loss” balance characteristics, which provides the basis for the subsequent deployment of high-performance detection models on edge equipment such as UAV airborne systems with limited computing resources.
4.2. Comparative Experiments of Different Attention Mechanisms
In order to screen out the most suitable attention enhancement methods for aerial wildlife detection tasks, we have integrated five current mainstream attention modules on the YOLOv8n benchmark model for comparative experiments, including CBAM, inverted residual mobile block (iRMB), convolution attention module, dual domain attention and attention-based internal feature integration module (AIFI). The purpose of this experiment is to systematically investigate the effects of different attention design paradigms on the ability of feature discrimination and target localization in complex natural scenes. Detailed quantitative comparison data are shown in
Table 5.
From the experimental results, different attention modules have different emphasis on improving the performance of the model. In terms of precision (P), the CSA module achieved the best result, reaching 95.2%. In average precision mean (mAP@0.5), CSA also leads by 96.8%, which reflects its excellent feature calibration ability. The dual domain attention module has a higher recall rate (91.0%) and a more challenging comprehensive positioning accuracy index mAP@0.5:0.95 (80.0%), indicating that it has more advantages in reducing missed detection and improving the positioning accuracy under the strict IOU standard.
In contrast, the CBAM mechanism has shown the most balanced improvement effect on the core indicators: its precision is 94.1%, and the recall rate is 90.8%, mAP@0.5 is 95.9%, mAP@0.5:0.95 is 79.5%, F1 score is 93.5%. Compared with the benchmark model without attention, its mAP@0.5 increased by 2.3 percentage points. This result verifies that the series attention design of “first channel, then spatial” adopted by CBAM is effective. It can jointly optimize the saliency of feature channels and focus on key spatial areas, so as to enhance the detection robustness of the model without obvious emphasis on a single index.
Although CSA and dual domain attention are more prominent in specific indicators, CBAM achieves a better balance between comprehensive performance, structural complexity and engineering practicability. Its structure is relatively light, the computational overhead is small, and there is no need to design complex block structure or frequency domain transformation, which is easy to integrate into the existing convolutional neural network architecture. Considering the stringent requirements of UAV and other edge computing platforms for model real-time, computing resource constraints and deployment convenience, a module that can significantly improve performance while keeping the structure as simple and efficient as possible has higher practical application value.
Therefore, based on the comparison results of systematic experiments in
Table 5 and the constraints of actual deployment, this study finally selected CBAM as the core attention enhancement strategy. This mechanism can effectively guide the model in the two dimensions of channel and space, focus on the discriminant characteristics of wildlife targets, and suppress the interference of complex background, so as to provide reliable technical support for the subsequent implementation of high-precision and high-efficiency animal detection in the real field environment.
4.3. Comparative Experiments of Different Loss Functions
The choice of boundary box regression loss function fundamentally affects the accuracy of model positioning and the convergence characteristics of training process. In order to systematically compare the effectiveness of several mainstream loss functions in the actual aerial wildlife detection scene, we used YOLOv8n as the baseline model, and carried out a group of control experiments under the same settings of training hyper parameters and data enhancement strategies. In the experiment, we replaced the original CIoU loss function of the baseline model with MPDIoU, wise-IoU (WIoU), inner-IoU and EIoU respectively, and comprehensively evaluated them in terms of detection accuracy and computational overhead. Detailed quantitative comparison results are shown in
Table 6.
From the perspective of comprehensive detection performance, the effect of all improved loss functions involved in the test exceeds that of the original CIoU. Among them, MPDIoU performed best on the core indicator mAP@0.5:0.95, which measures the comprehensive positioning ability of the model, reaching 81.0%. Compared with 75.0% of the baseline model, the absolute increase was 6.0%. This result strongly verifies the design idea of MPDIoU: by directly minimizing the distance between the two diagonal vertices of the prediction box and the real box, the model can be driven to complete accurate boundary box regression more efficiently. Especially when the IoU threshold is set higher and the matching standard is more stringent, the performance gain brought by it is particularly prominent.
From the analysis of each subdivision index, different loss functions show different characteristics. In loose matching criteria (mAP@0.5) WIoU ranked first with 96.1%, followed by MPDIoU with 95.9%. In terms of the recall rate of measuring the model checking ability, WIoU was also the highest—91.2%—and MPDIoU was 90.0%. However, MPDIoU achieves 95.0% of the accuracy index related to the model accuracy, which is better than all other methods. Inner-IoU and EIoU have also brought stable performance improvements, but the improvement is relatively limited. Overall, MPDIoU is in the leading echelon in most key accuracy indicators, and has obvious advantages in the most representative comprehensive positioning capability indicators.
In terms of model inference efficiency, the introduction of these improved loss functions does not bring significant additional computational burden. As shown in
Table 6, the average single frame inference time of each variant model is stable at about 1.6 ms and the post-processing time is basically maintained in the range of 1.0 to 1.1 ms, which is basically consistent with the efficiency level of the baseline model (1.6 ms, 1.1 ms). This shows that the replacement of the loss function mainly affects the gradient calculation and parameter update logic in the training phase, and almost does not introduce any additional time cost in the forward inference process after the model is deployed.
Considering the recognition accuracy and operation efficiency, MPDIoU is the best loss function as a whole. It not only significantly improves the comprehensive ability of the model to locate the target (especially mAP@0.5:0.95 index is improved the most), and it does not slow down the original inference speed of the model at all. Its design idea is also very ingenious. It directly optimizes the distance between the vertices of the bounding box, rather than adjusting the overlapping area, the position of the center point, the length and width ratio and other geometric factors that affect each other at the same time. The advantage of this is that the training process is more stable, and it is not easy to cause effect fluctuations due to “fighting” with different optimization goals. This may be the reason why it performs better in the complex wild scenes with dense animals and many obstructions. In contrast, although individual indicators of WIoU are higher, they are still slightly weaker in terms of overall and strict standards; however, the improvements brought by inner-IOU and EIoU are relatively limited.
Therefore, considering that MPDIoU has a significant effect on improving the accuracy and does not increase the computational burden at all, we finally choose it as the boundary box regression loss function for model training. In this way, the model is expected to meet the requirements of both high accuracy and real-time performance when UAVs perform wildlife monitoring tasks.
4.4. Generalization Verification of Dynamic Convolution
In order to verify the universality and practical effect of dynamic sampling convolution (DSConv) in different lightweight models, we added it to several commonly used lightweight YOLO models, YOLOv5n, YOLOv8n, YOLOv10n and YOLOv11n, respectively, and made a test comparison on the same wildlife data set.
From the results in
Table 7, our improved model based on YOLOv8n performs best in most key indicators. The precision is 85.5%, and the recall rate is 84.0%, mAP@0.5 is 89.0%, comprehensive positioning accuracy mAP@0.5:0.95 is 67.0%, F1 score is 84.7%. Compared with the original YOLOv8n model before improvement, the recall rate after improvement increased by 6% and mAP@0.5 increased by 5%. This shows that the dynamic sampling convolution can help the model better find those targets that are not obvious or blocked, and the positioning is also accurate. Another notable improvement is that model’s misjudgment rate dropped from 2.8% to 1.25%. a reduction of over 50%. This rendersthe detection results more reliable, especially for field automatic monitoring, which is highly sensitive to false positives (
FP).
Comparing our model with several other lightweight models, we can see that its performance is more balanced and excellent:
Although the precision of YOLOv5n is a little higher (90.0%), our improved YOLOv8n achieved comebacks in several core indicators such as recall rate, mAP@0.5, mAP@0.5:0.95 and misjudgment rate, and its comprehensive performance (see F1 score) is also better. This shows that our model can find the target more comprehensively while maintaining high accuracy, and has a stronger ability to deal with complex scenes.
Compared with YOLOv11n, our model has more advantages in precision, mAP@0.5 and misjudgment rate control, which also reflects our consideration of accuracy and result stability in model design.
Compared with YOLOv10n, the improved model is significantly ahead in all evaluation indicators, highlighting its significant advantages in dealing with such complex natural scene tasks.
Experiments show that the introduction of dynamic sampling convolution can effectively and generally improve the comprehensive detection performance of different lightweight YOLO models in complex natural scenes without significantly increasing the computational overhead. By integrating dynamic sampling convolution, CBAM attention mechanism and MPDIoU loss function, the improved YOLOv8n model constructed in this study achieves a good balance between detection precision, target recall rate, comprehensive positioning accuracy and misjudgment, thus providing a high-precision and high reliability real-time detection solution for wild animals for a UAV platform with limited computing resources.
4.5. Generalization Verification of CBAM
In order to evaluate the generalization ability of CBAM and its enhancement effect on a variety of lightweight models, we embedded it into the four mainstream architectures of YOLOv5n, YOLOv8n, YOLOv10n and YOLOv11n respectively, and used the same wildlife data set for performance comparison.
Table 8 summarizes the detailed experimental data. We systematically analyze the impact of CBAM on different models from three dimensions: detection precision, model robustness and overall efficiency.
The experimental results demonstratethat integrating CBAM into basic YOLOv8n leads to improved performance. Specifically, the precision of the improved model reached 87.0%, the recall rate was 85.0%, and the mAP@0.5 was significantly improved to 90.5%. Compared with the original model without attention mechanism, these three indicators increased by 2.0, 8.0 and 9.5 percentage points in turn. It is particularly obvious that the misjudgment rate of the model dropped from 2.45% to 1.1%, a drop of more than half. This shows that CBAM’s “channel first, spatial second” attention design is indeed useful. It allows the model to first determine which channels’ information is more important, and then identify the key areas in the picture in these channels. In this way, the model can not only better find the target, but also effectively avoid misjudgment due to the clutter of the background.
By horizontally comparing our improved model with other lightweight models, we can further clarify its advantages:
Although YOLOv5n has a slightly higher precision (91.0%), its recall rate (80.0%) and comprehensive F1 score (81.8%) are lower than those of the improved model (85.0%, 86.5%), and its misjudgment rate (3.3%) is higher, indicating that its overall robustness in complex scenes is insufficient. YOLOv11n performs well on mAP@0.5 (91.0%) and mAP@0.5:0.95 (69.0%), but its misjudgment rate is as high as 4.0%, which is 3.6 times that of the improved model. It may produce too many false alarms in the actual deployment. The indicators of YOLOv10n are obviously backward, especially the misjudgment rate that is as high as 8.0%, which is of low practicability in the current task.
The experimental results show that the introduction of CBAM can synergistically improve the detection accuracy and result reliability of the YOLOv8n model. The improved model achieved a good balance among recall rate, comprehensive accuracy (mAP@0.5) and misjudgment rate control, and its F1 score (86.5%) was also the highest among all the comparison models. Although YOLOv11n has some advantages in some absolute accuracy indicators, its high misjudgment rate is a key defect in the actual wildlife monitoring. Therefore, the improved YOLOv8n model of CBAM is integrated to ensure a high target detection rate and a very low level of misjudgment rate, which provides an efficient, reliable and lightweight detection scheme for applications requiring strict reliability of results, such as UAV automatic patrol testing.
4.6. Generalization Verification of MPDIoU
In order to systematically test the effectiveness and generalization of MPDIoU loss function in different lightweight models, we applied it to several mainstream architectures, such as YOLOv5n, YOLOv8n, YOLOv10n and YOLOv11n, respectively, and verified it on the same data set.
Table 9 details the performance of each model after using MPDIoU, focusing on the evaluation of the universal application effect of the loss function on improving the model (especially the positioning accuracy and result credibility).
From the results in
Table 9, the improved YOLOv8n model using MPDIoU performs best overall. Specifically, the precision is 86.5%, the recall rate is 85.0%, the mAP@0.5 is 90.0%, comprehensive positioning accuracy mAP@0.5:0.95 is 63.0%, and the F1 score is 85.7%. An obvious improvement is that the misjudgment rate of this model has been significantly reduced to 1.2%, which is much lower than the 2.5% of the original YOLOv8n model—with a reduction of more than half. These data show that MPDIoU not only makes the positioning more accurate by directly optimizing the vertex distance of the bounding box (reflected in the improvement of mAP@0.5), but also significantly reduces the misidentification of background or noise as targets, which makes the results given by the model more reliable.
Comparing our improved model with several other mainstream lightweight models, we can find that it has achieved a better balance between accuracy and robustness. Although YOLOv5n has a slight advantage in precision (90.0%), its recall rate (72.0%) is significantly low, and the misjudgment rate (3.5%) is almost three times that of the improved YOLOv8n, indicating that it has shortcomings in target recall rate and result reliability. YOLOv11n in mAP@0.5 (88.0%) and other indicators perform well, but the misjudgment rate is as high as 4.2%. For wildlife monitoring applications requiring high confidence, this level of misjudgment may be difficult to accept. The indicators of YOLOv10n are relatively low, especially the misjudgment rate reaches 8.5%, and its practicability in practical application scenarios is limited.
These experiments confirm that the introduction of MPDIoU loss function can effectively improve the positioning accuracy of YOLOv8n model in complex scenes and significantly reduce the misjudgment rate. The improved model achieves a better balance among recall rate, average accuracy and false alarm control. Although some models may have a slight lead in a single indicator (such as precision), this is often at the cost of sacrificing recall rate or tolerating a higher misjudgment rate. In the practical task of UAV wildlife monitoring, which has high requirements for the reliability and integrity of the detection results, low misjudgment rate and high comprehensive accuracy are very important. Therefore, the improved YOLOv8n model integrated with MPDIoU loss function provides a competitive solution for realizing lightweight target detection with high accuracy and reliability.
4.7. Ablation Study
In order to systematically verify the effectiveness of the three core improvements proposed in this paper, namely MPDIoU loss function, CBAM and dynamic sampling convolution—and the effect of their joint work—we conducted a series of ablation experiments on the YOLOv8n benchmark model under a unified setting.
Table 10 shows the performance changes in the model after gradually adding each improved module, which helps us quantitatively evaluate the individual contribution of each component and the effect of their combination.
Take a look at the most basic model, that is, the original YOLOv8n without any improvement (Experiment 1 in
Table 10). The precision is 90.7%, the recall rate is 86.9%, mAP@0.5 is 92.8%, comprehensive positioning accuracy mAP@0.5:0.95 is 74.2%, and the calculation amount is 7.9 GFLOPs.
Next, let us look at the effect of each improved module separately:
After adding MPDIoU loss function alone (Experiment 2), the detection indexes of the model were significantly improved—the mAP@0.5 increased to 95.2% and the mAP@0.5:0.95 reached 79.1%. This shows that MPDIoU can effectively improve the positioning accuracy by directly optimizing the distance between the vertices of the bounding box, especially in the case of more stringent matching requirements.
When only the CBAM attention module was added (Experiment 3), the recall rate (90.2%) and mAP@0.5 (95.4%) showed outstanding performance. This means that its “channel-first, spatial-second” attention mechanism can help the model grasp target features more accurately and reduce missed detections.
Introducing the Dynamic Sampling Convolution Module (DSConv, Experiment 4) separately significantly improved the deployment efficiency of the model while maintaining detection accuracy. Compared to the baseline, its computational complexity has been reduced to 6.8 GFLOPs, and the single frame inference time and post-processing time have been shortened to 0.8 ms and 0.5 ms, respectively, indicating that DSConv has significant advantages in lightweight design while maintaining a robust improvement in accuracy. The effectiveness of DSConv is rooted in the synergistic cooperation of its two core mechanisms: one is the dynamic offset mechanism, which enables sampling points to adaptively cluster in the effective area of the target based on image content, improving the quality of feature reconstruction for small targets. The second is the pixel rearrangement mechanism, which fully preserves the spatial information of the original pixels during the feature down sampling process, providing a more accurate initial feature distribution for the offset mechanism. The two functions are orthogonal and complementary to each other—pixel rearrangement ensures the integrity of feature input, while dynamic offset achieves precise adjustment of sampling position on this basis. Removing any component separately will result in a decrease in small object detection performance, and both are indispensable.
When we begin to combine modules, we can see that they can cooperate well with each other. Using MPDIoU and CBAM at the same time (Experiment 5), or CBAM and dynamic convolution (Experiment 6), the precision is higher than using only a single module, indicating that the functions of these modules are complementary. The combination of MPDIoU and dynamic convolution (Experiment 7) found a good balance between accuracy and efficiency.
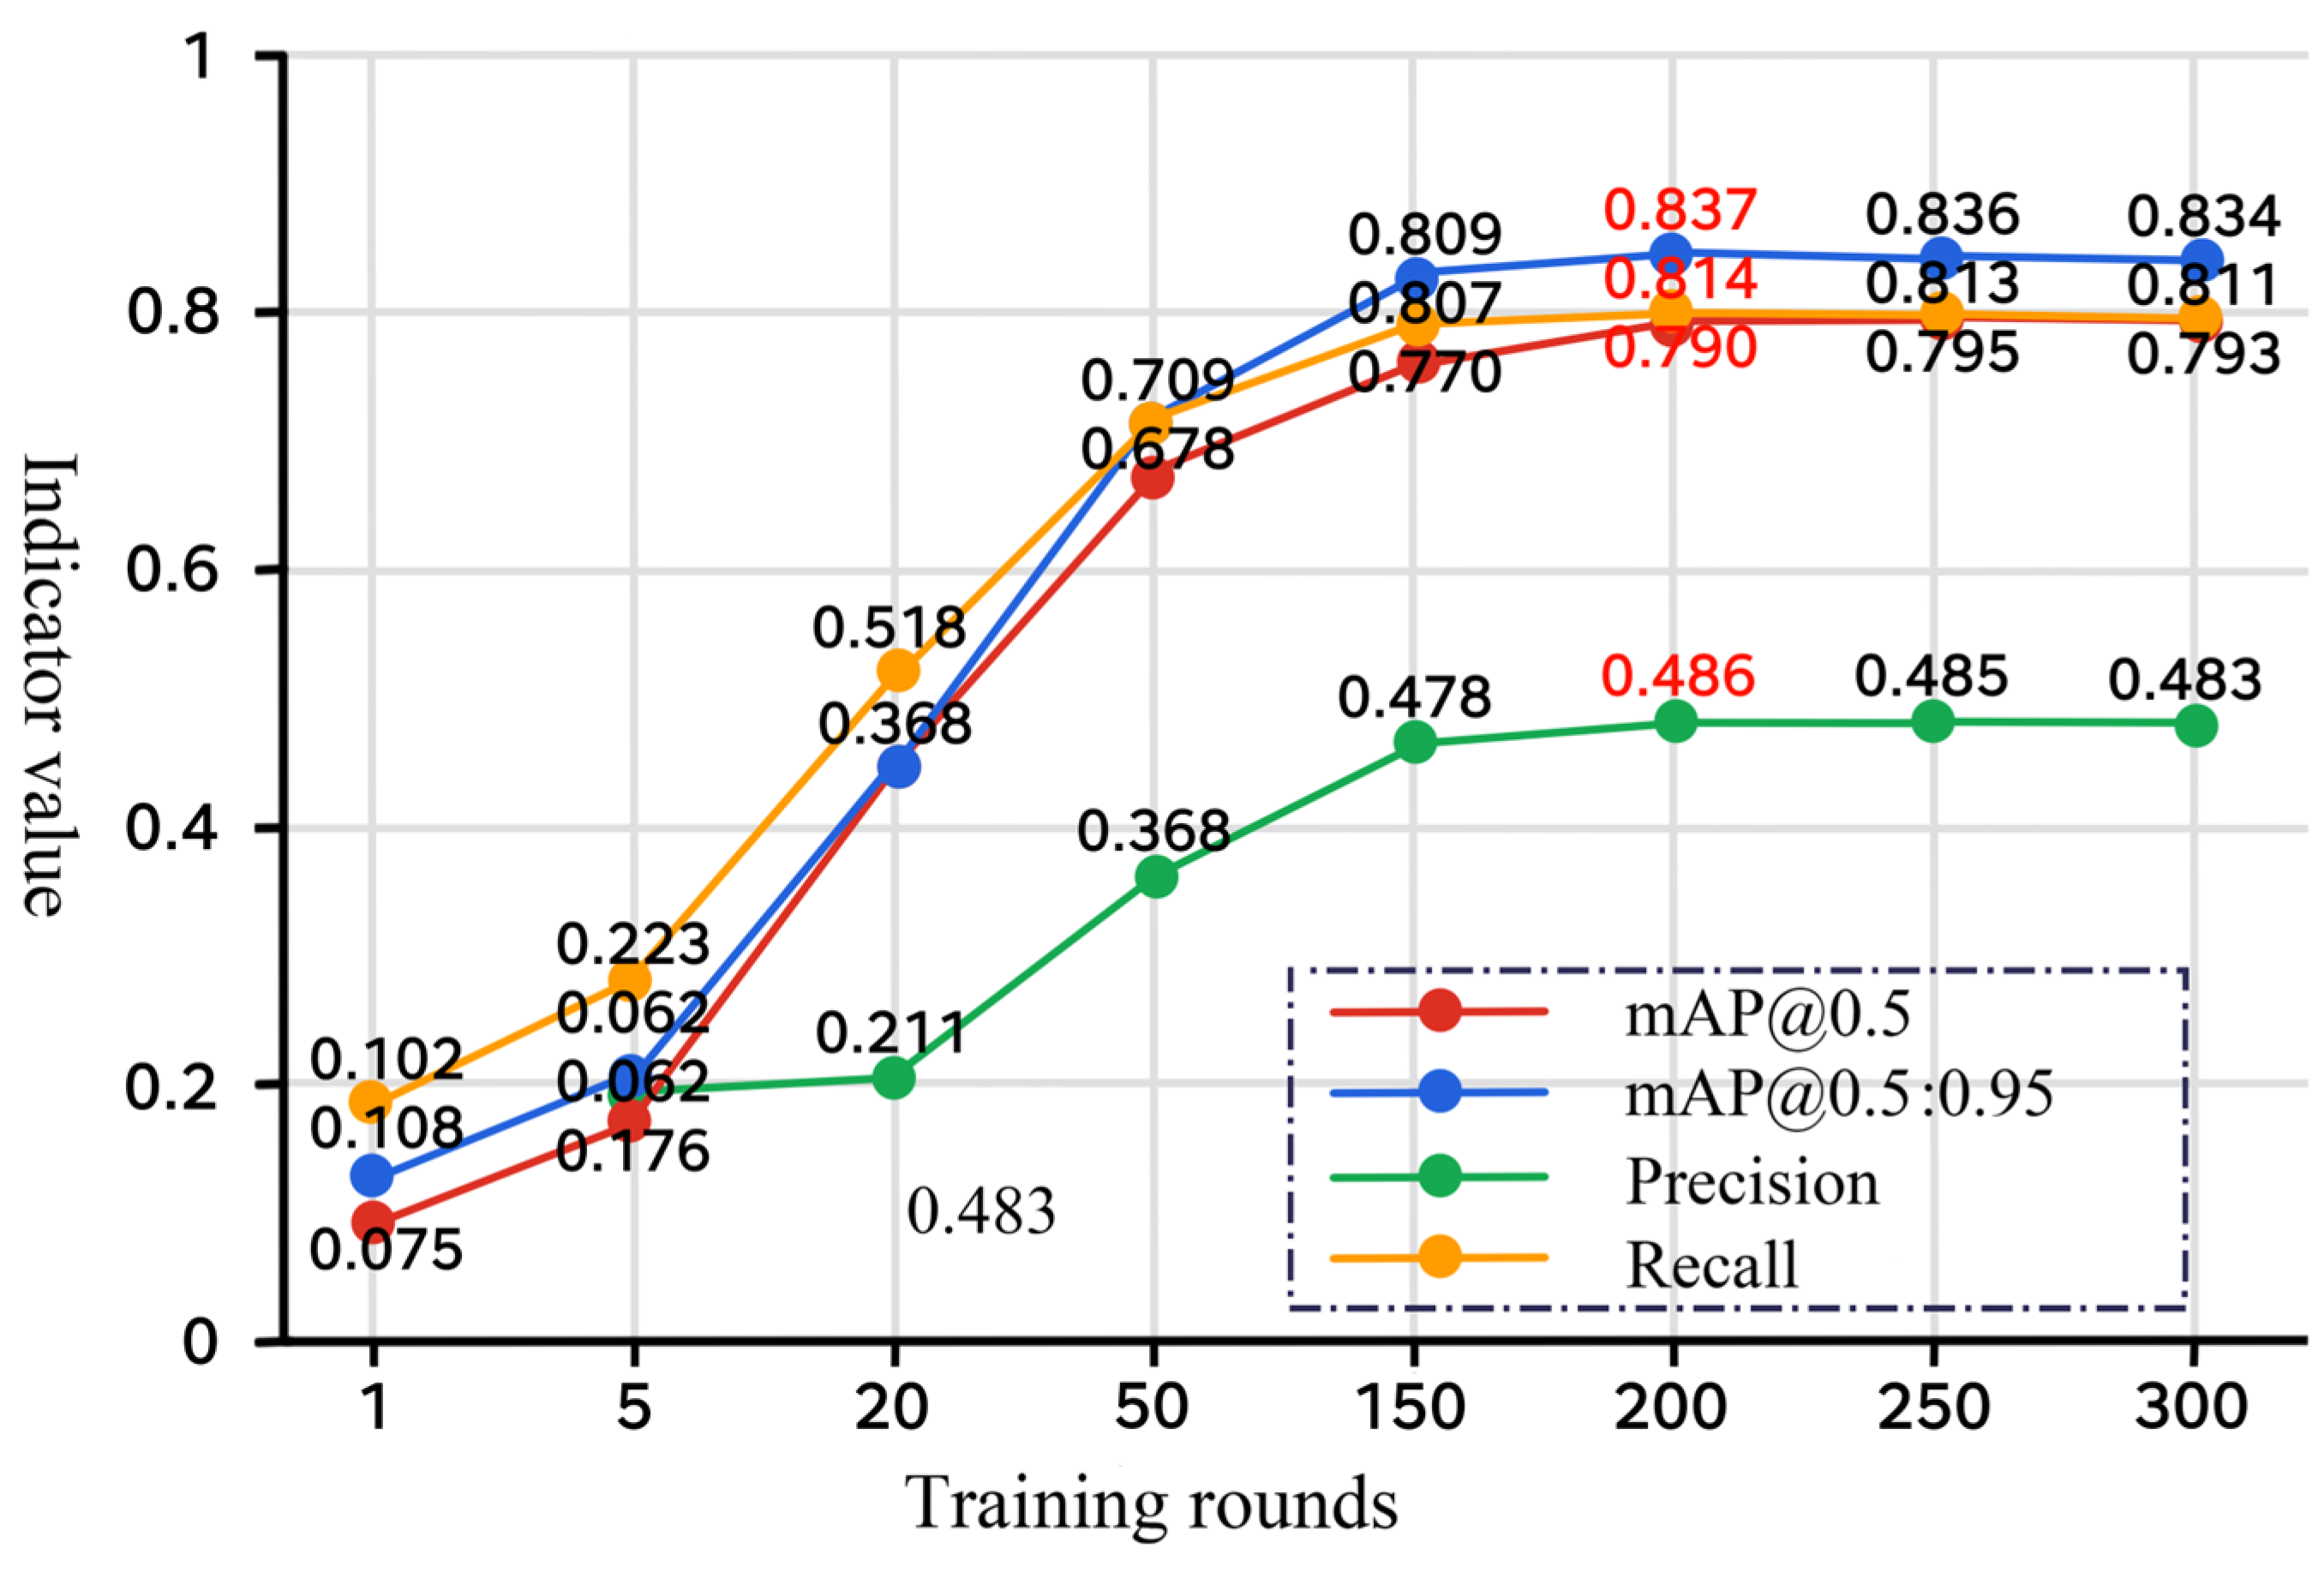
Finally, the model that integrates the three improved modules (Experiment 8) achieved the best comprehensive performance: the precision is 94.6%, the recall rate is 91.2%, mAP@0.5 and mAP@0.5:0.95 are increased to 96.4% and 80.1% respectively, which comprehensively exceeded the benchmark model and was better than any combination of single or two modules. Moreover, its computational complexity is controlled at 7.0 GFLOPs and the inference time and post-processing time are only 1.3 ms and 0.6 ms, respectively, which still maintains an efficient running speed.
Overall, this experiment shows that the three improved modules we proposed have clearly brought performance improvements: MPDIoU mainly improves the positioning accuracy, CBAM enhances the ability to identify targets and reduce missed detection, and dynamic sampling convolution significantly optimizes the computational efficiency. More importantly, when the three work together, they produce the effect of “1 + 1 + 1 > 3”, which is the best in many indicators, while maintaining a very fast inference speed, and truly achieving a balance between accuracy and efficiency. This also verifies the effectiveness of our improved scheme, and provides a feasible lightweight detection model construction idea for UAVs, which have high requirements for speed and accuracy.
4.8. Comparison and Analysis of Visualized Detection Results
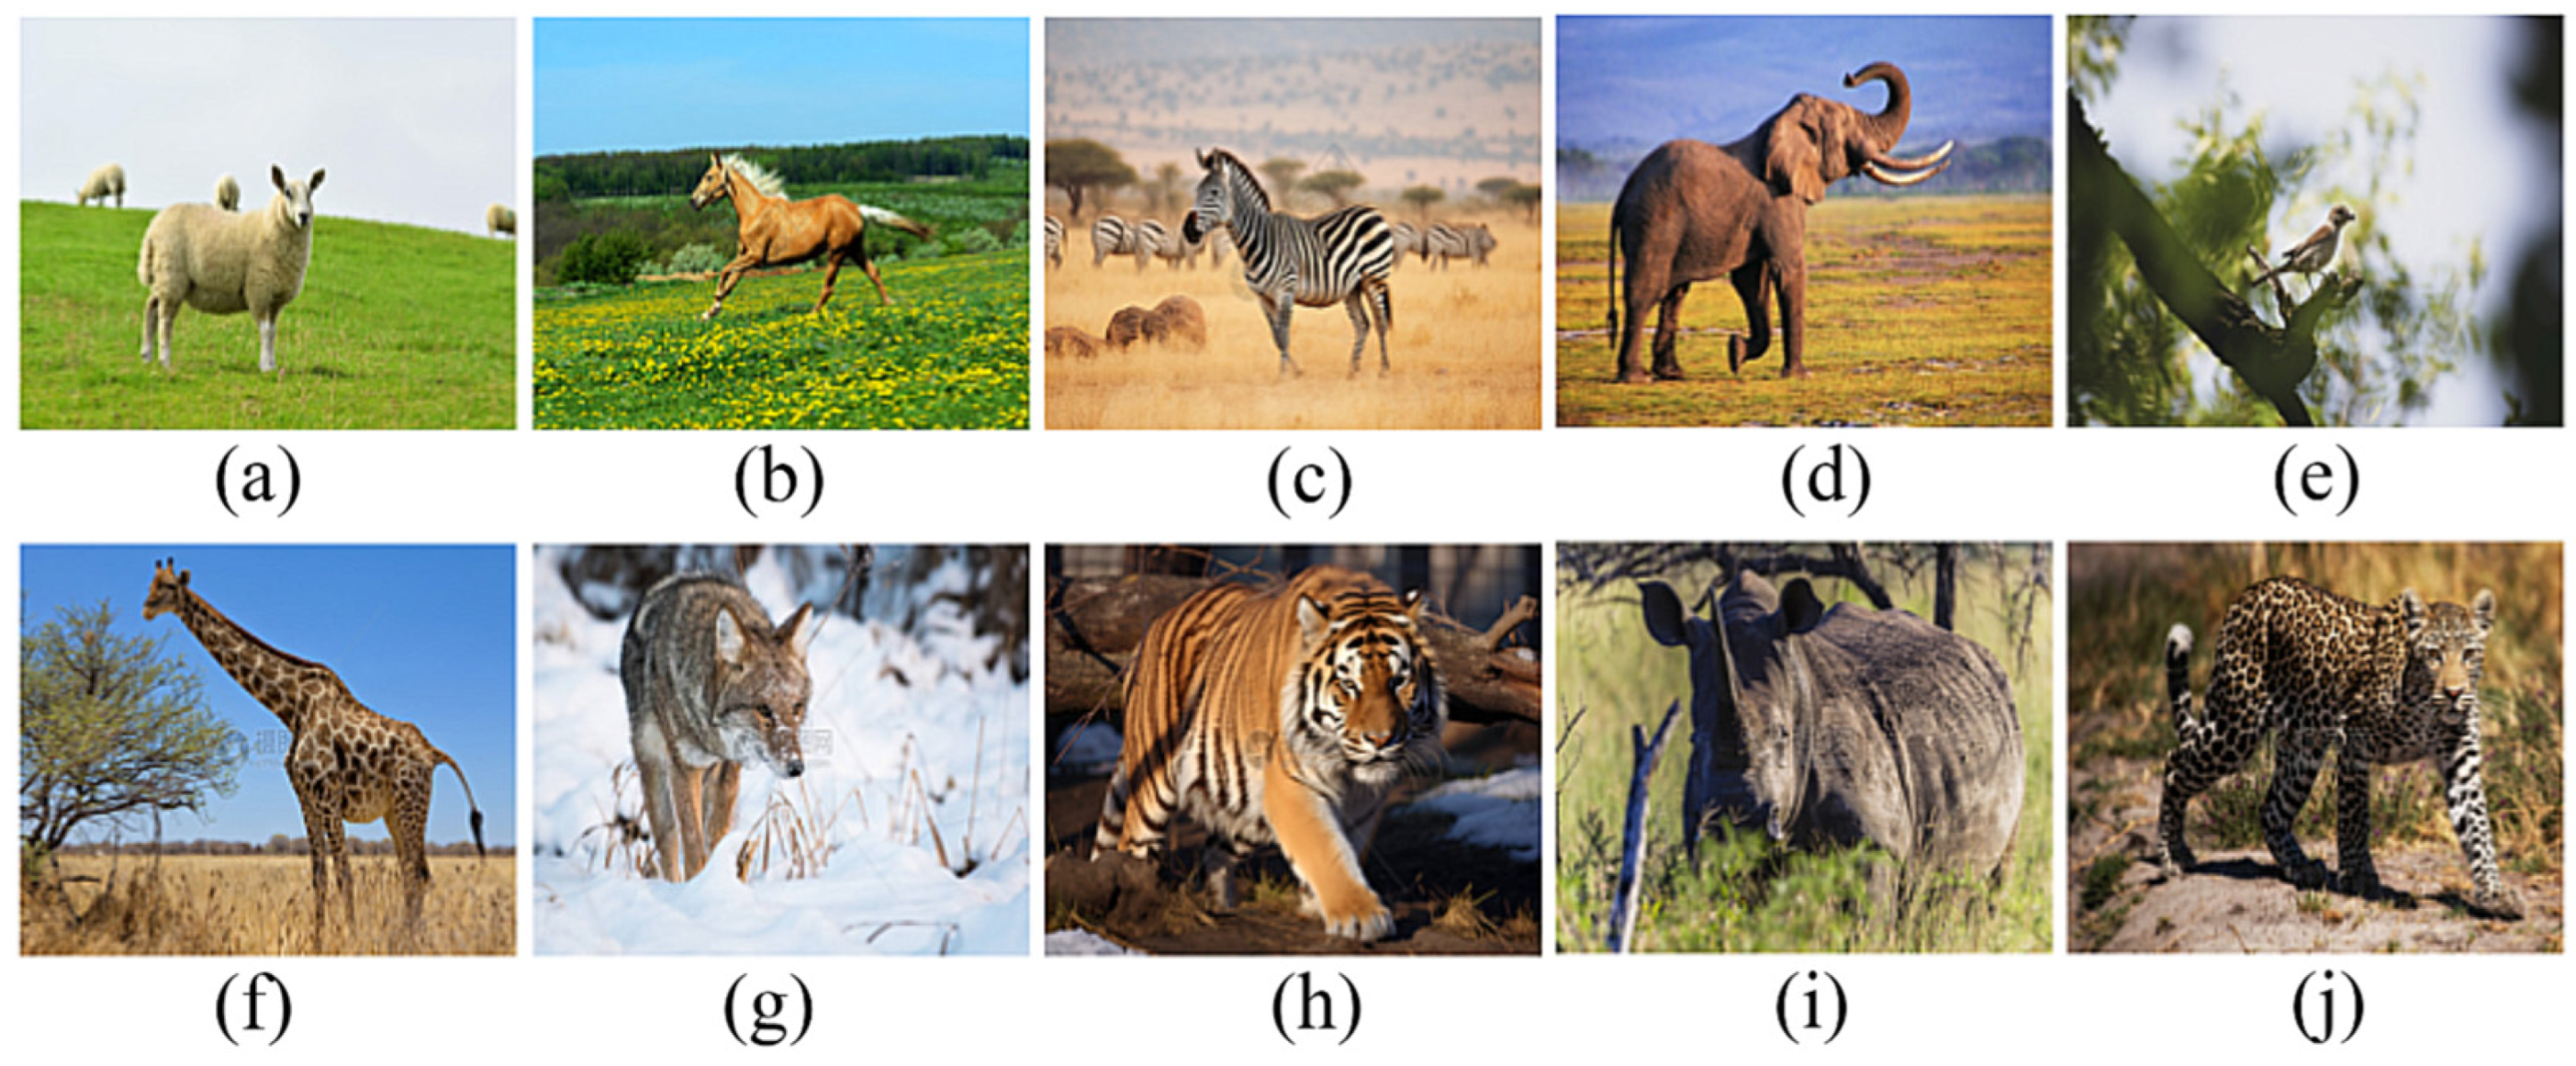
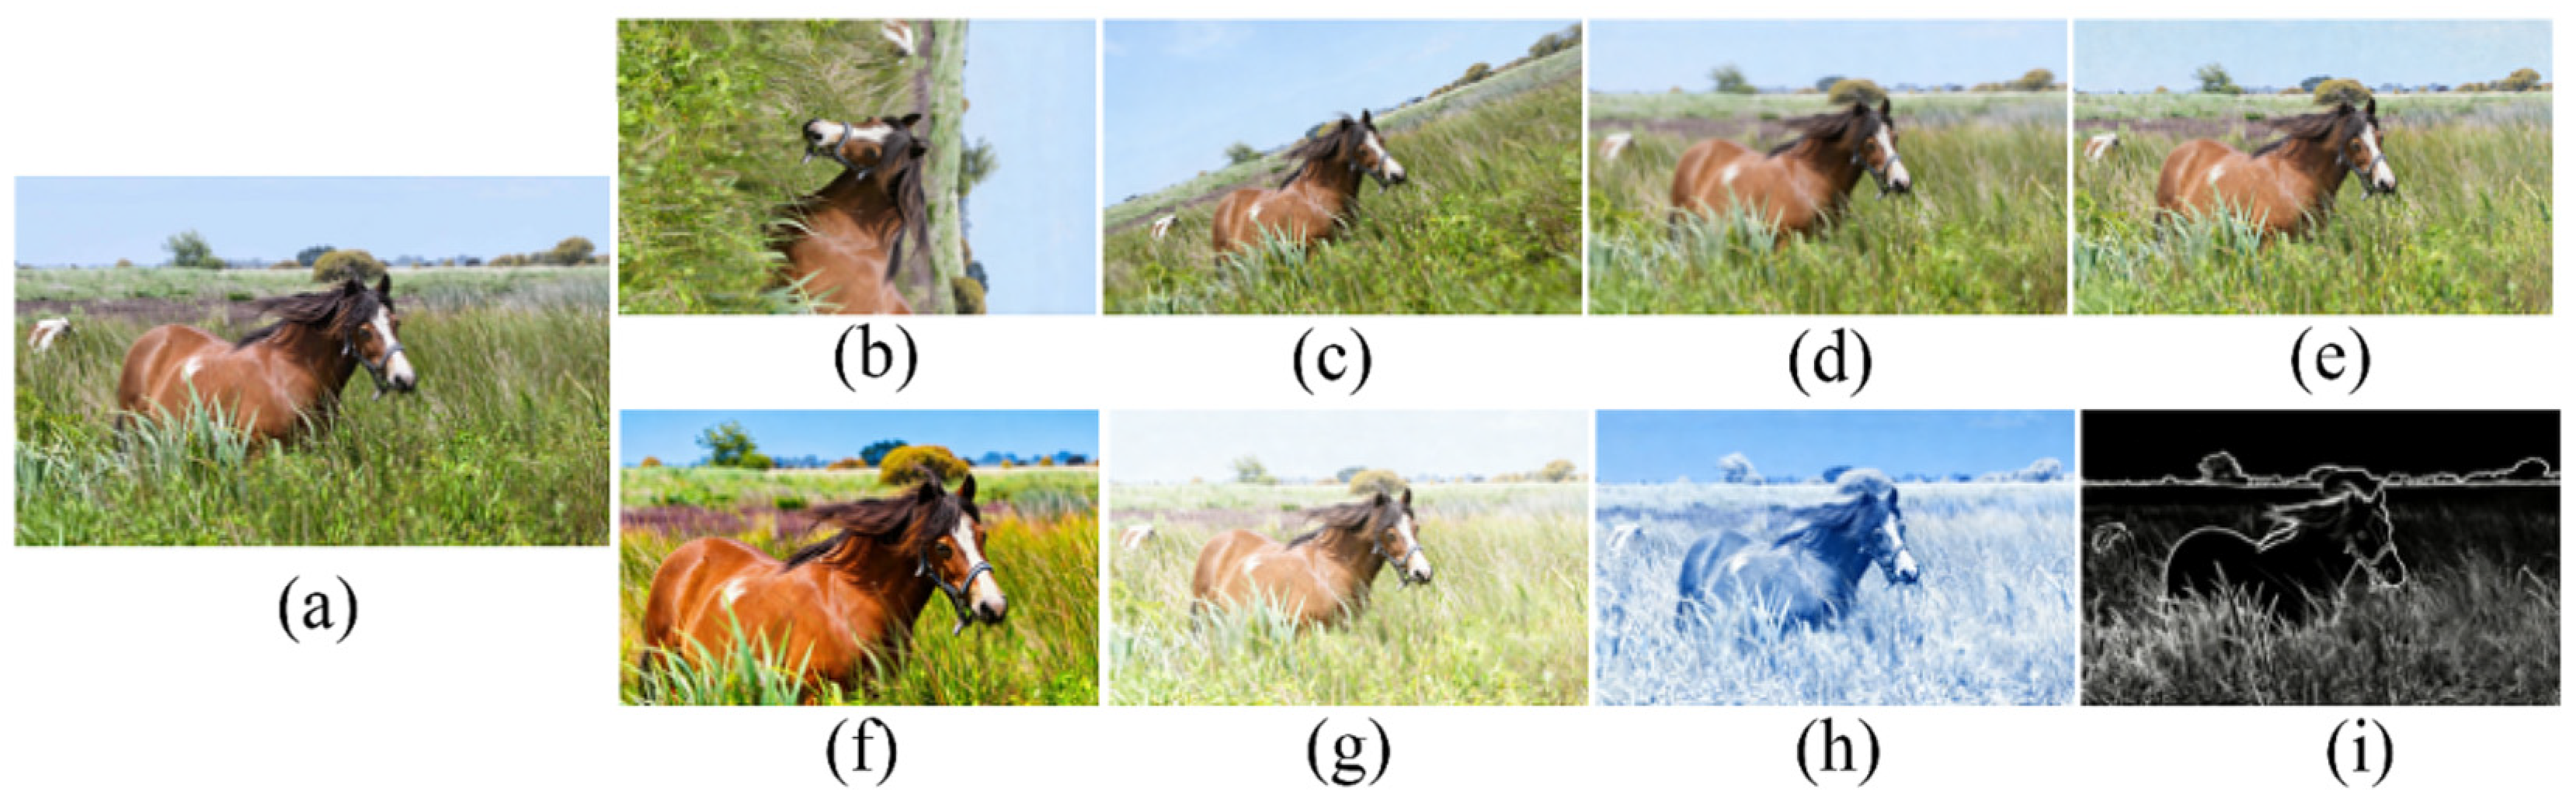
In order to test the specific performance of the improved model in complex real-world scenarios, we selected some images from our self-made dataset for validation. The self-made dataset consists of self-built real-life images and some external publicly available datasets. The self-built images were captured using a DJI M300 RTK UAV equipped with an H20T camera, with a pitch angle range of −120° to +60°, and flight heights set at 10 m, 20 m, and 30 m. All actual images were collected at a fixed resolution of 3840 × 2160. To enrich the scale and lighting diversity of the samples, we introduced daytime images from two publicly available datasets as supplements. The original acquisition parameters are as follows: WAID, original image resolution 2048 × 1536, acquisition flight altitude range 10–30 m; MMLA, original image resolution 3840 × 2160, acquisition altitude range 5–15 m.
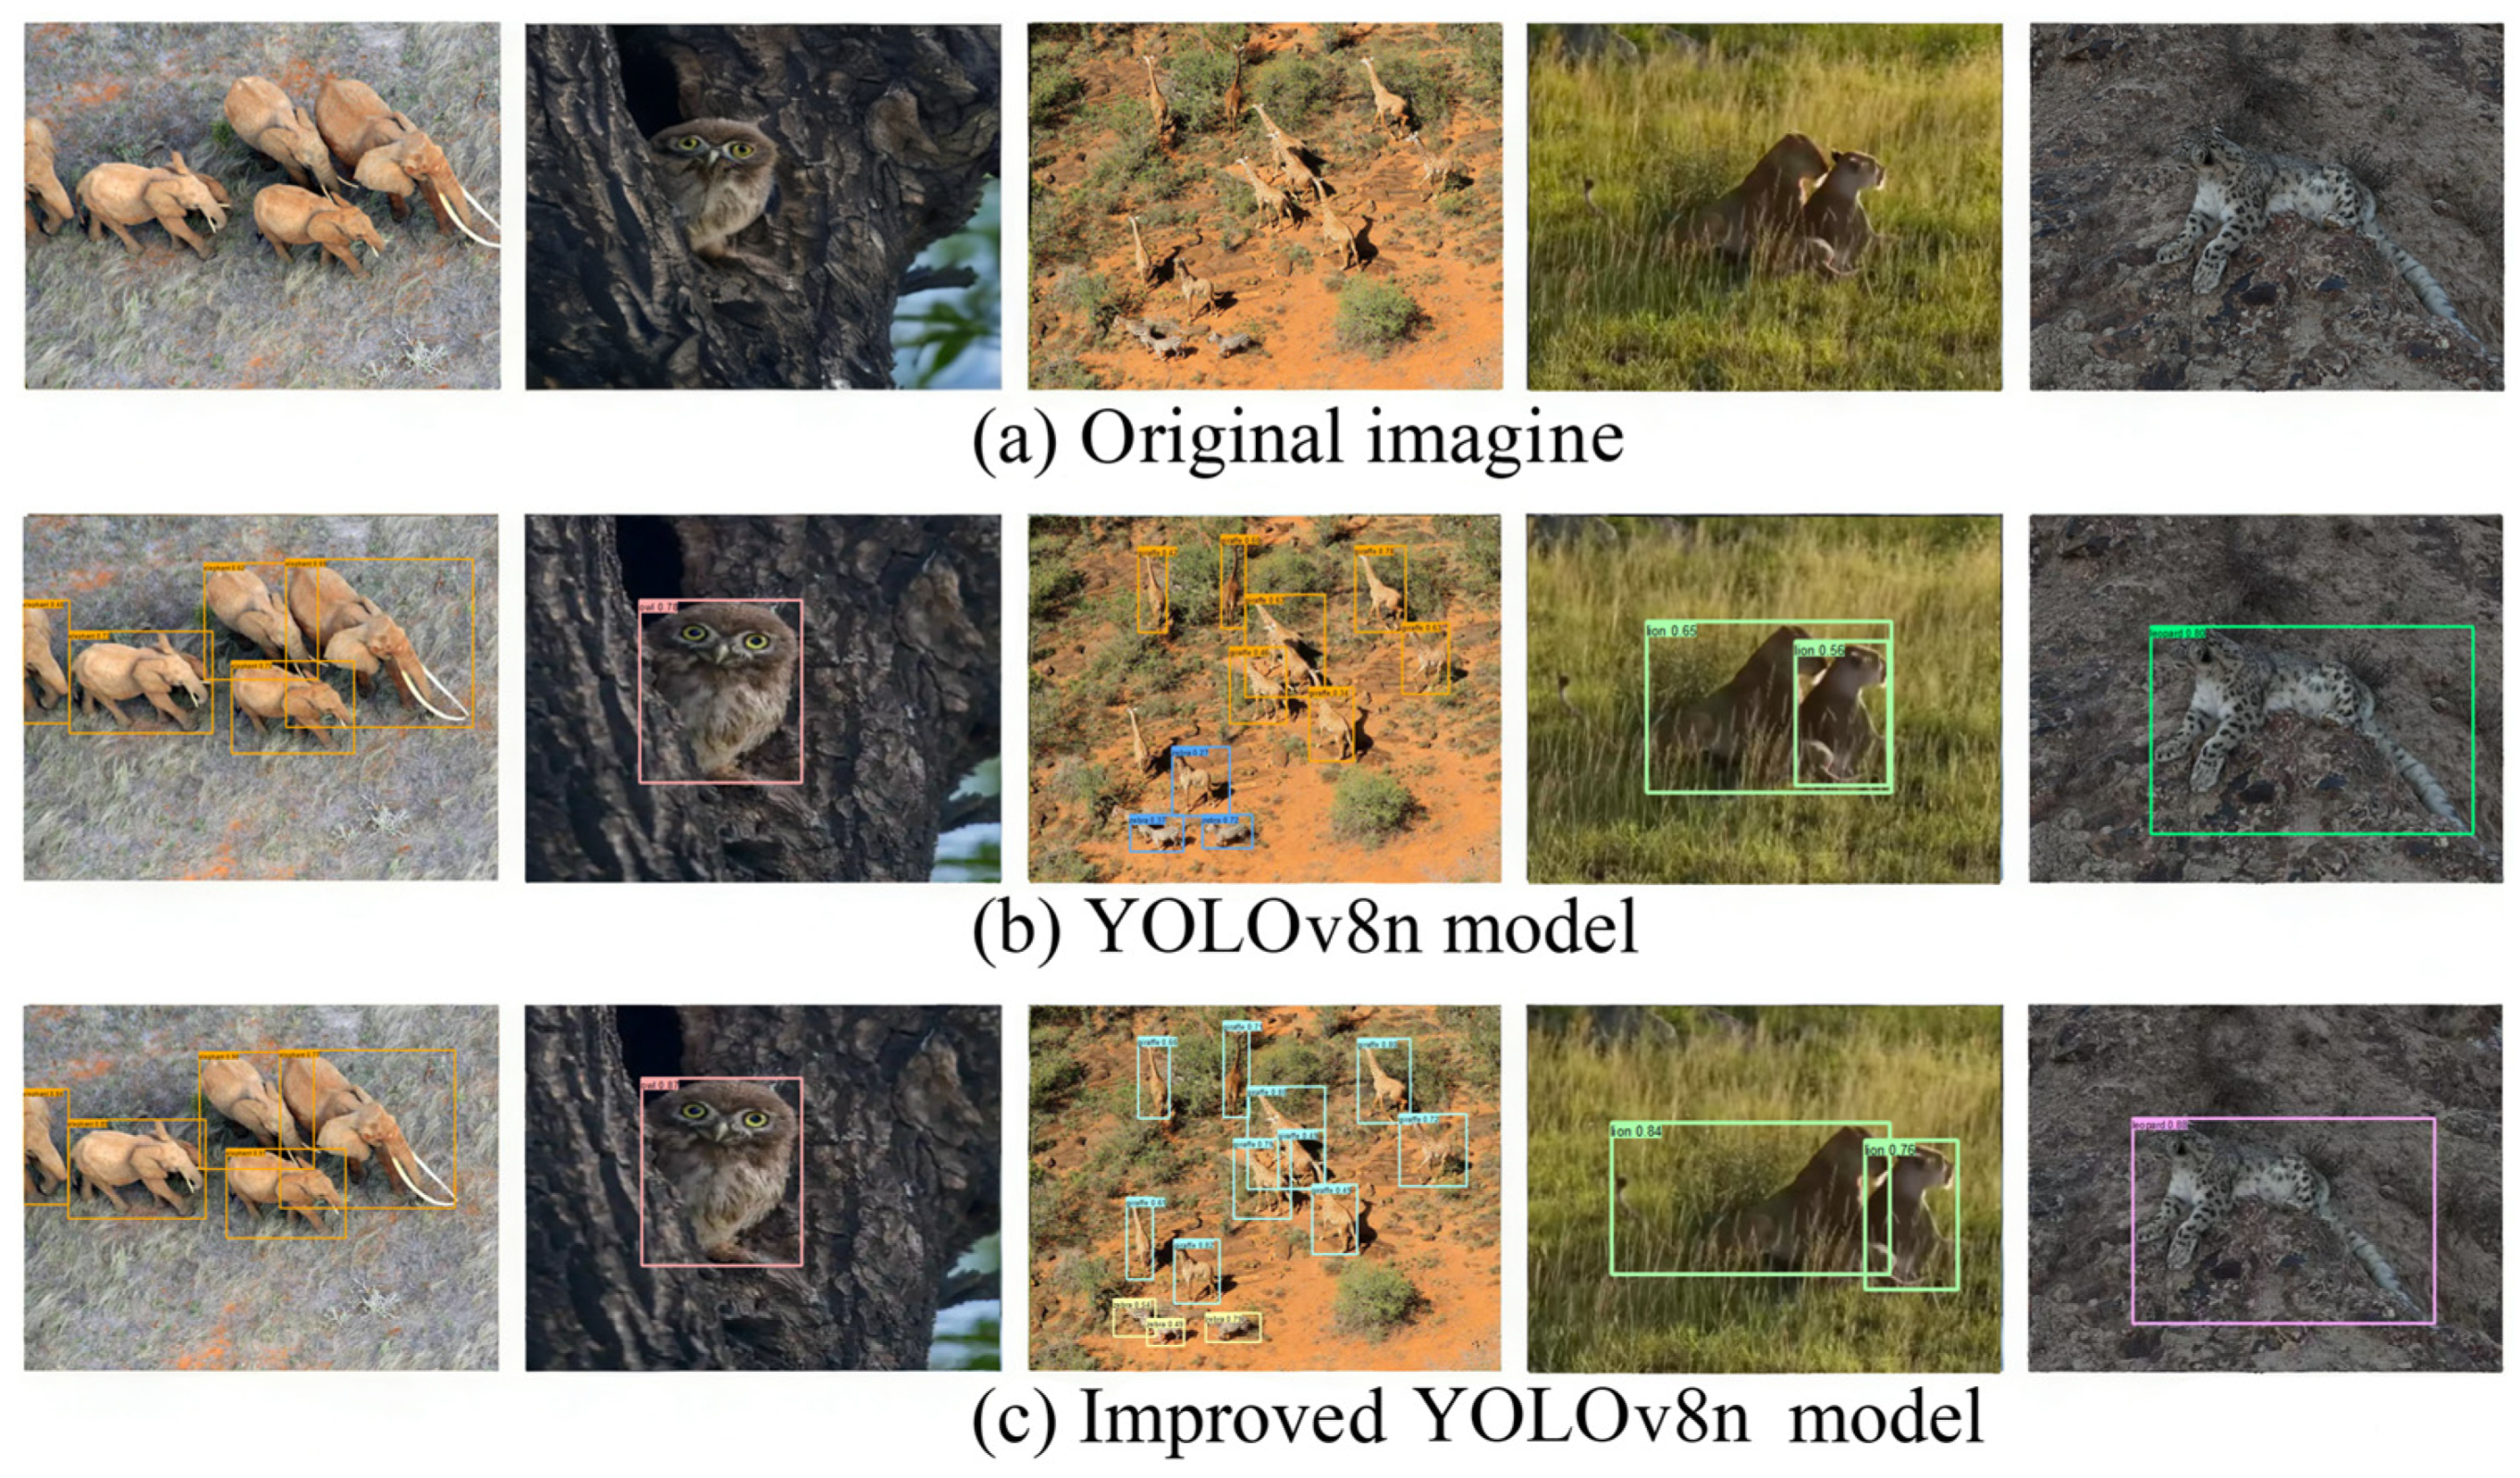
Figure 9 compares the detection effect of the improved model and the original YOLOv8n on five typical wildlife pictures. Where (a) is the original image, (b) is the detection result of the original model, and (c) is the result of our improved model. Through the comparison of these five groups of pictures, we can clearly see the advantages of the improved model in a variety of difficult situations. Although the original model found all the elephants, the confidence score given by it was generally not highs, hovering between 0.40 and 0.75, with an average of only 0.64. The improved model was not only detected all targets, but the confidence score increased to 0.77 to 0.91, with an average of 0.86.
For an image of an owl resting on a tree trunk and almost blending into the bark, the original model detected the owl with a confidence score of 0.67. The improved model achieves higher accuracy, with a score of 0.89, demonstrating its ability to accurately capture target features even in extreme camouflage cases.
In the complex picture of a giraffe with an untypical posture and a background of red soil and sparse vegetation, the original model was a little “powerless”: the average confidence was only about 0.53, two places were missed, and a giraffe was even mistaken for a zebra. The improved model successfully solved these problems without missed detection and misjudgment, and accurately found all individuals with an average score of 0.69.
In one image, a lion is lying in yellow-green grass with a color similar to its body, and its body is partly covered. The average score of the original model is 0.61, while that of the improved model increased to 0.80. Moreover, the detection frame provided by the improved model fits more closely with the lion’s body contour, indicating that it can better eliminate the interference of the similar background and lock the target.
A leopard lying on the gray brown ground with low contrast with the background in the distance was recognized by the original model with a score of 0.80. The improved model further raised the score to 0.88, reflecting that it has stronger recognition ability and strong ability to eliminate background interference under the condition that the target and background are extremely similar.
These comparison results intuitively show that the improved model has made comprehensive progress in detection confidence, target recall rate and boundary box positioning accuracy. These improvements can be attributed to the three improvements we have joined together.
Firstly, the core function of Dynamic Sampling Convolution (DSConv) is to learn from content aware offsets and cluster sampling points towards the direction of maximum feature response gradient, thereby achieving accurate reconstruction of target details. This mechanism has a particularly significant gain for small and medium to long range targets—in extremely small target scenes (owls), DSConv increases the feature response value of the target area from 0.12 to 0.41, making the contours that were originally submerged in noise clear and distinguishable. In occluded scenes (lions in the grass), DSConv significantly increased the target background contrast from 0.35 vs 0.28 to 0.52 vs 0.19, effectively enhancing the discrimination between targets and interferences. Further analysis of effective response areas shows that 73% of the newly added effective responses in DSConv are concentrated near the target annotation box, while the newly added responses in the background area are extremely rare, proving its precise enhancement of target features rather than simple fuzzy enhancement. The above evidence collectively indicates that DSConv effectively solves the problem of small target feature loss and strong background interference through adaptive optimization of sampling points.
Secondly, CBAM attention mechanism enables the model to focus on “what is important” and “what characteristics are important”. This effectively suppresses the interference of clutter background such as “grass” (lion scene) and “tree trunk” (owl scene), and highlights the characteristics of animals themselves. This is why the improved model has higher confidence when the background is very similar.
Finally, the MPDIoU loss function directly optimizes the positions of the four corners of the detection box, so that the model can get more accurate positioning supervision during learning. This is directly reflected in all scenes. The prediction frame of the improved model is more suitable for the actual contour of animals, especially in the cases of lions and leopards with occlusion or special posture.
This comparison intuitively proves that our portfolio improvement strategy is practical and effective. The improved model is obviously stronger than the original model in the sensitivity of recognition, the grasp of judgment and the accuracy of positioning, especially regarding problems often encountered in UAV monitoring, such as small target, serious occlusion, good camouflage or similar background. This verifies the effectiveness and practical value of this method from the visual interpretable level.




 ,
,