


Abstract
Surface deformation of a phased array antenna (PAA) induced by external loads can degrade its radiation performance. To restore the beam of a deformed PAA, this paper proposes a new strain–excitation mapping model (SEMM) capable of rapidly calculating excitation adjustments based on measured structural strains. In the derivation of the SEMM, an analytical formula establishing the relationship between antenna excitations and the element positions and orientations for a PAA with an arbitrary surface shape is derived using the projection principle. Subsequently, the positions and orientations of the elements are expressed as functions of a limited number of strain measurements from the deformed antenna structure. An X-band PAA experimental system, equipped with a deformable mechanism and strain measurement capabilities, was developed. Two typical deformations were taken as examples to validate the proposed SEMM. Experimental results demonstrate that the SEMM can effectively recover the distorted pattern across the observation region. Compared with existing models, the proposed model achieves better sidelobe recovery. The rapid computation capability and analytical formulation of the SEMM make it highly suitable for developing an adaptive PAA that can autonomously preserve radiation beam quality under in-service deformations.
1. Introduction
Nowadays, phased array antennas have been used extensively for several high-tech industries such as aerospace, radars and 5G communication [1,2,3], because of their multiple beams, ultralow sidelobes and fast beam steering. Furthermore, with the advancement of flexible electronics and manufacturing technology, phased array antennas (PAAs) are often required to be mounted on supporting structures with unstable shapes. For instance, typical applications include conformal antennas [4] and flexible antenna arrays [5]. However, surface shape changes in the PAA make it difficult to meet desired performance requirements. Studies have shown that PAA deformation leads to the tilting and broadening of the main beam, reduced gain and increased sidelobe level [6,7,8,9]. Therefore, it is necessary to develop a correction method for such antenna arrays to mitigate the effect of changing surface shape on the antenna radiation performance.
Regarding beam recovery for deformed planar phased array antennas (PAAs), current solutions are primarily categorized into mechanical and electrical correction methods. The mechanical correction method indirectly adjusts radiation patterns by employing a drive mechanism to counteract array deformation induced by external loads. For instance, Lu et al. [10] studied a shape adjustment method utilizing cables as actuators, and this method controls the force and position of the cables to compensate for thermally induced deformation in large planar PAA structures based on settlement conditions. However, this method typically necessitates additional installation space for the adjustment mechanism and fails to meet real-time in-service correction requirements due to its slow actuation speed.
In contrast to the mechanical correction method, the electrical correction method is based on the beam steering theory of the PAA, and it recovers the radiation patterns of a deformed PAA by adjusting the excitations of antenna elements. For the electrical correction of the deformed PAA in service, there are two major methods for obtaining the excitation adjustment values. One is to determine the excitation adjustment values by measuring the difference in all element fields that occur in the interval before and after the PAA deformation [11]. This method requires an additional antenna and receiver, which affects the radiation performance of the PAA and increases the complexity of the PAA system. The other is to calculate the excitation adjustment values according to the measured PAA deformation. In [12,13], the beam of the PAA with several regular deformations is corrected by adjusting the excitation phase according to the deformation measured by resistance sensors. However, in practice, the deformation of a PAA is usually arbitrary and unknown.
In recent years, an adaptive correction method for the deformed PAA with arbitrary deformations was proposed in our previous work [14]. According to a strain–displacement transform model, the surface shape of the deformed PAA is first reconstructed using measured strains from a distributed FBG (Fiber Bragg Grating) sensor network. Then, the excitation adjustment values are calculated according to the reconstructed element displacements. The key to this method lies in constructing a fast mapping model from strain to excitation.
Multiple approaches are available for the derivation of mapping models. The study in [15] categorizes these approaches into three types: phase-based methods, fast Fourier transform (FFT)-based methods, and least squares methods. Furthermore, optimization algorithms, such as the genetic algorithm (GA) and particle swarm optimization (PSO), have also been adopted to construct compensation models [16,17]. Among these methods, both the least squares method and optimization algorithms enable full-region compensation for radiation pattern characteristics across the entire observation area via the simultaneous adjustment of excitation amplitudes and phases. Nevertheless, the compensation performance of the aforementioned three methods is highly dependent on the accuracy of the estimated distorted radiation pattern. In practical scenarios with time-varying deformations on the phased array antenna (PAA) surface, rapid and high-precision radiation pattern estimation remains a challenging task.
Both the phase-based methods and fast Fourier transform (FFT)-based methods belong to analytical approaches. These methods enable the direct calculation of antenna excitations from reconstructed displacements without iterative operations. Consequently, their feasibility and effectiveness have been investigated and experimentally verified in existing studies [14,18]. Nevertheless, the mapping model established by the phase-based method exhibits limited performance in sidelobe level (SLL) recovery. Meanwhile, the FFT-based mapping model is only applicable to beam recovery for slightly deformed phased array antennas (PAAs), which is constrained by the small-displacement assumption.
In this paper, a novel strain–excitation mapping model (SEMM) is derived based on projection theory, which addresses the limitation of existing correction models in effectively restoring the sidelobe level (SLL) of deformed phased array antennas (PAAs). Unlike previous studies, this work innovatively adopts the projection synthesis principle [19,20] to construct the mapping model for the first time. The proposed model takes into account not only the element displacements on deformed PAA surfaces but also the variations in element orientations. The main contributions of this paper are summarized as follows:
(1) For the first time, an analytical formula is derived based on the projection synthesis principle. This formula establishes a quantitative relationship between the complex excitations of antenna elements and their spatial positions and orientations under arbitrary PAA surface deformation.
(2) A SEMM is proposed by integrating the derived analytical formula with strain-posture functions, which convert measured strain data into the positional and orientational parameters of antenna elements. The proposed SEMM enables rapid calculation of element excitations using discrete structural strain data collected from deformed PAA surfaces.
(3) An experimental platform with active deformation compensation capability for deformed PAAs is developed, and two typical deformation experiments are conducted. Based on the established platform, the applicability and inherent limitations of three existing mainstream models are comprehensively discussed. Experimental results verify that the active electrical compensation system equipped with the proposed SEMM achieves superior recovery performance for distorted radiation patterns.
The remainder of this paper is organized as follows: Section 2 first elaborates the beam recovery principle based on the SEMM, and briefly introduces the fundamental principles of the phase-based and FFT-based methods. Section 3 presents the derivation and implementation of the proposed projection-based SEMM. Section 4 details the construction of the experimental platform, and two groups of deformation experiments are conducted to validate the effectiveness of the proposed model. Finally, Section 5 provides the discussion of experimental results, and Section 6 concludes the entire work.
2. Beam Recovery Using Strain–Excitation Mapping Model
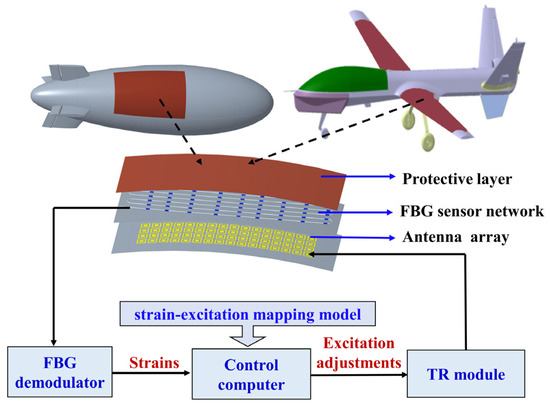
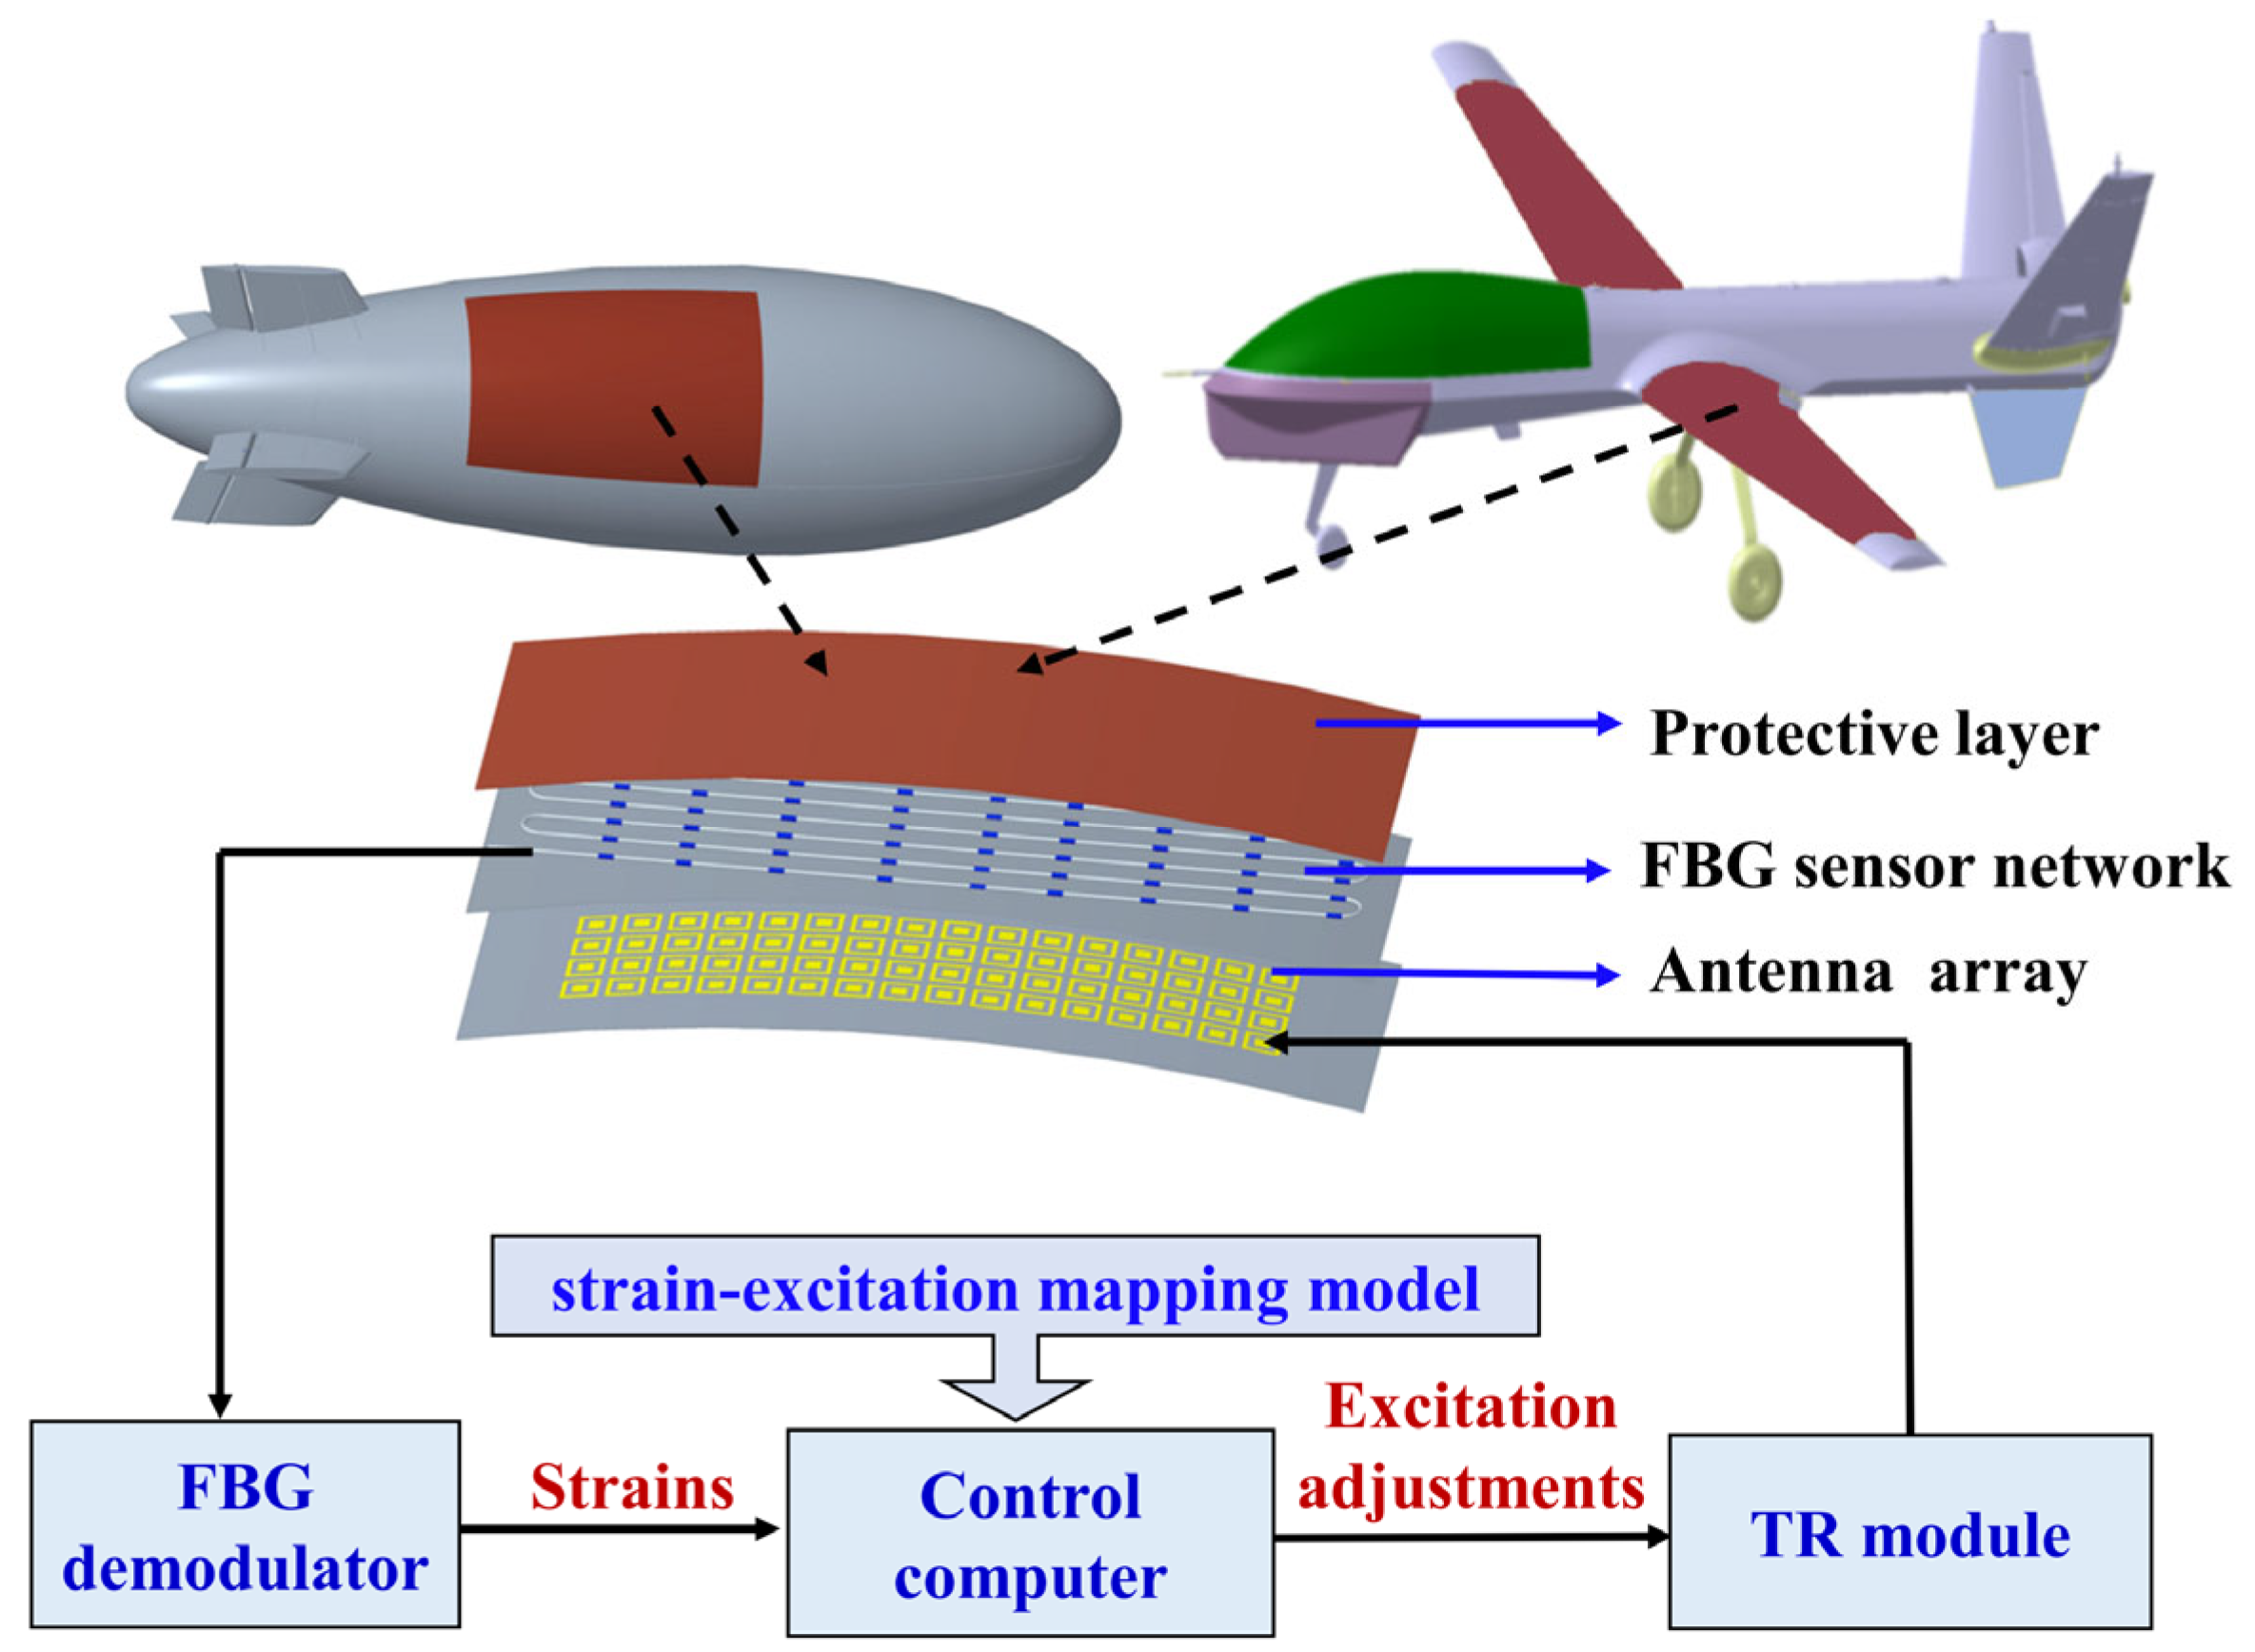
Figure 1 illustrates the schematic of beam recovery for a deformed PAA based on the embedded FBG sensor network. During operation, external loads induce shape deformation on the PAA surface, and the resulting structural strains are captured by the FBG sensor network. The strain–excitation mapping model is then adopted to calculate the excitation correction values for antenna elements. These values are transmitted to the transceiver (TR) modules to update the amplitude and phase of each element excitation. Relying on real-time strain monitoring, the distorted radiation patterns can be adaptively corrected continuously.
Figure 1.
Schematic diagram of the beam correction of a deformed PAA.
For the above beam recovery scheme, the core lies in establishing a mapping relationship between measured strains and excitation correction values.
3. Strain–Excitation Mapping Model
3.1. Phase-Based Methods and FFT-Based Methods
When the PAA surface deforms due to exterior loads in service, the antenna radiation performance will deteriorate. Assuming a PAA with N isotropic radiator elements, the total radiation electric field of the deformed PAA can be expressed as [21],
where is the complex excitation related to the nth element, and the excitation amplitude and phase are expressed as and , respectively. The observation direction vector can be expressed as in the global Cartesian coordinate system, in which and denote the angular variables of the observation direction vector in the global spherical coordinate system. is the vector electric field of the nth element in the observation direction , in which is the representation of in the local coordinate system after the orientation of the nth element is changed due to the deformation of the PAA surface. The vectors are the original position vector of the center of the nth element, and denotes the displacement vector of the central position of the nth element. is the free-space wave number where is the operation wavelength.
Equation (1) shows that array deformation introduces a phase offset within the concerned main beam direction . Accordingly, the radiation performance in the main beam region can be restored by imposing an adjustment value on the element excitation phase, which constitutes the principle of the phase-based method.
For the FFT-based model, given a small deformation magnitude , the exponential term error induced by array deformation can be approximated via truncated Taylor series expansion. Accordingly, ignoring the element factor, the array factor of the radiation pattern can be expressed as:
For uniformly spaced arrays, can be calculated using the standard FFT. Thus, the equivalent excitation of the deformed array can be obtained via inverse fast Fourier transform (IFFT). It can be expressed as follows:
where denotes the spatial coverage of antenna radiation. The excitation correction values for the deformed array are derived by comparing these equivalent excitations with the original excitation .
The above theoretical derivation shows that the excitation correction values of antenna elements can be further calculated once the displacements of elements under array deformation are acquired. As reported in our previous work [14], when discrete strain data on the deformed PAA surface are measured, the position vectors of the required nodes can be calculated as follows:
where denotes a constant numerical matrix that converts structural strains into nodal displacements. is the pseudo-inverse of the strain mode shapes determined by the layout of FBG sensors. , and represent the displacement mode shapes of the required nodes along the x-axis, y-axis, and z-axis direction in the global Cartesian coordinate system, which are extracted from the modal analysis results of the antenna mechanical model (e.g., the model established in ANSYS 19.0).
Combined with the strain–displacement transformation matrix, the strain–excitation mapping model based on the phase method is derived as follows:
where denotes the element excitations of the deformed array. The strain–excitation mapping model based on the FFT method is expressed as:
3.2. Projection-Based Strain–Excitation Mapping Model
As discussed in Section 3.1, both the phase-based and FFT-based methods only account for element displacements when establishing the strain–excitation mapping. The phase-based method merely compensates for the phase offset projected along the main beam direction, without considering the variation in element orientations or the change in equivalent element intervals induced by array deformation. Consequently, it can approximately restore the main lobe but exhibits limited capability in sidelobe level (SLL) recovery. The FFT-based method, on the other hand, relies on a small-displacement assumption to linearize the exponential phase error via Taylor expansion, which inherently restricts its applicability to slightly deformed arrays. Moreover, similar to the phase-based method, it does not incorporate the effects of element orientation changes on the radiation contribution of each element. To overcome these theoretical limitations, this section derives a novel projection-based SEMM from the aperture projection synthesis principle, which simultaneously accounts for element positions, element orientations, and equivalent element interval variations, thereby enabling effective beam recovery for arbitrarily deformed PAAs.
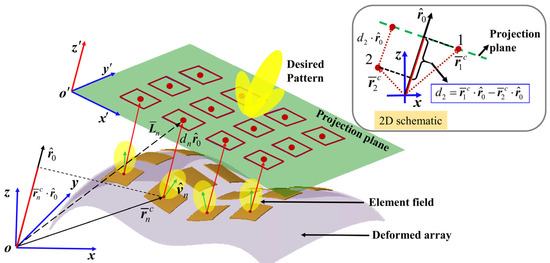
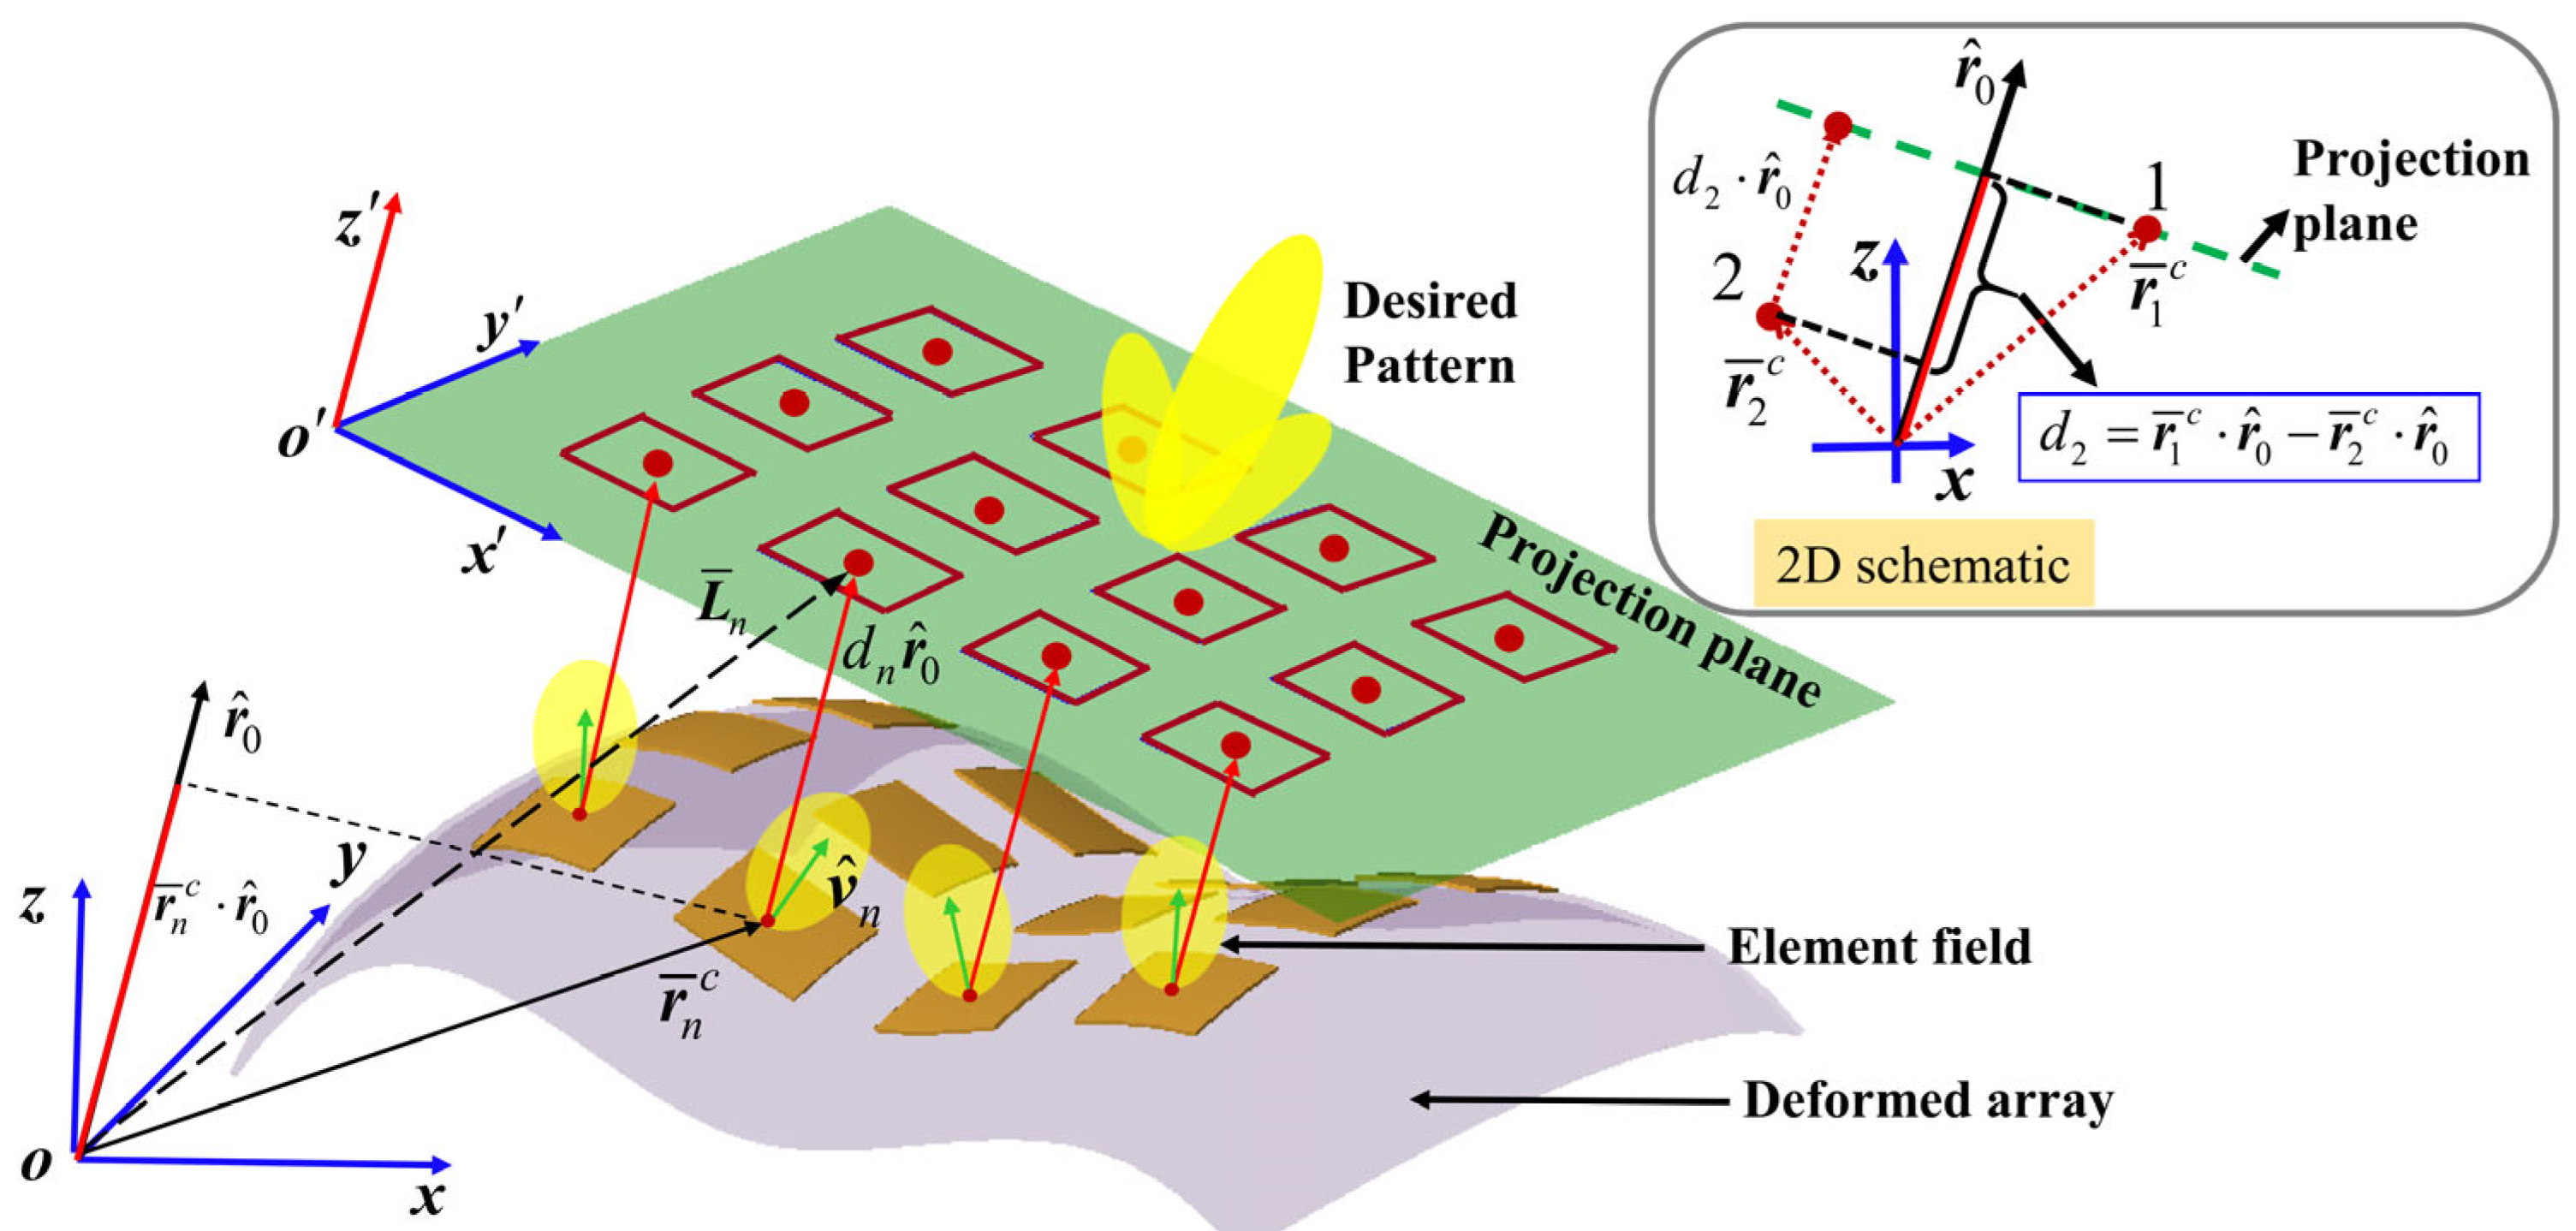
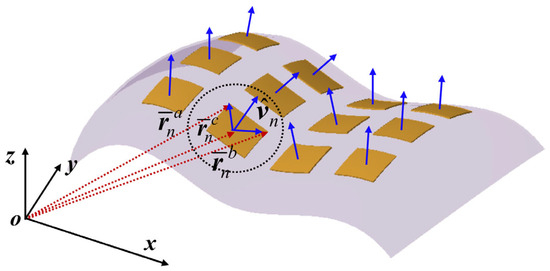
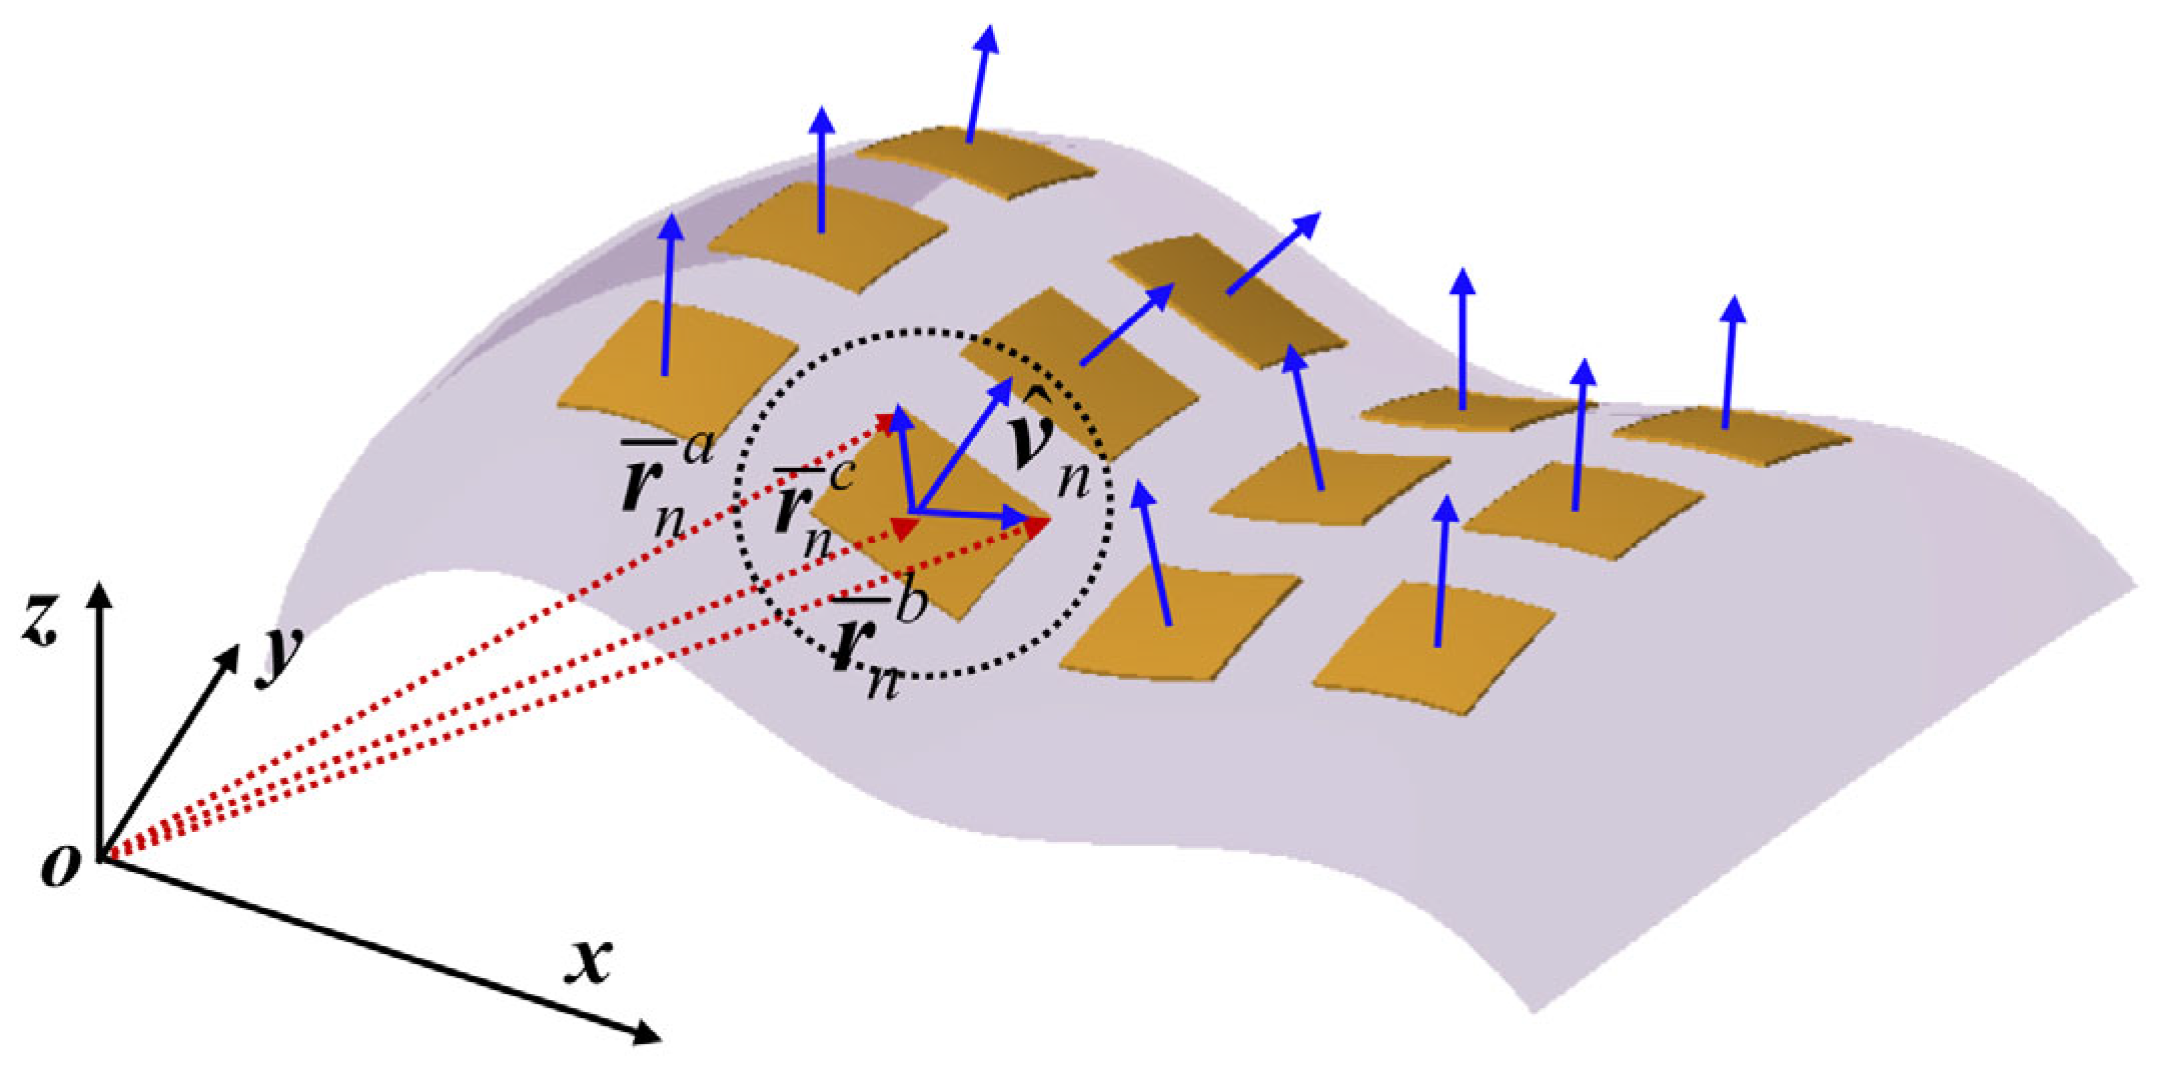
According to the aperture projection synthesis principle for conformal arrays, the excitations of non-planar antenna arrays can be calculated from their projected planar counterparts. As illustrated in Figure 2, for an arbitrarily deformed phased array antenna (PAA), its projected array is obtained by projecting all elements onto a plane along the main beam direction. This plane is perpendicular to the main beam direction and passes through the center of the element that yields the maximum vector projection onto the main beam direction among all array elements.
Figure 2.
Projection schematic for a PAA with arbitrary surface deformation.
The embedded two-dimensional schematic in Figure 2 demonstrates how the projection plane is determined. Here, Element 1 has the maximum vector projection along the main beam direction, and Element 2 stands for other array elements. In the three-dimensional view of Figure 2, the projection plane is offset by a certain distance for better visualization. Let the excitation amplitude of the nth element in the projected array be denoted as . According to the projection synthesis principle, the excitation of the nth element in the deformed array is given as:
where and represent the normalized projection area and the radiation intensity of the isolated element far-field in the main beam direction related to the nth element. is the normalized distance from the nth element center to the projection plane.
As illustrated in Figure 2, for a PAA with arbitrary surface deformation, the posture of an element can be expressed using its position and orientation, which are defined by the position vector of the element center and the normal vector of the element local plane. Therefore, in order to calculate the element excitation of a deformed PAA, the first step is to establish the mapping between the variables , , as well as in (7) and element posture and .
The variable can be determined from the 2D schematic in Figure 2 as follows:
where represents the maximum projection distance of the central position vectors of all elements in the main beam direction . The variable can be easily obtained by the inner product of vectors as follows:
The calculation of the excitation amplitude of the projected element is a beam synthesis problem for nonuniformly spaced planar arrays. First, it is necessary to determine the positions of elements in the projection array. Using the vector operation, the position vector of the nth element in the Cartesian coordinates is expressed as:
In the local Cartesian coordinate system where the projection plane is located, the position vector of the nth element in the projection array is expressed as:
where and represent two unit-vectors orthogonal to the direction vector , and parallel to the -axis direction and -axis direction, respectively.
Subsequently, the excitation amplitude will be determined using the nonuniformly spaced array synthesis. For a deformed beamforming array, the fast array synthesis method, such as nonuniformly spaced sampling of a Taylor distribution [22] and NUFFT synthesis [23], can be adopted to calculate the excitation amplitudes of the projection array. The distribution function of the excitation amplitude in the local Cartesian coordinate system can be expressed as . Obviously, the amplitude distribution will be an equal-amplitude distribution for a deformed equal-amplitude excitation array. According to (11), the excitation amplitude of the nth element in the projection array can be written as:
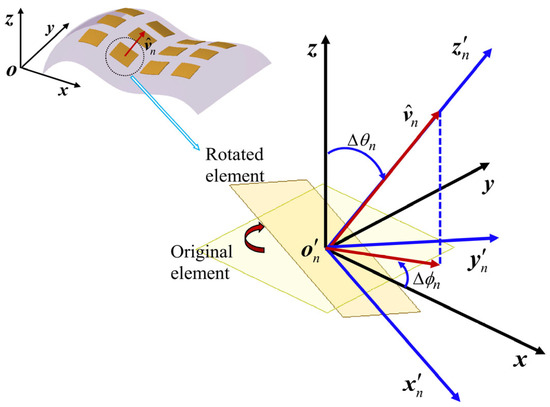
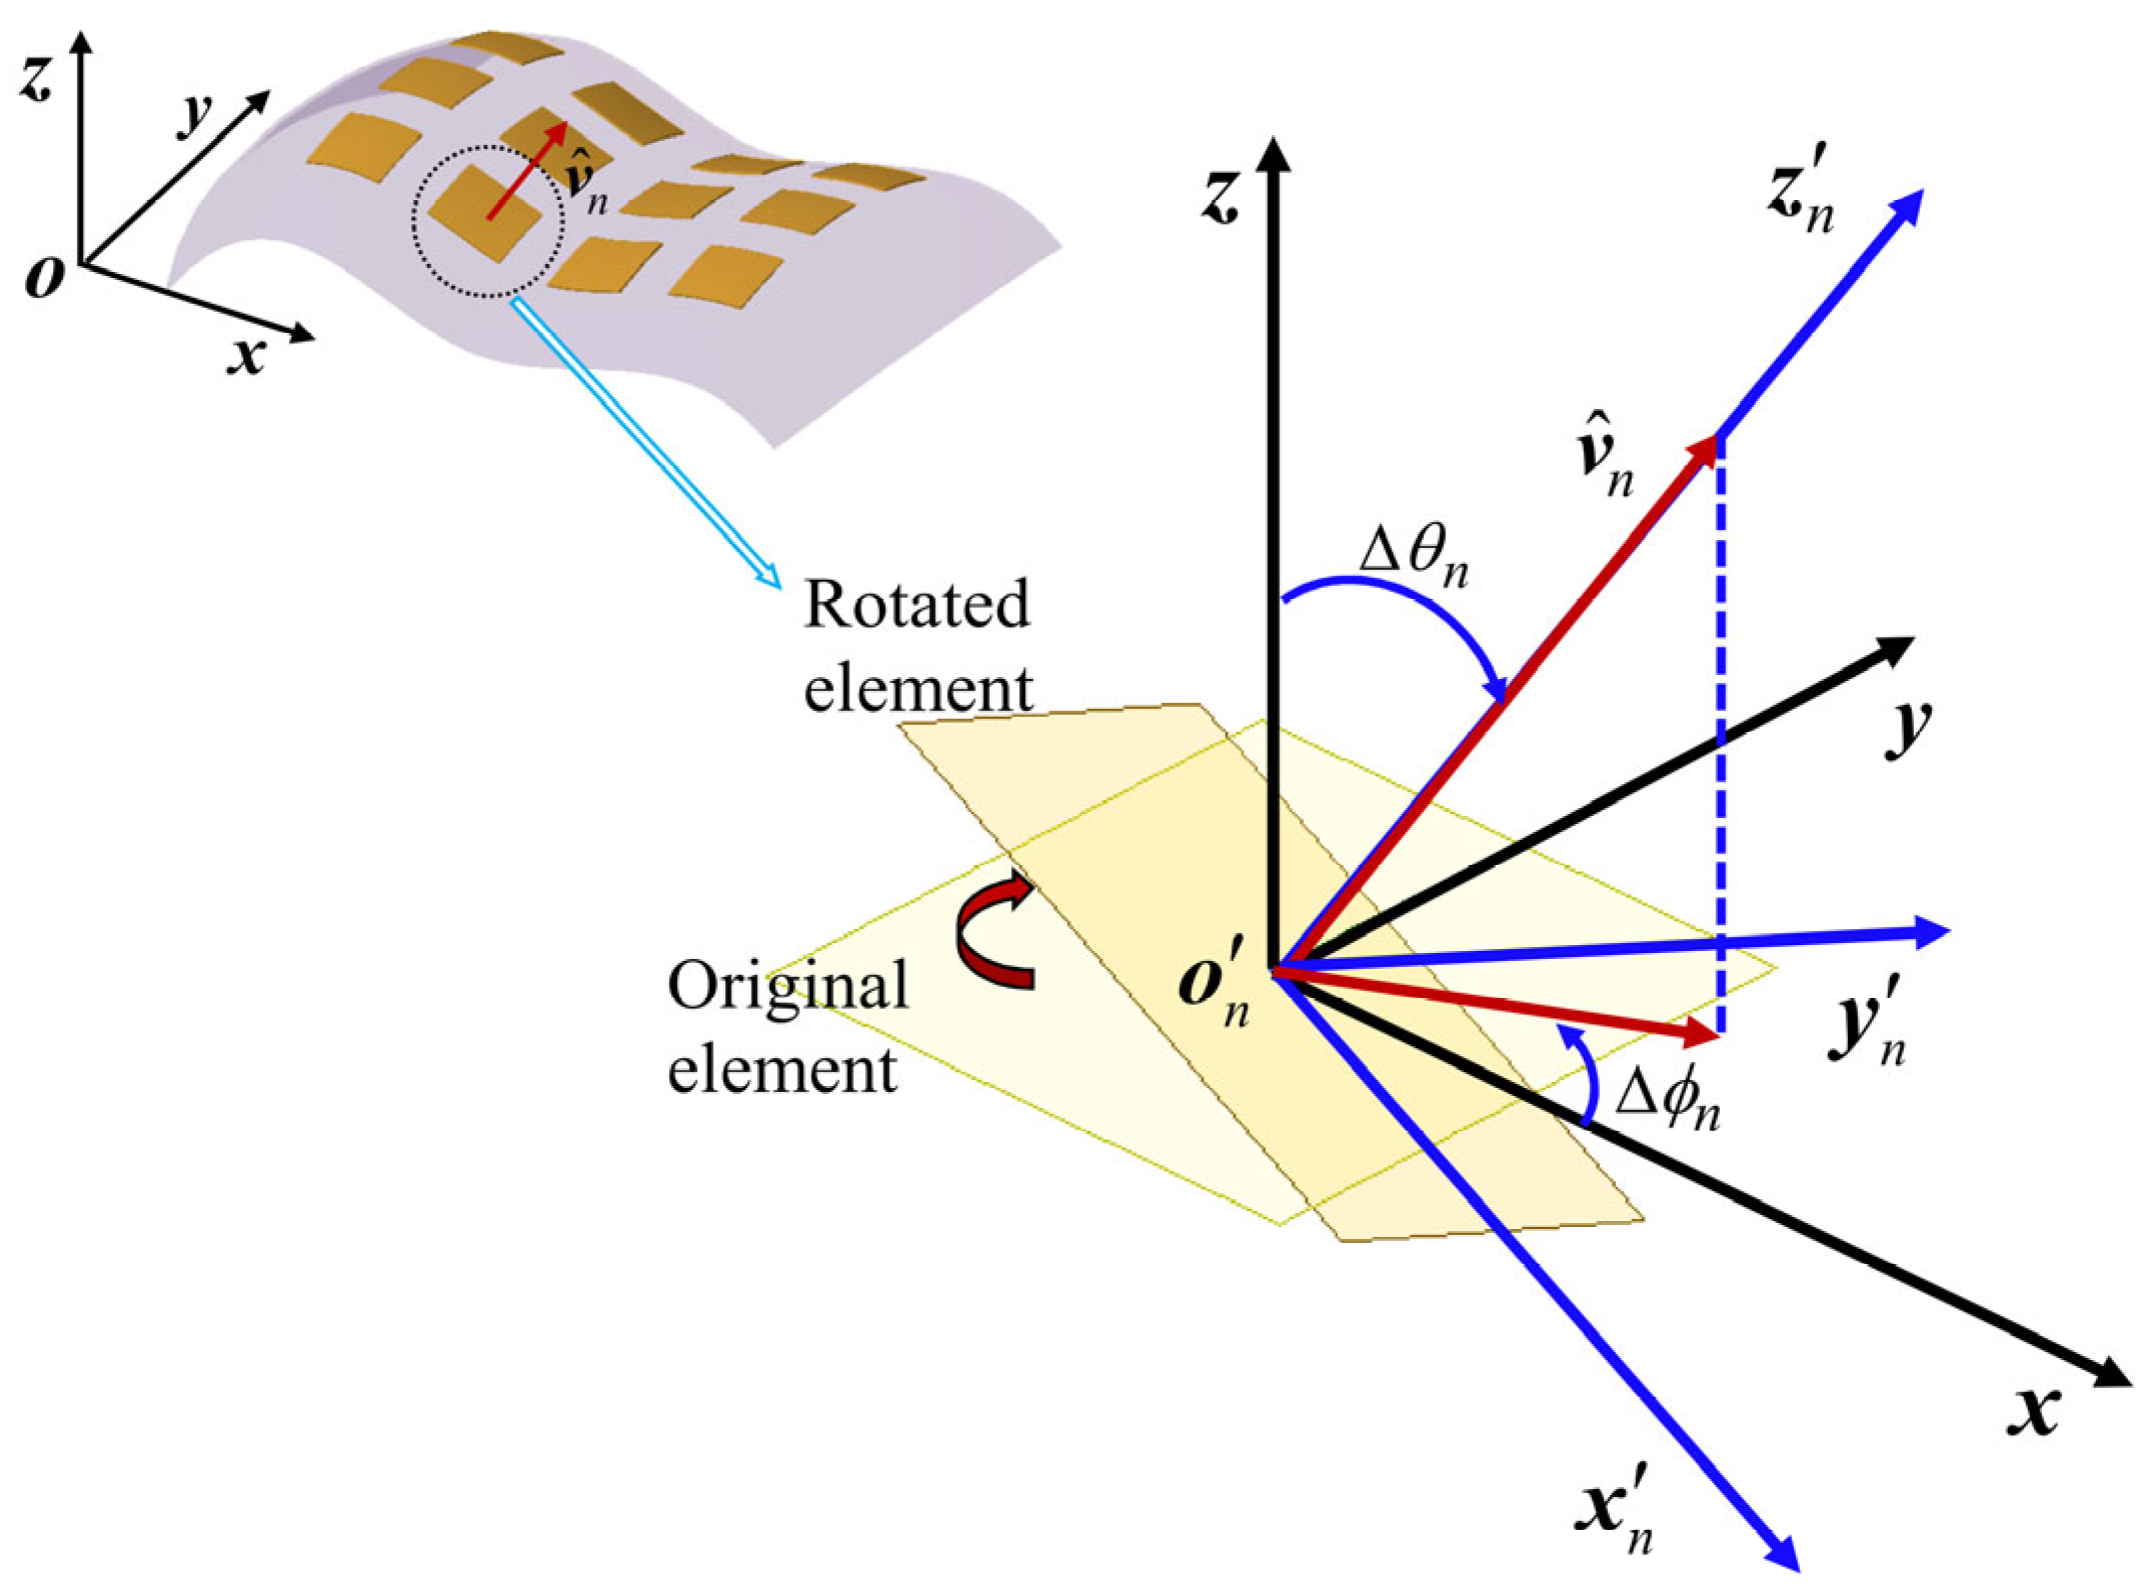
Due to varying element orientations in a deformed PAA, the far-field radiation intensity of the nth element along the main beam direction depends on its rotation angles. As shown in Figure 3, when the origin of the local Cartesian coordinate system of the nth element is translated to that of the global Cartesian coordinate system , the unit direction vector of the -axis coincides with the unit normal vector of the local plane of the nth element. Thus, we obtain:
Figure 3.
Schematic of the coordinate transformation.
The Euler rotation angle of the nth element in the global spherical coordinate can be calculated as follows:
where , , and are the coordinate components of the unit direction vector in the global Cartesian coordinate system. Therefore, the far-field radiation intensity of the nth element in the main beam direction can be expressed as:
where is the pattern function of the isolated element far-field radiation, which can be derived by fitting the sampled far-field data from a full-wave electromagnetic software such as HFSS. denotes the angle components of the main beam direction in the global spherical coordinate system, where the angle is in radians.
Substituting (8), (9), (12) and (16) into (7), the complex excitation of a PAA with arbitrary surface deformation can be rewritten as:
Using (17), the complex excitations of an arbitrarily deformed PAA can be calculated according to the element posture and . As illustrated in Figure 4, the unit normal vector in (17) can be obtained by the cross product of two vectors,
where and are the position vectors of the other two nodes at the nth element local plane, which are not collinear with the center position vector together.
Figure 4.
Schematic of the derivation of the normal direction vector.
From (17) and (18), we can see that all variables in the analytical Formula (17) are determined by the positional coordinates of the 3N nodes on the deformed PAA. This indicates that once the displacements of the required nodes of the deformable array are acquired during operation, Equation (17) can be adopted to recover the degraded radiation performance. With the constant numerical matrix , the position vectors of the required nodes on the deformed PAA surface are calculated as follows:
where , and are the original position vectors of the needed nodes. represents the mapping relationship between measured strains and the position vector of the node.
Substituting (19), (20) and (21) into (18), the unit normal direction vector can be rewritten as a function of structural strains ,
Using the element strain-posture functions (21) and (22), the projection-based SEMM can be obtained and written as
where
,
,
,
,
.
From the above derivation, once the structural strains of the deformed PAA are obtained, the element excitations required to restore the optimal radiation beam can be rapidly calculated using the derived analytical Formula (23).
To improve the readability of the above derivation and clarify the physical meaning of the involved parameters, key variables and mathematical notations used in the above equations are summarized in Table 1.
Table 1.
Key variables and notations.
4. Experimental Validation
In this section, the proposed SEMM is validated using a flexible PAA experimental system. Two deformation tests are conducted to verify its beam recovery performance.
4.1. Experimental System
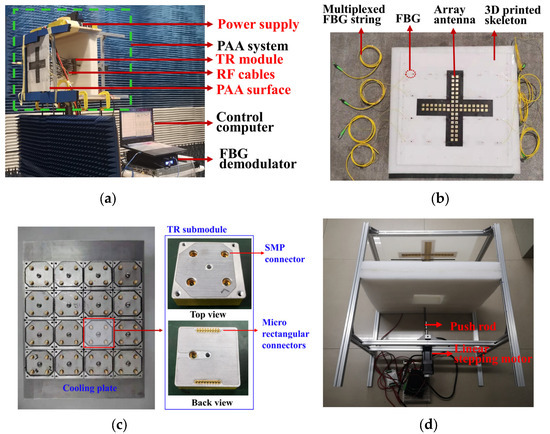
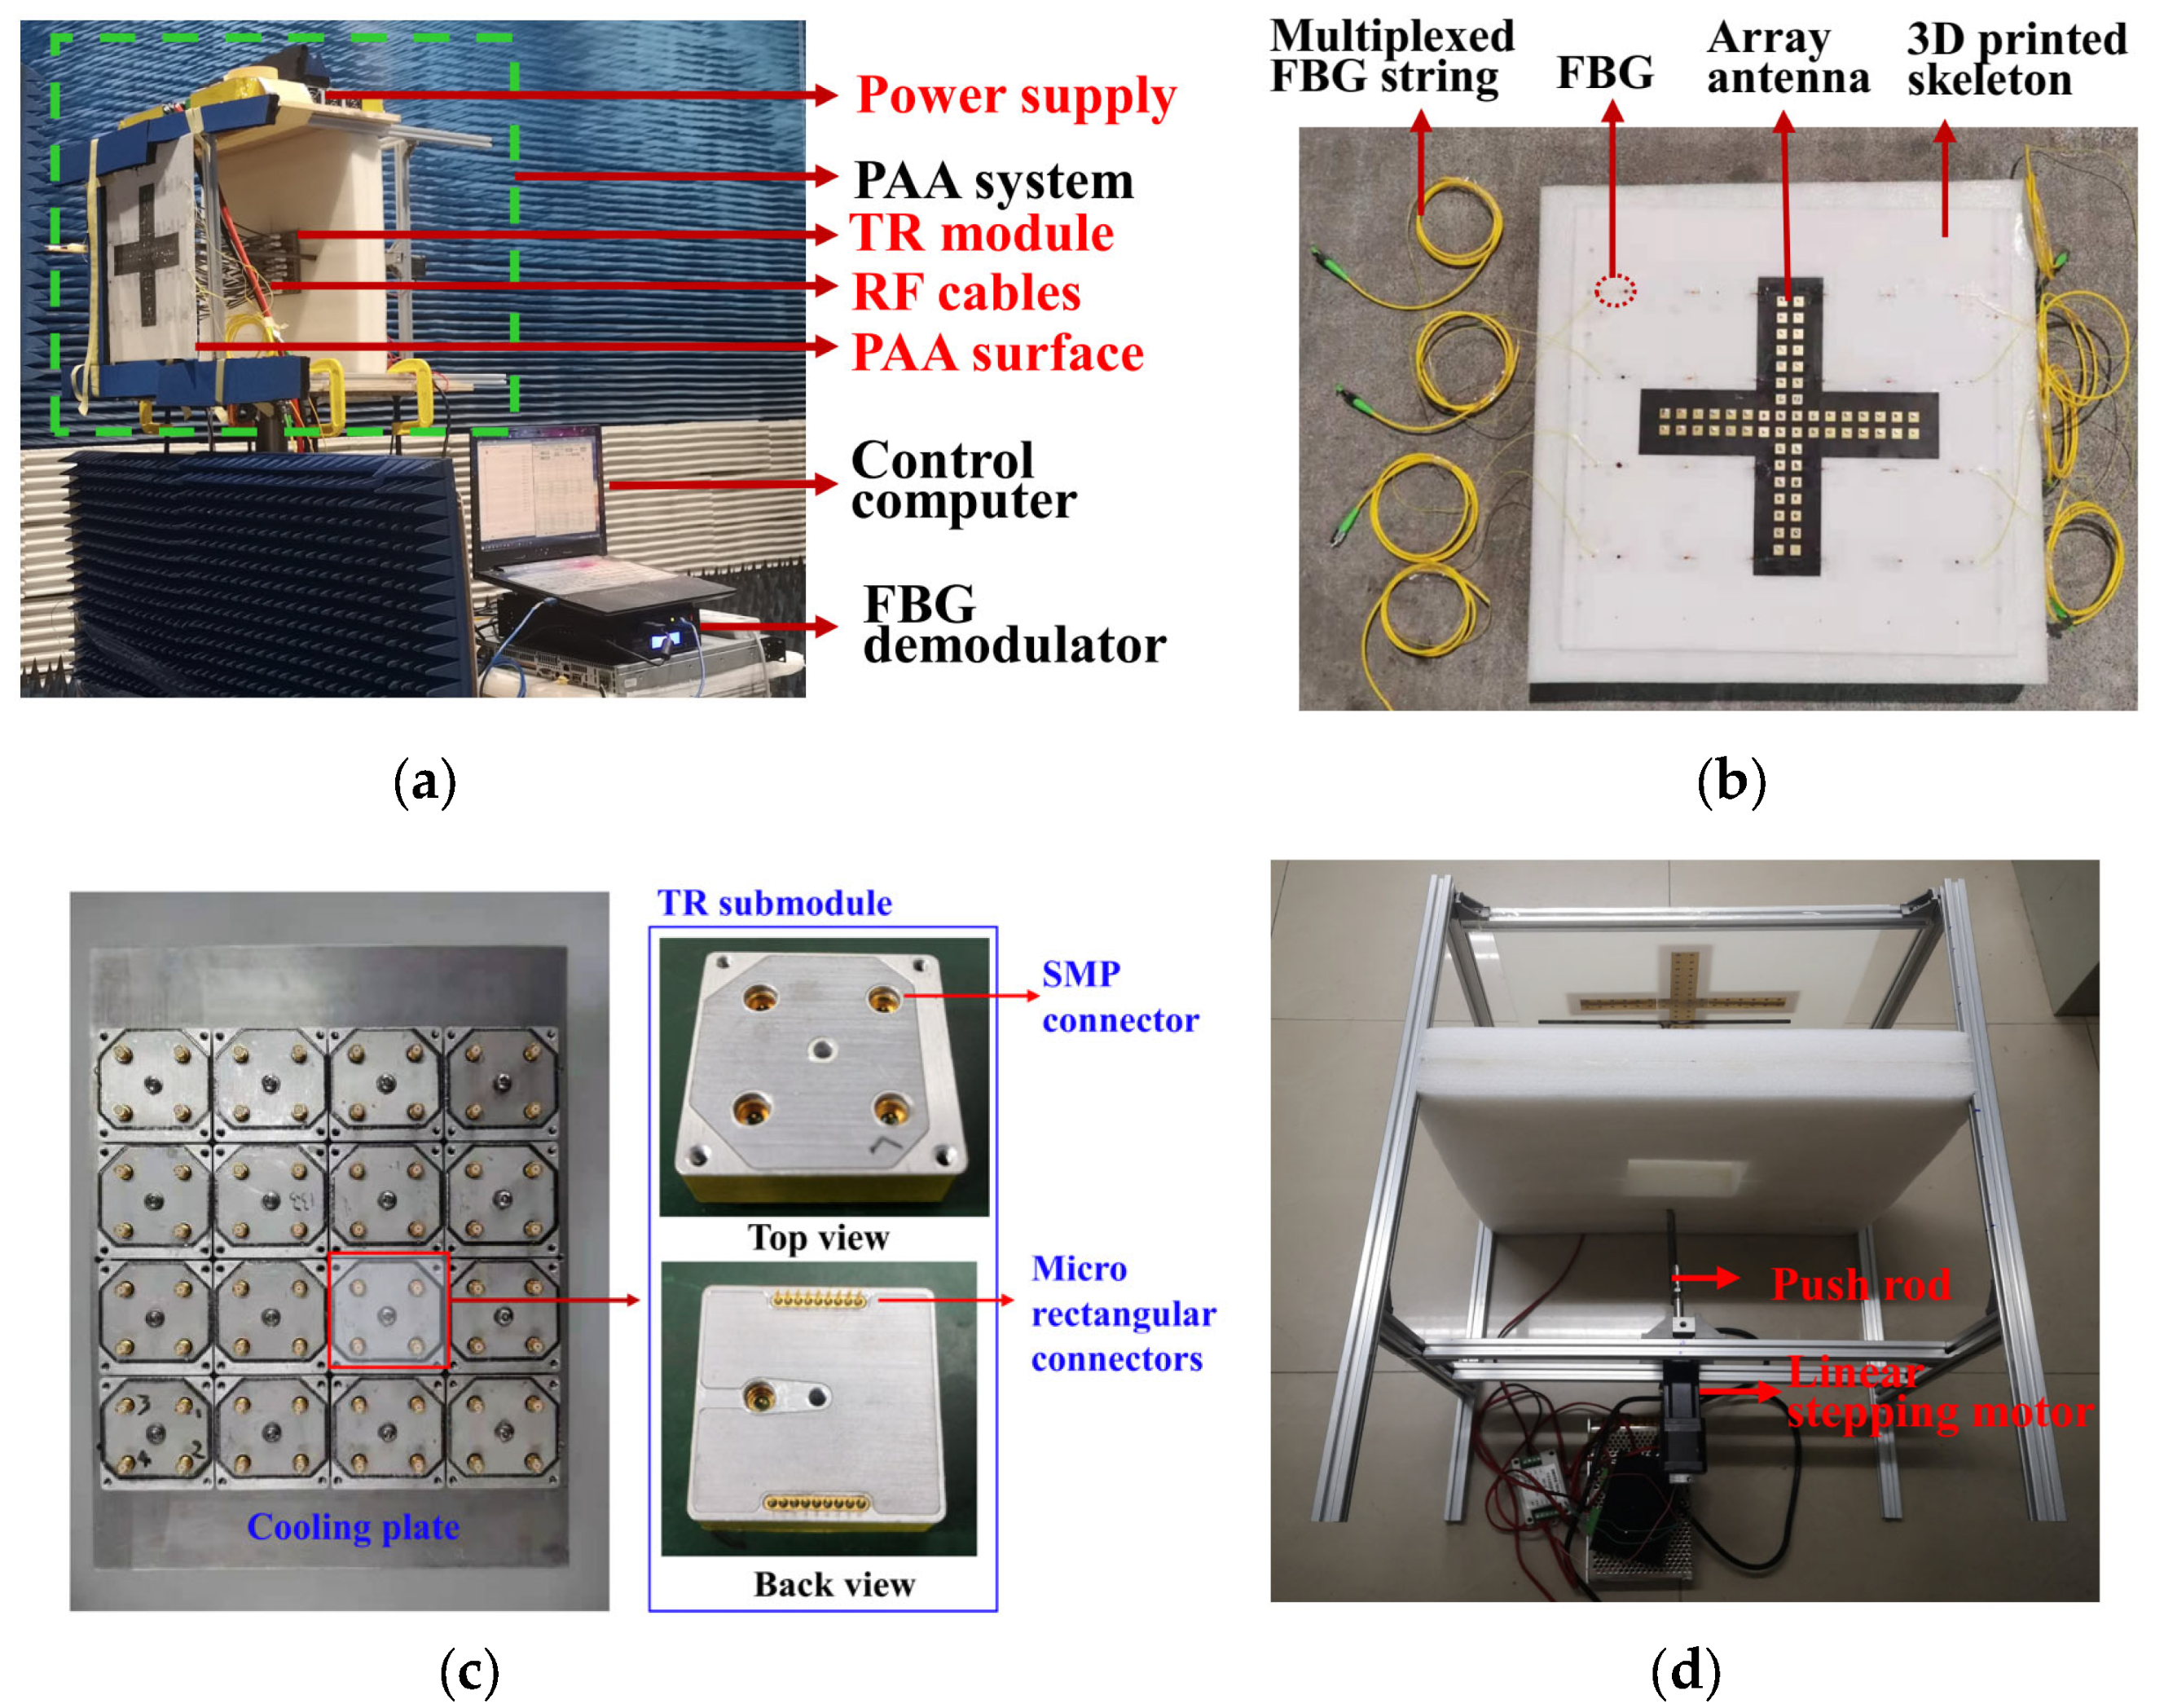
Figure 5a shows the installation configuration of the developed PAA experimental system in an anechoic chamber. The FBG demodulator converts the optical signals from the FBG sensors into the structural strains of the deformed PAA surface. The control computer is responsible for calculating the antenna excitation based on the SEMM. It then sends these adjustments to the PAA to correct the radiation patterns of the deformed PAA. The PAA comprises a PAA surface with FBG sensors, a deformation mechanism and a TR module. As shown in Figure 5b, the PAA surface contains 60 patch antenna elements which are printed on a flexible cross-shaped substrate to achieve a array in elevation and azimuth, respectively. The patch antennas are designed to operate at 10 GHz with a spacing of half a wavelength. In the PAA surface, 24 FBG strain sensors are attached in a grid arrangement. Figure 5c shows the fabricated TR module. It consists of 16 TR submodules installed on a microchannel cooling plate, each of which contains four independent channels. In the TR submodule, four SMP connectors are launched on the topside to connect with the antennas via flexible RF cables. On its backside, the TR submodule is attached to the feed network and the beam control circuit through an SMP connector and micro rectangular connectors, respectively. In this experimental system, 15 TR submodules are used to feed the 60 elements. Figure 5d shows the deformation mechanism, where the motor adopts a push rod to apply displacement loads to the PAA surface. Different deformations can be generated by adjusting the position of the loading point and the constraint of the PAA surface.
Figure 5.
Experimental system. Composition of the flexible PAA. (a) Experimental system. (b) PAA surface with FBG sensors. (c) TR module. (d) Deformation mechanism.
4.2. Experimental Description
Due to the symmetry in elevation and azimuth, the array in the middle two rows of the PAA surface are selected for experimental validation. This can be approximated as a one-dimensional array. Therefore, patterns at the xoz cut are presented to demonstrate the effectiveness of the proposed SEMM in the experiments. This is because the deformation of the PAA surface will lead to a direct change in antenna radiation performance in the xoz cut, while there is almost no change in the yoz cut since only two elements are arrayed in the y-direction.
During the tests, the stepping motor is actuated to deform the PAA surface, and 24 strain values are acquired via the FBG demodulator. The element excitations are then calculated using the proposed SEMM in (23). Finally, the computed excitations are transmitted to the TR module, and the corresponding radiation patterns are measured.
The undeformed PAA adopts a −17 dB Taylor amplitude tapering. Accordingly, the excitation amplitude term in (23) is set to the same −17 dB Taylor tapering when calculating excitations for the deformed PAA. To further demonstrate the superiority of the proposed method, pattern compensation results obtained from the phase-based method [14] and FFT-based method [18] are also presented for comparison.
4.3. Experimental Results of the PAA with Cantilever Deformation
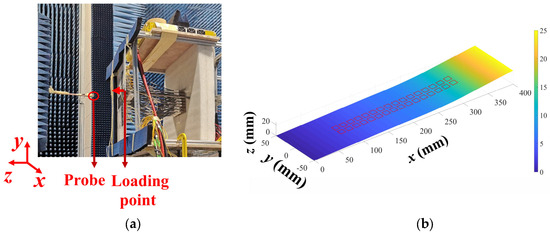
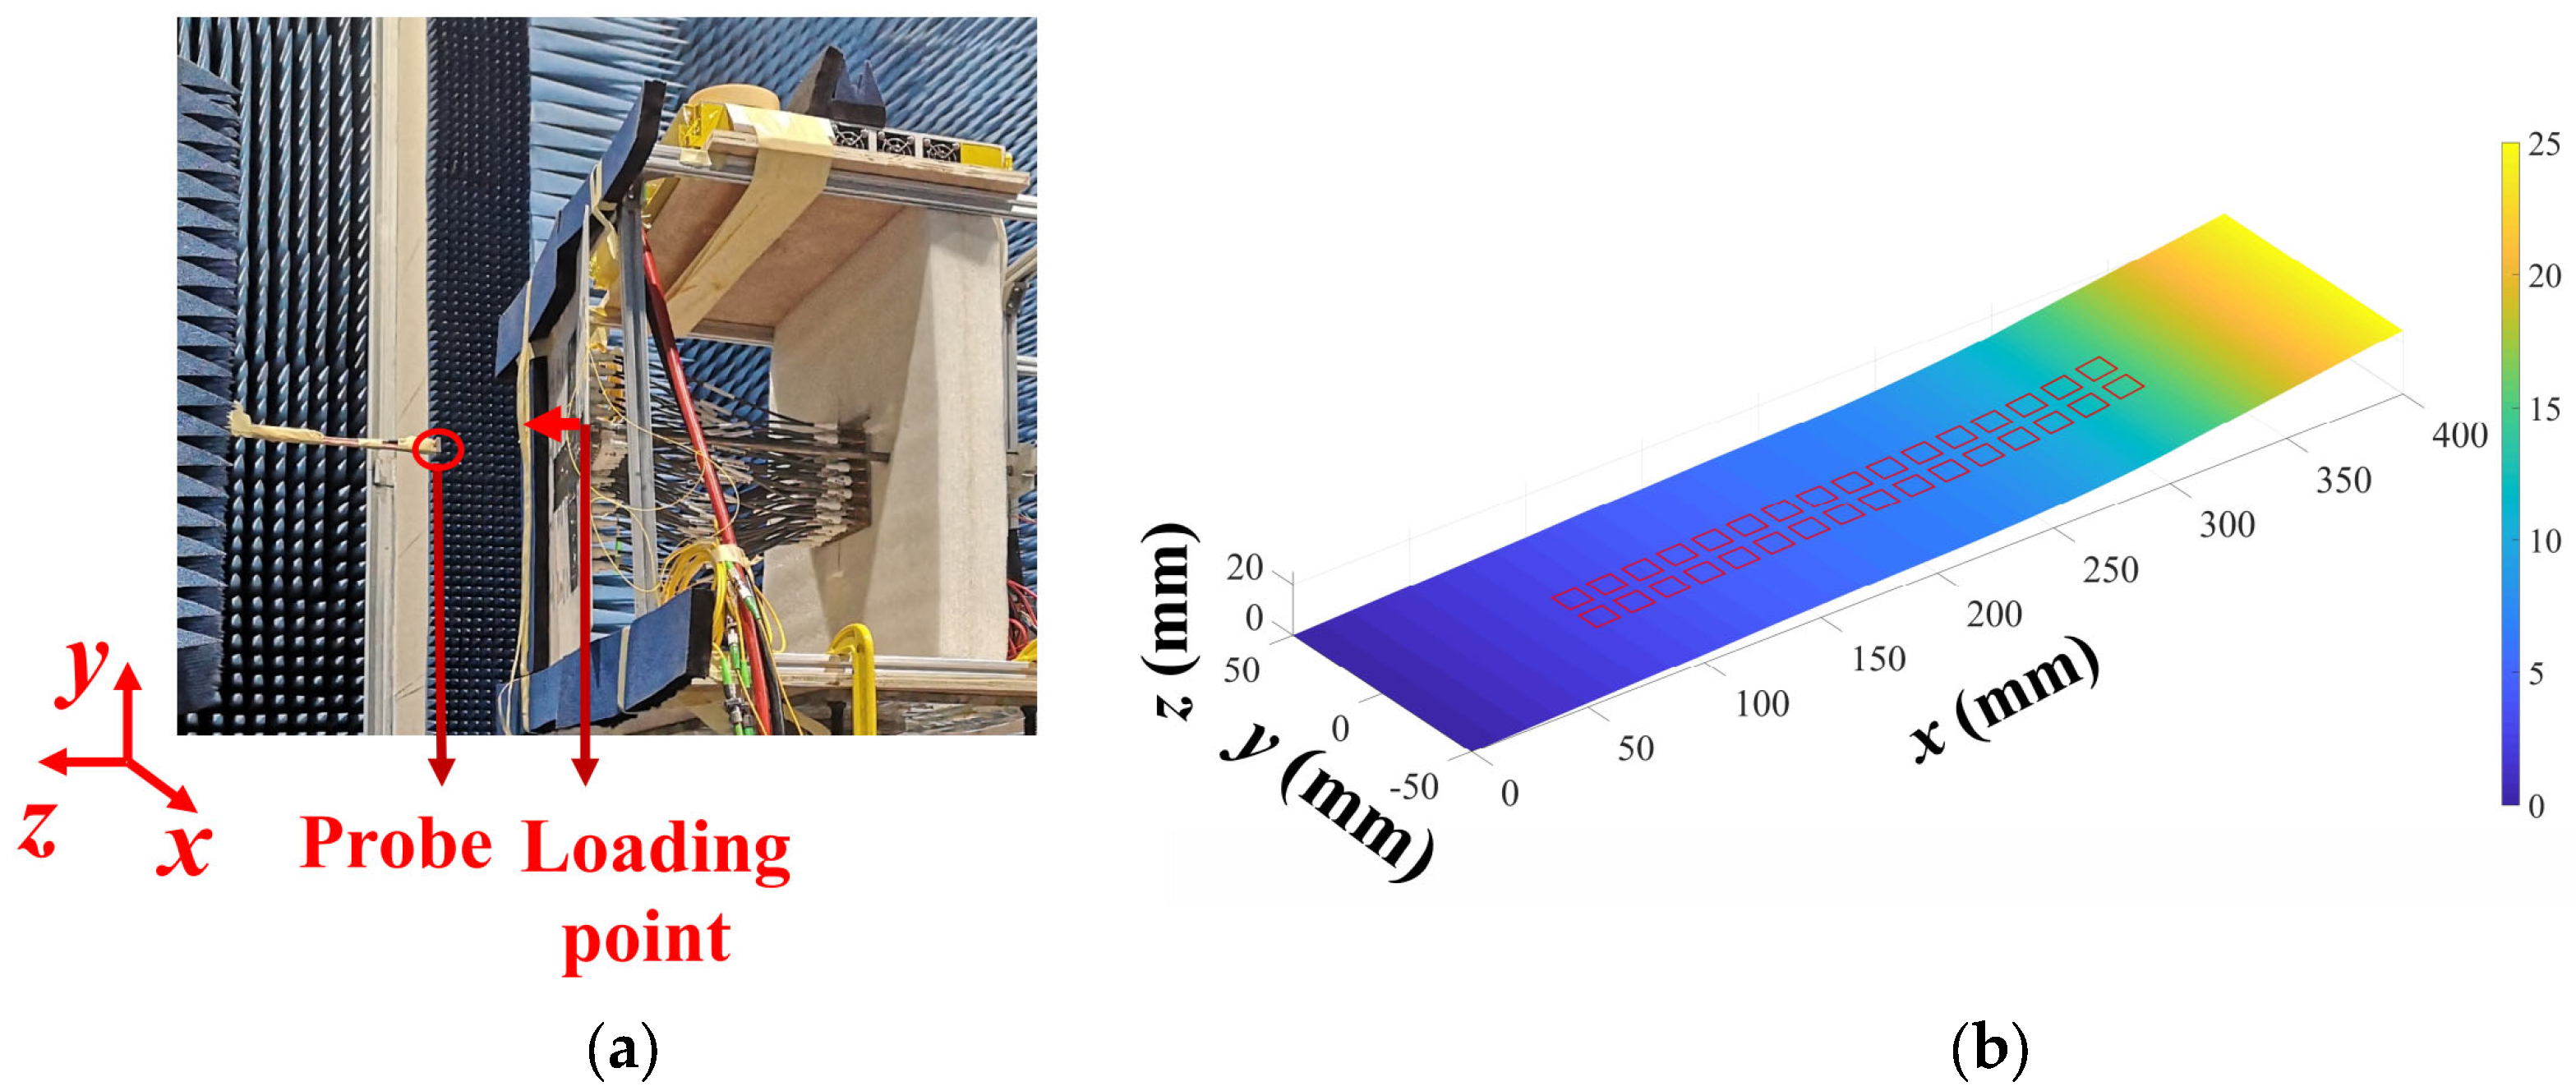
Cantilever deformation typically occurs in PAAs mounted on aircraft wings. As shown in Figure 6a, one end of the antenna panel is constrained, and the loading location is selected at the unconstrained end. By controlling the motor, a displacement load is applied to the PAA panel for generating the cantilever deformation. Figure 6b shows the deformed array with 32 elements reconstructed using the measured strains from 24 FBG sensors. The reconstruction result shows that the maximum displacement of the elements along the z-axis direction is 11.2 mm, which is about 0.37 λ0 (λ0 refers to the wavelength at the center frequency of 10 GHz).
Figure 6.
PAA surface with a cantilever deformation. (a) Deformed PAA surface. (b) Reconstructed shape of the deformed PAA surface using the measured strains from 24 FBG sensors.
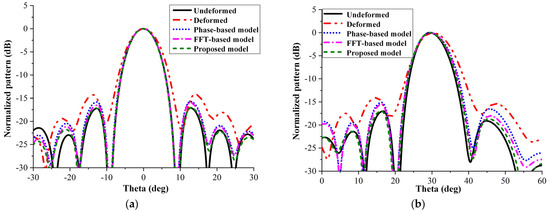
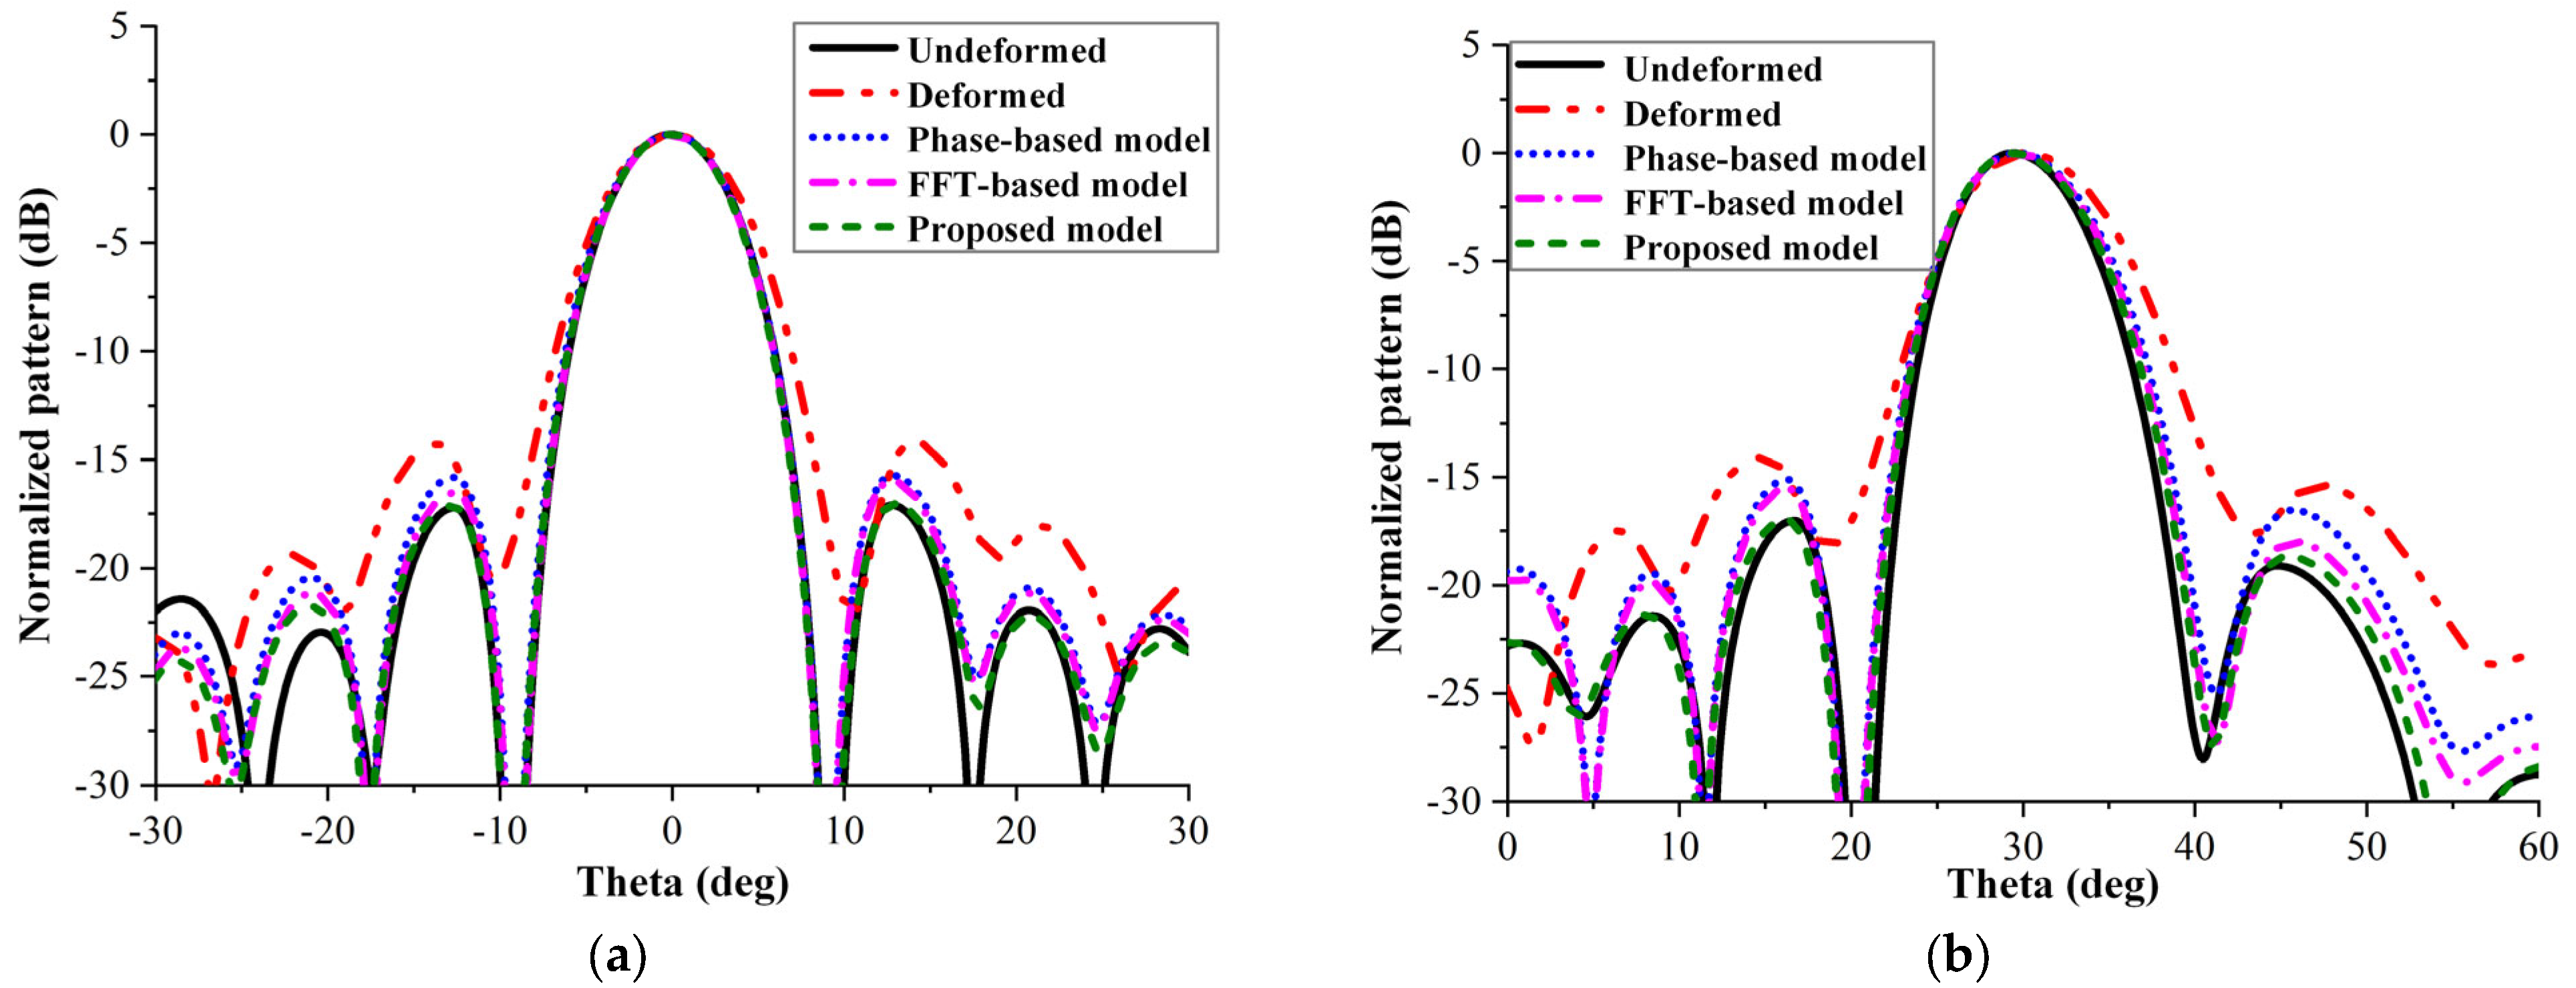
Figure 7a,b compares the radiation patterns of the undeformed PAA, deformed PAA, and PAA compensated by the three models at scan angles and , respectively. The distorted patterns reveal that cantilever deformation leads to main beam deflection and elevated sidelobe levels relative to the undeformed array. Specifically, when the main beam is steered to scan angles and , the main beam direction deviates by 2.82º and 2.44º, while the peak sidelobe level (PSLL) increases by 2.58 dB and 2.81 dB, respectively.
Figure 7.
Comparisons of the measured patterns at the xoz cut under cantilever deformation experiment. (a) Scan angle . (b) Scan angle .
The correction results of the phase-based and FFT-based models show that these two methods can roughly restore the main lobe of the deformed PAA to the undeformed state, yet they cannot achieve satisfactory correction performance in the sidelobe region. In comparison, the proposed model delivers superior correction accuracy and effectively recovers the radiation patterns of the deformed PAA over the entire observation region. As listed in Table 2, the proposed model reduces the PSLL error of the deformed array by at least 97%, where the PSLL error is defined as the PSLL difference between the deformed and undeformed antenna radiation patterns. The experimental results also demonstrate that the FFT-based model exhibits the weakest correction capability among the three methods under large array deformation conditions.
Table 2.
Comparisons of the electrical performance indexes under cantilever deformation case.
4.4. Experimental Results of the PAA with Arched Deformation
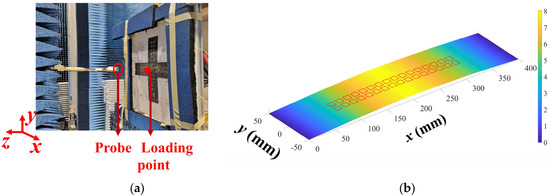
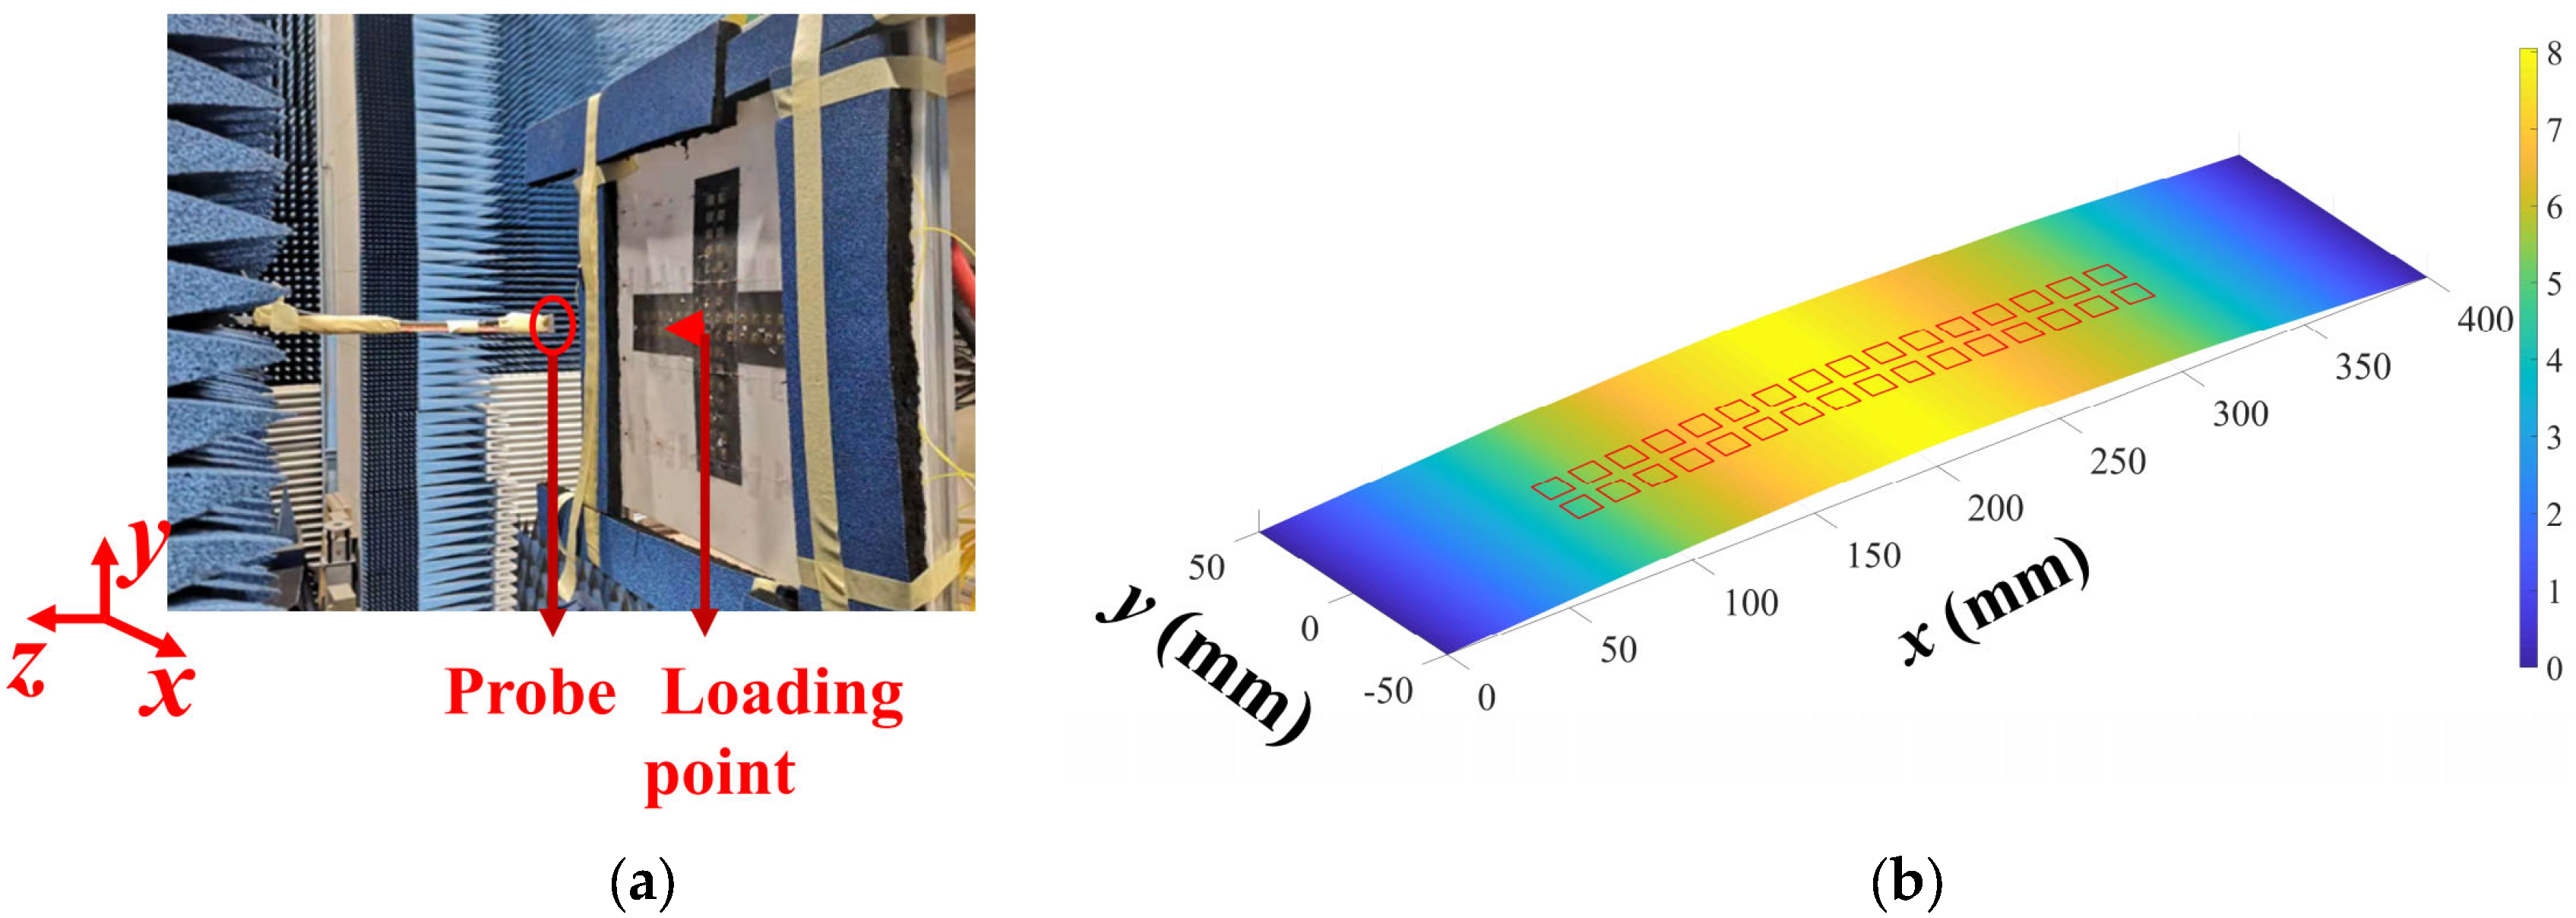
The arched deformation may occur when the PAA surface with edge constraints is subjected to an external load. To simulate this deformation using the experimental system, two ends of the antenna panel are fixed, and the center of the antenna panel is pushed by the stepping motor, as shown in Figure 8a. Figure 8b shows the deformed PAA and the reconstructed deformed PAA surface using 24 measured strains. The reconstruction results indicate that the maximum displacement of the elements along the z-axis direction is 8.06 mm, which is about 0.27 λ0. In this experiment, the radiation patterns at scan angles and are selected to validate the proposed SEMM.
Figure 8.
PAA surface with an arched deformation. (a) Deformed PAA surface. (b) Reconstructed shape of the deformed PAA surface using the measured strains from 24 FBG sensors.
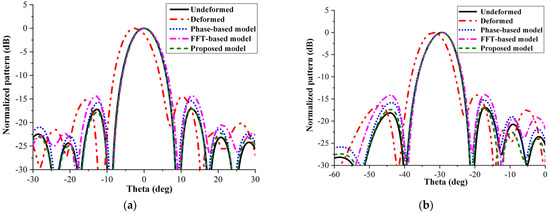
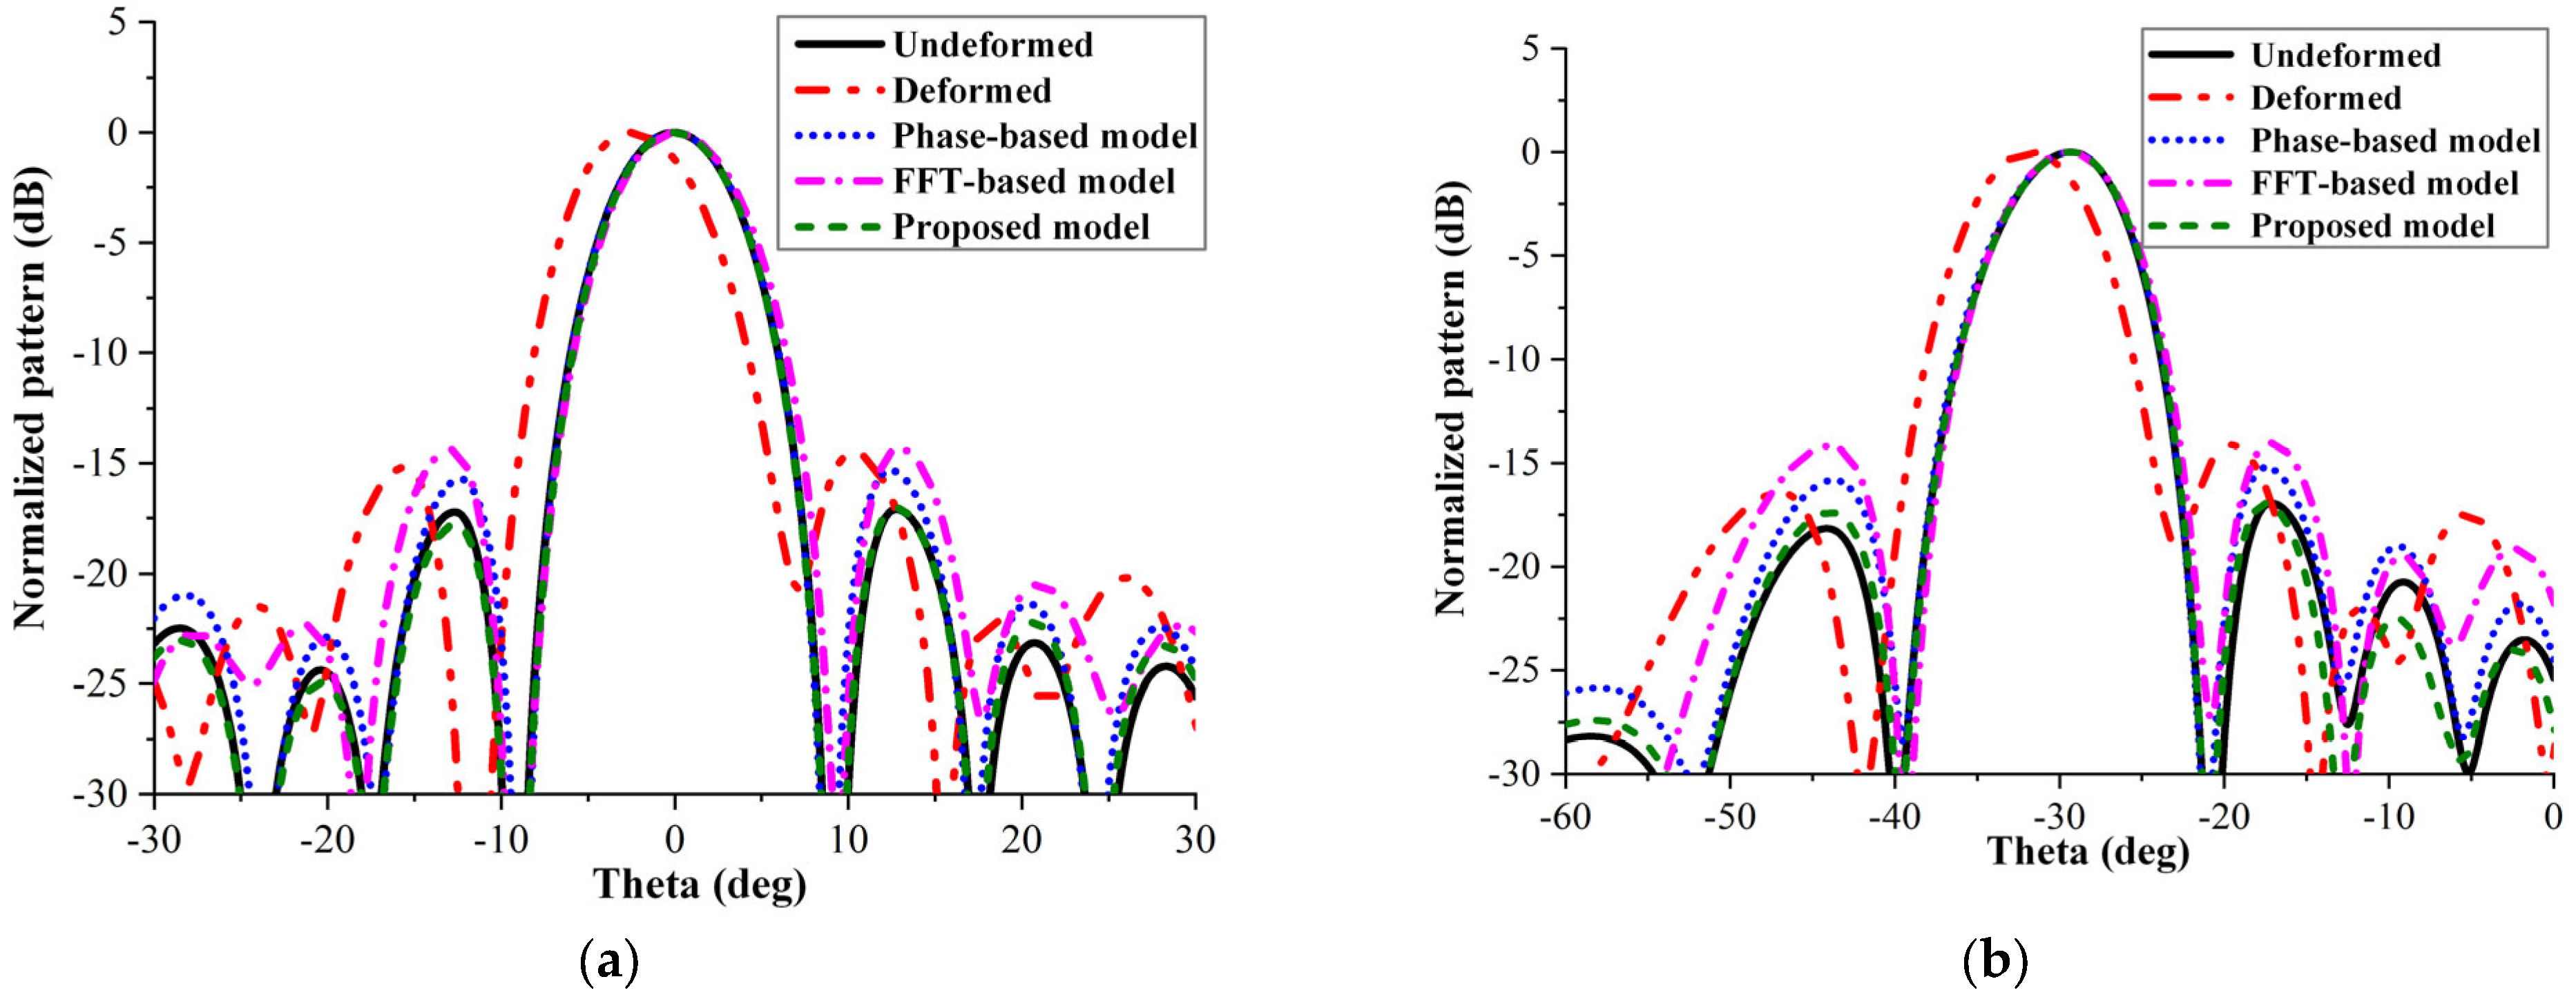
Figure 9a,b presents the experimental results for the PAA under arched deformation. The distorted radiation patterns indicate that arched deformation results in main beam broadening and sidelobe elevation. As summarized in Table 3, the PSLL of the deformed PAA increases by 2.92 dB and 2.94 dB at the scan angles of and , respectively.
Figure 9.
Comparisons of the measured patterns at the xoz cut under arched deformation experiment. (a) Scan angle . (b) Scan angle .
Table 3.
Comparisons of the electrical performance indexes under arched deformation case.
As illustrated in Figure 9 and Table 3, all three correction models achieve favorable main lobe restoration, whereas distinct performance differences are observed in the sidelobe region. In terms of PSLL correction, both the phase-based and FFT-based models retain errors greater than 1 dB. For this arched deformation case, the FFT-based model achieves marginally better correction performance than the phase-based model due to the relatively mild array deformation. In contrast, the proposed model restricts the PSLL error to within 0.1 dB after compensation. Moreover, the proposed model also outperforms the other two methods in terms of additional radiation indicators, including beamwidth.
4.5. Measurement Error and Uncertainty Analysis
To quantitatively evaluate the influence of measurement errors on the beam recovery performance of the proposed SEMM, an error and uncertainty analysis is conducted in this subsection based on the performance specifications of the FBG sensors adopted in the experiments. The FBG sensor used in this work has a measurement range of ±10,000 με, a sensitivity of 1.2 pm/με, an accuracy of ±3 με, and a resolution of 1 με. The measurement errors in the SEMM primarily originate from two sources: the FBG sensor accuracy, which determines the systematic strain measurement uncertainty, and the strain–displacement transformation matrix, which amplifies the strain error through its condition number.
Given that the inherent measurement errors of the FBG sensors cannot be eliminated, two key measures were taken in the preliminary stage to achieve high-accuracy displacement reconstruction. First, model correction was performed to ensure the accuracy of the modal information extracted from the finite element model. Second, singular value decomposition (SVD) was applied to the strain–displacement transformation matrix , and the small singular values were truncated to regularize the matrix. Through these measures, the condition number of is controlled to be less than 5, i.e., , thereby preventing the ill-conditioning problem and effectively limiting the amplification of strain measurement errors in the displacement reconstruction process.
As a result, for both deformation cases investigated in this work (cantilever bending and arched deformation), the displacement reconstruction error is maintained within 0.5 mm. At the operating frequency of 10 GHz ( = 30 mm), this displacement error corresponds to a maximum phase error of approximately 6° across the array elements.
According to the antenna tolerance theory established by Ruze [24], the gain loss induced by random phase errors follows the relation , where νφ is the RMS phase error. With and the reconstruction error bounded within 0.5 mm, the resulting gain degradation is estimated to be less than 0.01 dB, which is negligible for practical applications.
Therefore, for robust radiation pattern recovery in practical applications, two conditions should be simultaneously satisfied: (1) the strain–displacement transformation matrix should maintain a small condition number through proper sensor layout optimization and SVD regularization, and (2) the strain measurement amplitude should be sufficiently large to reduce the relative measurement error, thereby ensuring high-fidelity displacement reconstruction and minimal degradation of the antenna performance.
5. Overall Discussions
The experimental results demonstrate that the proposed SEMM achieves a better recovery effect for patterns of the deformed PAA compared with the phase-based model and the FFT-based model, especially for the sidelobes of patterns. This is because the derived SEMM considers the variations in element intervals of the equivalent array of the deformed array and the difference in array contribution of each element due to the change in its orientation, rather than merely concerning the displacements of the elements as in the phase-based model and the FFT-based model.
Because linearly polarized elements are adopted and the signal-to-noise ratio of the cross-polarization component is very low during the near-field measurement, it is difficult for cross-polarization patterns to accurately assess the effect of array deformation and after compensation. Therefore, the experimental results only provide the pattern comparisons of co-polarization. In addition, the models presented in this paper are applicable to single frequencies. When the PAA operates at other frequency points, the compensation principle is the same; simply replace the wave number with the corresponding frequency point.
The proposed SEMM is designed for rapid radiation pattern compensation of arbitrarily deformed phased array antennas (PAAs) under practical operating conditions. To cut computational costs and realize high-efficiency correction, this model omits the time-consuming calculation of inter-element mutual coupling. The valid scope of this simplification is quantitatively defined as follows: neglecting mutual coupling is acceptable when the element spacing is no less than half a wavelength () and the beam scanning range is kept within a moderate range (e.g., ). In such cases, the mutual coupling between adjacent elements is generally below −15 dB. By contrast, for densely arranged arrays or arrays operating under large-angle scanning, inter-element mutual coupling becomes much stronger, and the coupling coefficient rises accordingly. The non-negligible coupling effect will cause notable errors in sidelobe restoration and deteriorate overall beam compensation accuracy. Therefore, the proposed SEMM is not suitable for tightly coupled antenna arrays. To quantitatively assess the mutual coupling effect, simulations were conducted by adjusting the element spacing of a 16-element linear array to , , and , corresponding to coupling coefficients of −18 dB, −15 dB, and −10 dB, respectively. The results show that when the spacing decreases from to , the gain degradation increases from 0.05 dB to 0.15 dB, and the peak sidelobe level (PSLL) deteriorates from 0.4 dB to 1.2 dB. For the experimental array with 0.5λ spacing (coupling −15 dB), the coupling-induced error is negligible (gain loss < 0.1 dB, PSLL degradation < 0.5 dB). However, for densely arranged arrays with spacing less than , mutual coupling compensation should be incorporated to maintain pattern recovery accuracy.
The proposed SEMM features low computational complexity and favorable real-time performance in beam recovery. Its overall computation falls into three stages: strain-to-displacement transformation via Equations (17)–(19) adopts matrix–vector multiplication with a complexity of , where N denotes the number of array elements and M is the number of strain sensors; element posture calculation, including normal vector derivation via cross product and Euler angle computation, which has a complexity of for both vector operations and trigonometric evaluations; and excitation calculation using Equation (23) also runs at . The total complexity is , varying linearly with array size. Tested on a standard PC with an Intel Core i7-10700 (2.9 GHz) processor using 32 array elements and 24 strain sensors, the model takes merely 0.8 ms for one compensation cycle, far outperforming optimization-based methods and running at a similar speed to the phase-based method (~0.5 ms) and FFT-based method (~0.6 ms). Benefiting from the high computation speed, the SEMM achieves an update rate of over 1 kHz and is very applicable to real-time adaptive beam recovery for phased array antennas under time-varying deformations and dynamic loads. The proposed SEMM features low computational complexity and favorable real-time performance, with the total computation completed within 0.8 ms per cycle. It should be noted that the current experimental validation is limited to quasi-static deformation cases. The main challenge for dynamic validation is that the radiation pattern is difficult to measure in real-time. Considering the high cost and long cycle of building a dynamic measurement system, experimental validation under continuous dynamic deformation conditions will be conducted in future work.
6. Conclusions
This paper proposes a SEMM for the beam recovery of deformed PAAs. The proposed model enables the rapid calculation of excitations for arbitrarily deformed PAA using discrete structural strain measurements. An X-band PAA experimental system with a variable surface shape was designed and fabricated. The experimental results demonstrate that the proposed SEMM outperforms existing models in recovering distorted patterns of the deformed PAA. The proposed SEMM (23) is compact and efficient, and holds promising potential for developing active correction systems for future PAA applications, such as active skin antennas installed on the fuselage or wings of an aircraft and space-based flexible phased array antennas. In addition, the analytical Formula (17) also provides a valuable solution for the excitation calculation in some array antennas, such as conformal array antennas with a known surface shape or the PAA mounted with a displacement measurement device. Future work will focus on experimental validation under continuous dynamic deformation conditions, integration of mutual coupling compensation into the SEMM framework, and extension of the proposed model to larger-scale arrays with more complex deformation patterns.
Author Contributions
Conceptualization, B.T., J.Z., L.K., X.F. and Q.Z.; Methodology, B.T., J.Z. and L.K.; Software, B.T.; Validation, B.T.; Formal analysis, B.T.; Investigation, B.T. and Q.Z.; Resources, X.F. and Q.Z.; Data curation, B.T.; Writing—original draft, B.T.; Writing—review & editing, B.T.; Visualization, B.T. All authors have read and agreed to the published version of the manuscript.
Funding
This research was funded by the National Natural Science Foundation of China under Grant 52175247, in part by the Science and Technology on Electromechanical Dynamic Control Laboratory under Grant 614260125020106.
Data Availability Statement
Data supporting the results can be obtained by contacting the corresponding author via email.
Conflicts of Interest
Author Bo Tang, Xinrui Fang and Qingdong Zhang were employed by the company AVIC Research Institute for Special Structures of Aeronautical Composites. The remaining authors declare that the research was conducted in the absence of any commercial or financial relationships that could be construed as a potential conflict of interest.
References
- Haupt, R.L.; Rahmat-Samii, Y. Antenna Array Developments: A Perspective on the Past, Present and Future. IEEE Antennas Propag. Mag. 2015, 57, 86–96. [Google Scholar] [CrossRef] [Scilit]
- Wang, C.S.; Wang, Y.; Lian, P.Y.; Xue, S.; Xu, Q.; Shi, Y.; Jia, Y.; Du, B.; Liu, J.; Tang, B.F. Space Phased Array Antenna Developments: A Perspective on Structural Design. IEEE Aerosp. Electron. Syst. Mag. 2020, 35, 44–63. [Google Scholar] [CrossRef] [Scilit]
- Ojaroudiparchin, N.; Shen, M.; Pedersen, G.F. A 28 GHz FR-4 compatible phased array antenna for 5G mobile phone applications. In Proceedings of the IEEE International Symposium on Antennas and Propagation; IEEE: New York, NY, USA, 2015; pp. 1–4. [Google Scholar]
- Yang, H.; Liu, X.; Fan, Y. Design of Broadband Circularly Polarized All-Textile Antenna and Its Conformal Array for Wearable Devices. IEEE Trans. Antennas Propag. 2022, 70, 209–220. [Google Scholar]
- Tang, C.; Li, Z.; Xing, H.; Wang, M.; Fan, C.; Zheng, H.; Li, E. Broadband Flexible Metasurface-Inspired Antenna Array with Lower Scattering on Curved Surfaces. IEEE Antennas Wirel. Propag. Lett. 2024, 23, 2949–2953. [Google Scholar] [CrossRef] [Scilit]
- Lian, S.; Wang, W.; Zhou, Y.; Lou, S.; Zhang, Z. Analysis and Compensation of Deformed Antenna Arrays Based on Infinitesimal Dipole Model. IEEE Antennas Wirel. Propag. Lett. 2023, 22, 1868–1872. [Google Scholar] [CrossRef] [Scilit]
- Song, L.W.; Duan, B.Y.; Zheng, F.; Zhang, F.S. Performance of Planar Slotted Waveguide Arrays with Surface Distortion. IEEE Trans. Antennas Propag. 2011, 59, 3218–3223. [Google Scholar] [CrossRef] [Scilit]
- Zhou, J.; Tang, B.; Zhong, J.; Ma, Y.; Huang, J. Deformation analysis and experiments for functional surface of composite antenna structure. Proc. Inst. Mech. Eng. Part C J. Mech. Eng. Sci. 2018, 232, 895–907. [Google Scholar]
- Arnold, E.J. Effects of vibration on a wing-mounted ice-sounding antenna array. IEEE Antennas Propag. Mag. 2014, 56, 41–52. [Google Scholar]
- Lu, G.Y.; Zhou, J.Y.; Cai, G.P.; Fang, G.Q.; Lv, L.L.; Peng, F.J. Studies of thermal deformation and shape control of a space planar phased array antenna. Aerosp. Sci. Technol. 2019, 93, 105311. [Google Scholar] [CrossRef] [Scilit]
- Takahashi, T.; Nakamoto, N.; Ohtsuka, M.; Aoki, T.; Konishi, Y.; Chiba, I.; Yajima, M. On-Board Calibration Methods for Mechanical Distortions of Satellite Phased Array Antennas. IEEE Trans. Antennas Propag. 2012, 60, 1362–1372. [Google Scholar]
- Braaten, B.D.; Roy, S.; Al Aziz, M.; Chamberlain, N.F.; Irfanullah, I.; Reich, M.T.; Anagnostou, D.E. A Self-Adapting Flexible (SELFLEX) Antenna Array for Changing Conformal Surface Applications. IEEE Trans. Antennas Propag. 2013, 61, 655–665. [Google Scholar]
- Braaten, B.D.; Roy, S.; Irfanullah, I.; Nariyal, S.; Anagnostou, D.E. Phase-Compensated Conformal Antennas for Changing Spherical Surfaces. IEEE Trans. Antennas Propag. 2014, 62, 1880–1887. [Google Scholar] [CrossRef] [Scilit]
- Zhou, J.; Kang, L.; Tang, B.; Tang, B.; Huang, J.; Wang, C. Adaptive Compensation of Flexible Skin Antenna with Embedded Fiber Bragg Grating. IEEE Trans. Antennas Propag. 2019, 67, 4385–4396. [Google Scholar] [CrossRef] [Scilit]
- Lesueur, G.; Caer, D.; Merlet, T.; Granger, P. Active compensation techniques for deformable phased array antenna. In Proceedings of the European Conference on Antennas and Propagation, Berlin, Germany; IEEE: New York, NY, USA, 2009; pp. 1578–1581. [Google Scholar]
- Seong, C.-M.; Kang, M.-S.; Lee, C.-S.; Park, D.-C. Conformal array pattern synthesis on a curved surface with quadratic function using adaptive genetic algorithm. In Proceedings of the Asia-Pacific Microwave Conference Proceeding; IEEE: New York, NY, USA, 2013; pp. 167–169. [Google Scholar]
- Alizadeh, M.M.; Hosseini, S.E. Pattern synthesize of a cylindrical conformal array antenna by PSO algorithm. Int. J. RF Microw. Comput. Aided Eng. 2020, 30, e22137. [Google Scholar] [CrossRef] [Scilit]
- Tang, B.; Zhou, J.Z.; Tang, B.F.; Wang, Y.; Kang, L. Adaptive Correction for Radiation Patterns of Deformed Phased Array Antenna. IEEE Access 2019, 8, 5416–5427. [Google Scholar] [CrossRef] [Scilit]
- Chiba, I.; Hariu, K.; Sato, S.; Mano, S. A projection method providing low sidelobe pattern in conformal array antennas. In Proceedings of the 1989 IEEE Digest on Antennas and Propagation Society International Symposium; IEEE: New York, NY, USA, 1989; pp. 130–133. [Google Scholar]
- Kojima, N.; Hariu, K.; Chiba, I. Low sidelobe pattern synthesis using projection method with mutual coupling compensation. In Proceedings of the IEEE International Symposium on Phased Array Systems and Technology; IEEE: New York, NY, USA, 2003; pp. 559–564. [Google Scholar]
- Mehrpour Bernety, H.; Venkatesh, S.; Schurig, D. Analytical Phasing of Arbitrarily Oriented Arrays Using a Fast, Analytical Far-Field Calculation Method. IEEE Trans. Antennas Propag. 2018, 66, 2911–2922. [Google Scholar] [CrossRef] [Scilit]
- Li, J.Y.; Qi, Y.X.; Zhou, S.G. Shaped Beam Synthesis Based on Superposition Principle and Taylor Method. IEEE Trans. Antennas Propag. 2017, 65, 6157–6160. [Google Scholar] [CrossRef] [Scilit]
- Khalaj-Amirhosseini, M. Design of Nonuniformly Spaced Antenna Arrays Using Fourier’s Coefficients Equating Method. IEEE Trans. Antennas Propag. 2018, 66, 5326–5332. [Google Scholar]
- Ruze, J. Antenna tolerance theory—A review. Proc. IEEE 1966, 54, 633–640. [Google Scholar] [CrossRef] [Scilit]

Disclaimer/Publisher’s Note: The statements, opinions and data contained in all publications are solely those of the individual author(s) and contributor(s) and not of MDPI and/or the editor(s). MDPI and/or the editor(s) disclaim responsibility for any injury to people or property resulting from any ideas, methods, instructions or products referred to in the content. |
© 2026 by the authors. Licensee MDPI, Basel, Switzerland. This article is an open access article distributed under the terms and conditions of the Creative Commons Attribution (CC BY) license.