1. Introduction
Driven by the rapid expansion of IoT, 5G, and cloud computing, global network traffic has experienced explosive growth. While this digital transformation enables seamless connectivity and information sharing, it also creates a broader attack surface for cyber threats [
1]. As network environments become increasingly complex, attack methods have evolved from traditional denial-of-service attacks to more covert and sophisticated forms, such as exploits and advanced persistent threats [
2]. At the same time, data imbalance issues can also affect model detection accuracy and false positive rates [
3]. Network Intrusion Detection (NID) is a key part of cybersecurity. It monitors network traffic, identifies anomalies, and analyzes behaviors in real time. This process effectively detects malicious activities and unauthorized operations, providing strong support for security alerts and incident response. Consequently, developing an NID model that is real-time, highly efficient, and highly generalizable has become a pressing demand in both academia and industry [
4,
5].
Early NID methods primarily relied on misuse detection, which identifies threats by matching network traffic against a database of known attack signatures. While highly accurate with low false positive rates for known threats, this method struggles to detect zero-day attacks and new variants [
6]. To overcome this limitation, research has shifted toward anomaly detection. This approach establishes a baseline of normal network behavior and flags any deviations as potential attacks. Although this enables the detection of unknown threats, the dynamic nature of modern networks causes traditional anomaly detection to suffer from persistently high false positive rates (FPR) [
7,
8].
Researchers have widely adopted data-driven artificial intelligence (AI) technologies to improve the accuracy and robustness of anomaly detection [
9]. In the early stages, researchers built detection models primarily using machine learning (ML) algorithms. However, traditional ML methods rely heavily on manual feature engineering. As a result, they struggle to process massive, high-dimensional modern network traffic [
10]. In recent years, advances in computing power have enabled deep learning (DL) to transform NID research. DL models can automatically extract multi-level, high-dimensional features directly from raw traffic data. This capability eliminates the need for manual feature design. Furthermore, it significantly improves attack detection rates in massive and complex traffic. Ultimately, DL shifts the technology from manual feature engineering to automatic feature learning [
11,
12].
However, as attack obfuscation techniques evolve, deep learning models based on single architectures have gradually revealed their inherent limitations. For example, CNNs [
13,
14] cannot dynamically model time series; while LSTM [
15] excel at time series processing, they are prone to losing long-range dependencies when dealing with extremely long sequences, and due to their serial computing mechanism, they lack a macro-level perception of global traffic [
16]. Recently, the Transformer architecture [
17] has proven effective at capturing global long-range dependencies using self-attention. Yet, Transformers struggle with local temporal fluctuations [
18]. To address these issues, researchers have turned to hybrid architectures [
19]. By combining the strengths of multiple single models, hybrid approaches capture both global correlations and local temporal fluctuations. This allows them to extract richer, multidimensional features, making hybrid design a key research direction to overcome the limits of current NID [
20].
To address these challenges, this paper proposes the GLT NID model. First, the model applies Log1p feature smoothing and sliding window serialization to the raw traffic data. Next, it uses a multi-layer Transformer Encoder to capture hidden correlations across different time steps in the traffic sequence. Finally, the model introduces a BiLSTM [
21] network to finely characterize the local temporal evolution patterns of packet arrivals. Furthermore, at the algorithmic level, this paper presents a soft-weighted cross-entropy optimization strategy based on low-order smoothing. This strategy effectively balances the model’s high confidence in normal traffic with its sensitivity to rare covert attacks, all while preserving the original temporal structure.
The contributions of this paper can be summarized as follows:
To address the shortcomings of single-model architectures, we proposed a multi-model approach to leverage their complementary strengths. Specifically, our approach combines a Transformer and a BiLSTM. The Transformer captures global long-range dependencies, while the BiLSTM handles micro-level bidirectional temporal reasoning. Together, they build a network intrusion detection model with powerful spatiotemporal representations. Ultimately, this combined model effectively improves the detection of complex covert attacks.
We designed a soft-weighted optimization strategy to address the issue of data class imbalance. Specifically, we introduced a Log1p transformation to stretch the numerical distribution of extremely imbalanced traffic features. Next, we combined this transformation with a power-smoothed soft-weighting mechanism. Ultimately, this combined strategy mitigates the high false positive rates that traditional models face in class-imbalanced scenarios.
Experiments were conducted on two benchmark datasets: NSL-KDD [
22] and UNSW-NB15 [
23]. The results show that our model achieved overall accuracy rates of 99.57% and 88.04%, respectively. Compared to existing models, we achieved performance improvements ranging from 0.3% to 10% on the NSL-KDD dataset and from 0.5% to 10% on the UNSW-NB15 dataset, validating the model’s ability to detect attacks.
The remainder of this paper is organized as follows:
Section 2 reviews the current state of the art and recent advancements.
Section 3 details the network intrusion detection model proposed in this paper.
Section 4 presents experimental results, ablation studies, and a comparative analysis with existing mainstream methods.
Section 5 summarizes the research findings and outlines future research directions.
2. Related Work
Cyberattack methods are constantly evolving, and encrypted traffic is now widely used. As a result, traditional NID models based on static signatures and rule matching struggle against massive, high-dimensional, and obfuscated modern threats [
24]. To address this challenge, data-driven Machine Learning (ML) and Deep Learning (DL) have become core research directions in network security. These AI techniques use massive network flow data to learn complex behavioral and statistical patterns. This allows models to effectively identify unknown zero-day threats and stealthy attack variants [
25,
26,
27].
Talukder et al. [
28] proposed a machine learning intrusion detection model that integrates the Synthetic Minority Over-sampling Technique (SMOTE) with XGBoost feature selection. The model uses Random Forest (RF) for classification. It achieved strong binary classification accuracy on both the KDDCUP99 and CIC-MalMem-2022 datasets. However, these results are based on static memory features. It remains unclear whether the model can maintain stable and effective detection performance in real-world network traffic with complex temporal fluctuations.
Recently, Yuan et al. [
29] proposed CANET, a hierarchical CNN-Attention model for network intrusion detection. This model combines convolutional neural networks with self-attention mechanisms to extract spatio-temporal features and introduces Equalization Loss v2, a dynamic gradient weighting strategy, to address the class imbalance issue in intrusion detection datasets. CANET has achieved promising detection performance on mainstream datasets including UNSW-NB15 and NSL-KDD. However, there are still some limitations to be further explored and optimized. First, the model adopts a hierarchical structure that applies convolution and pooling operations before the attention mechanism, which may affect the preservation of micro-temporal continuity inherent in raw network traffic data. Second, its dynamic gradient weighting mechanism needs to continuously track the ratio of positive to negative gradients for each class throughout the training process, which may lead to relatively high computational overhead and susceptibility to random fluctuations in batch data.
Dash et al. [
30] proposed an optimized LSTM-based intrusion detection framework. The study used heuristic algorithms like PSO, JAYA, and the Sea Squirt Algorithm (SSA) to automatically tune LSTM hyperparameters, such as hidden-layer neurons and learning rates. This method improved accuracy on the NSL-KDD and CIC-IDS2017 datasets. However, single-LSTM architectures based on heuristic optimization still face limitations. The large search space of the iterative optimization leads to high computational and time costs, which reduces the model’s agility in dynamic networks. Additionally, the model is mainly restricted to local temporal features and lacks the ability to extract global correlations across the network traffic.
Given that standalone CNNs struggle with time series modeling and LSTMs lack high-dimensional abstraction, researchers have turned to hybrid architectures that combine the strengths of both. For example, Said et al. [
31] proposed a CNN-BiLSTM network for intrusion detection. Their study first used Random Forests (RF) and Recursive Feature Elimination (RFE) to reduce the input features to ten, while applying random oversampling to balance the classes. The model then extracts spatial features via a CNN and captures temporal dependencies through a BiLSTM, achieving 84.23 percent accuracy on the UNSW-NB15 task. However, their oversampling technique merely replicates minority samples at the physical level, which often leads to severe overfitting during training.
Since Vaswani et al. introduced the Transformer architecture, its multi-head self-attention mechanism has shown outstanding capabilities in sequence modeling, making it widely adopted for network traffic feature extraction. For instance, Wang et al. [
32] proposed a parallel Res-TranBiLSTM hybrid network for intrusion detection. This model employs Transformer’s multi-head self-attention combined with BiLSTM to capture deep temporal features, and leverages ResNet in a parallel branch to extract spatial features. Although it achieves promising performance on multiple IoT datasets, this method still suffers from two inherent limitations that restrict its generalization capability. On the one hand, the mandatory reshaping of one-dimensional traffic sequences into two-dimensional pseudo-images to fit ResNet’s input requirements violates the intrinsic protocol semantics of network traffic. On the other hand, the SMOTE-ENN oversampling technique employed in this work may inadvertently corrupt the fine-grained temporal dependencies between successive network packets.
While these directly concatenated hybrid architectures face issues with feature fidelity, resampling logic, and computational overhead, the Transformer’s ability to capture global features across time steps has undoubtedly opened new possibilities for network intrusion detection. If architectural redundancies are streamlined and temporal integrity is maintained, the Transformer offers significant potential for optimization and broad application in this field [
33,
34,
35].
3. Proposed Methodology
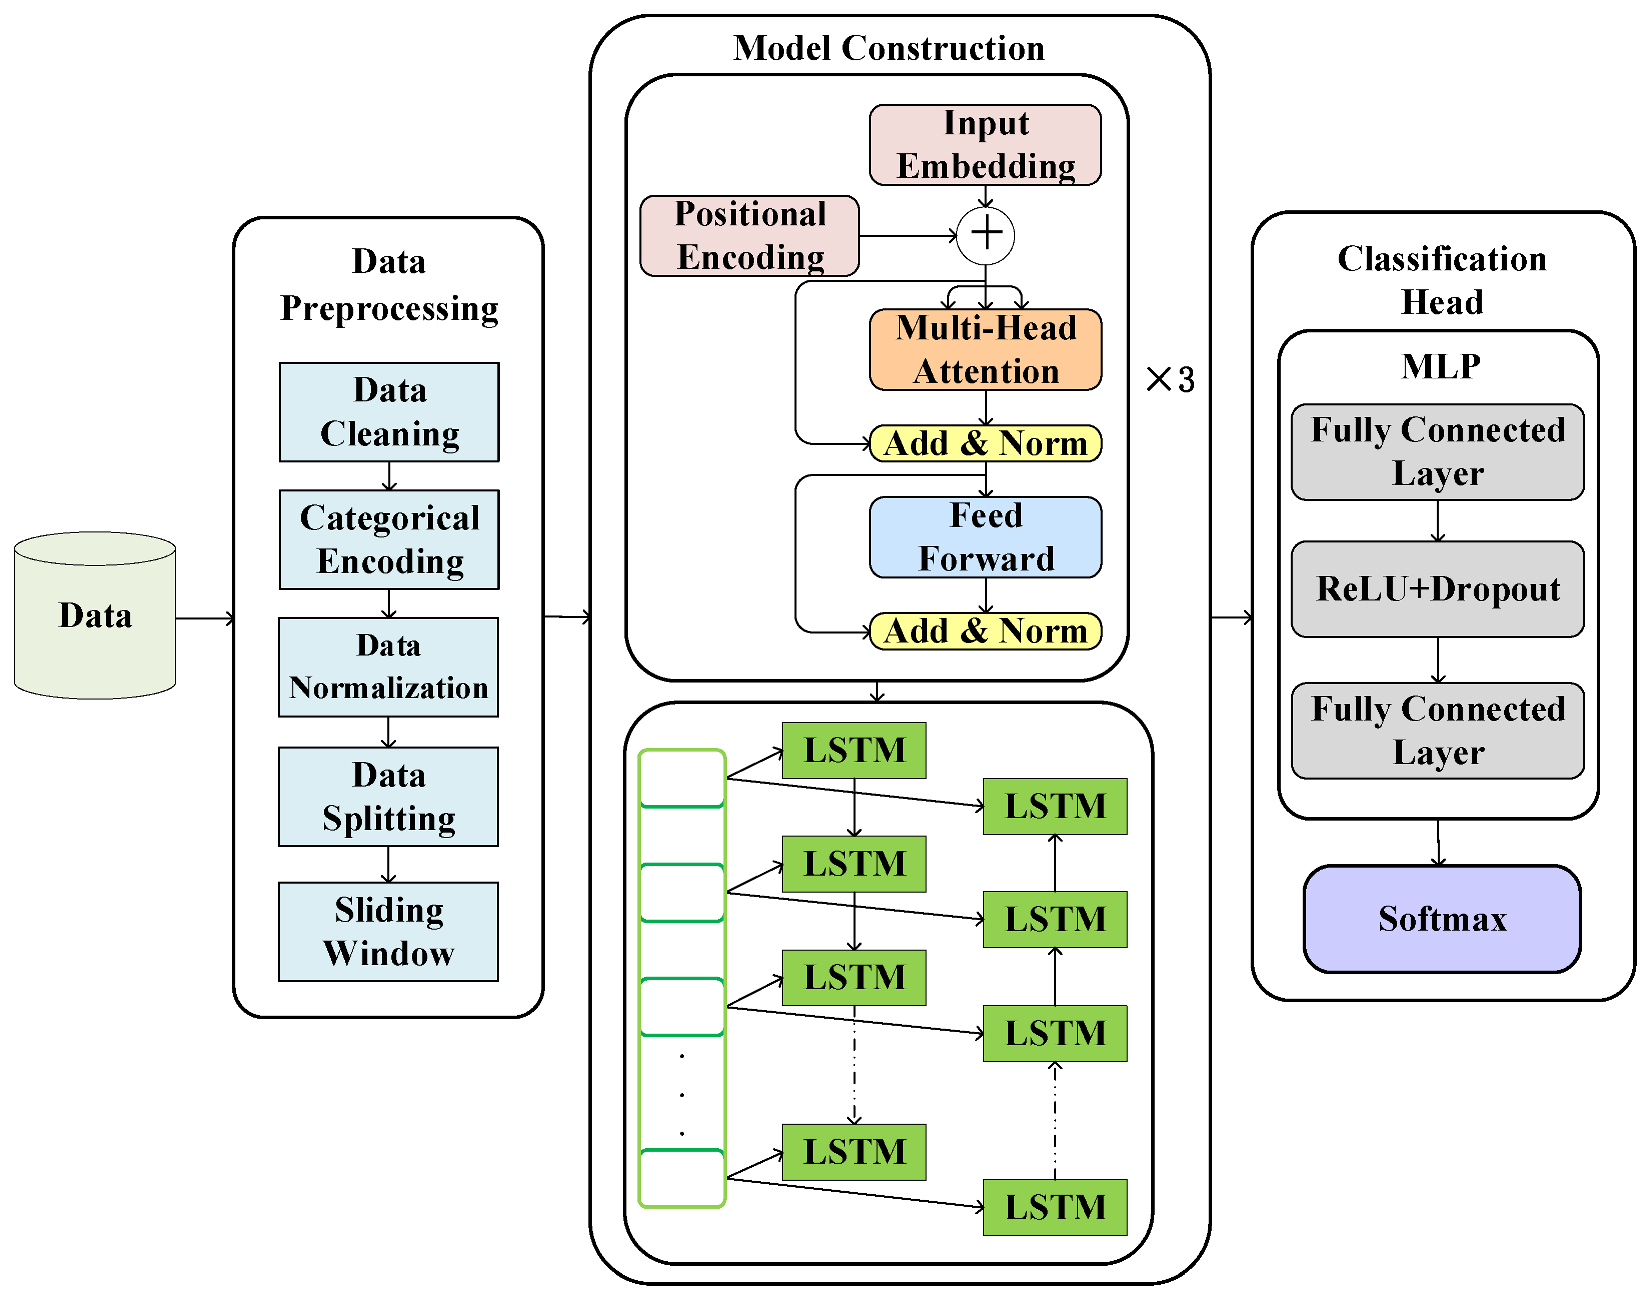
This section presents the design and implementation of the proposed network intrusion detection model, with its overall architecture illustrated in
Figure 1.
As illustrated in
Figure 1, raw data is first preprocessed using logarithmic smoothing, normalization, and sliding-window serialization. It then enters the embedding and spatial encoding modules, which map features into high-dimensional vectors and incorporate spatial information. Next, a three-layer Transformer encoder uses multi-head self-attention to capture long-range dependencies, while residual and feedforward networks further enhance the feature representation. A BiLSTM module subsequently extracts bidirectional temporal correlations to produce an enhanced feature vector. Finally, two fully connected layers perform dimensionality reduction, and a Softmax function outputs the classification results.
3.1. Global Feature Extraction
The model begins with an input embedding stage. Because the Transformer architecture lacks a recursive structure and cannot inherently perceive sequence order, we incorporate sine and cosine positional encodings. As defined in Equations (1) and (2), even positions are encoded using the sine function, while odd positions use the cosine function. These encodings are added directly to the feature embedding vectors, allowing the model to perceive relative positions within the sequence.
The final representation vector
input to the encoder is obtained by adding the linear projection result to the position encoding, as shown in Equation (3).
where
represents the preprocessed raw traffic feature matrix;
denotes the weight matrix for linear projection, which maps low-dimensional raw features into a high-dimensional embedding space;
is the bias term that, together with the weight matrix, performs the linear transformation; and
is the introduced positional encoding.
The Transformer Encoder, composed of self-attention and feedforward layers, functions as the central component for global feature extraction. Its primary objective is to capture complex dependencies within traffic sequences from a macro perspective. In contrast to CNNs, which emphasize local receptive fields, the Transformer evaluates the pairwise correlations of all packets within a specific time window. Moreover, unlike sequential RNN models [
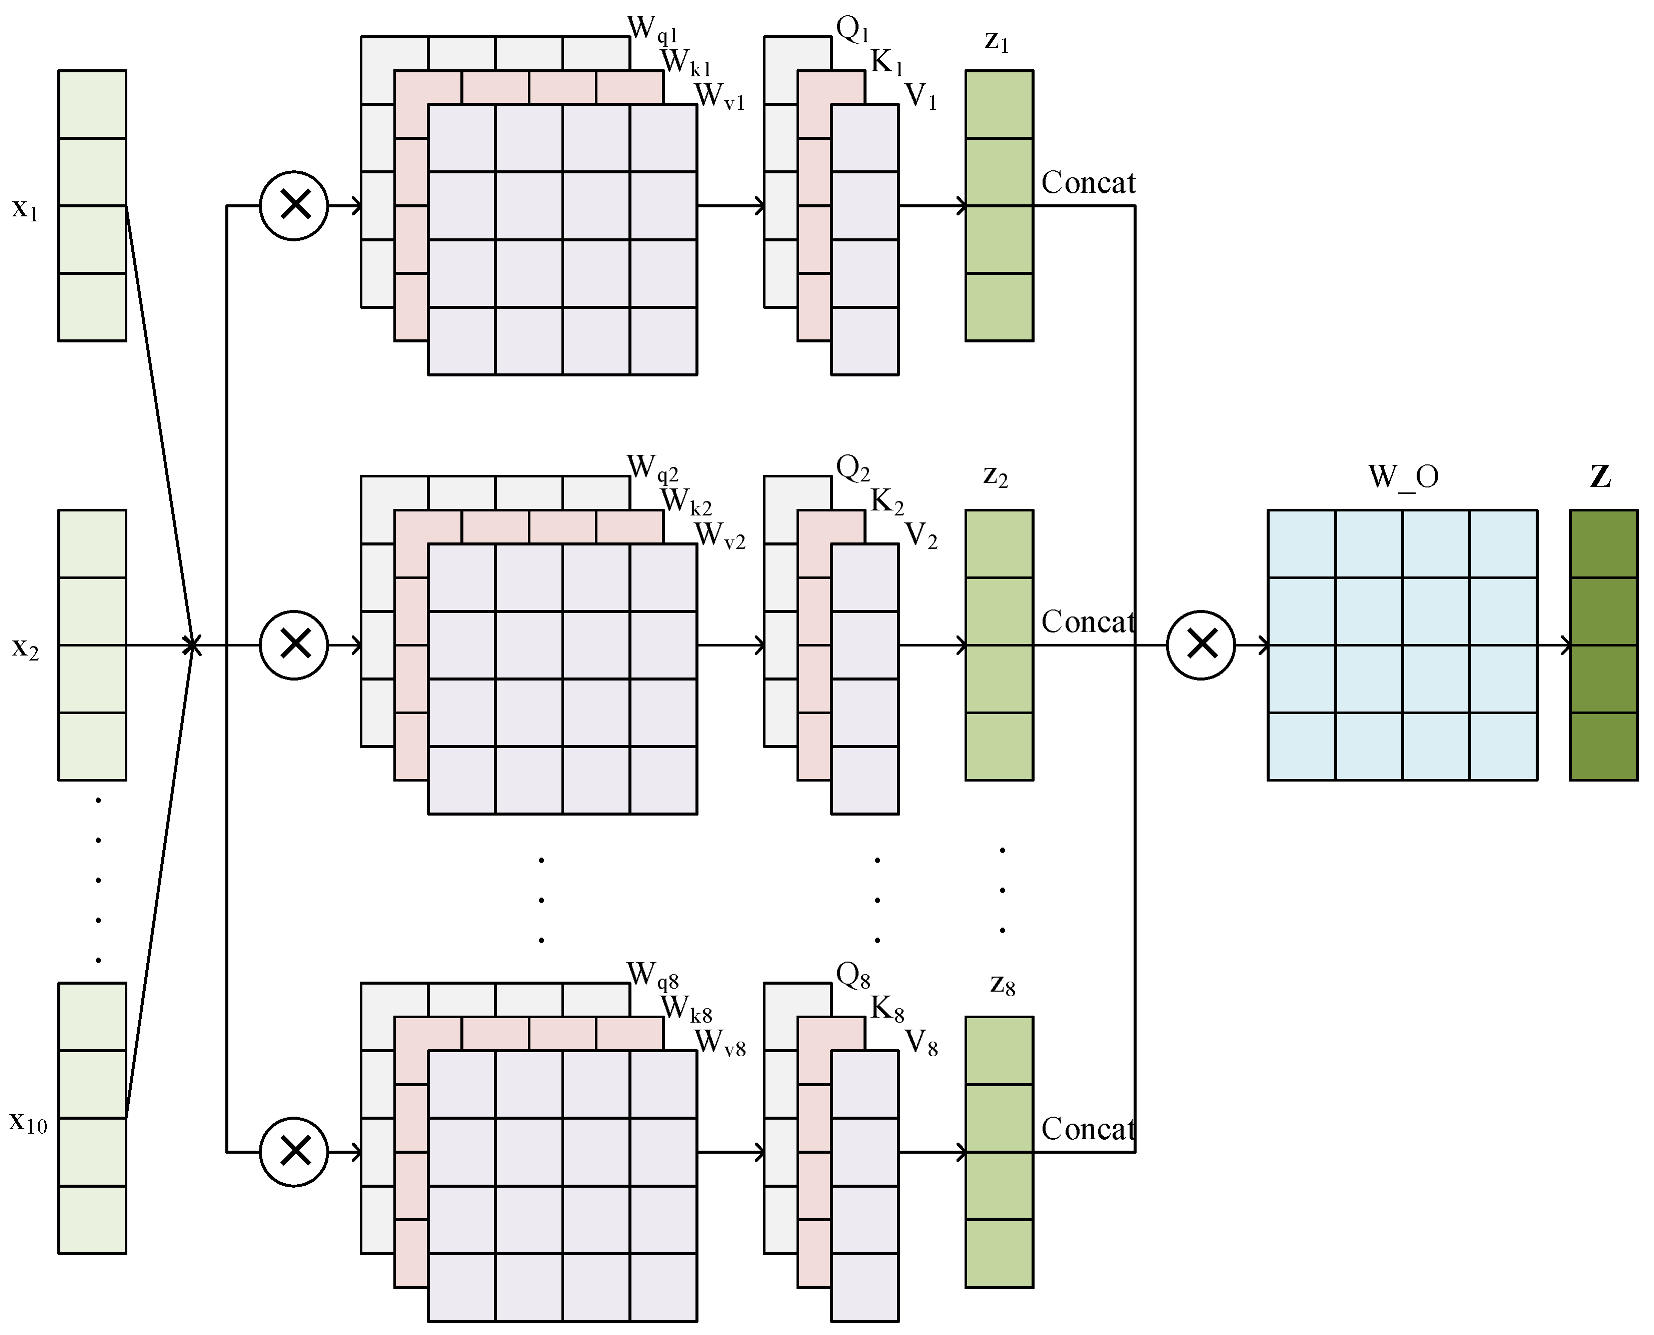
36], the Transformer leverages multi-head self-attention to process entire sequences in parallel. Consequently, it can identify covert attack patterns involving long-range dependencies, as depicted in
Figure 2.
To facilitate the extraction of multifaceted feature information, the architecture employs h = 8 attention heads. The input feature matrix
, derived from the preceding embedding layer, undergoes linear projection via three sets of learnable weight matrices. For each individual head i (i = 1, 2, …, 8), the corresponding query
, key
, and value
matrices are defined by the equations:
,
, and
. As depicted in
Figure 2, the input is projected into eight distinct representation subspaces in parallel. This configuration allows the model to concurrently identify diverse patterns within the network traffic features.
Internally, each attention head performs a dot-product operation between
and
to quantify dependencies across sequence positions. A scaling factor of
is integrated to avoid Softmax saturation and the subsequent vanishing gradient problem. Following this, the attention weights are normalized through the Softmax function and used to compute a weighted sum of
, resulting in the head output
as defined in Equation (4).
To maintain mathematical consistency, let denote the overall feature embedding dimension of the model (set to 256). Consequently, is defined as the dimension of the key vectors for each individual attention head. Given that we employed h = 8 parallel attention heads, is explicitly calculated as = /h = 256/8 = 32.
This mechanism allows the model to integrate contextual information from throughout the sequence, modulated by the strength of its correlation with the current feature. Consequently, the model can effectively capture intricate long-range dependencies within the traffic data.
As shown in
Figure 2, to integrate information from all subspaces, we concatenated the output vectors of the 8 heads:
,
, …,
:
The concatenated feature matrix is then fused through an output linear layer
to obtain the final output of the MSA module:
After being processed by a residual connection and layer normalization, the MSA module’s output serves as the input for a feedforward neural network (FFN). This design facilitates the extraction of complex nonlinear features while maintaining the operational stability of the deep network during training. The FFN is formulated as follows:
Here, designates the input vector. In the first encoder layer, corresponds to , whereas in the second and third layers, represents the MSA output after undergoing residual connection and layer normalization. The function denotes the ReLU activation, facilitating non-linear modeling. The parameters {, } and {, } serve as the learnable weights and biases for the first and second linear transformation stages, respectively.
3.2. Local Temporal Refinement
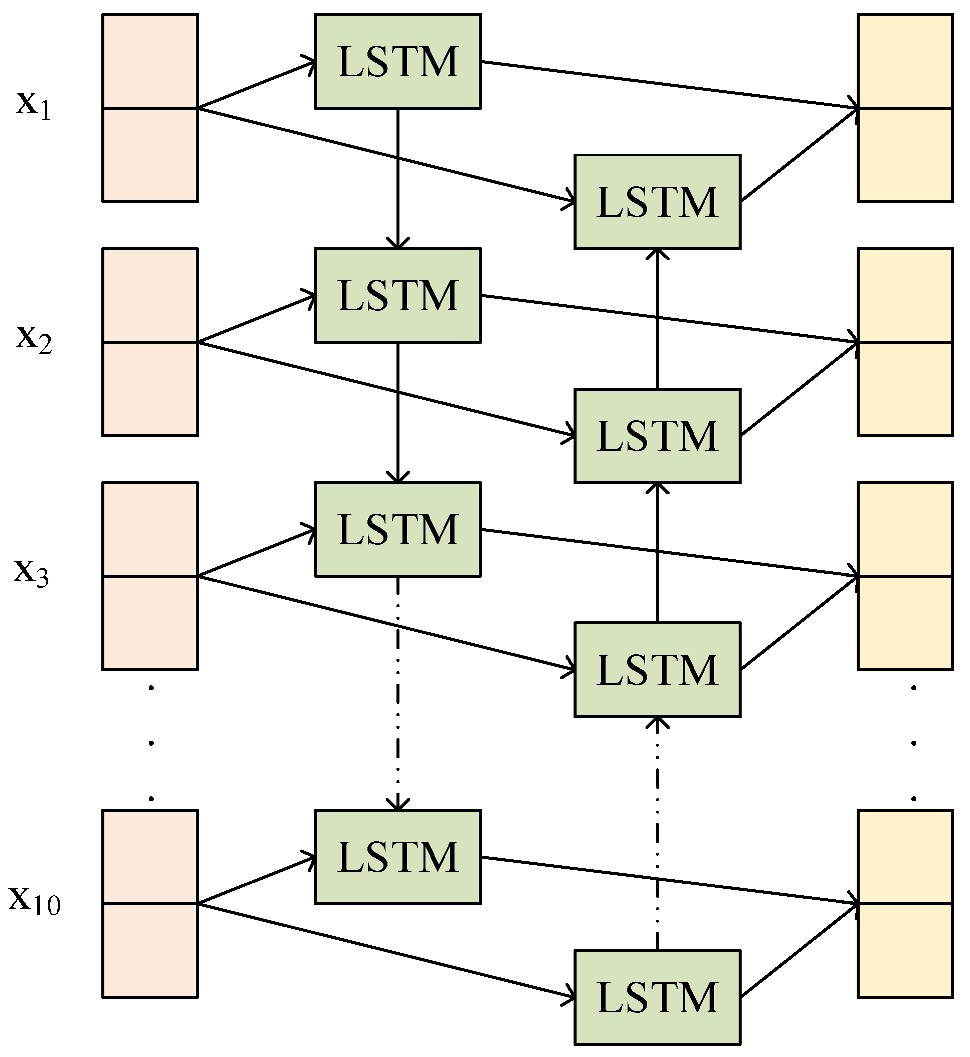
While self-attention allows the Transformer to identify global dependencies, the model lacks the precision required to capture local, continuous temporal fluctuations. To address this and uncover underlying micro-temporal patterns, this paper integrated a Bidirectional Long Short-Term Memory (BiLSTM) network after the Transformer layer. This structure is depicted in
Figure 3.
The BiLSTM primarily consists of two parts: a forward-propagating LSTM and a backward-propagating LSTM. The forward LSTM processes the input from time t = 1 to t = 10, computing the hidden state . This enables the model to capture the cumulative historical effects of attack behavior. The backward LSTM processes the input in reverse order from t = 10 to t = 1, computing the hidden state . This allows the model to utilize subsequent temporal information to refine its assessment of the current time step. The final output at each time step fuses the forward and backward hidden states, ensuring that the result incorporates information from both past and future time steps.
Each LSTM unit in
Figure 3 is not a simple nonlinear activation function, but a complex gated memory block.
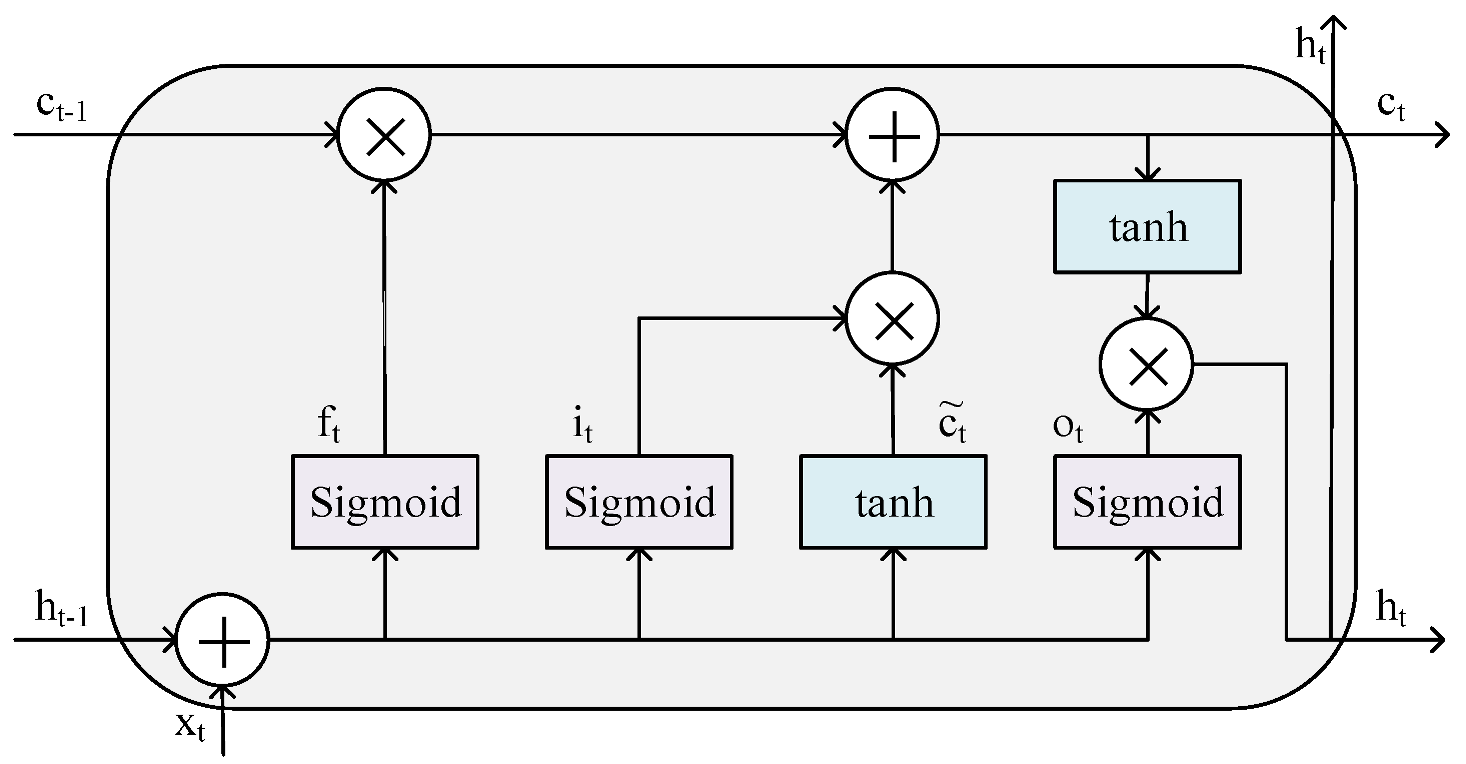
Figure 4 details the internal computational logic of a single LSTM unit at time step t.
As shown in
Figure 4, the current-time flow features
and the previous-time hidden state
are first concatenated, then linearly mapped through three weight matrices
,
, and
, respectively, and finally passed through sigmoid activation functions to yield three state vectors
,
, and
. The candidate cell state
is computed by applying the tanh activation function to the linear transformation of the concatenated inputs
and
with the weight matrix
. The functions and calculation formulas for each gate unit are as follows:
Driven by the previous hidden state
and the current input
, the forget gate generates the control vector
. This vector determines the extent to which irrelevant information is discarded from the previous cell state
. The corresponding formula is presented below:
Using the previous hidden state
and the current input
, the input gate produces a control vector
. This vector, along with the candidate cell state
, determines the new attack-related information to be integrated into the cell state. The corresponding calculation is as follows:
The old cell state is filtered through the forget gate and combined with the candidate memory weighted by the input gate to form the cell state at the current time step
:
Based on the previous hidden state
and the current input
, the output gate computes a control vector
. Combined with the updated cell state
, this vector determines the current hidden state
as follows:
where
is the sigmoid activation function, and
,
,
, and
are bias terms.
After T = 10 time steps of recursive computation, the model obtains bidirectional features at each time step that integrate both past and future temporal context. To derive the final representation of the sliding window, the forward and backward features at each time step t are concatenated into a high-dimensional vector.
Since the final time step t = 10 of the BiLSTM aggregates the complete temporal information of the entire sequence, we extracted the as the final feature vector for this traffic window and feed it into the subsequent classification network.
3.3. Power-Smoothed Soft Weighting Strategy
In real-world network intrusion detection, traffic data typically exhibits extreme class imbalance. Traditional deep learning models rely on standard cross-entropy loss, which assumes nearly equal prior probabilities for each class. However, under severe imbalance, the training process is dominated by majority samples. This causes the model to prioritize high overall accuracy by predicting most samples as belonging to the majority class. This bias leads to two critical issues: low recall for minority classes, which renders the detection of high-risk rare attacks virtually impossible, and overfitting to the majority class, where the model learns statistical frequency biases rather than meaningful decision boundaries [
37,
38].
Although oversampling or undersampling are common solutions, in time-series data, randomly adding or removing samples disrupts the time-dependent structure of packet arrivals, causing the LSTM module to fail.
To resolve these issues without compromising the data’s temporal structure, this paper proposed a soft weighting strategy based on power-smoothing. We aimed to prevent the model from ignoring minority classes while avoiding excessively high weights that could make it overly sensitive to noise. By introducing an extremely small smoothing exponent to the inverse class frequency weights, we compressed the weight distribution. This enables the model to focus on minority samples while still prioritizing the primary classes that represent the majority of network traffic. The process is defined as follows:
Initial Calculation of Inverse Class Frequency: First, we defined a base weight
for each class
that is inversely proportional to the total number of samples in that class.
Here, represents the total number of samples, is the total number of classes, and is the number of samples in class .
Power-Law Smoothing: To mitigate the negative impact of extreme weights, we introduced a smoothing coefficient
to perform nonlinear compression on
.
In this study, after extensive experimental comparisons, was selected as the final setting. When , standard inverse frequency weighting is applied (placing extreme importance on minority classes). When , no weighting is applied (minority classes are ignored). When , the variance of the weights is significantly reduced. This not only preserves appropriate attention to minority classes but also ensures that the model’s feature learning for majority classes remains undisturbed.
Finally, we incorporated the smoothed weights
into the cross-entropy loss function:
where
denotes the mini-batch size used during the training phase (set to 256 in our experiments).
represents the total number of classification categories (e.g.,
= 10 for the UNSW-NB15 dataset). The term
is the power-law smoothed weight for class
. Furthermore,
∈ {0, 1} is explicitly defined as the one-hot encoded ground truth label indicator, which equals 1 if the i-th sample truly belongs to class
, and 0 otherwise. Finally,
represents the predicted softmax probability that the i-th sample belongs to class
.
The proposed soft weighting strategy demonstrates significant advantages over traditional balancing techniques. By optimizing solely at the loss function level, the method preserves the underlying temporal structure of the traffic data, which is critical for BiLSTM performance. The use of a low-order smoothing coefficient mitigates potential spikes in misclassification that often result from an overemphasis on specific class frequencies. Empirical validation on the NSL-KDD and UNSW-NB15 datasets yielded accuracy rates of 99.57% and 88.04%, with corresponding false positive rates of 0.32% and 0.76%. These metrics underscore the model’s efficacy in handling the challenges of skewed data distributions in network intrusion detection.
4. Experiments and Results
This section evaluates the effectiveness and robustness of the proposed NID model through a series of systematic experiments. It begins with a detailed description of the selected benchmark datasets and their statistical characteristics, followed by an explanation of the data preprocessing methods. We then introduce the experimental setup and evaluation metrics. The core section analyzes the model’s detection performance on the NSL-KDD and UNSW-NB15 datasets. Finally, ablation experiments validate the contributions of each component in the hybrid architecture, while a comparative analysis highlights the model’s advantages over current mainstream NID methods.
4.1. Dataset Description
To evaluate the model’s generalization ability across different network environments, this paper selected two representative public datasets: NSL-KDD and UNSW-NB15.
NSL-KDD is an enhanced version of the classic KDDCup99 dataset and resolves the severe record redundancy found in the original version. The dataset comprises 41-dimensional features, including basic TCP connections, content-based characteristics, and time-based traffic patterns. It identifies four primary attack categories: DoS, Probe, R2L, and U2R. While NSL-KDD offers a more balanced class distribution than KDDCup99, the R2L and U2R categories remain rare. These low-sample classes present a significant challenge to the model’s detection sensitivity and generalization performance.
UNSW-NB15 is a modern network traffic dataset developed by the Australian Cyber Security Laboratory. Compared to NSL-KDD, it more accurately reflects the complex landscape of contemporary cyber threats. The dataset comprises 49 features, spanning basic flow, content, temporal, and connection characteristics. Attacks are organized into nine primary families: Generic, Exploits, Fuzzers, DoS, Reconnaissance, Analysis, Backdoor, Shellcode, and Worms. Samples of Normal and Generic traffic account for the vast majority, while categories such as Worms and Shellcode are extremely scarce. This profound class imbalance is critical for evaluating the real-world performance of NID models.
In this study, rather than utilizing the official, predefined training and testing partitions, we adopted a custom re-splitting strategy. Specifically, we performed a file-order concatenation of the official train and test files into a global data pool, followed by an 80/20 cut (80% for training and 20% for testing).
Table 1 and
Table 2 present the data statistics of NSL-KDD and UNSW-NB15 before and after partitioning, respectively.
As shown in
Table 1, the NSL-KDD dataset is highly challenging due to distribution discrepancies between the training and test sets. Despite data merging and re-splitting, severe class imbalance still persists in the datasets. In particular, the stealthy U2R attack only contains 70 samples within the entire test set of 29,695 entries. In contrast, the R2L class has only 805 samples in the training set but 2944 samples in the test set. Such an extremely few-shot test scenario imposes stringent requirements on the model’s capability to capture subtle temporal features.
Table 2 illustrates the class distribution of the UNSW-NB15 dataset. Compared to NSL-KDD, this dataset exhibits a more severe class imbalance, which better reflects contemporary network environments. This poses significant challenges to the model’s ability to learn from limited samples. Worms and Shellcode attacks represent less than 1 percent of the total samples, making them highly susceptible to being overlooked. Additionally, the Exploits category comprises diverse exploitation techniques that are difficult to distinguish from benign traffic. These characteristics underscore the necessity of our log-smoothing strategy and soft-weighted loss function for maintaining robust detection across all classes.
4.2. Data Preprocessing
The NSL-KDD and UNSW-NB15 datasets comprise both numerical and categorical attributes. Initially, categorical features were mapped to numerical space using label encoding. For numerical attributes, we opted for a logarithmic smoothing transformation rather than direct normalization. This choice prevents the compression of imbalanced data into restrictive intervals, thereby preserving distribution details and enhancing the model’s sensitivity to varying traffic intensities. Following this transformation, min-max normalization was applied to standardize feature scales across dimensions. Finally, the processed records were structured into sequence tensors using a sliding window approach with a temporal step of T = 10. The transformation formula is expressed as:
For the input feature x, the logarithmic transformation is defined as
After the logarithmic transformation, min-max normalization scales all features to the [0, 1] range. This step eliminates scale differences across different dimensions and allows gradient descent to converge more quickly.
4.3. Experimental Setup
All experiments in this paper were conducted on a computer configured with a 64-bit 11th Gen Intel Core i5-11400H@2.70GHz processor, an NVIDIA GeForce RTX 3050 Ti graphics card, 16 GB of RAM, and running the Windows 11 operating system. The GLT network intrusion detection model proposed in this paper was implemented using Python 3.8. The deep learning framework selected was PyTorch (v1.13). Leveraging its efficient tensor operations and modular interface, we constructed a hybrid Transformer and BiLSTM model and utilized the CUDA interface to accelerate training on an NVIDIA GPU.
During the data preprocessing and feature engineering phases, we used the Pandas library to clean and integrate large-scale traffic data. To standardize and digitize the features, we employed the MinMaxScaler and LabelEncoder modules from Scikit-learn. Furthermore, in the evaluation stage, we utilized the classification_report and confusion_matrix functions from Scikit-learn to calculate precision, recall, and F1-score. Numerical computations and log transformations were handled by the efficient matrix operations of the NumPy library.
For high performance and reproducible experiments, the model’s hyperparameters were fine-tuned. We categorized these hyperparameters into two groups. The first group, architecture parameters (see
Table 3), determines the model’s depth and feature extraction ability. The second group, training strategy parameters (see
Table 4), dictates the model’s convergence rate and generalization power. The full source code documentation are detailed in
Supplementary File S1.
4.4. Evaluation Metrics
Given the multi-class nature and significant class imbalance of intrusion detection tasks, relying on a single evaluation metric is often inadequate. To ensure a comprehensive assessment, we used accuracy, precision, recall, F1-score, and false positive rate (FPR) as our primary metrics. Together, they offer a clear and reliable representation of the model’s performance.
These metrics are calculated based on the confusion matrix, which includes the following components:
TP (True Positive): An attack sample correctly identified as an attack.
TN (True Negative): A normal sample correctly identified as normal.
FP (False Positive): A normal sample incorrectly identified as an attack.
FN (False Negative): An attack sample incorrectly identified as normal.
The specific descriptions of each metric are as follows:
Accuracy: Measures the proportion of correctly classified samples across all classes.
Precision: Measures the proportion of truly positive samples among those predicted as attacks. High precision implies a low false positive rate.
Recall: Measures the percentage of actual attack samples correctly identified by the model. A high recall rate indicates a low false negative rate, which is critical for NID.
F1-Score: Defined as the harmonic mean of precision and recall, this metric provides a balanced evaluation, especially on imbalanced datasets.
False Positive Rate (FPR): Represents the proportion of actual normal samples incorrectly predicted as attacks. A lower FPR reflects the model’s superior generalization and discrimination capabilities.
In multi-class classification tasks, we calculated the Macro-Average F1, which is the arithmetic mean of the F1-scores across all categories. This ensures that the performance of minority classes, such as Worms, is accurately reflected in the overall evaluation rather than being overshadowed by majority classes.
4.5. Analysis of Experimental Results
We evaluated the proposed GLT model on two benchmark datasets with different network features to assess its generalization and practical utility. First, we used the NSL-KDD dataset to verify the model’s fundamental classification ability and its sensitivity to low-frequency attacks. We then shifted our focus to the UNSW-NB15 dataset, which provides a more realistic representation of modern traffic. This allowed us to evaluate how effectively the model handles complex modern attacks and extreme data skewness.
Despite being a classic dataset, NSL-KDD remains a critical benchmark for generalization due to the substantial distribution shift between its training and testing partitions. Detailed classification results for our model on the NSL-KDD test set are provided in
Table 5.
The model achieved an overall accuracy of 99.57%. This result indicates that the GLT network intrusion detection model can accurately capture traditional network attack patterns based on feature signatures. It is worth noting that U2R and R2L attacks are extremely scarce in the training set and represent blind spots for traditional machine learning models. This is attributed to the BiLSTM’s ability to capture temporal information; since such attacks often involve specific sequential steps, the introduction of temporal features significantly enhances the model’s ability to learn from sparse data.
Compared to NSL-KDD, the UNSW-NB15 dataset contains more contemporary attack patterns based on payloads and behavior. This provides a crucial foundation for evaluating NID models in real-world network traffic environments.
Table 6 presents the model’s detailed performance metrics on this dataset.
The model achieved a precision of 99.48 percent and a recall of 99.24 percent for the Normal category. In industrial NID deployments, reducing false positives is a top priority, as frequent alarms can lead to business disruptions and alarm fatigue. The model’s exceptional accuracy in identifying normal traffic is attributed to the Transformer’s ability to model global background traffic patterns. This effectively distinguishes benign fluctuations from malicious attacks. Exploits, the third-largest category in the dataset, are among the most difficult to detect due to their subtle features. However, the model achieved an 81.08 percent recall rate for this category. This improvement is driven by two factors: first, Log1p logarithmic smoothing widened the gap between Exploits and Normal traffic in numerical space; second, the Transformer’s self-attention mechanism captured hidden correlations across multiple time steps during the exploitation process.
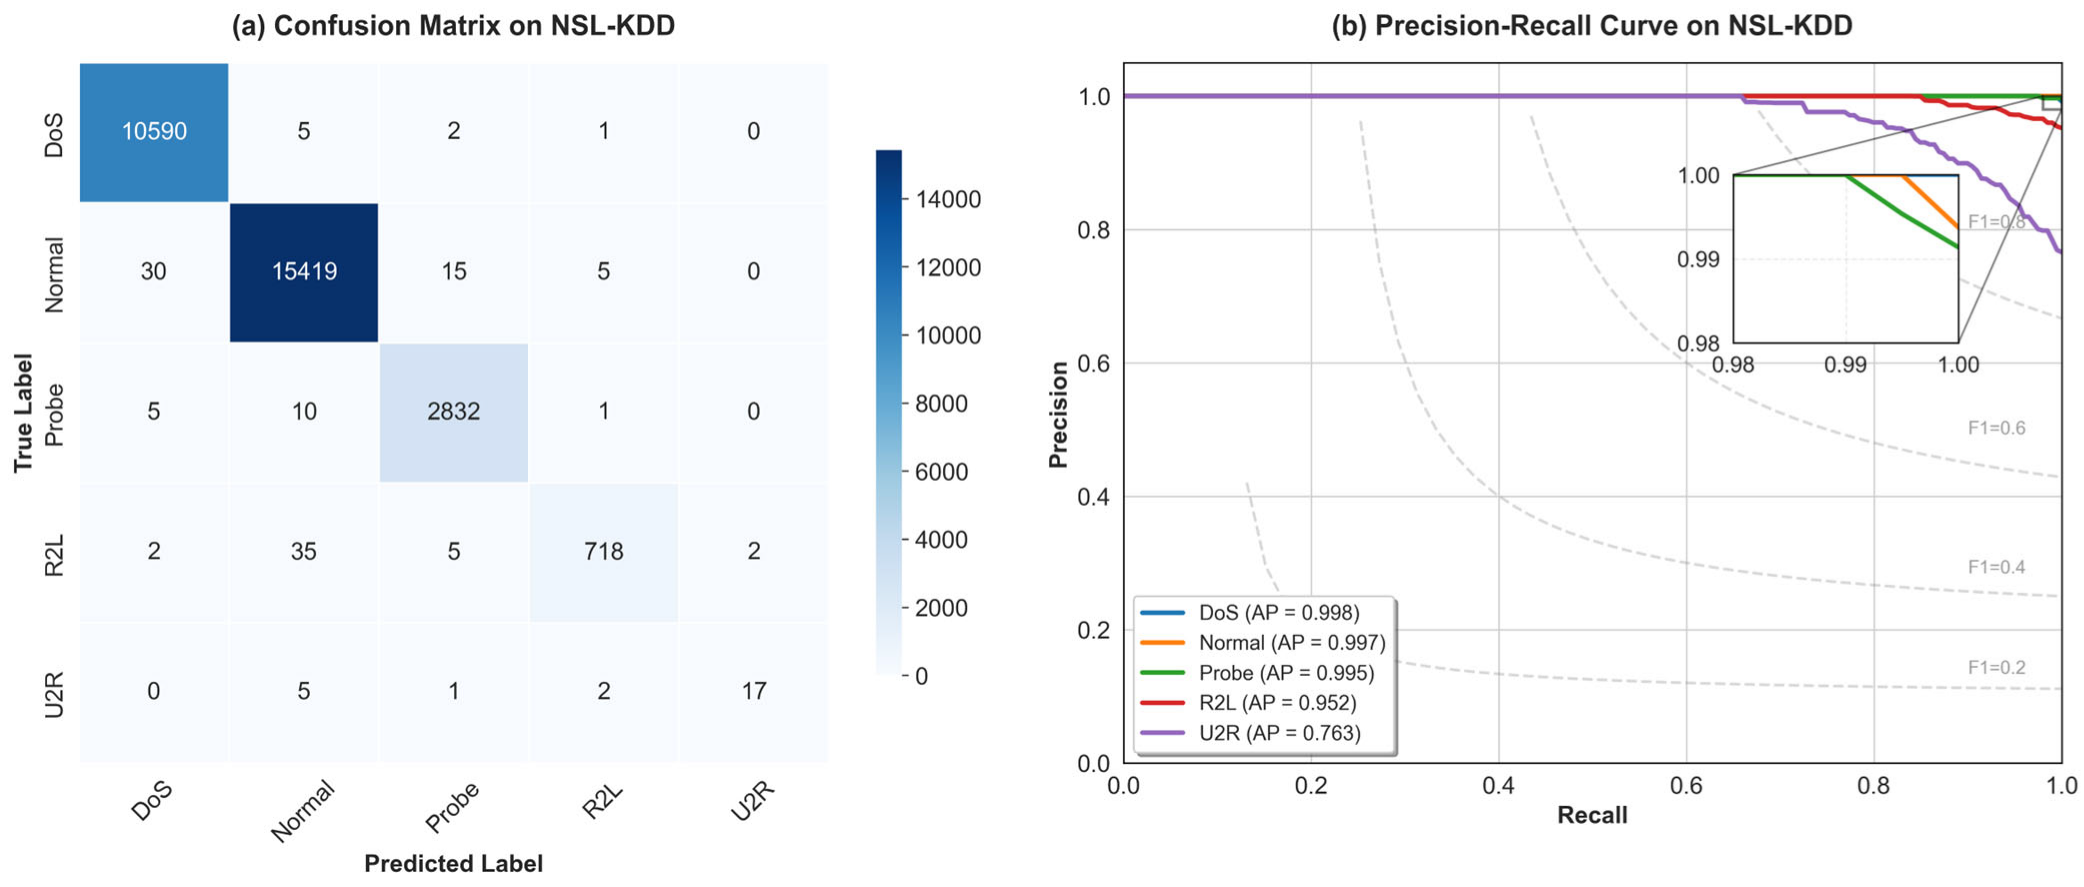
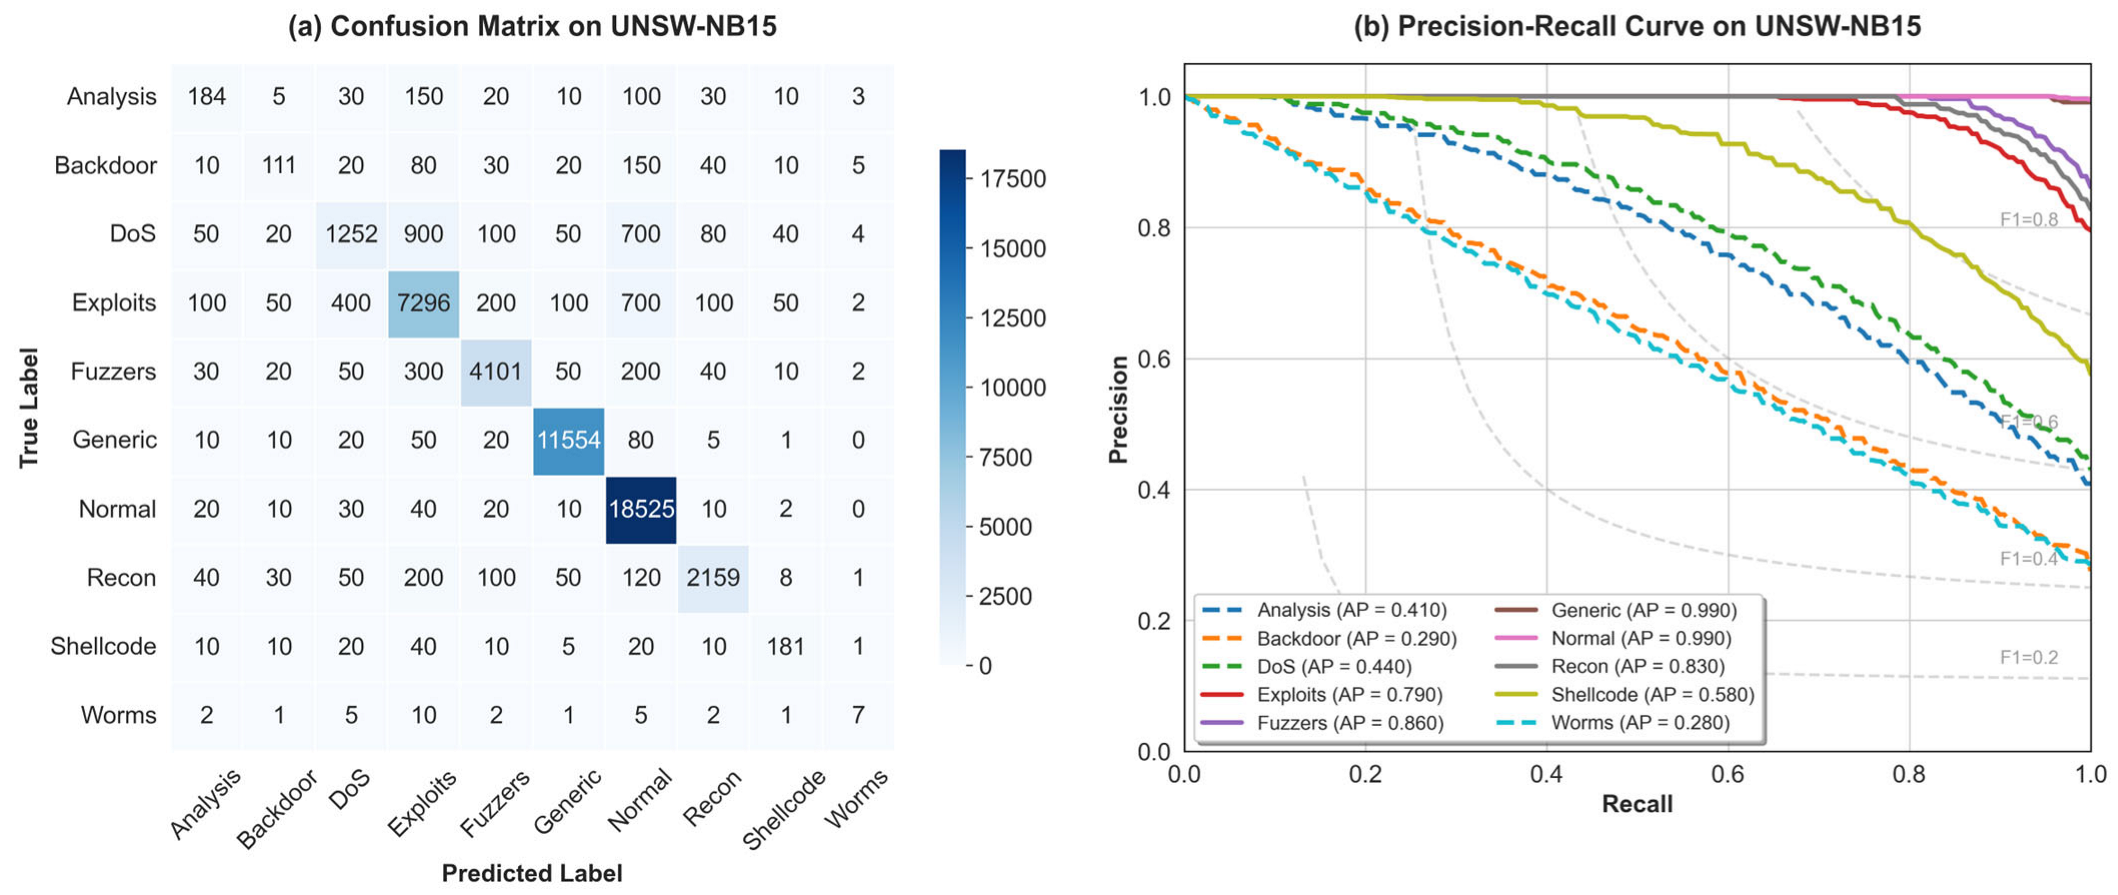
This study combined confusion matrices and Precision-Recall (PR) curves to assess the classification confidence and robustness of the proposed architecture in complex environments. This joint visualization approach, shown in
Figure 5 and
Figure 6, provides an intuitive analysis of the model’s performance on highly imbalanced datasets.
As shown in the confusion matrices in
Figure 5a and
Figure 6a, the dark diagonal line indicates that the model has established clear classification decision boundaries on both benchmark datasets. To avoid biased evaluations in the ROC curve caused by extreme class imbalance, this paper specifically employed the PR curve (
Figure 5b and
Figure 6b) to assess the model’s detection performance on minority classes. The gray dashed lines in the background represent ISO-F1 contour lines. As observed in
Figure 6b, the envelopes for Normal, Generic, and Exploits—which constitute the bulk of the data—closely track the upper-right corner, demonstrating near-perfect Average Precision (AP). Even for minority classes such as Shellcode, the model maintains a robust area within the ISO-F1 contour. This provides strong visual evidence that the proposed Power-Smoothed Soft-Weighted (PSSW) strategy successfully overcomes the dominance of majority classes over the decision boundary.
The systematic experiments in this section fully validate the superior performance of the GLT model in complex network environments. The model achieved overall accuracy rates of 99.57 percent and 88.04 percent on the NSL-KDD and UNSW-NB15 datasets, respectively, demonstrating excellent generalization and robustness. Notably, when addressing Exploits attacks with subtle features, the model achieved a significant breakthrough with an 81.08 percent recall rate. This success is driven by the hybrid architecture’s deep exploration of global dependencies and local temporal patterns. Furthermore, the model maintained over 99.2 percent accuracy in identifying normal traffic, effectively mitigating the risk of false positives in real-world deployments.
4.6. Ablation Study
To quantify the specific contributions of each component and optimization strategy within the GLT model architecture, we conducted a stepwise ablation study on the UNSW-NB15 dataset. The experimental results are documented in
Table 7.
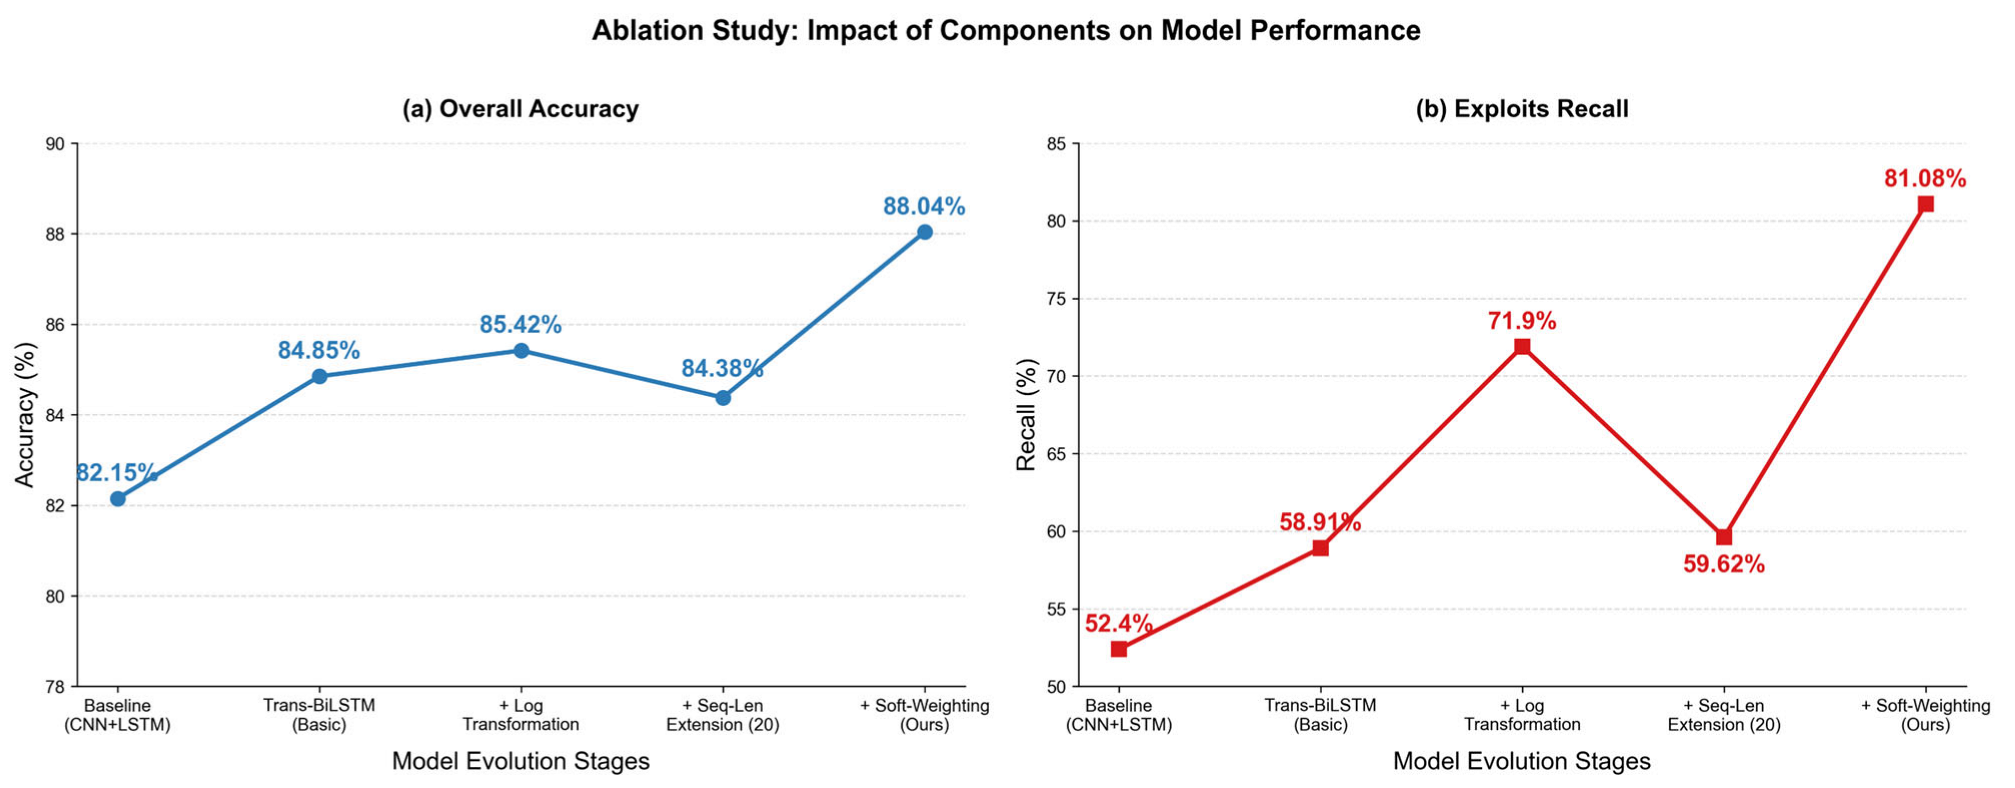
To more intuitively demonstrate the incremental contributions of each module, we plotted the ablation study results as a line chart, as illustrated in
Figure 7. This figure clearly shows that with the introduction of the Log1p transformation and soft weighting strategy, the model not only maintains steady growth in overall accuracy but also achieves a significant performance leap in the hard-to-detect Exploits category.
The introduction of the Transformer Encoder resulted in a 2.7 percent increase in accuracy. This confirms that the self-attention mechanism outperforms traditional convolutional architectures in extracting global traffic dependencies.
After applying the Log1p transformation, the recall rate for Exploits surged from 58.9 percent to 71.9 percent. This validates that logarithmic smoothing on power-law distributed data significantly expands the feature gap between high-traffic and low-traffic patterns, thereby strengthening the model’s discriminative boundaries.
Notably, increasing the sequence length to T = 20 led to a decline in accuracy. This suggests that attack features in the UNSW-NB15 dataset are primarily concentrated within short-term local windows and that excessive sequence lengths introduce irrelevant noise, confirming T = 10 as an optimal choice.
Finally, implementing the soft weighting strategy with raised the overall accuracy to 88.04 percent and the Exploits recall rate beyond 81 percent, demonstrating the strategy’s effectiveness.
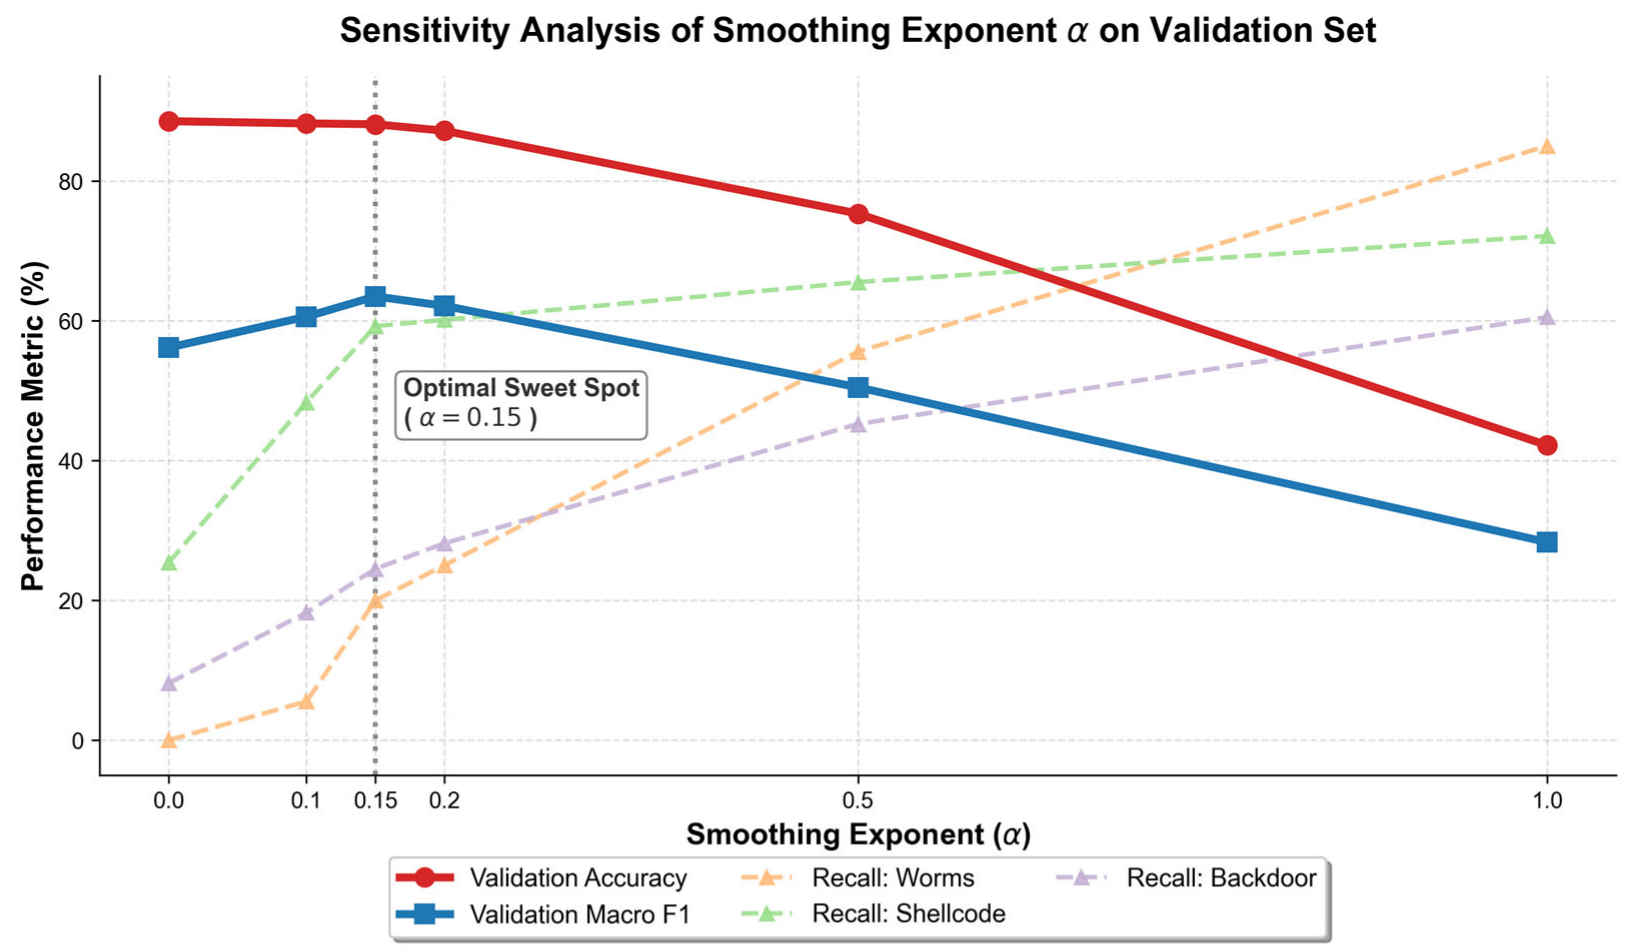
To avoid data leakage and overfitting risks caused by direct parameter tuning on the test set, the selection of the α value in this paper was strictly implemented on an independent validation set. We randomly split 20% of the training data as the validation set and conduct a systematic parameter sweep over the smoothing factor
∈ {0.0, 0.1, 0.15, 0.2, 0.5, 1.0}.
Figure 8 intuitively visualizes the dynamic trade-off between the core global metrics (overall accuracy and macro-average F1-score) and the recall rates of minority classes under different values of
. The line chart of the sensitivity analysis of the smoothing exponent
on the validation set is shown below.
By observing the trend of the polyline in
Figure 8, we can clearly identify a distinct performance trade-off mechanism in the soft weighting strategy.
First, when = 0.00 (which degenerates into unweighted cross-entropy loss), the model achieved a peak validation accuracy of 88.52%. Nevertheless, the recall rates of extremely minority classes were severely suppressed, and the recall rate of Worms even fell to 0%. This confirms that under an extremely long-tailed data distribution, unweighted models are fully dominated by majority classes and fail to defend against rare high-risk threats.
Furthermore, as approached 1.00 (i.e., standard inverse-frequency hard weighting), the recall rates of minority classes such as Worms rose rapidly to 86.71%. However, this came at a steep cost: the validation accuracy dropped sharply to 42.19%. This reveals that excessive weight penalties cause the model to suffer severe overfitting to sparse minority samples, resulting in a large amount of normal background traffic being misclassified as attacks and leading to uncontrollable system false positive rates.
As marked by the vertical dashed line in the figure, = 0.15 precisely corresponds to the Pareto optimal inflection point on the sensitivity curve. At this optimal balance point, the overall validation macro F1-score reached its maximum value of 63.41%, while the validation accuracy remained at a level of 88.08%. More importantly, compared with the case of = 0, this setting effectively activated the faint feature gradients of minority classes, enabling the recall rates of Shellcode and Worms to change from zero to measurable and meaningful values. Based on the objective numerical results derived from the validation set, this study ultimately set = 0.15 as the optimal hyperparameter for test set evaluation and practical deployment.
4.7. Comparative Analysis
To rigorously evaluate the efficacy and advancement of the GLT network intrusion detection model, a horizontal comparison was conducted with contemporary mainstream NID models. The baseline models ranged from classic standalone architectures (CNN [
39], RNN, LSTM, DNN [
40]) to hybrid frameworks (GTO-BSA [
41], RBFNN [
42], ADFF-IDS [
43], XGB-OSNN [
44], SFS-RF [
45], CNN-BiLSTM [
46], IGRF-RFE [
47], IDS-MTran [
7]) and the Transformer [
48]. Notably, the performance assessment extended beyond standard criteria like accuracy and F1-score to include the False Positive Rate (FPR), which is vital for operational efficiency in industrial environments. The experimental findings are documented in
Table 8 and
Table 9.
On the NSL-KDD dataset, most network intrusion detection models can achieve an accuracy of over 96 percent, yet the proposed GLT model outperforms all current baselines. While RNN, LSTM, and DNN architectures demonstrate high recall rates, they suffer from prohibitively high false positive rates (FPR) of 6.63 percent, 7.81 percent, and 40.02 percent, respectively, which is impractical for real-world applications. Compared with the state-of-the-art IDS-MTran method, our model demonstrates uniformly superior performance on all reported metrics for the NSL-KDD dataset. In contrast, the GLT model achieved balanced performance with a comprehensive accuracy, precision, recall, and F1-score of 99.57 percent. Furthermore, it strictly maintained the FPR at a minimal level of 0.32 percent, significantly outperforming other existing models.
The standalone Transformer architecture yielded an accuracy of only 84.1 percent on the dataset. This underperformance stems from the self-attention mechanism’s lack of inductive bias, which hinders the effective representation of local continuous features in relatively static and short sequences. By employing a hybrid Transformer and BiLSTM architecture, our model successfully mitigates this drawback. This outcome substantiates the scientific validity and necessity of synergistic global feature extraction and local temporal analysis in network intrusion detection.
When applied to the UNSW-NB15 dataset, traditional RNNs, LSTMs, and DNNs exhibited significant shortcomings. Although these models achieved near-perfect recall rates, this performance comes at the cost of extremely high false positive rates, with LSTMs and DNNs reaching 40.02% and 3.15%, respectively. Such results indicate that the models tend to misclassify a large amount of normal traffic as attacks, sacrificing precision for high recall. Ultimately, their overall accuracy was restricted to the 77–80% range, which fails to meet the operational demands of practical intrusion detection systems.
Our model achieved an accuracy of 88.04% and an F1-score of 87.91% on the UNSW-NB15 dataset. More importantly, while ensuring a high detection capability for complex attacks, our model strictly controlled the FPR at 0.76%, far outperforming other network intrusion detection models.
While a standalone Transformer attained 87.5 percent accuracy, our hybrid approach yielded a 0.54 percent improvement. This indicates that global self-attention is inadequate for the extreme complexities of modern network traffic. By modeling micro-temporal dynamics, the BiLSTM component provides critical support for identifying highly ambiguous attack vectors, such as Exploits, which often mimic normal traffic behavior.
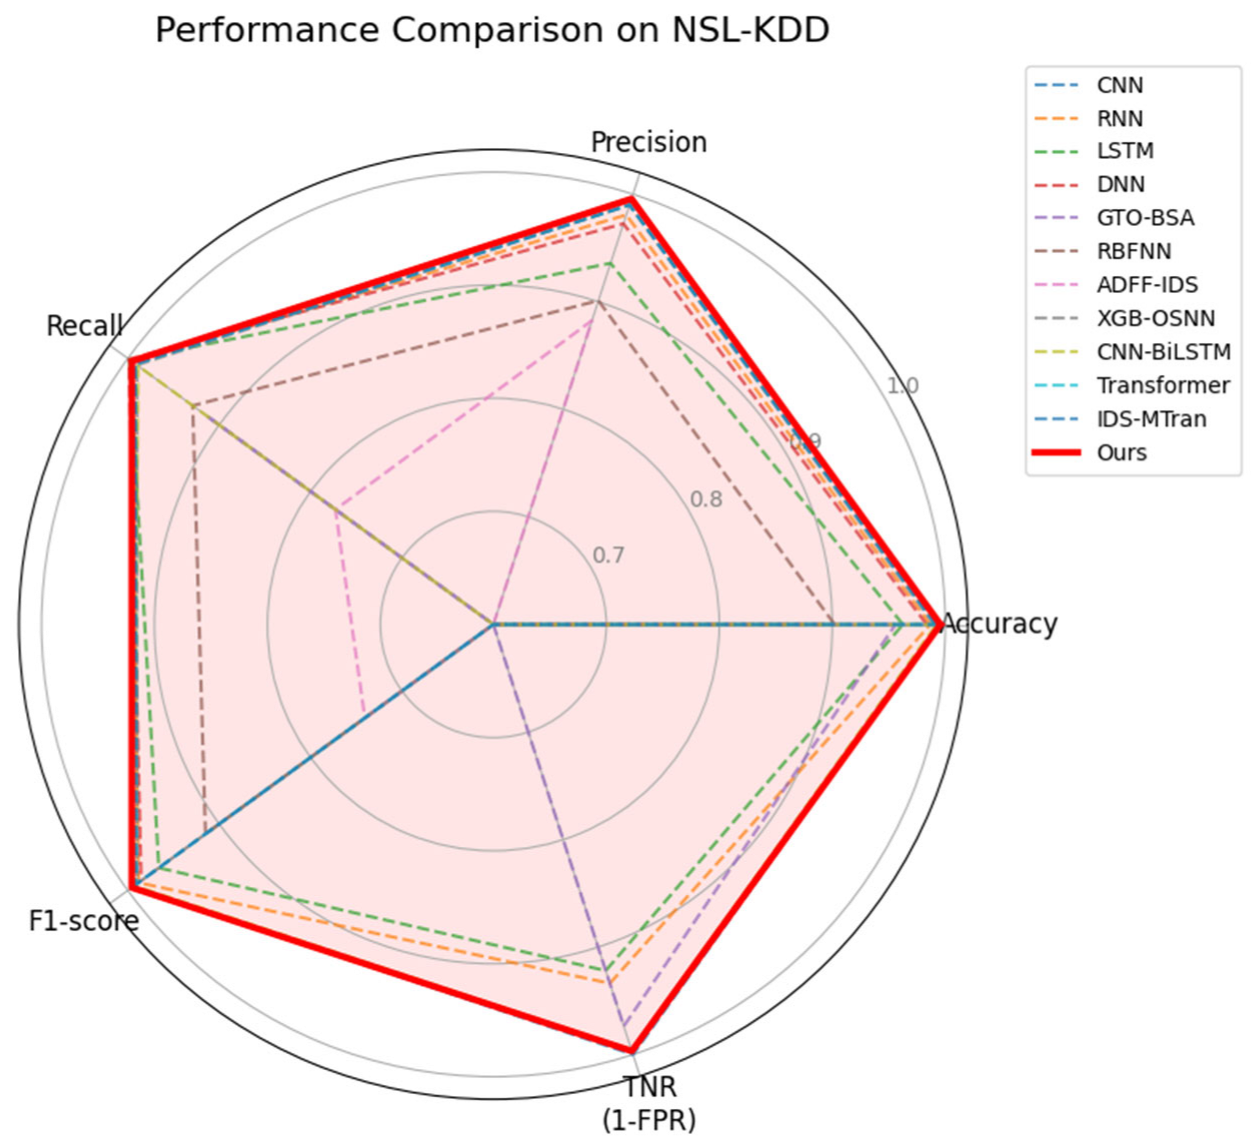
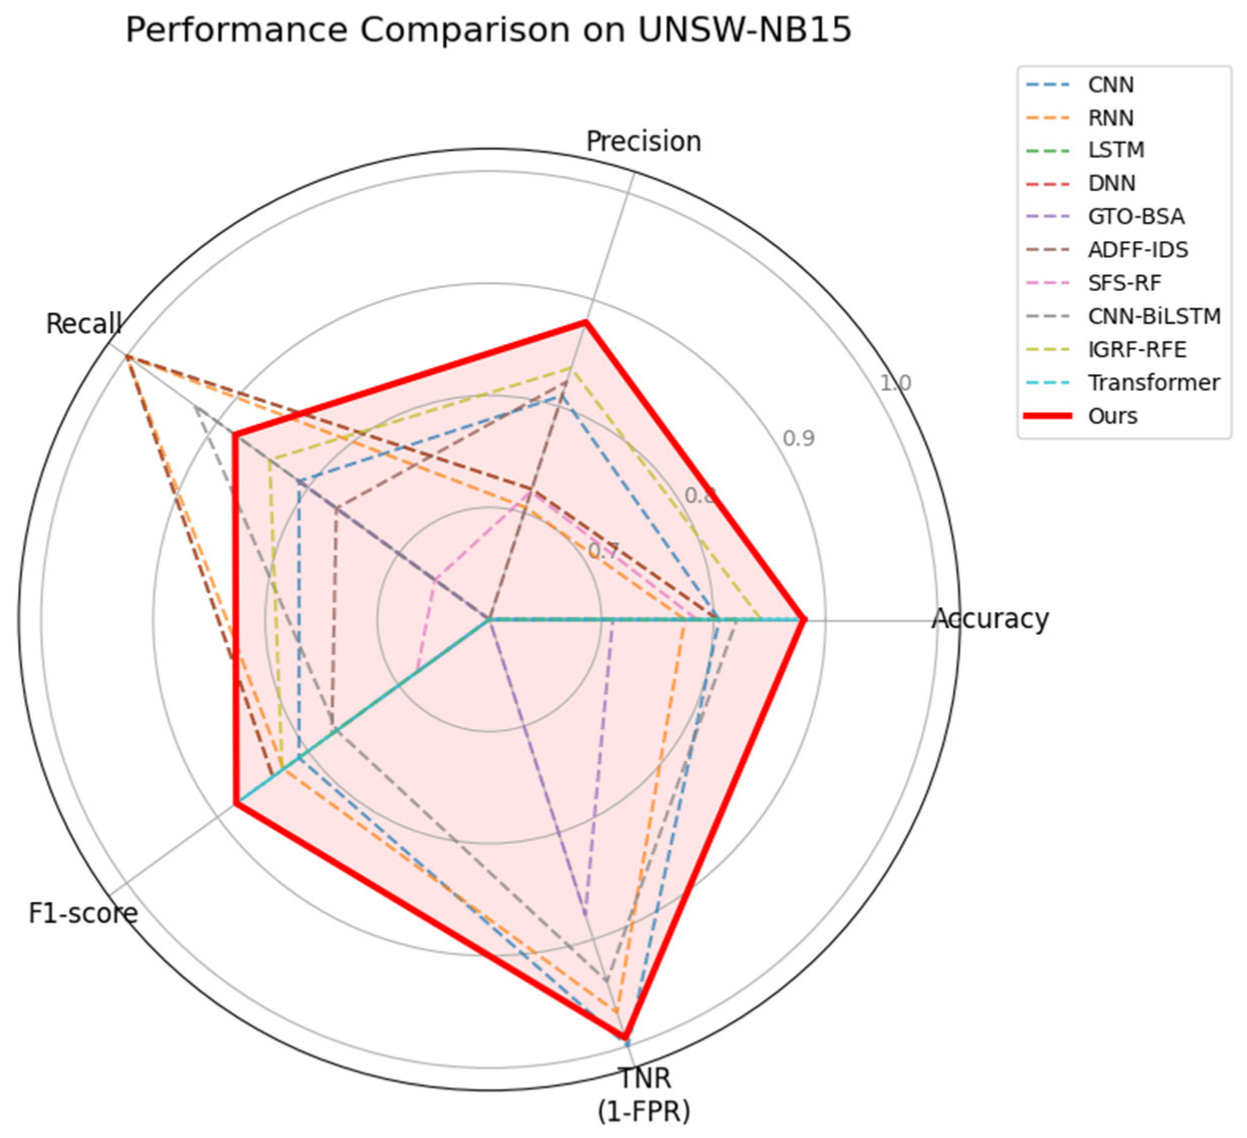
To holistically visualize the model’s comprehensive performance in network intrusion detection, the core experimental metrics are presented as radar charts (see
Figure 9 and
Figure 10). The axes of the polygons encompass Accuracy, Precision, Recall, and F1-score, as well as the True Negative Rate (TNR, calculated as 1-FPR). Values closer to the outer perimeter signify a lower false positive rate. Note: Metrics not reported in the original references for certain models were set to the origin and are excluded from the comparative analysis.
As illustrated in the radar chart for the NSL-KDD dataset (
Figure 9), the proposed GLT model (represented by the solid red line) formed the outermost envelope, nearly covering the entire pentagonal area. This visualization highlights several key findings:
First, the GLT model achieved a nearly perfect balance across all five metrics, forming a symmetric regular polygon. In contrast, traditional models such as RNN, LSTM, and DNN showed a distinct inward pull at the TNR (True Negative Rate) vertex. This indicates that while those models can identify attacks, they suffer from high false positive rates, whereas the GLT model maintained a superior TNR of 99.68 percent.
Second, the gap between the GLT model and the standalone Transformer is still striking. This expansion in the area covered confirms that the self-attention mechanism alone is insufficient for network traffic analysis. By integrating BiLSTM to capture local temporal features, the GLT model successfully compensates for the Transformer’s lack of inductive bias, leading to a significant leap in overall detection proficiency.
Figure 10 presents the performance comparison on the more challenging UNSW-NB15 dataset. Due to the high degree of class imbalance and the complexity of modern attack patterns, all models exhibited a contracted area compared to their performance on NSL-KDD. However, the GLT model remains the clear leader.
A critical observation in
Figure 10 is the model’s resilience to data skewness. While other hybrid architectures like CNN-BiLSTM and IGRF-RFE showed uneven performance—often sacrificing precision or TNR to maintain recall—the GLT model maintained the largest and most stable area. Specifically, the GLT model’s TNR remained significantly closer to the outer boundary than its competitors, proving that the Power-Smoothed Soft-Weighted (PSSW) strategy effectively prevents the model from being overwhelmed by majority-class traffic.
Synthesizing the results from both datasets, it is clear that standalone models often fail to balance overall accuracy with the risk of high false positives. Our proposed GLT model successfully bridges this gap, delivering state-of-the-art accuracy alongside a significantly lower false positive rate. This performance is a major advantage for industrial systems that require reliable detection with low alert rates.
While high detection accuracy is crucial for intrusion detection systems, low computational complexity and real-time inference capability are equally important for practical industrial deployment. Therefore, we further analyzed the computational overhead of all compared models, as summarized in
Table 10, all data presented in
Table 10 are obtained from our re-implementation experiments conducted under our unified experimental configuration.
As observed in
Table 10, traditional lightweight single-branch models (e.g., CNN and DNN) achieved extremely low parameter counts (approximately 0.8–1.2 M) and ultra-fast inference speeds (~0.005 ms/sample), but at the cost of significantly weaker feature extraction capabilities and unsatisfactory false positive rate performance.
In contrast, our proposed Trans-BiLSTM architecture, as a deep hybrid model, exhibited a slightly higher parameter count (3.44 M) and training time (25.6 s/epoch on the UNSW-NB15 dataset) compared to standalone Transformer or CNN-BiLSTM models. This marginal increase in computational overhead is an inherent theoretical trade-off introduced by the global-local joint modeling mechanism and the soft weighting module. Nevertheless, from a practical deployment perspective, benefiting from the optimization of GPU parallel computing, the single-sample inference latency of our model was strictly controlled at an ultra-fast level of 0.018 ms/sample, which is equivalent to processing over 55,000 network flows per second.
This quantitative comparison strongly demonstrates that our model achieves substantial improvements in overall accuracy and recall rate for complex attacks (e.g., Exploits) at the expense of only a minimal latency increase of approximately 0.002–0.005 ms/sample, realizing an excellent cost-accuracy trade-off.