1. Introduction
To achieve carbon neutrality, the energy network is accelerating its transition from fossil fuels to renewable sources with lower carbon emissions [
1]. As renewable energy production continues to surge, a significant portion of renewable energy systems are gradually surfacing, requiring major changes in their planning, design, distribution, and operations to handle the complex and unpredictable characteristics of this emerging system [
2]. Despite this, wind and solar energy generation depend greatly on natural resources and climatic conditions, resulting in significant instability and unpredictability. Under extreme weather conditions, the generation of new energy may consistently stay low, resulting in energy shortages and thrusting the system into severe operational conditions where the overall load surpasses its maximum modifiable capacity. Such conditions pose considerable threats to the steadiness of the electrical grid and the generation of socioeconomic products [
3]. In extreme operational scenarios, the primary indicator of a supply-demand imbalance is the risk of a power shortfall caused by the system’s insufficient capacity, leading to both a power shortage and its duration.
Recently, a variety of accidents in both national and global power systems have underscored the increased likelihood of severe operational scenarios in systems heavily reliant on renewable energy sources. In February 2021, a power failure in Texas, USA, resulted in a notable disparity between supply and demand, leading to an estimated 20,000 MW of load shedding [
4,
5]. During the peak of winter 2020, Hunan Province was grappling with a power deficit of 3–4 million kW owing to extreme cold, prompting the launch of an emergency response initiative [
6]. The probability and potential results of severe operational scenarios in high-proportion renewable energy systems compared to traditional power systems [
7]. Therefore, evaluating the probability and severity of critical operational scenarios within the system has become essential for preserving its safety and steadiness.
Focusing on critical operational scenarios, comprehensive research has been conducted to identify situations, assess risks, and improve scheduling. In light of meteorological elements and the limited availability of renewable energy sources, there has been a thorough examination of the consistency and longevity of extreme wind and solar energy trends. For instance, Ohlendorf and Schill [
8] quantified the frequency and duration of reduced wind energy events in Germany over twenty years, while Ho-Tran and Fiedler [
9] conducted a weather study on the atypical solar and wind power production in Europe, revealing a significant correlation between severe weather conditions, the installed capacity, and unique weather patterns. Regarding the impact on demand and the entire system, Gao and his team [
10] evaluated the load variations due to extreme high-temperature scenarios, and in collaboration with Jiang and his team [
11] developed a method to assess the monthly discrepancies between supply and demand, treating prolonged durations of reduced renewable energy generation as a critical climatic situation. Additionally, data analysis techniques, such as the multi-energy model by Wu and Xu [
12], are widely applied in forecasting demand. The emergence of flexible resources such as Power-to-X technologies and environmentally friendly hydrogen systems has attracted increased attention because of their capacity to enhance system flexibility and lessen the imbalance between supply and demand caused by variations in renewable energy generation [
13,
14]. To sum up, these literary pieces lay a solid foundation for diminishing grid unpredictability and enhancing operational decisions.
In contrast, various methods for assessing risks in critical operational scenarios have been developed [
15]. Concerning the evaluation of operational hazards in grid systems, Ma and his team [
16] introduced an improved version of the Monte Carlo mixed sampling technique for state sampling, as observed by Liang and his team [
17], and proposed a technique for evaluating power flow in a probabilistic manner, merging these predictions with the stochastic response surface method. Ma and others. Strive for a more precise depiction of major uncertainties [
18] integrated measures of economic risk, especially VaR and CVaR [
19], into power system analysis models. By employing advanced measurement indicators, subsequent studies [
20,
21,
22] created optimal scheduling systems with minimal risk, tailored for high-capacity renewable energy setups. To sum up, these academic studies provide a crucial methodological foundation for identifying the operational hazards of power grids in the face of significant uncertainties.
However, present research is hindered by these limitations: Presently, probing extreme scenarios mainly relies on new energy generation or climatic limits for identification, complicating the identification of risk differences in these cases from a supply-demand equilibrium perspective; most risk evaluation methods depend on a single metric or a set boundary, overlooking a tiered depiction of the severity of critical power shortage risks, and supporting diverse coping strategies is troublesome. (3) Employing the extreme risk response strategy often leads to excessive resource investment when adjusting resources according to the most severe circumstances, causing economic instability in the system. As a result, there is an urgent need for a risk assessment system that takes into account both safety and economic factors.
The document proposes an extensive risk assessment framework for critical operational scenarios in high-renewable energy systems to bridge these gaps. The following section elaborates on the distinct scientific progressions and their evident advantages over existing literature:
Mechanical-based scenario recognition: This method differs from conventional threshold-based identification by using a dynamic ‘source-load’ discrepancy process to evaluate the equilibrium between supply and demand. The main advantage is in averting erroneous notifications when a link is found between reduced renewable energy output and low demand.
Implementable engineering risk hierarchy: The research surpasses traditional or theoretical risk boundaries by uniquely aligning the ALARP standard with standard grid accident classifications. This process efficiently transforms qualitative risk evaluations into actionable, separate areas for making operational choices.
The focus of tail quantification was on the results: Contrary to tracking upstream input uncertainties or expected losses, this technique employs the CVaR index directly to tackle downstream power deficits. The primary advantage is found in segregating and isolating the pronounced non-linear tail-amplification traits of significant grid inequalities.
In conclusion, a comprehensive analysis of numerous renewable energy systems is performed to evaluate the efficacy of the proposed method in reducing risks linked to severe operational conditions, taking into account the safety and efficiency of these systems.
2. The Characteristics of Power Supply and Demand Imbalance Under Extreme Operating Scenarios
The substantial reliance on renewable energy sources has resulted in a marked increase in the unpredictability of generating wind and solar power. In severe climatic scenarios, the system may experience a drastic reduction or total halt in energy generation within a specific timeframe, posing challenges for its modifiable power supply, storage, and transmission abilities to compensate for this shortfall. This leads to a critical phase of operation in which the deficit in power invariably surpasses the maximum capacity of the modifiable capacity.
Current research frequently examines severe operational situations, focusing on novel energy production limits or weather conditions [
23]. Even though the criteria remain constant, the unpredictable nature of new energy production suggests that various extreme operational situations will exhibit distinct evolutionary traits, stemming from the differences in new energy integration and system configuration, leading to significant fluctuations in their likelihood, length, and the extent of supply-demand difference [
24,
25]. Consequently, maintaining a balance between energy supply and usage necessitates the systematic recognition of supply and demand imbalances and the creation of distribution procedures for critical operational situations in extensive renewable energy systems, setting the groundwork for future risk categorization and response approaches.
2.1. The Randomness of Source-Load and Its Supply Demand Imbalance Mechanism
When considering the equilibrium between power supply and demand, a critical operational scenario emerges in which the system cannot rely on changeable resources, energy storage, and delivery functions to meet load needs within a set period, owing to the unpredictability of new energy sources and the predominance of wind and light in the power supply, resulting in the system’s total load exceeding its maximum modifiable capacity.
During critical operational scenarios, the main source of the power supply-demand imbalance is the mismatches found on both sides of the source-load [
26]. In traditional power systems, a crucial correlation exists between power production and its usage on the load side. With the increasing prevalence of renewable energy, there is a transformation in the energy structure, resulting in a consistent increase in the probability of generating power from its source to the load side. The main reason for the imbalance between power supply and demand arises from weather factors such as high temperatures, lack of wind, and notably low temperatures, whether directly or indirectly [
27]. Meteorological factors will affect both the operation of renewable energy sources and the generation of new energy from these sources, with the load adjusting in tandem with these meteorological elements [
28]. As a result, the characteristics of severe operational scenarios are closely connected to the attributes of both facets of the ‘source-load’.
Compared with the new energy output, the load still shows regular changes. The increase in summer temperature and the decrease in winter temperature will lead to an increase in load, showing different correlations in different periods of the year.
where
represents the load changes with the temperature;
represents the temperature at time
;
and
represent the average temperature in summer and the average temperature in winter;
and
represent the conversion coefficient between temperature and load in summer and winter;
represents the correction coefficient between the load and the temperature;
and
represent the time period when the load increases with the temperature in summer and winter.
Statistical analysis of the source-load bilateral data was conducted using randomly chosen yearly samples.
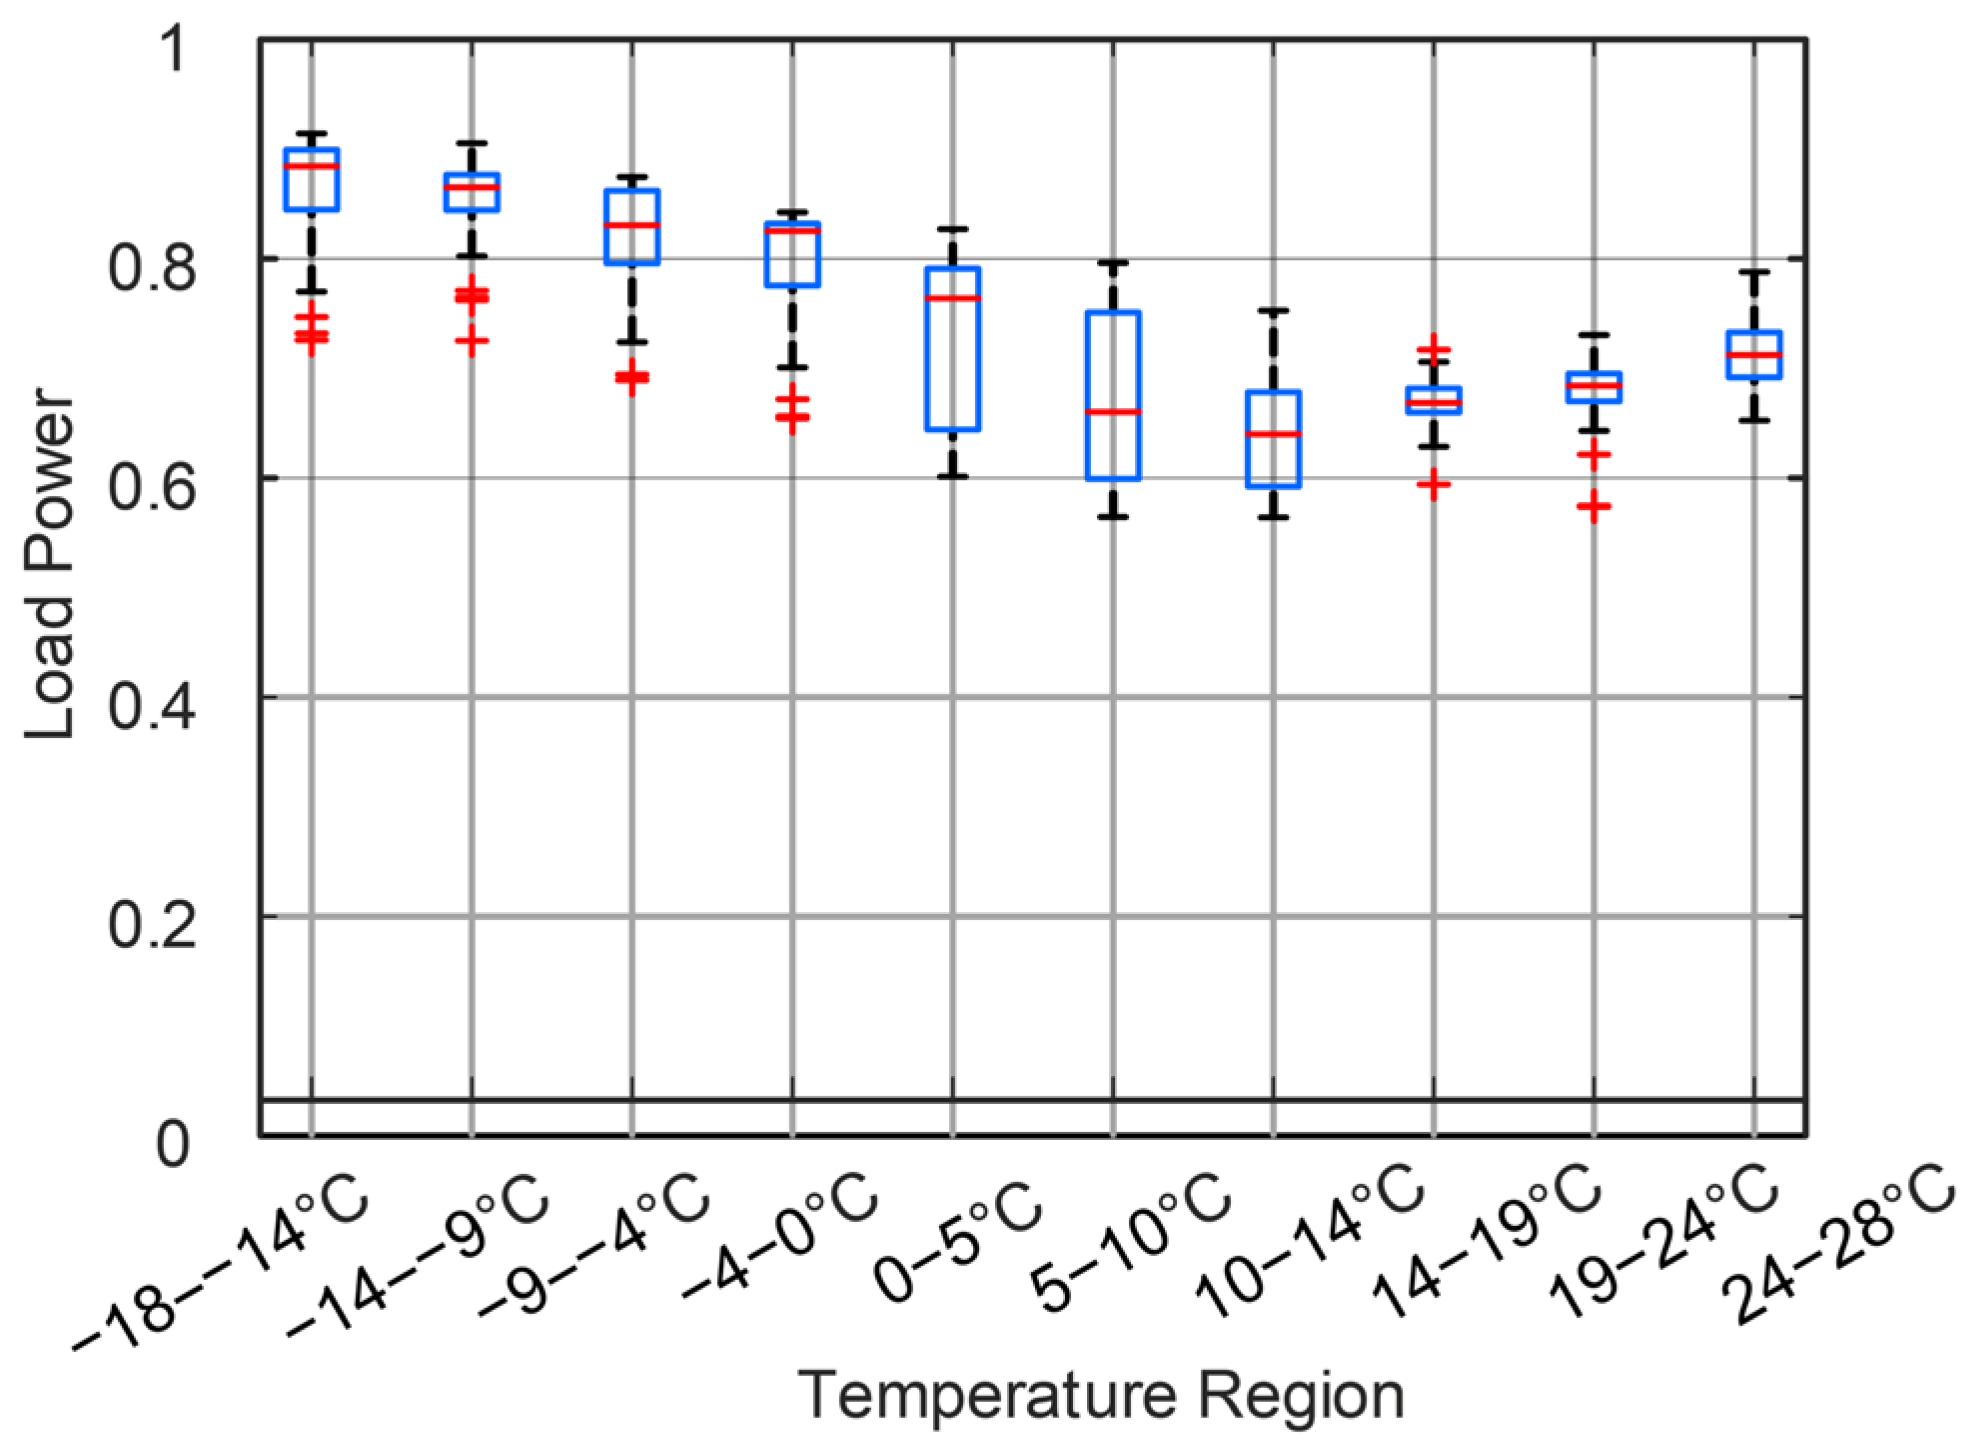
Figure 1 illustrates the pattern of load variation in relation to temperature. In contrast to the line chart, the box chart excels in illustrating the evolving patterns of numerous values over extended periods, offering a clearer depiction of data concentration intervals. The diagram illustrates that the load per unit can be kept fairly constant within the 14–24 °C range at ambient temperature, and the power generation side’s load is unlikely to oscillate abruptly.
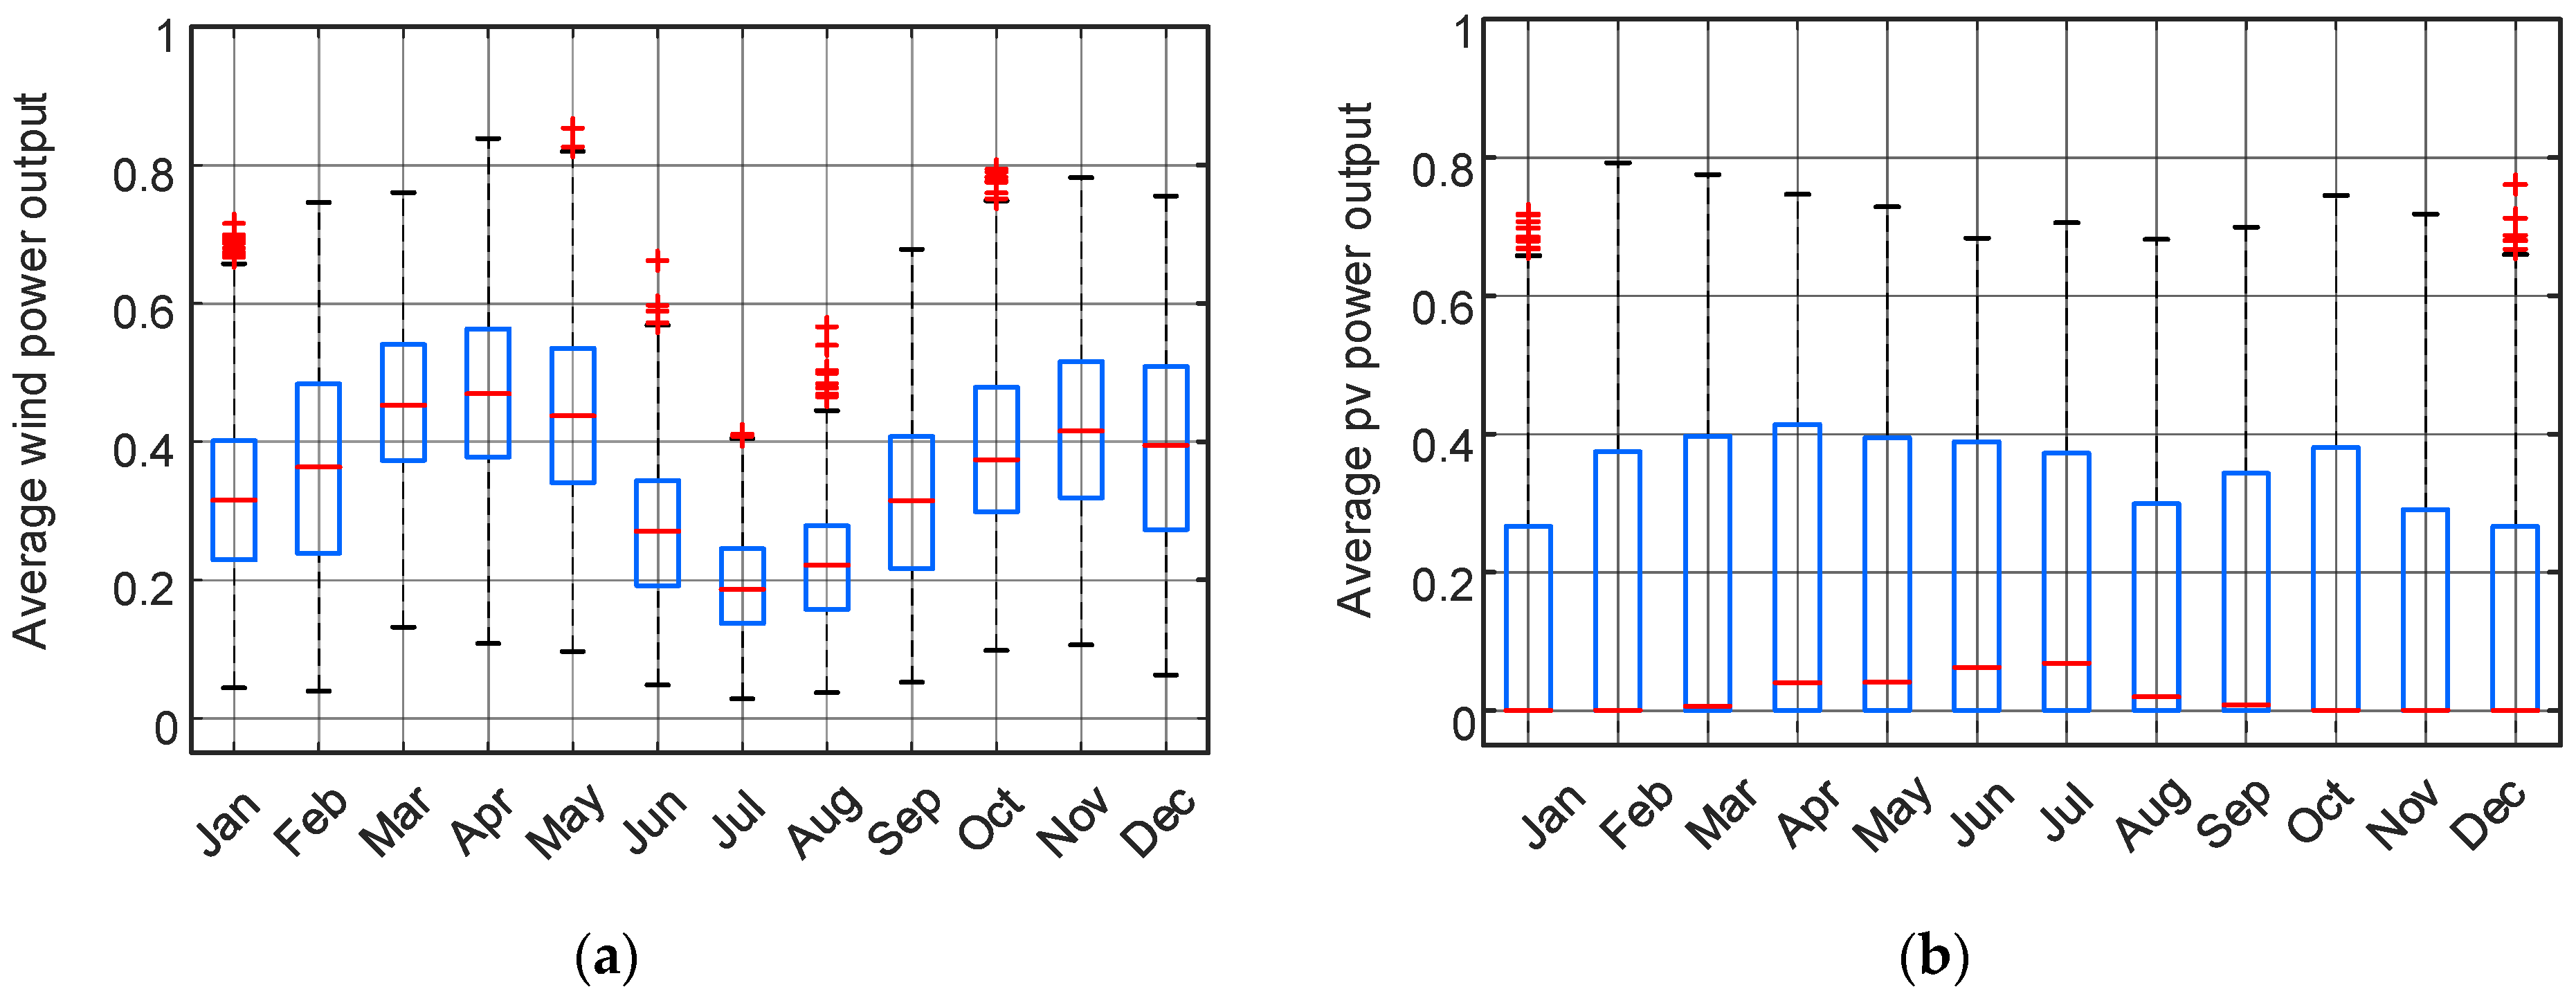
The production of novel energy sources significantly contributes to the unpredictability in managing power systems heavily reliant on renewable energy. Viewed over time, various forms of new energy production exhibit specific characteristics at different stages annually. Wind energy and photovoltaic, as new energy sources, are influenced by weather patterns, circadian rhythms, and seasonal variations, exhibiting diverse levels of output across various time frames. As depicted in
Figure 2.
Additional statistical analysis is conducted on the minimal output level, based on the time series data pertaining to new energy production.
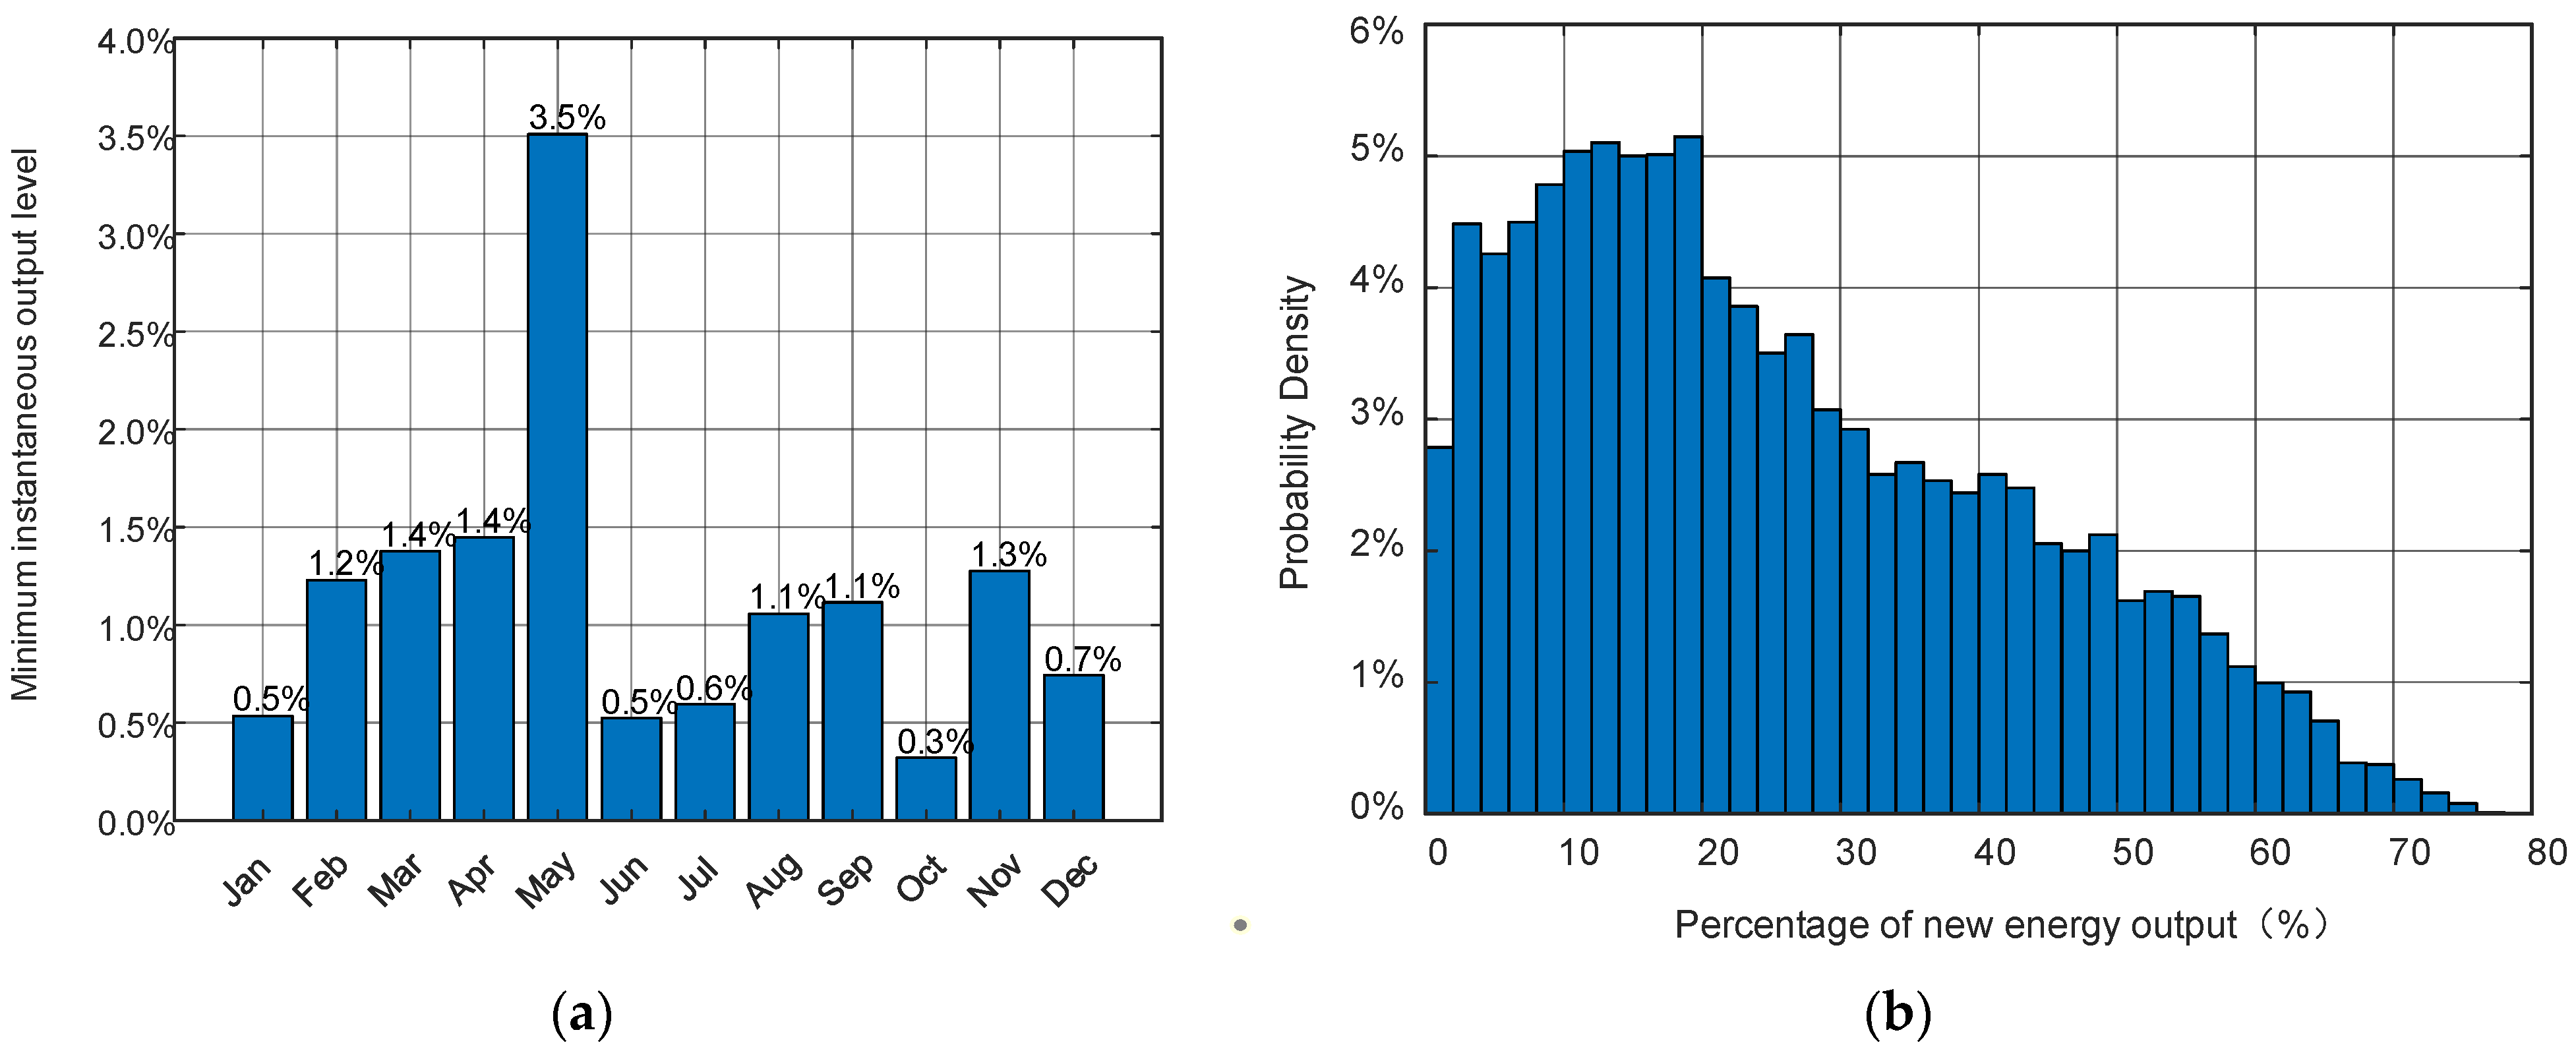
Figure 3 signifies the minimal immediate output level and the spread of time ratios across different output intervals. Studies indicate significant yearly fluctuations in the new energy production. When considering the minimal immediate output level, it represents just 0.5% of the total rated output, markedly less than the rated level.
Simultaneously, the average generation of new energy is less than 2% of the total rated output, accounting for 2.78% of the annual duration. On average, the production of new energy constitutes less than 4% of the overall rated output, accounting for 7.26% of the year’s total. Research suggests that in difficult situations, the innovative energy apparatus may show a noticeable decrease in its output, possibly not meeting the supply and demand needs of the load side.
Analytical data verify that the equilibrium between supply and demand is influenced by simultaneous variations in renewable energy production and the demand for load. Merely relying on isolated generation limits to identify extreme cases is inadequate; for example, significant reductions in renewable energy production do not jeopardize grid stability during times of low demand. Consequently, to depict extreme operational situations, a comprehensive assessment of the combined ‘source–load’ time mismatch process is essential, as opposed to depending solely on one-sided indicators.
2.2. Timing Distribution Characteristics of Extreme Operation Scenarios
Both new energy output and load demand show significant time-dependent stochastic characteristics. Under the combined effect of random fluctuations at both ends of the ‘source-load‘, the imbalance between power supply and demand is often no longer manifested as an instantaneous event at an isolated moment, but may occur. Continuous power shortage process or large-scale power gap, which in turn evolves into extreme operating scenarios in the system. This characteristic determines that the extreme operation scenario has obvious non-independence in the time dimension, and its severity is not determined by a single moment, but gradually appears within a certain time range.
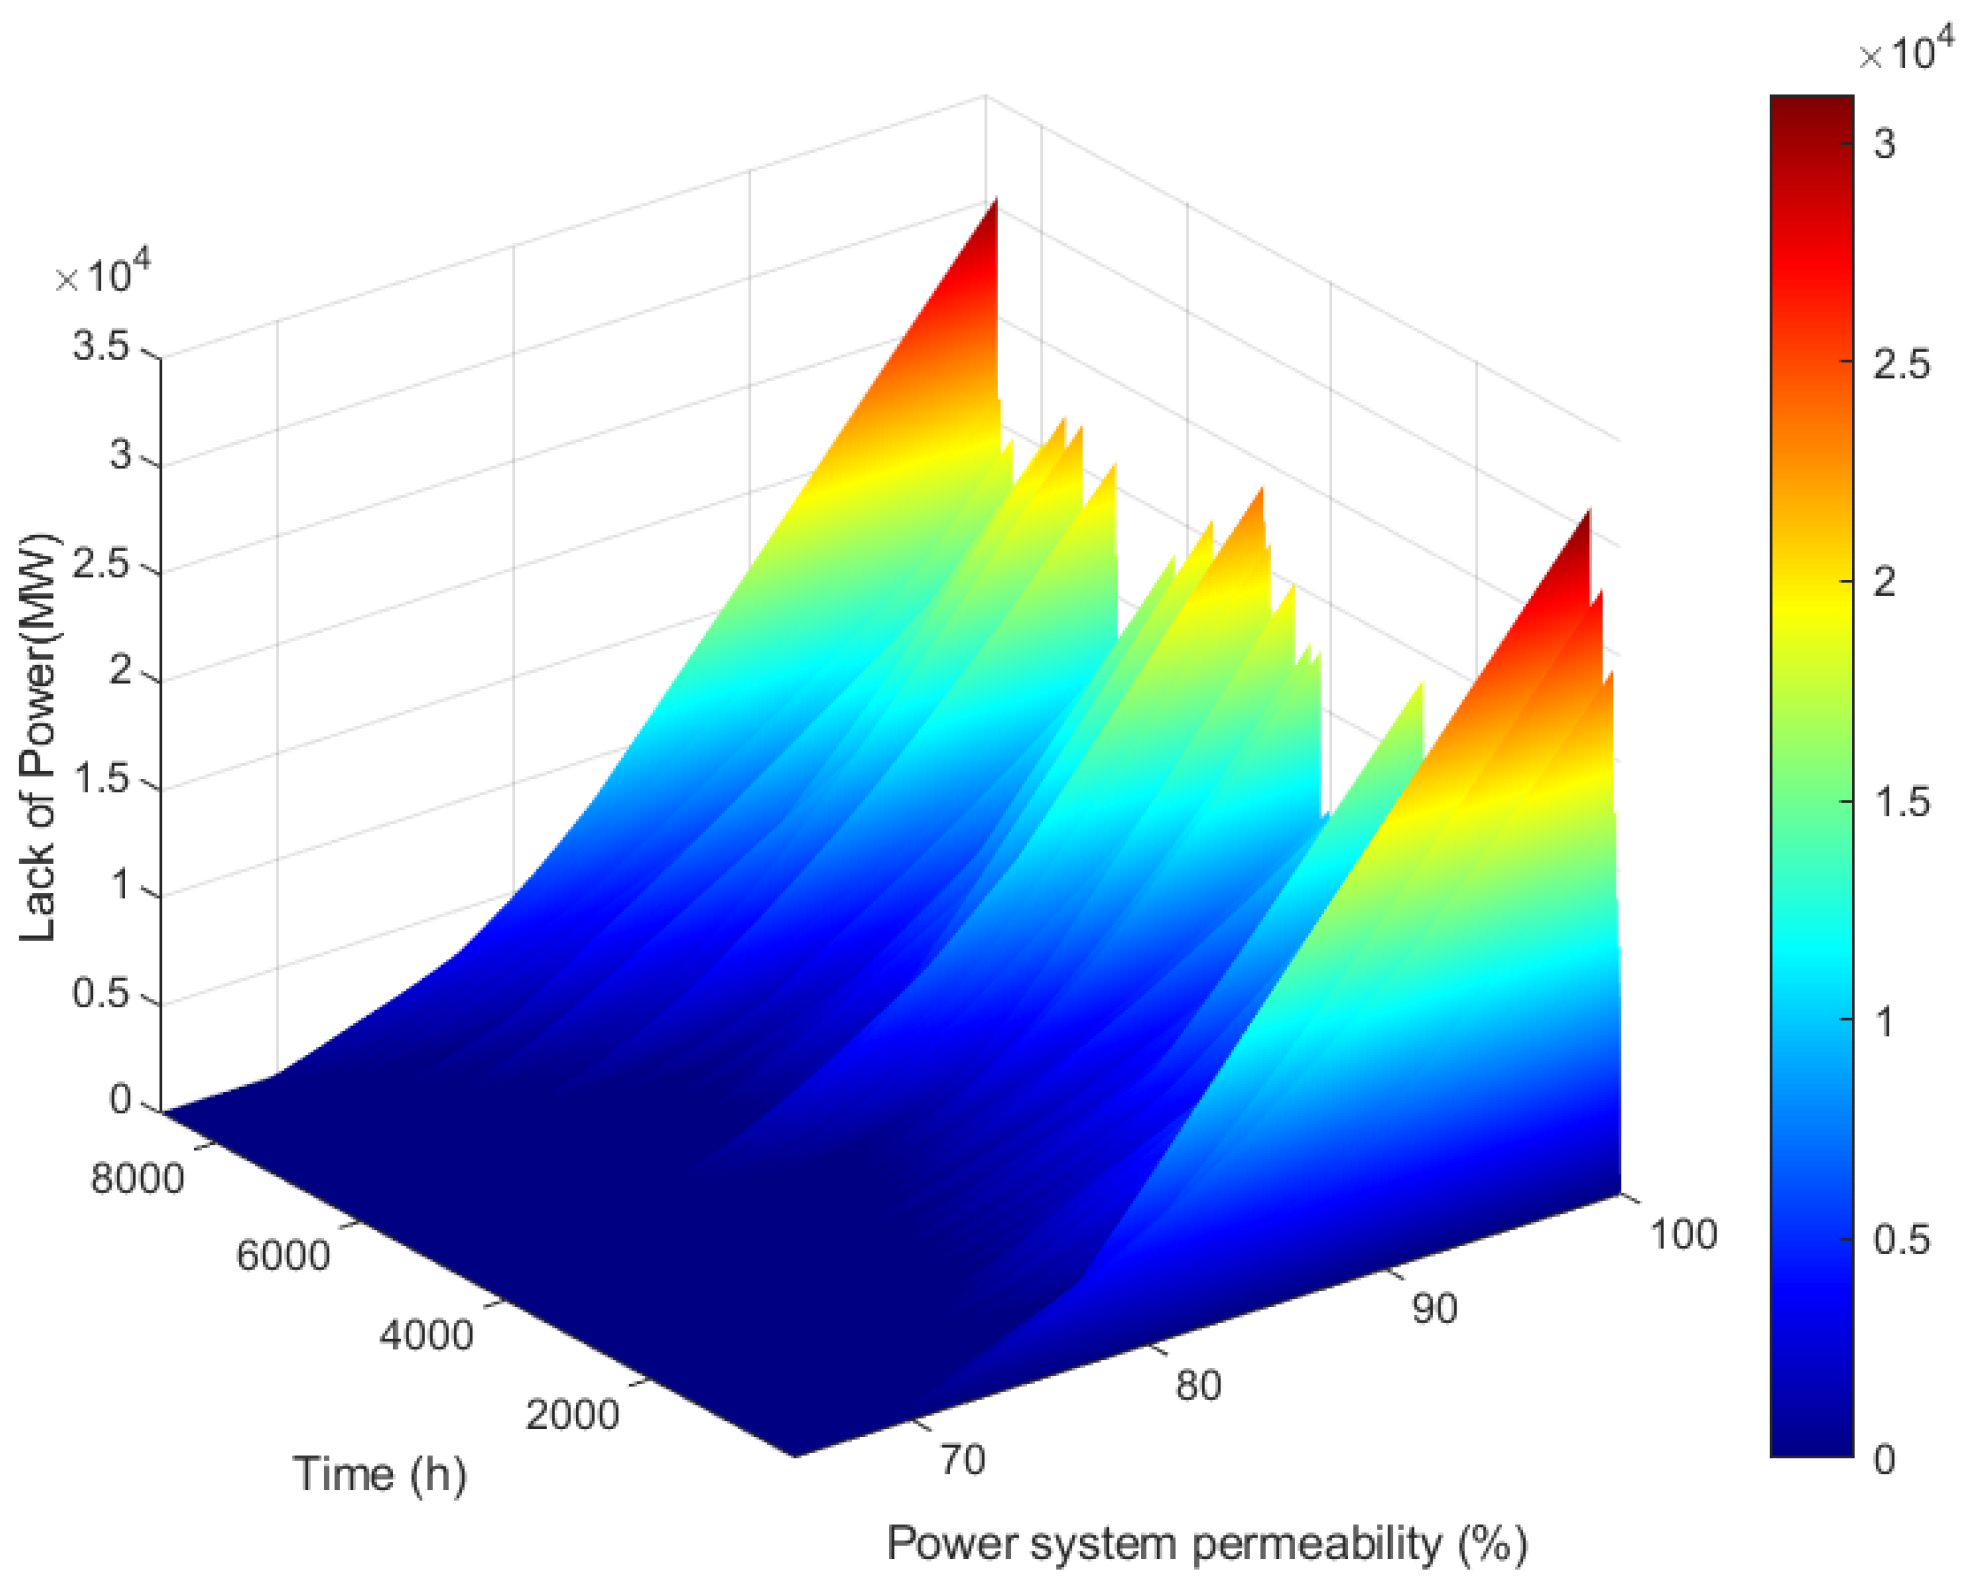
The seasonal variation trend of power shortage shown in
Figure 4 shows that under the condition of a high proportion of renewable energy penetration, the distribution of supply and demand imbalance in the system has significant non-uniformity on the time scale of the year, and there are obvious differences in supply and demand balance pressure in different periods. This time distribution characteristic makes it easier to superimpose the low output of new energy and the concentration of load demand in the time dimension in a specific stage, thus amplifying the risk of supply and demand imbalance in the system.
Both the generation of new energy and the load demands display significant stochastic characteristics that fluctuate over time. If the system is affected by unpredictable changes at both ends of the ‘source-load’, the gap between power supply and demand usually does not manifest as an isolated, instant event, but may occur. Continuous occurrences of power shortages or widespread power scarcities result in critical operational scenarios in the system. This characteristic indicates that under severe operational conditions, a distinct absence of time autonomy is evident, with its intensity not limited to a single occurrence but gradually developing over a certain period.
Figure 4 depicts the recurring trend of power shortage, showing that a significant surge in renewable energy leads to a significant fluctuation in the system’s supply-demand equilibrium throughout the year, with evident differences in the balance of supply and demand over different periods. The feature of temporal distribution eases the process of superimposing the least amount of new energy production onto the concentrated load demand in a specific phase, thus heightening the chances of a supply-demand imbalance in the system.
2.3. Tail Risk Characteristics of Extreme Operating Scenarios
Apart from the time-linked characteristics of severe operational scenarios, the probability of a disparity between supply and demand at the time of happening shows a tail risk characteristic that is statistically significantly different from the usual operational condition. The term ‘tail risk’ refers to the sudden rise and intensification of the imbalance between the system’s supply and demand, particularly in severe operational scenarios, which greatly affects the system’s results.
In actual power system operations, averting complete power failures and desertions presents difficulties owing to regulatory capacity constraints, although its impact is usually minor and controllable. On the other hand, despite the low probability of severe operational circumstances and a unique distribution, in these cases, there will be an abrupt increase in the system’s imbalance between supply and demand, distinctly straying from the normal operational range.
As depicted in
Figure 4, the increasing dominance of renewable energy leads to a significant escalation in the system’s energy shortfall, rendering the equilibrium between supply and demand more vulnerable to disturbances on both sides of the source load. During most of its operational stage, the system maintains a steady equilibrium between supply and demand, maintaining a power shortfall that is almost negligible. The convergence of adverse elements, such as diminished production of new energy or high demand for dense loads, interrupts the equilibrium between supply and demand, causing a sudden surge instead of a straightforward linear shift in the intensity of disturbances, culminating in a risk distribution marked by a lack of expansion and tail amplification in the higher quantile range.
Observing from a stochastic process perspective, the balance of supply and demand in a renewable energy system with a high ratio can be viewed as a series of random factors affected by ‘source-load’ fluctuations, where the most severe operational conditions correspond to a minimal likelihood of the imbalance between supply and demand in the distribution’s tail area. The previously mentioned explanation, based on random probability characteristics, provides a crucial theoretical basis for creating risk evaluation methods to address supply and demand disparities in severe operational scenarios.
3. Risk Assessment Method of Supply and Demand Imbalance
A methodology has been established to gradually evaluate the likelihood of an imbalance between power supply and demand in severe operational conditions, with an emphasis on the timing and tail risk elements of these situations. The ALARP standard was initially introduced, centering on the severity of risk results, to classify the probability of power supply and demand imbalance in extreme operational scenarios. As a result, the launch of the CVaR index seeks to numerically evaluate the expected effects of imbalances between supply and demand in critical operational circumstances, thus improving the risk evaluation of these situations from qualitative to quantitative.
3.1. Construction of Extreme Operation Scenario Model
Aiming at the randomness of extreme operation scenarios caused by the uncertainty of new energy output, it is necessary to construct an extreme operation scenario model with time series curves on both sides of the source-load.
Taking the unbalanced power curve obtained by the load minus the output of the new energy forced power supply as the net load curve, the power supply and demand balance constraint model of the power system is obtained:
where
represents the net load power at time
;
represents the system load;
and
represent the wind power and the photovoltaic power;
represent the renewable energy output.
In a high proportion of renewable energy power systems, the new energy output of the system is driven by meteorological conditions, which is characterized by a random process with obvious seasonal and time series correlation. Based on the initial net load curve, other adjustable units are added to calculate the power supply and demand balance time series curve of the power system.
where
represents the time series curve of power shortage;
represents the hydropower power required to meet load requirements;
and
represent the upper limit of hydropower power and the actual hydropower power;
represents the actual thermal power;
represents the storage power;
represents the conventional adjustable power supply power;
represent the system supply and demand balance timing curve.
The conventional adjustable power supply is subject to multiple constraints, such as unit capacity, ramp rate, and energy constraints, and its adjustable capacity has a clear upper bound. At any time, the power system satisfies the instantaneous power balance constraint:
The system load and new energy output are regarded as random processes defined in the probability space
, and the random net load of the system is defined as:
where
represents the uncertain sample path.
The maximum adjustable capacity of the system at time t and the feasible region of the power system supply and demand balance can be expressed as follows:
where
represents the upper limit of the available output of the class
tunable resource at time
.
When the random net load falls into the feasible region, the system can maintain the balance of supply and demand at both ends of the source-load through conventional adjustment means. When it exceeds the feasible region, it means that the system enters a state of imbalance between supply and demand.
In summary, the set of extreme running scenario events is defined as:
The corresponding random extended net load, that is, the power shortage random variable in the power system, is defined as:
The definition mathematically characterizes the extreme operation scenario as a situation where the operating state of the power system exceeds the upper bound of the adjustable capacity. In this formulation, the stochastic nature of renewable generation and load demand is captured via a set of annual chronological sample paths, denoted as . For each specific sample path , the time-series trajectories of wind, solar, and load are sequentially mapped through the system adequacy dispatch model (Equations (3)–(6)). An extreme operating scenario is explicitly generated whenever the random net load crosses the dynamic boundary of available flexible resources, yielding a non-zero . This framework maps continuous weather-driven uncertainties into discrete, high-impact supply–demand imbalance events. On this basis, the risk characteristics of extreme operation scenarios caused by ‘source-load’ random mismatch are further analyzed.
3.2. Risk Classification of Supply and Demand Imbalance
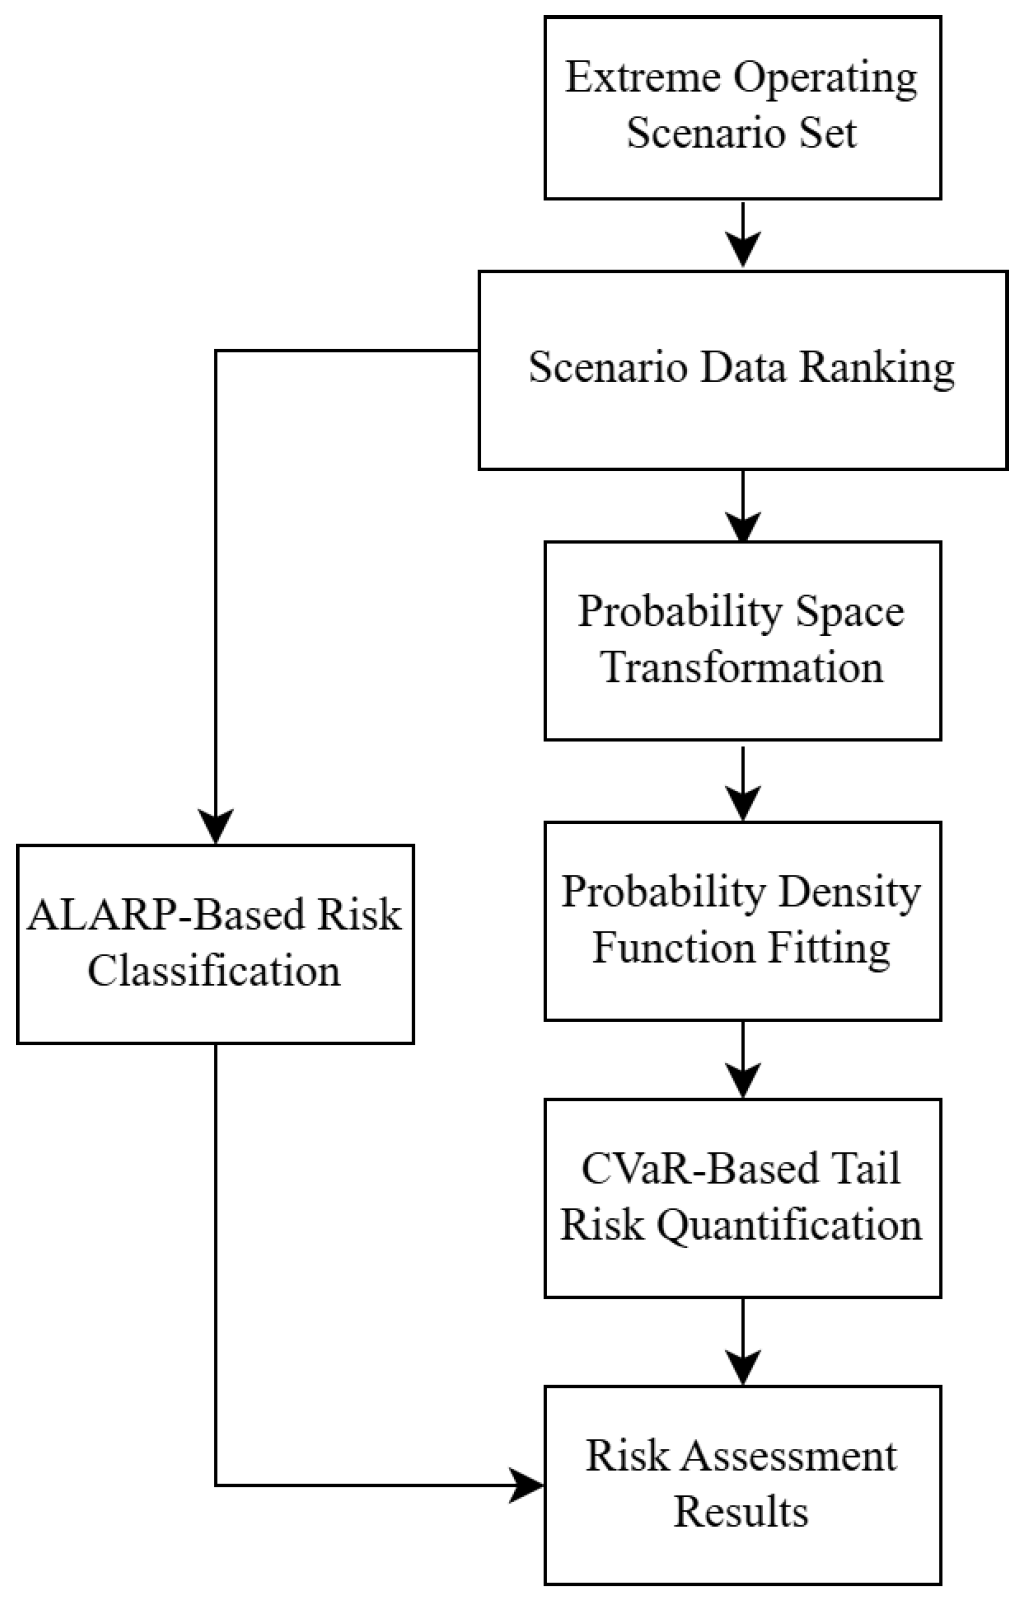
To provide a clear overview,
Figure 5 illustrates the proposed progressive evaluation process. Driven by the temporal clustering and heavy-tail characteristics identified in
Section 2, the framework evaluates the extreme operating scenario set along two dimensions: risk classification via the ALARP criterion to define acceptability boundaries, and risk quantification via the CVaR index to capture tail-region losses.
In extreme operational scenarios, the severity of a power shortage caused by a power system’s insufficient capacity differs significantly. The ALARP standard is employed to distinguish between severe operational scenarios and their associated risks. In these situations, the intensity of risk is determined by employing the degree of power shortage as the metric for risk. This method facilitates a tiered classification of situations with differing degrees of risk, establishing a foundation for the quantitative evaluation of subsequent severe risks.
The ALARP standard is often utilized for engineering safety. This method for risk management in severe power system scenarios establishes a foundation for approval, sets risk thresholds, and provides a systematic decision-making framework for high-risk scenarios such as rising energy fluctuations [
29].
Extreme operational situations are classified into unsuitable zones, viable minimum zones, and insignificant zones, depending on the degree of supply-demand imbalance, as evidenced by power shortages [
30]. As per [
31], the criteria for categorizing accidents on a scale of load reduction have been set to ensure both the logical engineering and practical practicability of risk classification. A load decrease of less than 5% in a provincial power grid does not constitute a general accident. A typical accident is marked by a decrease in load varying between 5% and 10%. A decrease in load ranging from 10% to 13% in an accident grade indicates a major accident, while a major accident is defined when the load reduction surpasses 13%. As per the previously mentioned accident classification, an operational state with less than a 5% decrease in load is classified as a zone of minimal risk. On the other hand, a state experiencing over 13% load reduction is classified as the unacceptable risk zone, while the operational state located between these two is deemed the most feasible minimum risk zone.
Crafted over prolonged durations, these criteria for categorizing mishaps in power-system activities have achieved broad recognition in regulatory and policy documents, providing a framework centered on engineering to evaluate the effects of supply-demand imbalance events.
In the specific execution phase, the system’s peak load for a day is selected as the standard, and the load reduction ratio is converted into a corresponding power shortage threshold, thus setting the threshold for risk classification in severe operational scenarios, contingent on the degree of load reduction [
31]. As a result, the proposed limits vary in real-time, adapting to different degrees of system burden.
Identifying the danger posed by disparities in power supply and demand requires preliminary evaluation and categorization in severe operational situations, but pinpointing the disparity in losses and specific risk characteristics of major power scarcities in inappropriate areas continues to be difficult. As a result, it becomes essential to focus more on high-risk sectors and apply CVaR metrics for a numerical assessment of the risks related to supply and demand imbalances in critical operational scenarios.
3.3. Tail Risk Assessment Method of Supply and Demand Imbalance
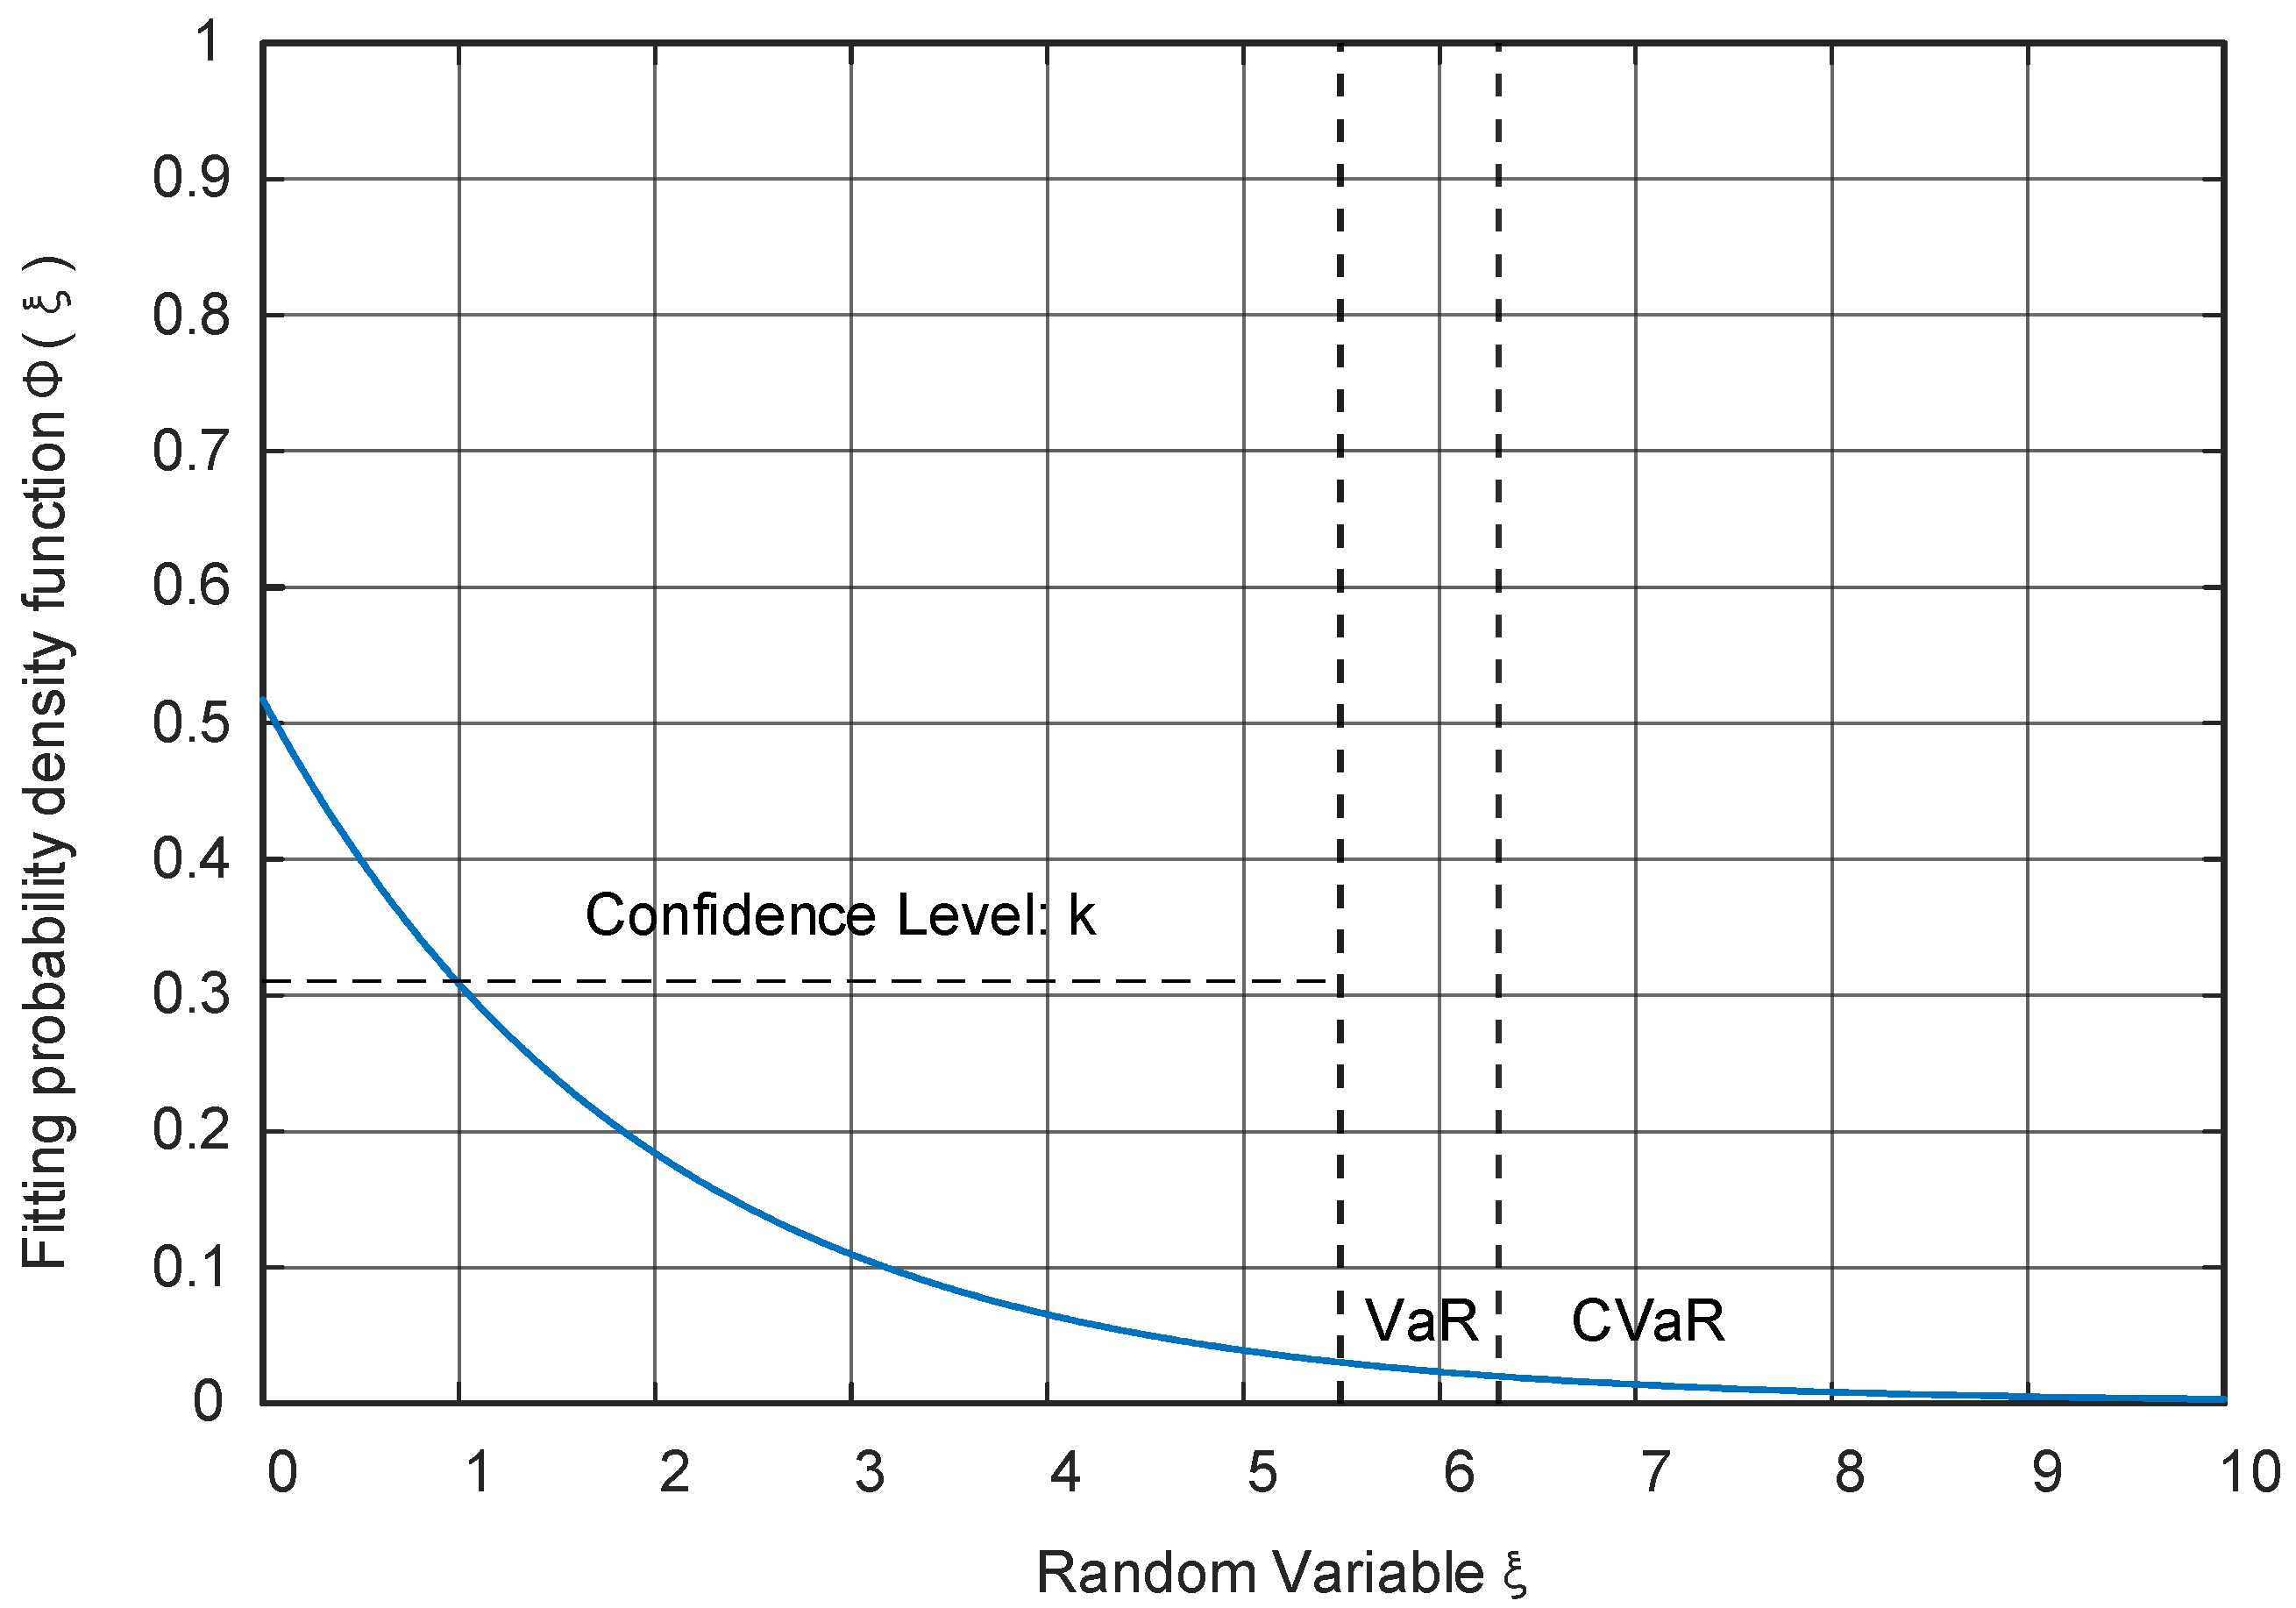
Techniques for the quantitative assessment of power supply and demand imbalance in power systems include Value at Risk (VaR) and Value at Risk (CVaR). VaR delineates the maximum level of power shortfall the system could encounter at a specific confidence level. CVaR further outlines the expected result when the power shortfall exceeds the quantile limit, indicating the system’s drastic exhaustion in critical circumstances, possibly reflecting the severe extremities of the power shortage risk in the most severe operational setting. Stemming from the realm of economic risk management, the previously mentioned measures are widely utilized to control risks in power systems and enhance operational efficiency, with CVaR playing a crucial role in identifying critical risks of power shortages [
32]. Unlike adequacy indices that evaluate the overall frequency or expected impact of standard system conditions, the CVaR index focuses exclusively on the area’s conditional severity with a low likelihood. Consequently, this framework serves as a risk-oriented supplement for evaluating worst-case scenario impacts, instead of replacing conventional adequacy assessments.
In a power network predominantly dependent on renewable energy, the segment of the supply and demand balance curve experiencing power shortages shows distinct, non-linear, sudden shifts, underscoring the major impact of several critical power shortages on the system’s risk in extreme operational scenarios.
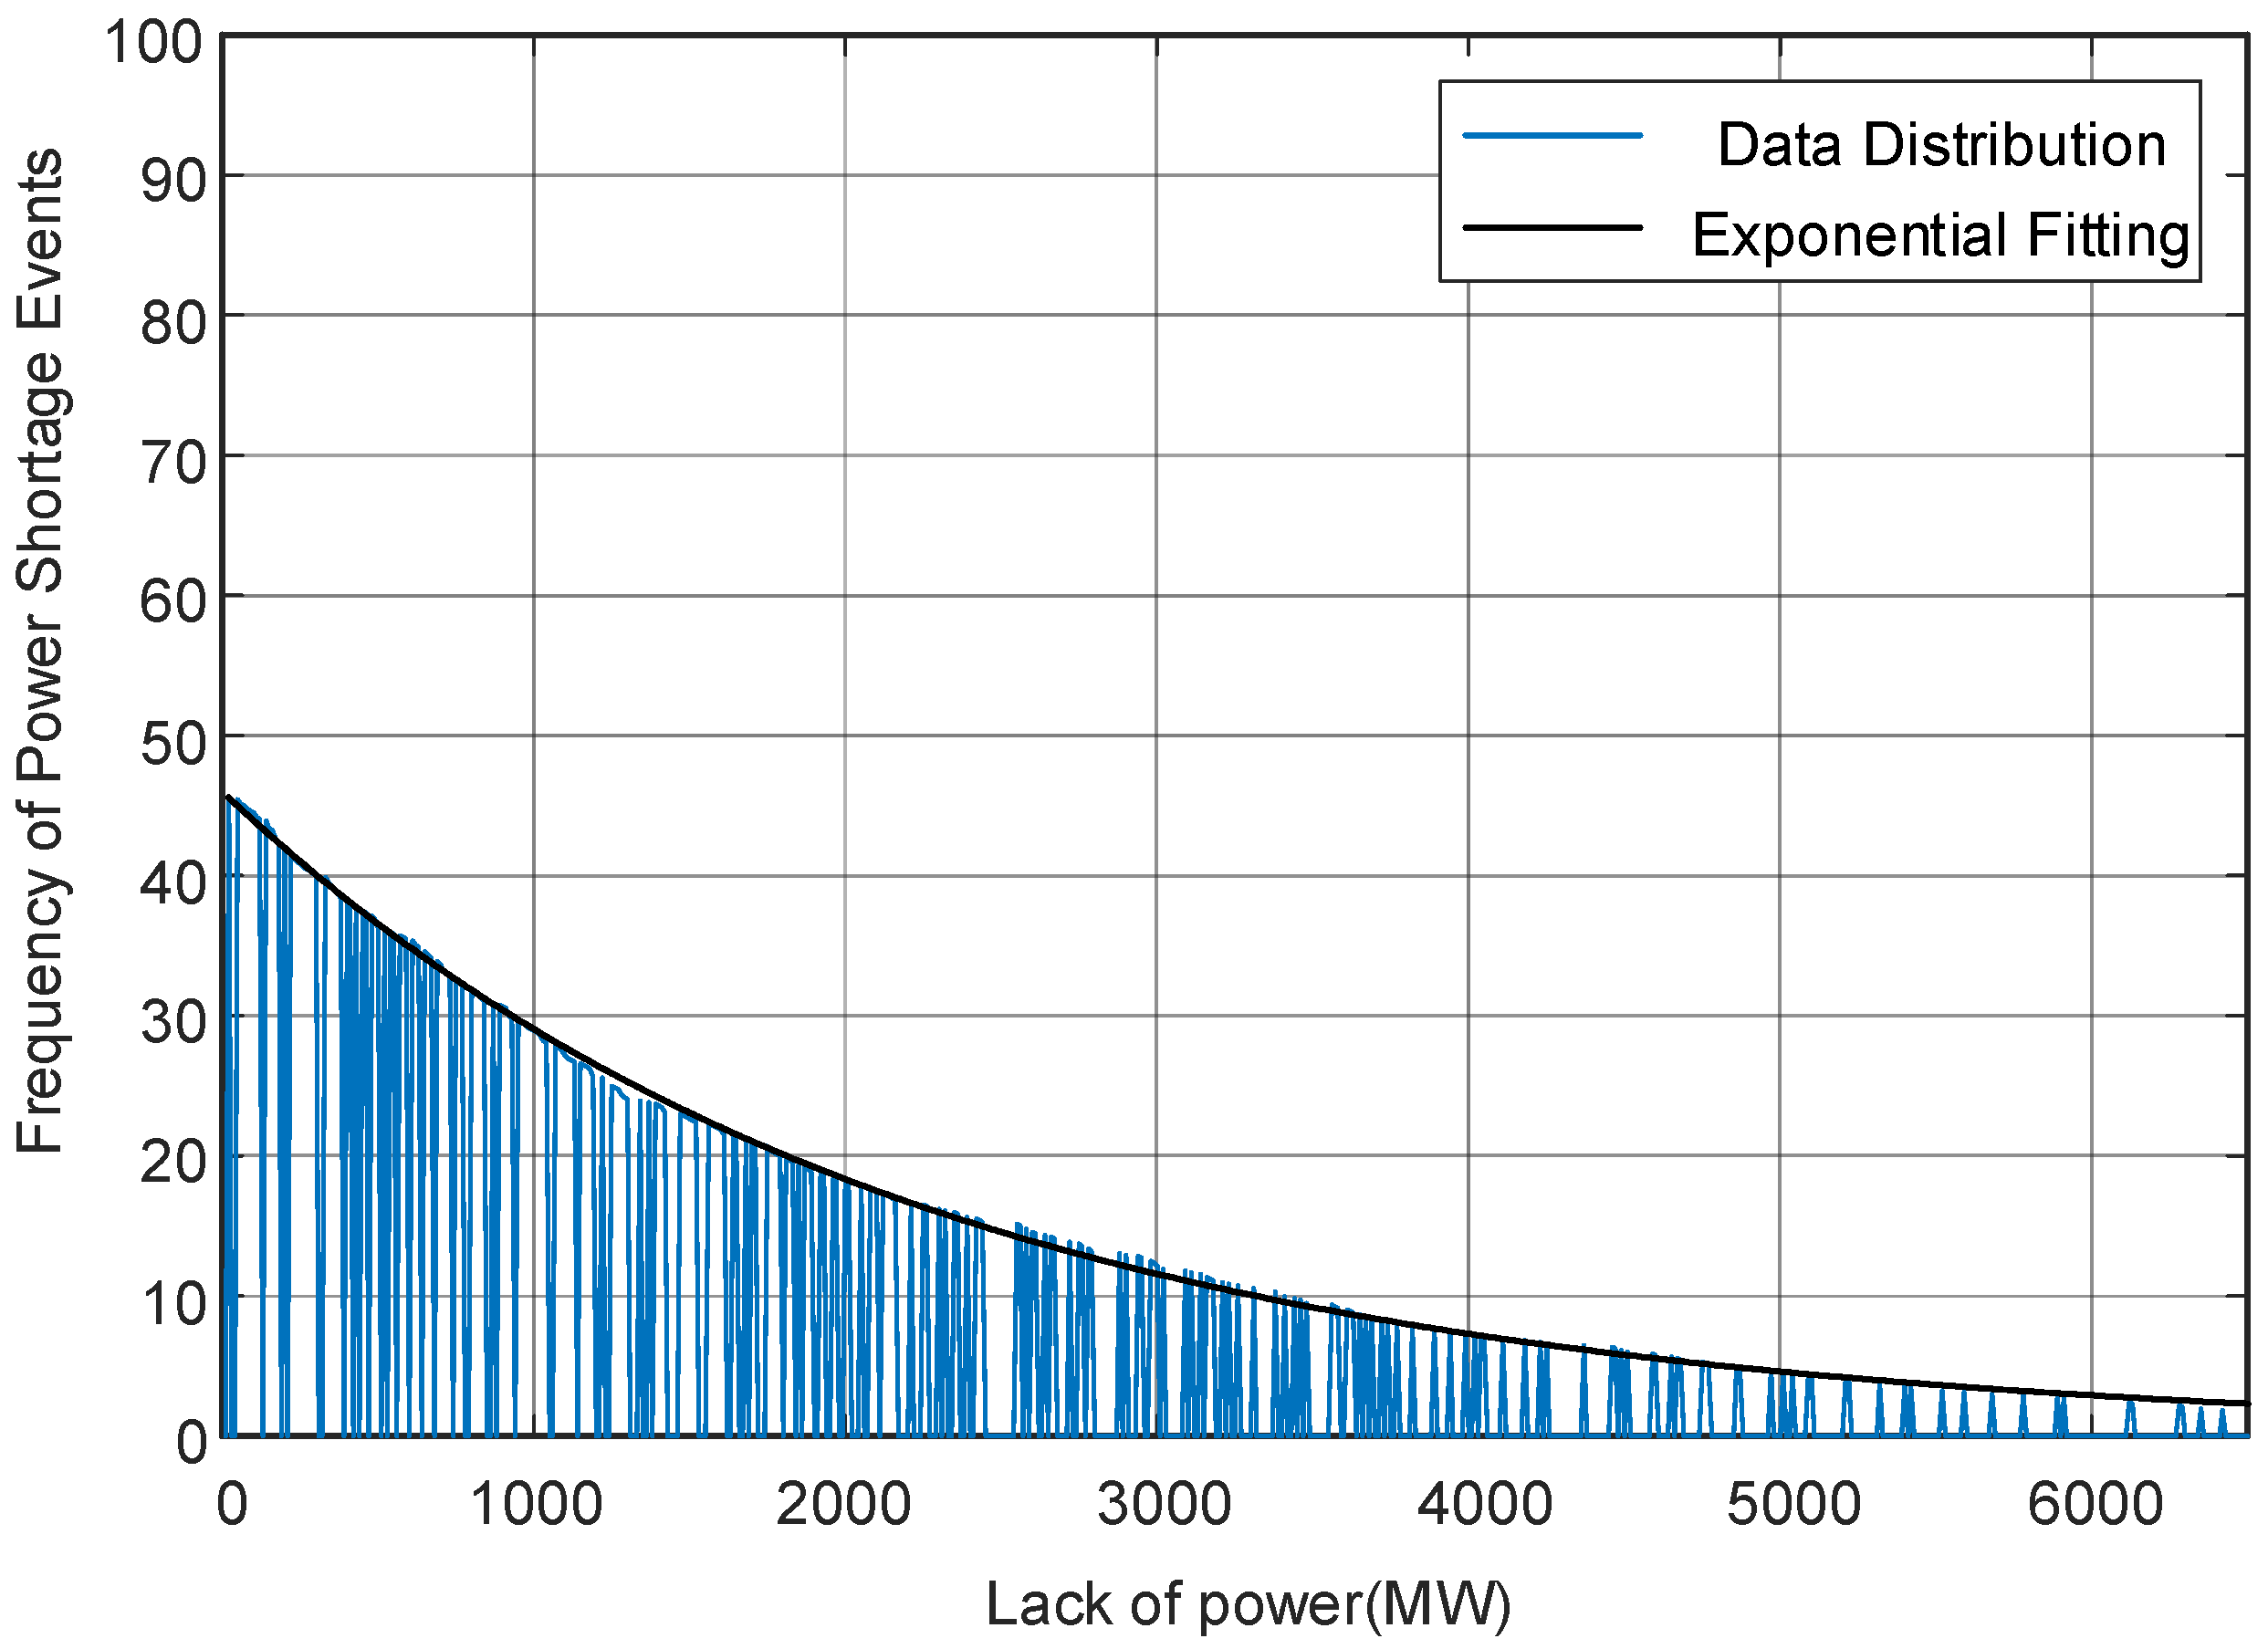
Figure 6 depicts the probability density distribution for the power shortfall in the system’s most critical operational state. The CVaR index serves to numerically evaluate the tail risk through the analysis of expected power shortages in extreme operational scenarios.
According to the definition of CVaR, the risk of power system supply and demand imbalance is quantitatively calculated. The calculation process of CVaR is as follows: Firstly, the data of the corresponding power shortage section in the extended net load descending curve is extracted and transformed by the inverse function. The discrete power shortage sample is transformed into a continuous function form by function fitting to meet the requirements of risk index calculation for probability distribution.
where
represents the function fitted after the power shortage is arranged in descending order;
and
represent the fitting function parameters;
and
represent the probability density function of the random variable of the power shortage and the random variable of the power shortage;
represents the rate parameter of the exponential distribution;
represents the confidence level of setting extreme operating scenarios;
represents the cumulative function of the random variable of power shortage.
Within real-world engineering scenarios, VaR signifies the utmost power deficit the system might experience at a confidence level, while CVaR denotes the anticipated severe power loss if the loss surpasses the VaR. Adhering to the basic models set forth in [
16,
17].
For maintaining the statistical precision of exponential fitting in extreme operational situations, various indicators of goodness-of-fit, such as the coefficient of determination (R2), Akaike Information Criterion (AIC), and Bayesian Information Criterion (BIC), are utilized in quantitative analysis. Additionally, the Nonparametric Kernel Density Estimation (KDE) technique serves as a standard for cross-validation, ensuring the precision of tail-risk evaluation remains unaffected by parametric simplification.
Section 4.3 displays the comprehensive validation outcomes derived from empirical data.
Transforming the power supply and demand balance curve into a probabilistic format enables the shift from a power scarcity power sample in the time series to a stochastic variable, laying the mathematical groundwork for computing CVaR.
Figure 7 displays a diagrammatic representation of Value at Risk (VaR) and CVaR risk assessment, derived from a probability distribution, representing the system’s average most severe power scarcity in extreme operational situations.
Regarding the classification of risks, the CVaR index is utilized to evaluate and control the probability of critical operational scenarios in areas with the lowest risk. When the risk zone is considered unsuitable, the imbalance between the system’s power supply and demand significantly increases the risk of major accidents, thus requiring preventive measures. Regarding the minor risk area, its impact on the system’s operation is negligible, requiring only consistent observation and consistent evaluations.
In a significant portion of renewable energy systems, the likelihood of a disparity between supply and demand shows pronounced tail amplification characteristics. The strategy of initiating load control tactics based on the threshold of power scarcity often requires implementing load shedding in all severe boundary conditions, resulting in overly cautious operational methods. In contrast, the CVaR-based method more precisely reflects risk distribution characteristics by concentrating on controlling the mean loss in extreme (1 − k)% situations, thus neglecting specific low-risk operational scenarios and achieving equilibrium between system security and economic effectiveness.
4. Case Studies
Concentrating on a major portion of renewable energy systems, an extended case analysis is carried out to evaluate the effectiveness and feasibility of the proposed risk assessment method by analyzing the dangers of extreme operational situations. This sample analysis primarily seeks to evaluate the effectiveness of different risk management strategies in mitigating supply-demand imbalances by gauging the system’s risk during critical operational conditions, thus establishing a foundation for decision-making in these situations.
The calculation in this instance depends on the MATLAB R2023a framework for computing risk indices, where the planning simulation system brings the system’s condition to life. The sampling process is divided into two stages: the first stage aims to eliminate unbearable hazards and sustain equilibrium between supply and demand in critical operational conditions; the next stage reduces the tail risk in the viable minimum risk area, gradually lessening the risk in extreme operational scenarios by decreasing the CVaR, thus diminishing the risks linked to sudden extreme events, thus lessening the risks related to such incidents.
4.1. Case Study Setup
Fundamental information, centered on a regional power network, is sourced from actual hourly climatic and operational logs of Jilin Province, China. Data preprocessing involves cleansing the data (putting missing records) and arranging the source-load profiles in a time-ordered manner. To model the forthcoming strategic year in provincial energy development agendas, the conventional power generation model has been modified to encompass wind energy 45 GW, solar 15 GW, thermal energy 9.92 GW, hydropower 4.75 GW, and energy storage 9.36 GW. Significant uncertainties in operations stem from the cyclical nature of renewable energy sources, affected by climatic and seasonal load fluctuations, and are modeled with an accuracy of one hour over a full year (8760 h). Risk assessment’s reliability threshold is set at 95%.
In engineering, the 95% confidence threshold is widely used to assess risks in power systems and inform operational choices. Concurrently, the CVaR is selected as the main indicator to assess the likelihood of an imbalance between supply and demand in severe operational conditions, precisely mirroring the tail-risk level in the most unfavorable situations. To validate the framework, the selected scenario year serves as a prime mid-term target for carbon neutrality, ensuring uniform empirical seasonal and multi-energy traits.
Moreover, to keep a consistent level of confidence,
Figure 4 methodically evaluates and illustrates an in-depth sensitivity analysis of various rates of renewable energy adoption, ranging between 70% and 100%. Crucially, as this study focuses on the hazards of supply-demand disparities at the systemic level, the proposed model seeks to outline the wider relationship between net load and alterable resources rather than scrutinizing specific network frameworks. The study omits a specific network topology chart because it thoroughly depicts the system’s operational characteristics and supply-demand interactions via sequenced time-based profiles of net load, generation output, and power balance.
4.2. Extreme Operation Scene Recognition Results and Time Series Distribution Characteristics
In
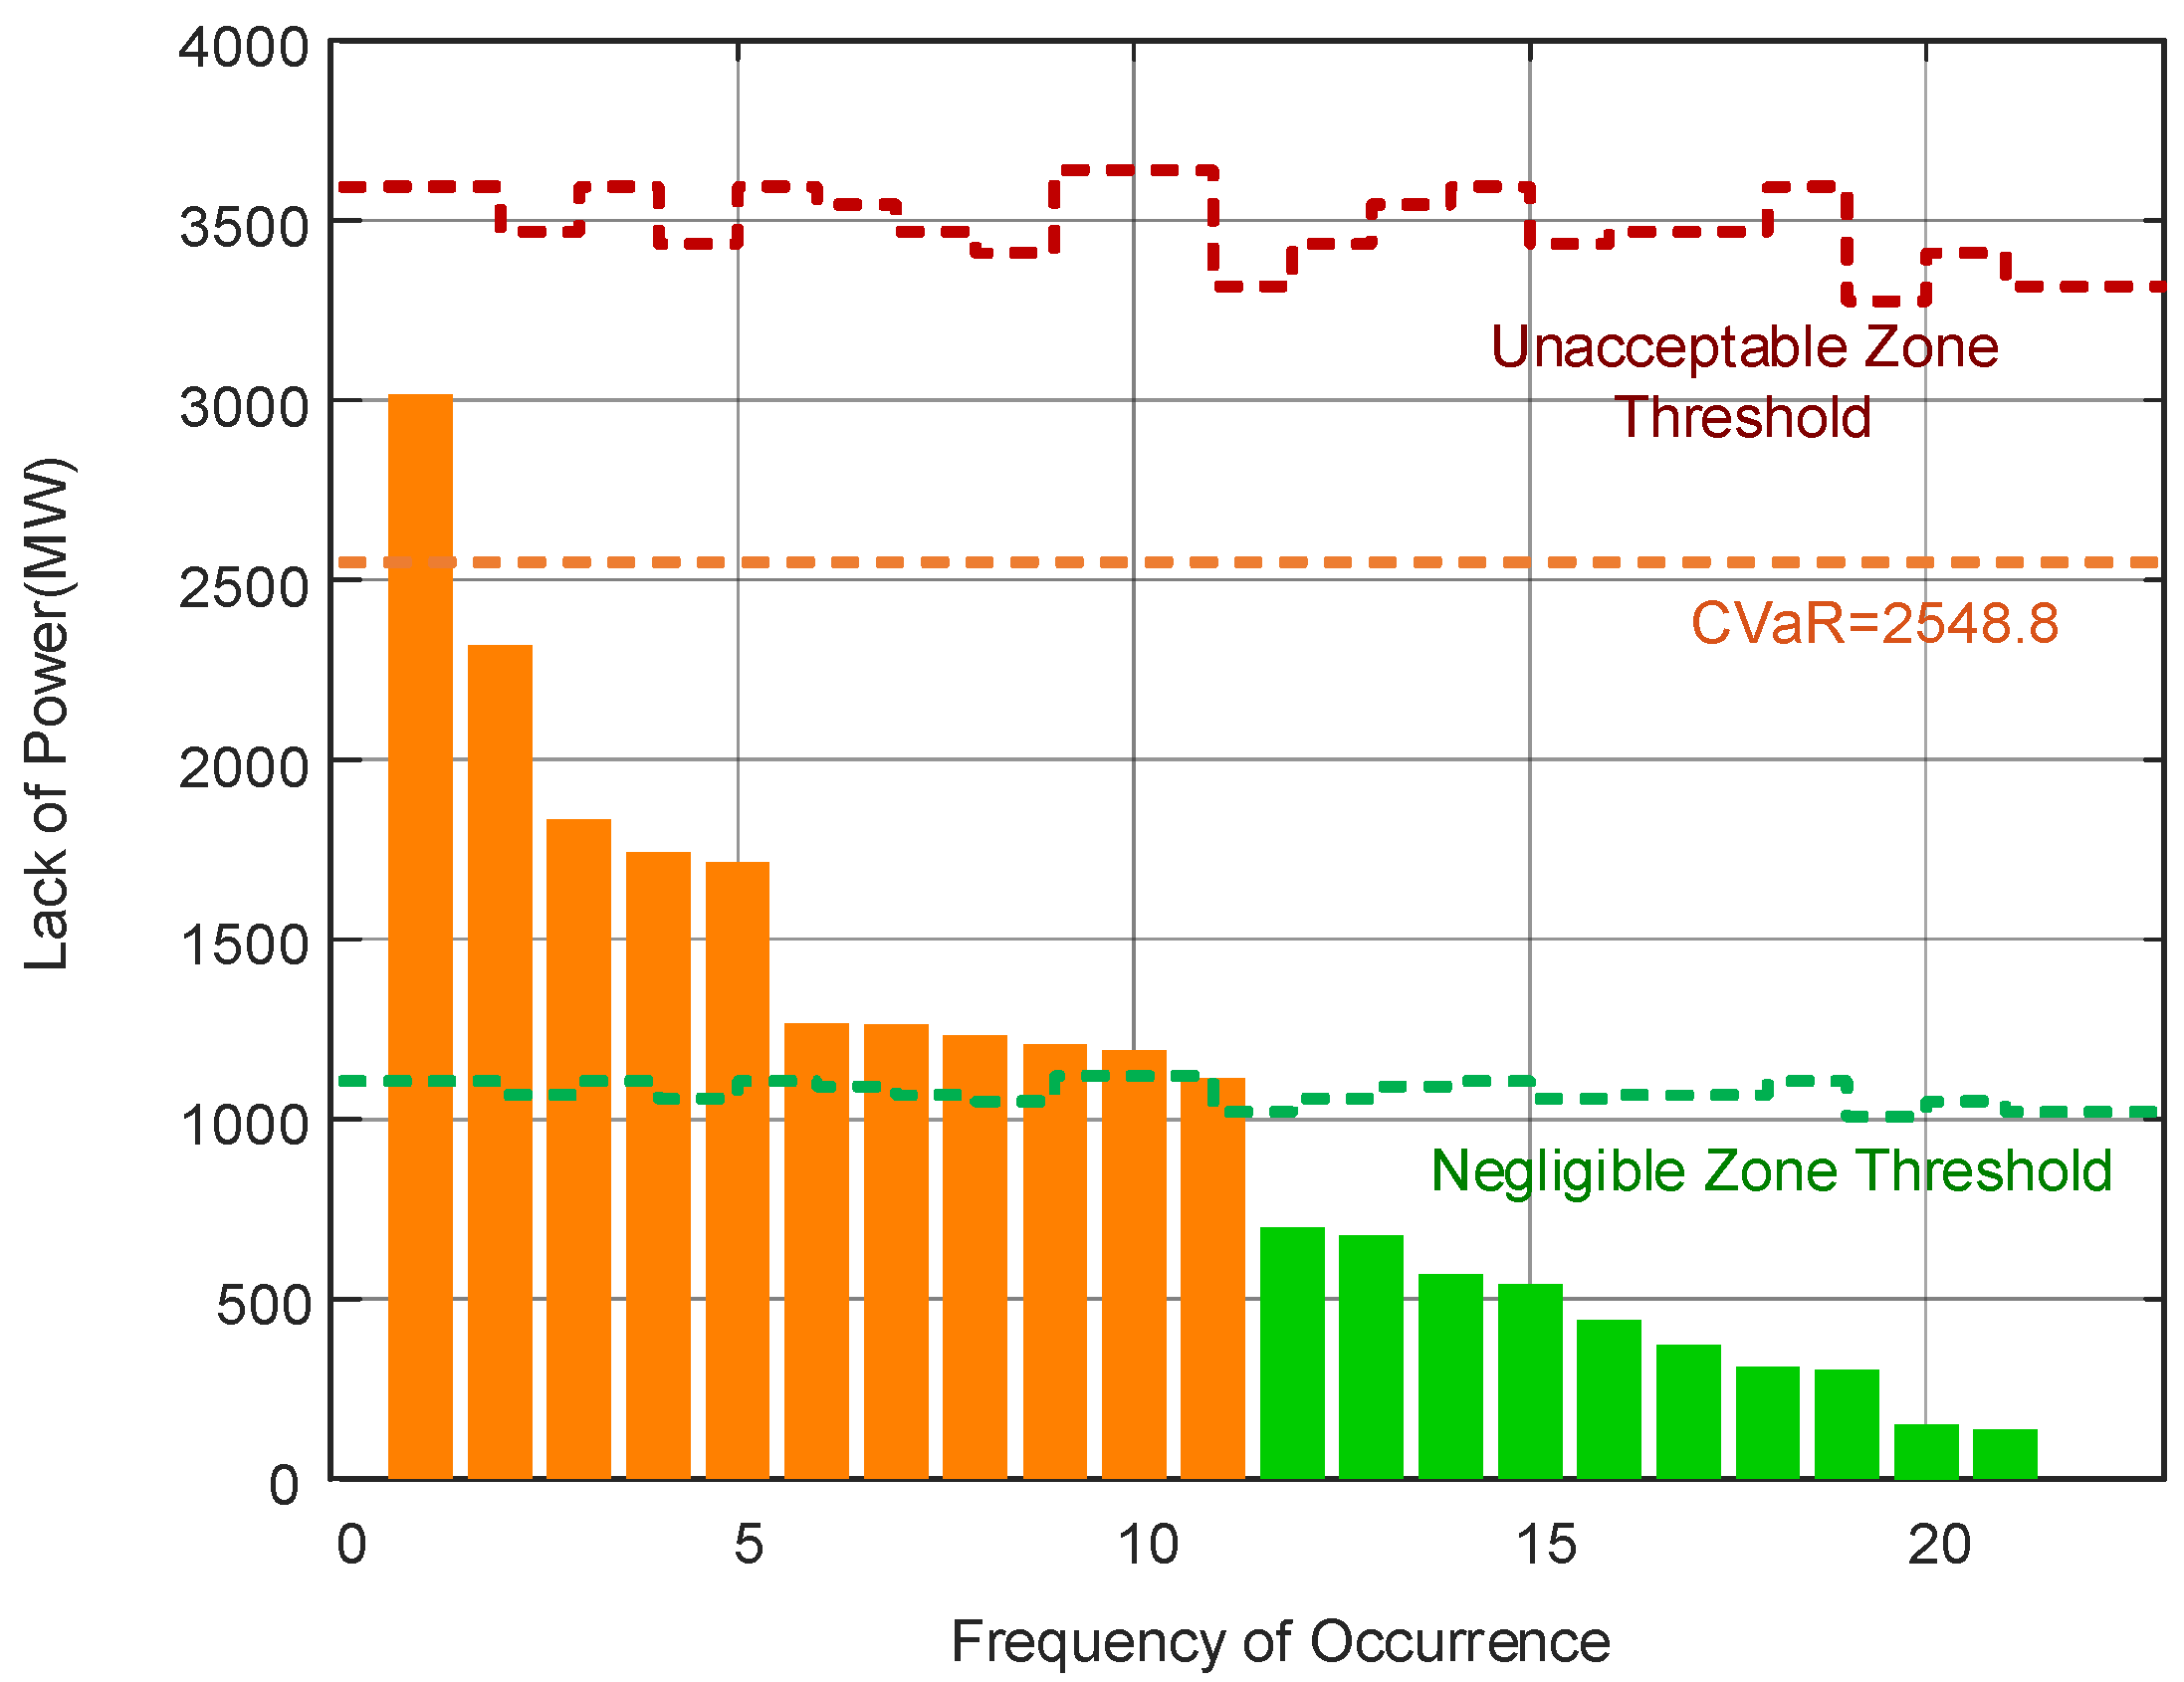
Section 3.2, extreme operating scenarios are detailed, characterized by the system’s net load exceeding its highest alterable capacity due to random discrepancies between the source and the load. By applying the ALARP criteria, these identified severe operational scenarios are classified into different risk levels, based on the severity of the power shortage. Such categorizations represent different levels of risk linked to severe operational conditions, rather than unique understandings of these situations. Dynamic adjustments are made to the risk thresholds of the analyzed provincial power system, taking into account the daily load intensity and associated accident classification criteria. In the specified scenario year, the threshold of the ALARP area fluctuates around 1100 MW, unlike the threshold of the unacceptable risk region, which fluctuates approximately 3500 MW.
By employing a technique to pinpoint extreme operational situations, a statistical analysis is performed on the balance of supply and demand in high-proportion renewable energy systems throughout the scenario year. The study identifies when these severe operational situations occurred and the resulting power scarcities, setting the stage for additional research on risk characteristics.
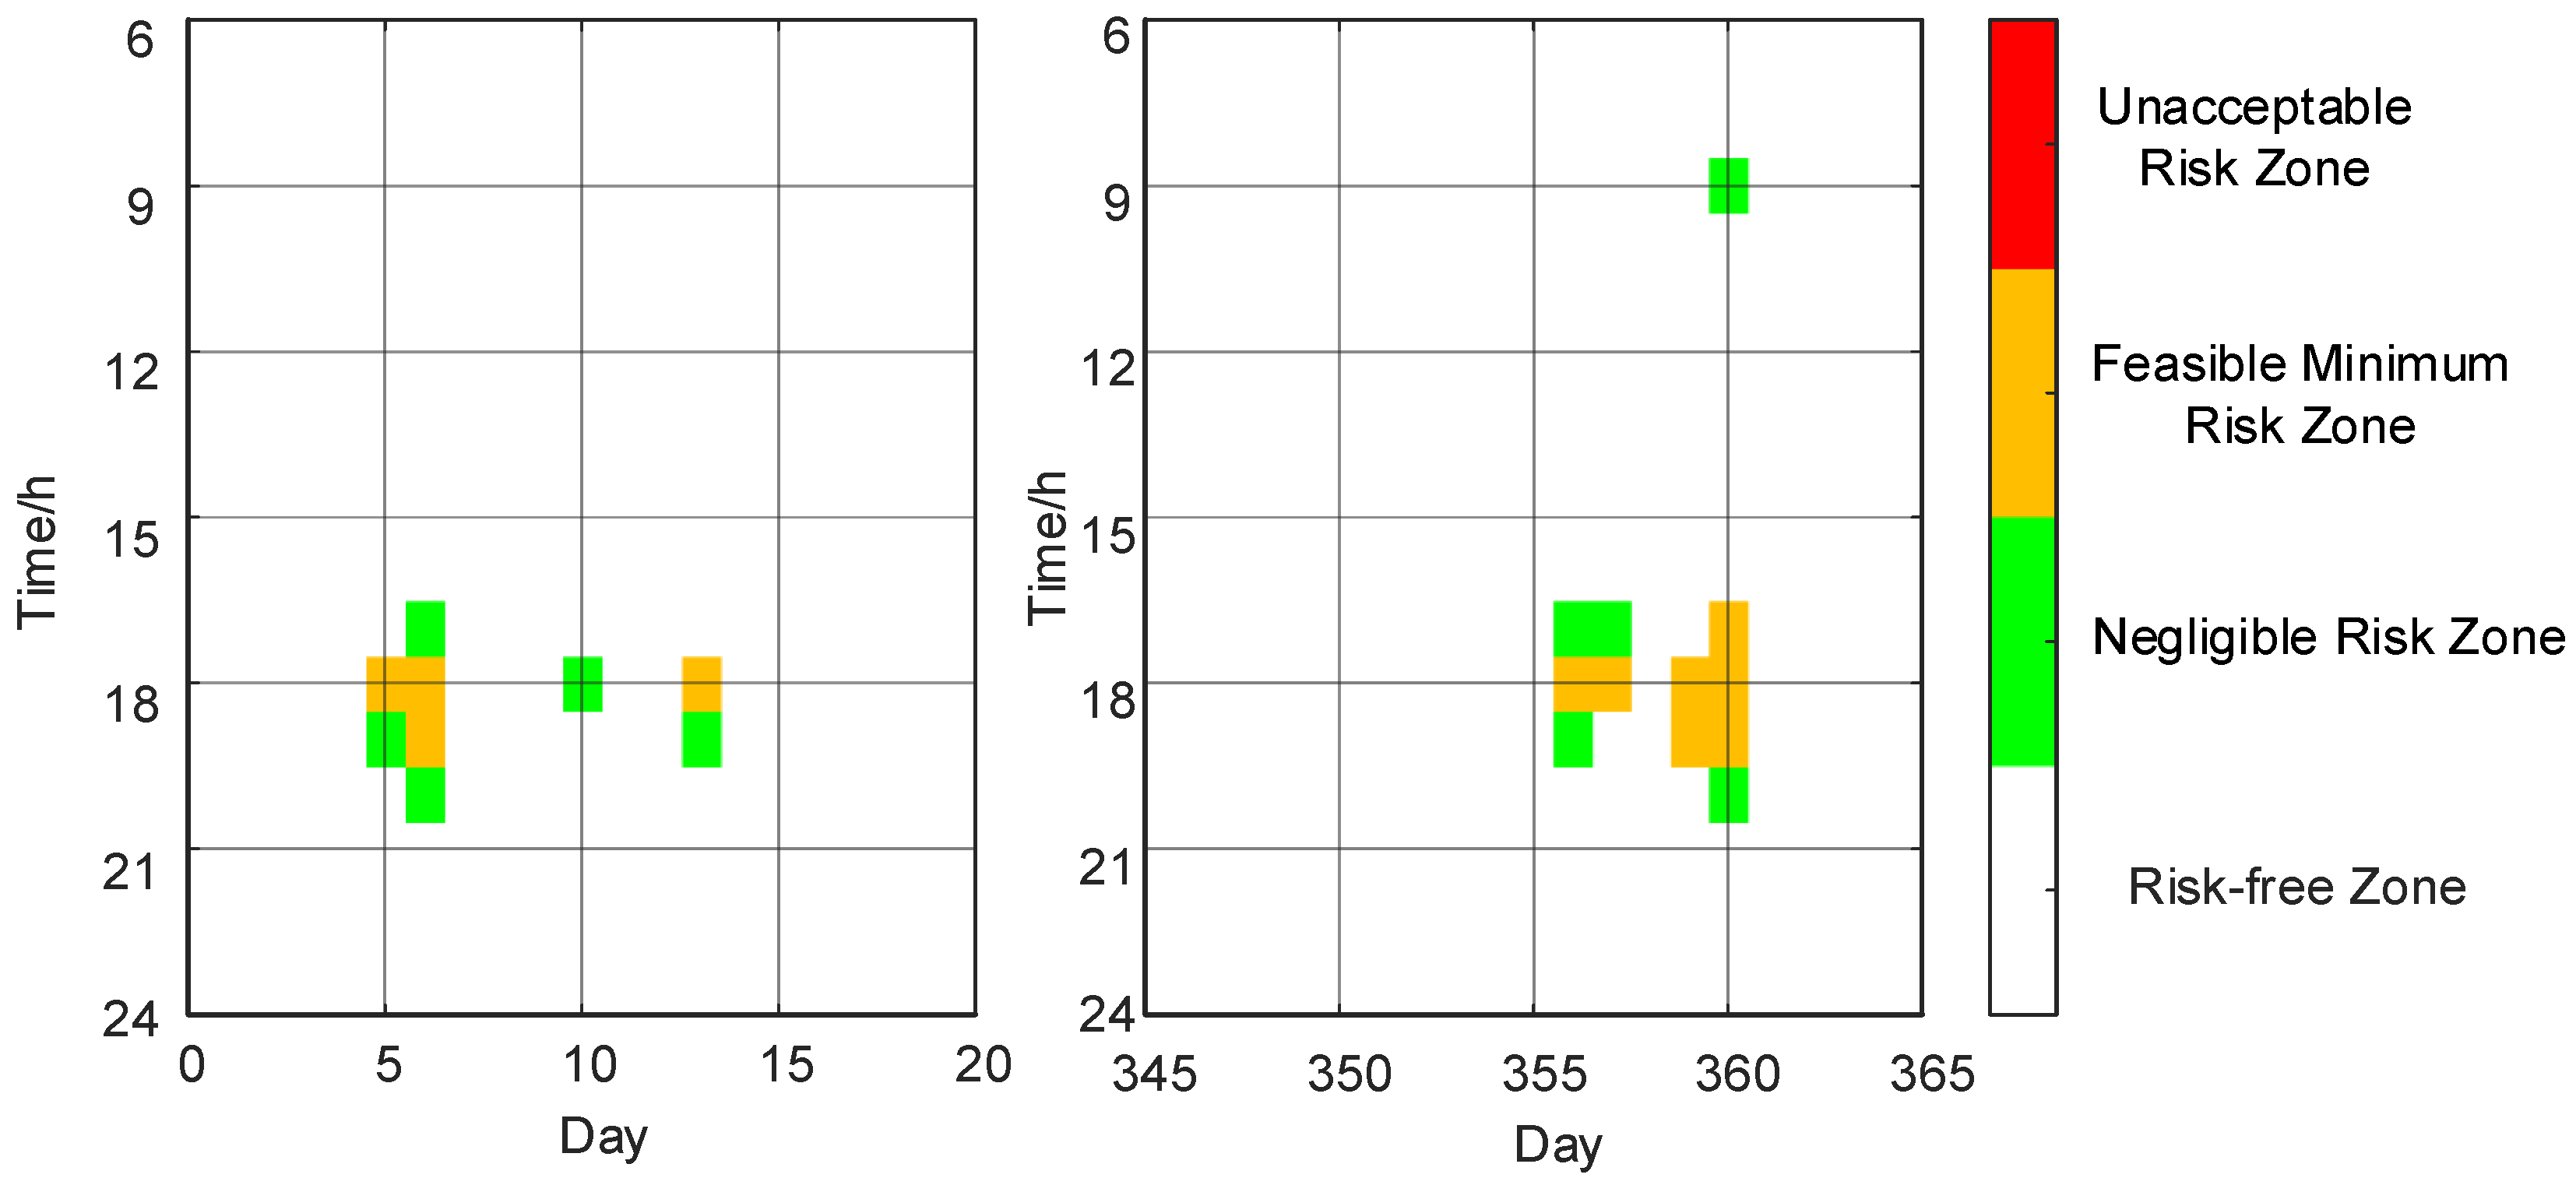
Figure 8 depicts the chronological distribution of critical operational scenarios across different risk areas over the year. Research shows that in annual severe procedures, the least viable area is roughly 47.62%, the least feasible area is about 52.38%, and the region considered unsuitable undergoes no extreme operations. According to the data, while the system upholds an essential safety level for its operations, it still faces risks of moderate to severe power shortages.
To evaluate the impact of threshold settings on risk classification, a sensitivity analysis is conducted, modifying these thresholds by ±2% while keeping other variables unchanged.
Table 1 presents the results, indicating that the frequency and distribution of critical operational scenarios in each risk zone remain largely unchanged, even with variations in thresholds. This demonstrates the robustness and suitability of the proposed threshold-setting method for the system being analyzed.
Observing from the perspective of time distribution characteristics, the extreme operational situations are unevenly spread throughout the year, mainly focusing on the evening period when the load reaches its ‘double peak’, and there is a significant increase in their frequency in winter due to limited new energy production. This suggests that during periods of low new energy generation and high demand for concentrated energy, the system often faces significant power outages.
Considering risk levels, several major power shortages occur in key periods, indicating these severe operational scenarios as key signs of the risks linked to disparities in system supply and demand. It is vital to carry out thorough research into the severity of severe power shortages to establish a foundation for upcoming quantitative evaluations and operational decisions.
4.3. System Risk Consequence Assessment
To begin with, the scenario year’s data, historical operational logs of a major renewable energy system segment are selected, followed by developing and evaluating a time series curve that illustrates net load, power supply, and demand equilibrium, as well as computing and assessing subsequent risk impacts. Here, the arrangement of the provincial power grid’s power is in sync with the advancement of its medium-term energy strategy, in line with the carbon neutrality objective, and could reflect the key risk elements of the system’s balance between supply and demand as new energy ratios continue to increase.
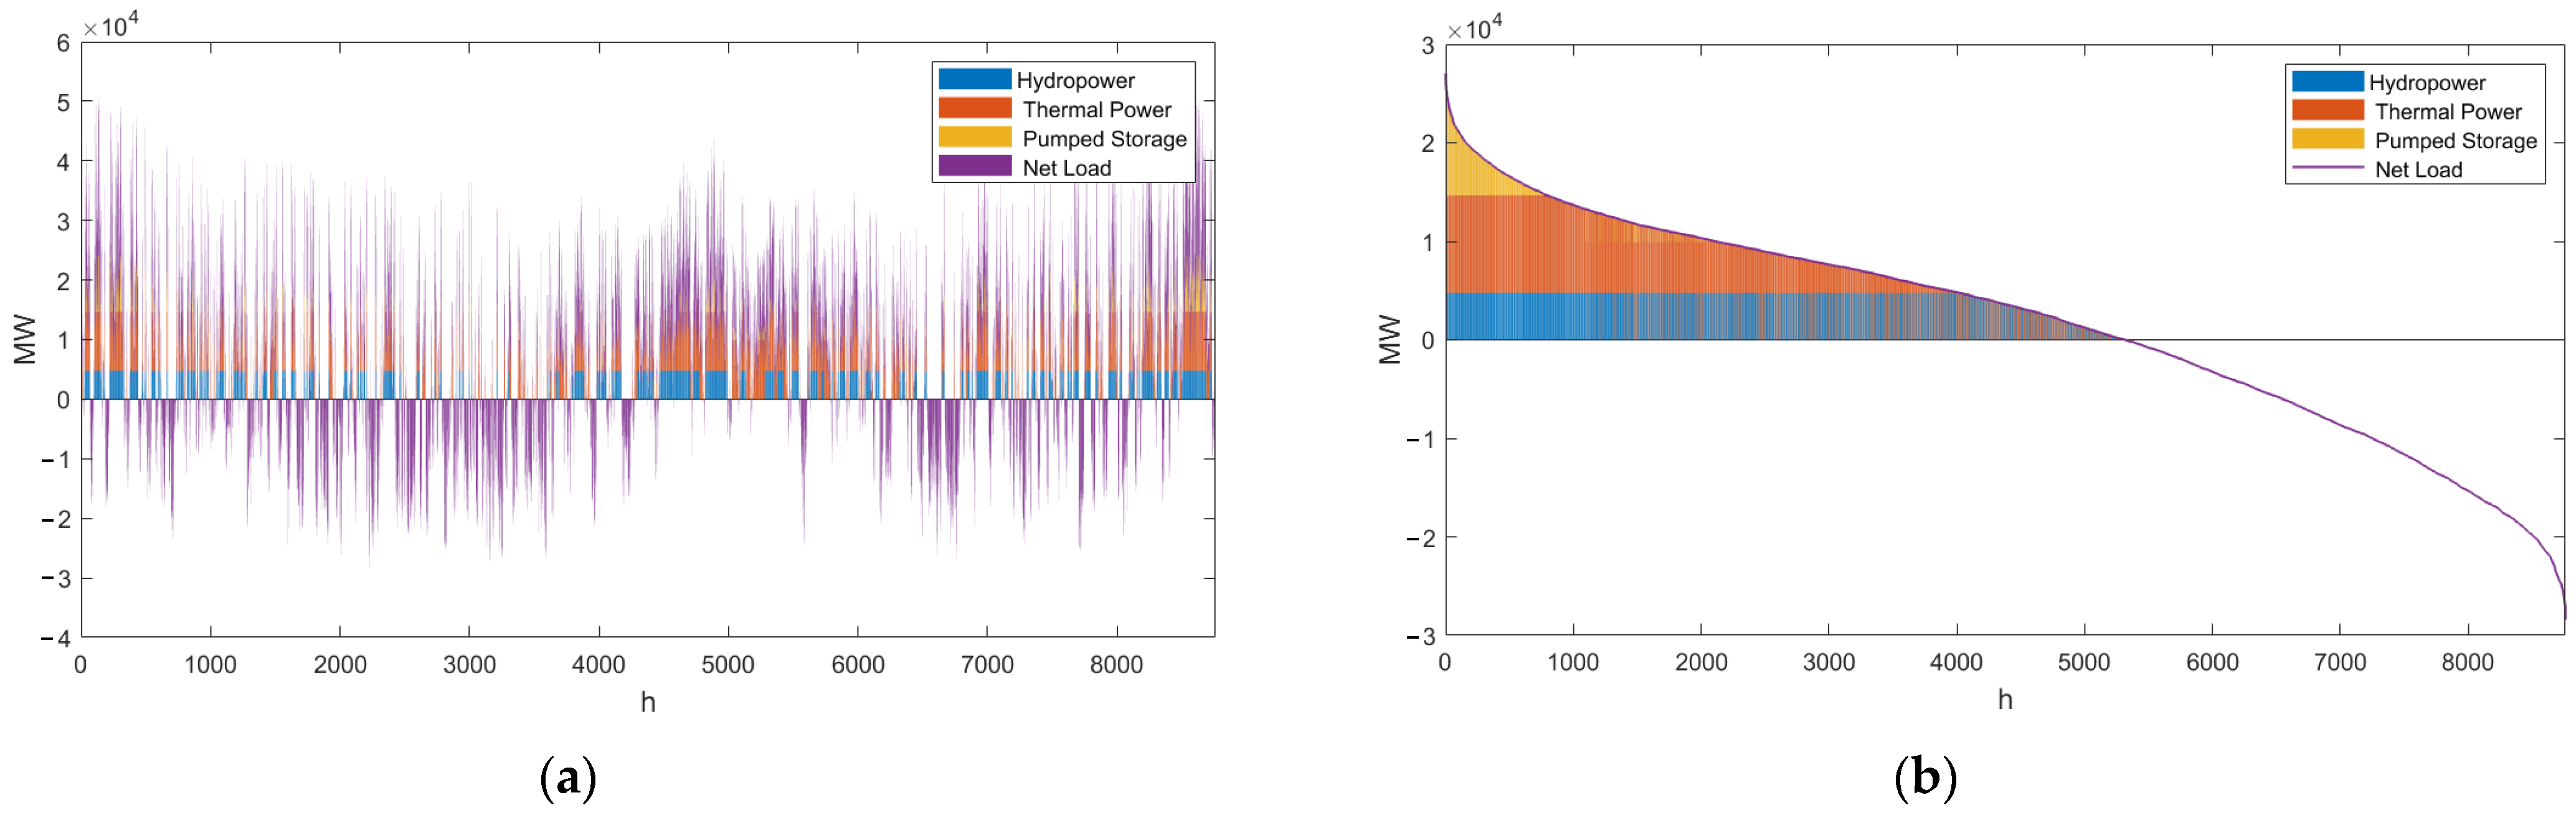
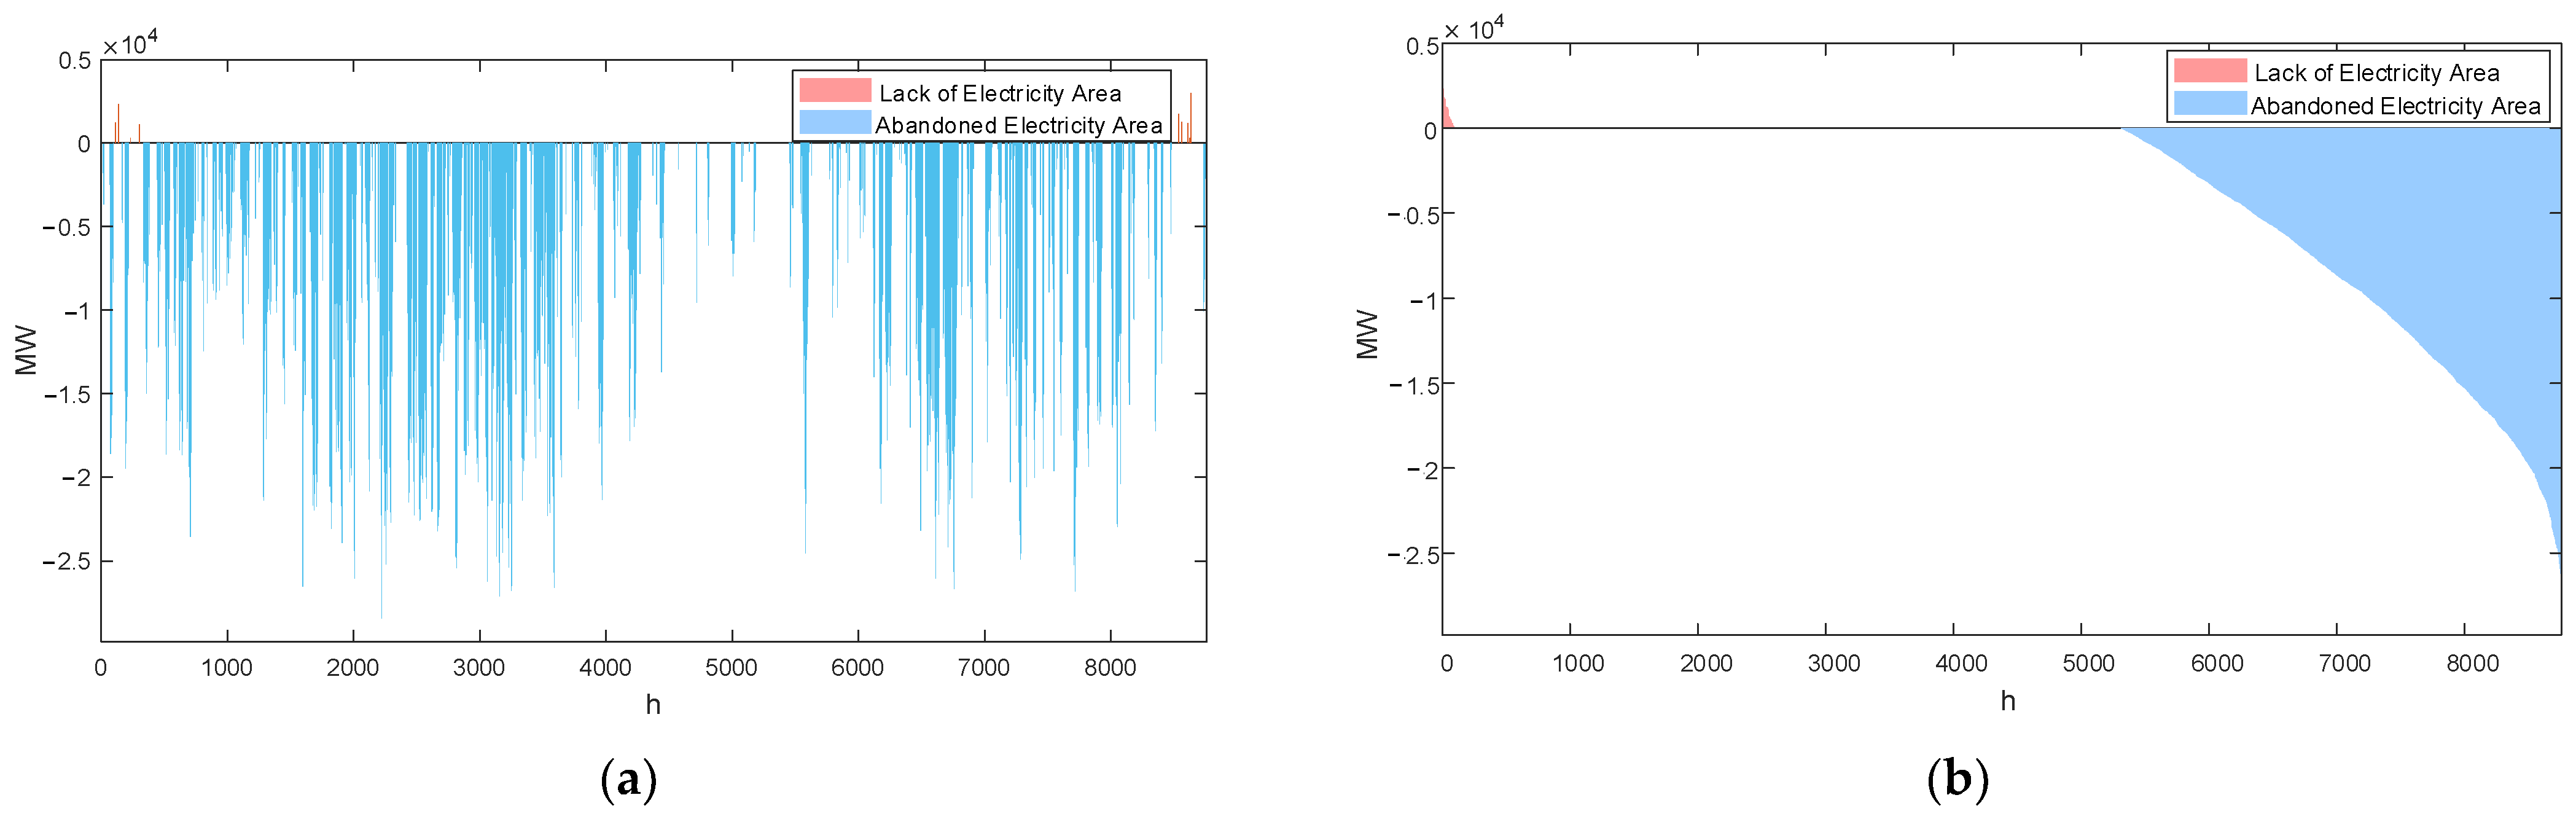
Figure 9 and
Figure 10 depict a step-by-step chart showing the balance of supply and demand in a renewable energy-dependent power system for a specific year, outline the length of this imbalance, and develop a set of extreme operational situations. Within the specified system, the severe operating scenarios display unique time-dependent distribution characteristics, with their power shortage levels significantly fluctuating over different operational periods. Assessing the risk level of the system in extreme situations purely by classifying risks presents a significant challenge. Therefore, it is crucial to conduct a numerical examination of how power deficits are distributed during severe operational scenarios year-round, taking into account the aspect of tail risk.
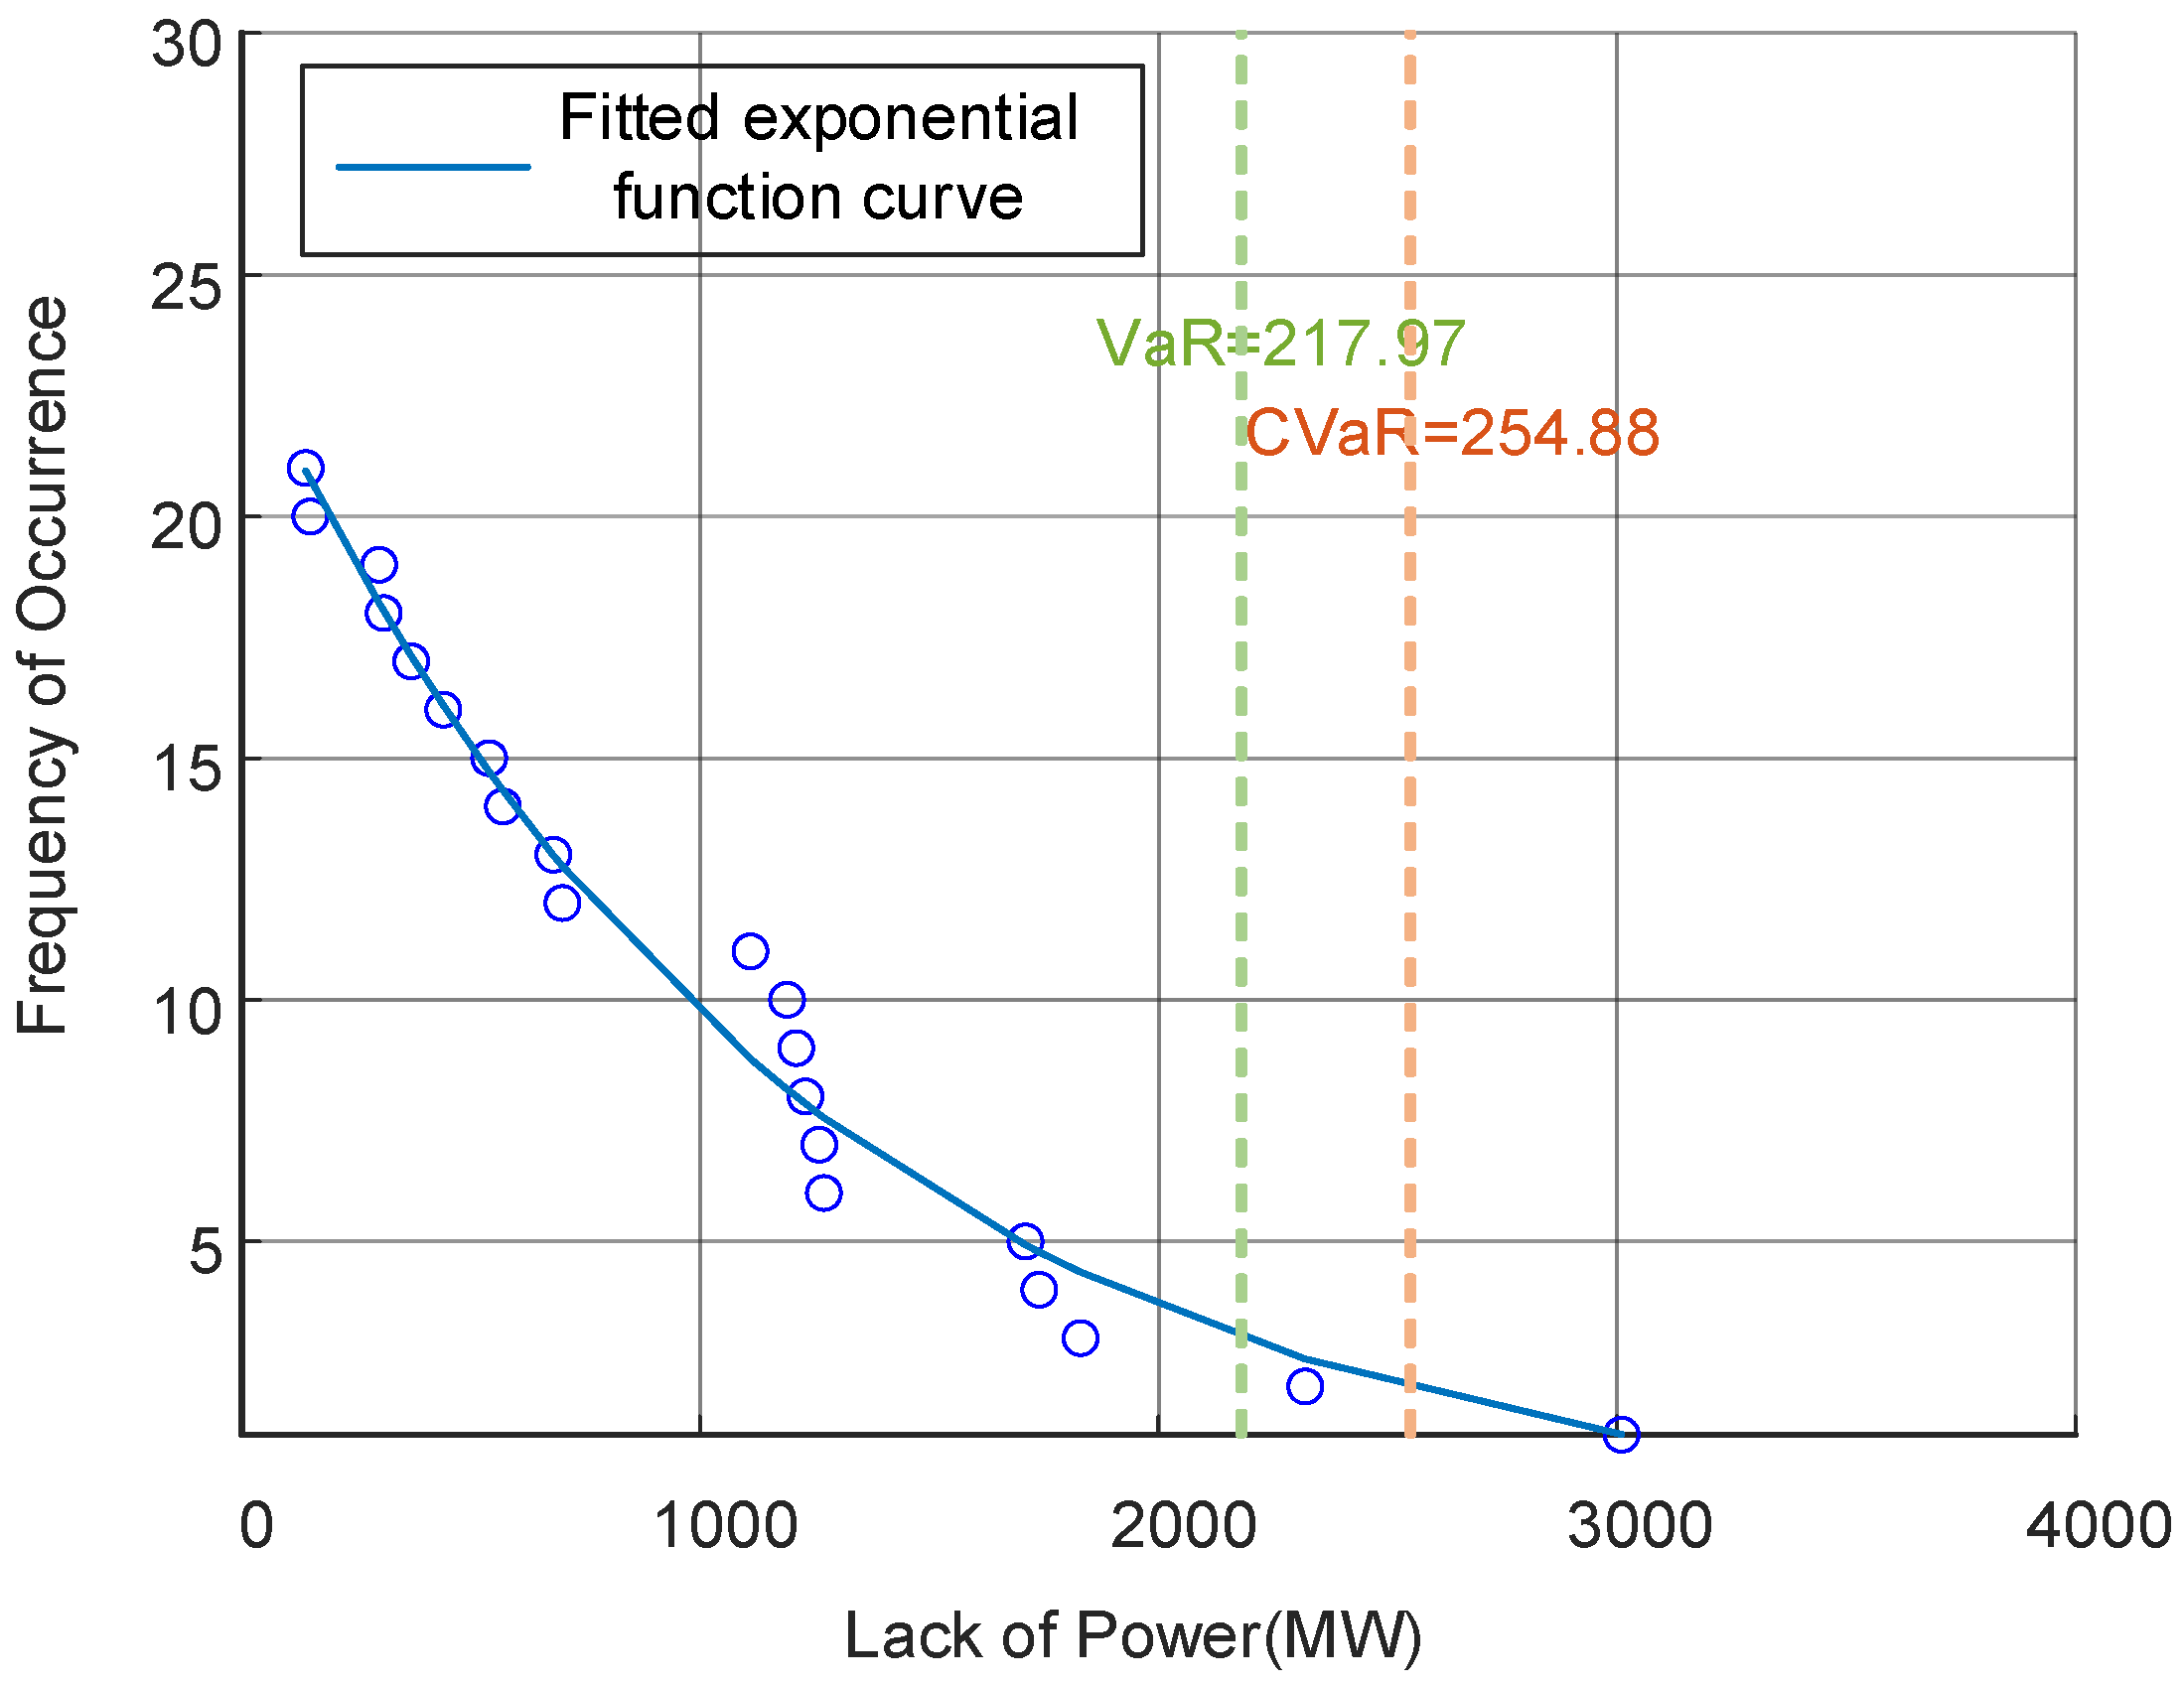
The proposed CVaR tail risk assessment method entails a numerical examination of the year’s most extreme operational situations. The results of the CVaR are shown in
Figure 11. The power-shortage distribution is modeled using an exponential function, represented as 24.668e − 0.083x, with its fitting parameters adjusted to −0.083. Examining the adjusted probability distribution shows the scenario’s annual conditional risk at 2548.8 MW, suggesting only a 5% likelihood of the average power shortfall exceeding 2548.8 MW in the most extreme case. Over the course of the year, 21 cases of power shortage occurred, with only one surpassing the CVaR.
Table 2 encompasses the metrics of suitability and the results obtained from the nonparametric KDE. The findings indicate that the R2 value reaches 0.98, signifying a marked exponential reduction in the likelihood of power shortages as the degree of imbalance increases. The minimal AIC and BIC values further corroborate the structural rationale of the exponential model with minimal complexities. Impressively, the risk assessment result obtained via KDE (2565.7 MW) shows a close correlation with the exponential fitting result (2548.8 MW). The process of cross-validation demonstrates that the proposed parametric approach successfully pinpoints the system’s tail-risk threshold in extreme scenarios, all the while maintaining computational efficiency.
Figure 12 illustrates the results of assessing risk levels in severe operational conditions for the specified scenario year. In order to preserve the system’s regular operations, the power grid usually implements a step-by-step response approach for severe tasks, conforming to the established criteria for power shortage and the importance of load [
33]. Fundamentally, this method serves as a risk response strategy, based on established boundaries. It is a complex task to distinguish between the probability of occurrence and the severity of results in different extreme operational scenarios. Broadening the spectrum of risk reactions is uncomplicated in scenarios involving a narrow array of extreme operational conditions, while hiding the true distribution characteristics of system risk in the tail area.
On the other hand, the CVaR risk assessment method is introduced to delineate the common consequences of power shortages stemming from extreme operational conditions in regions of moderate to high risk. The system’s tail risk is quantitatively evaluated, focusing on the power shortage during critical power scarcities that exceed the predetermined confidence level. Examining the case shows that in similar severe operational situations, the maximum level of power shortage, ascertained through the power shortage threshold-based evaluation method, is 1909.1 MW, signaling the utmost severity of the most critical power shortage incident. Post the introduction of the CVaR index, the system recorded a severe power shortage risk of 1443.2 MW, highlighting the usual intensity of these shortages in regions of both middle and high risk. Under severe operational conditions, the CVaR excels in reflecting the severity of risk results in the tail region, offering a more reliable metric for assessing extreme risks.
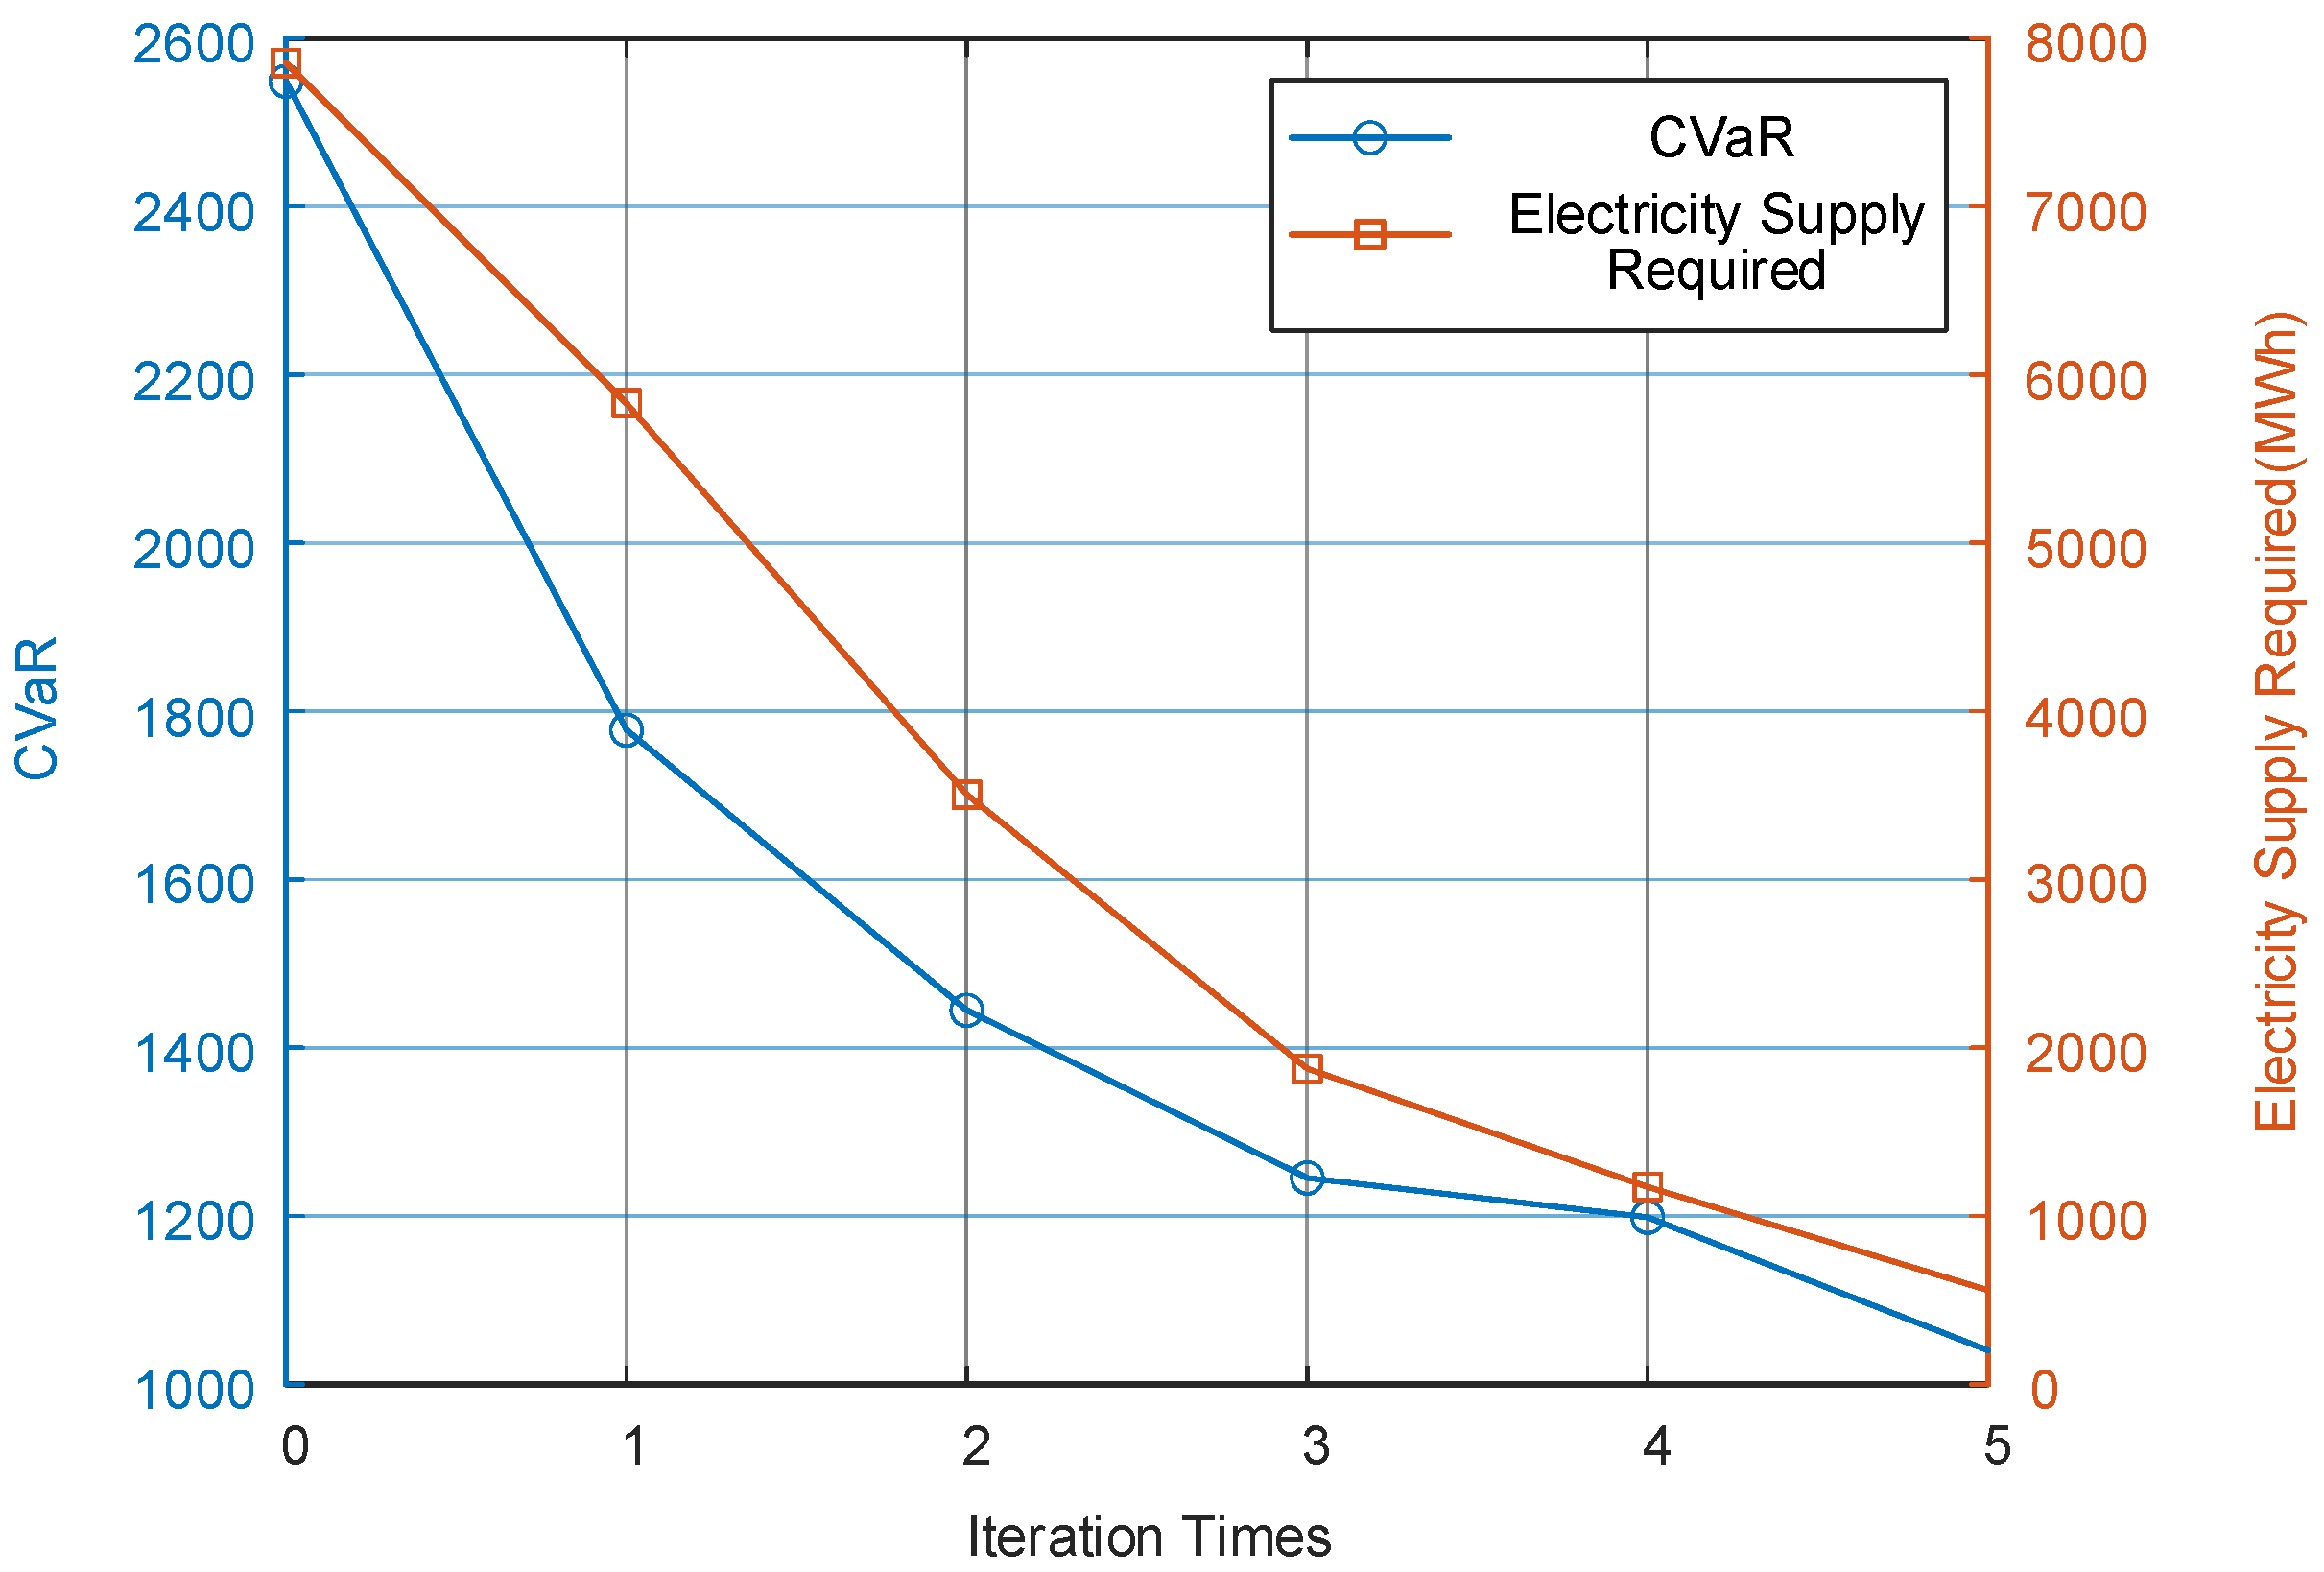
An ongoing analysis is carried out to clarify the tail risk progression principle in critical operational scenarios across different levels of guarantee, focusing on the relationship between CVaR and the degree of power supply assurance. Demonstrated in
Figure 13, the coefficient of variation (CVaR) for the critical operational scenario in that year is 2548.8 MW without the planned power supply guarantee; yet, introducing a directional power supply guarantee during the most severe power shortage reduces the risk factor to a negligible level, and the CVaR, upon reevaluation with similar assurance, falls to 1777.7 MW, indicating a significant decrease in the tail dominant risk.
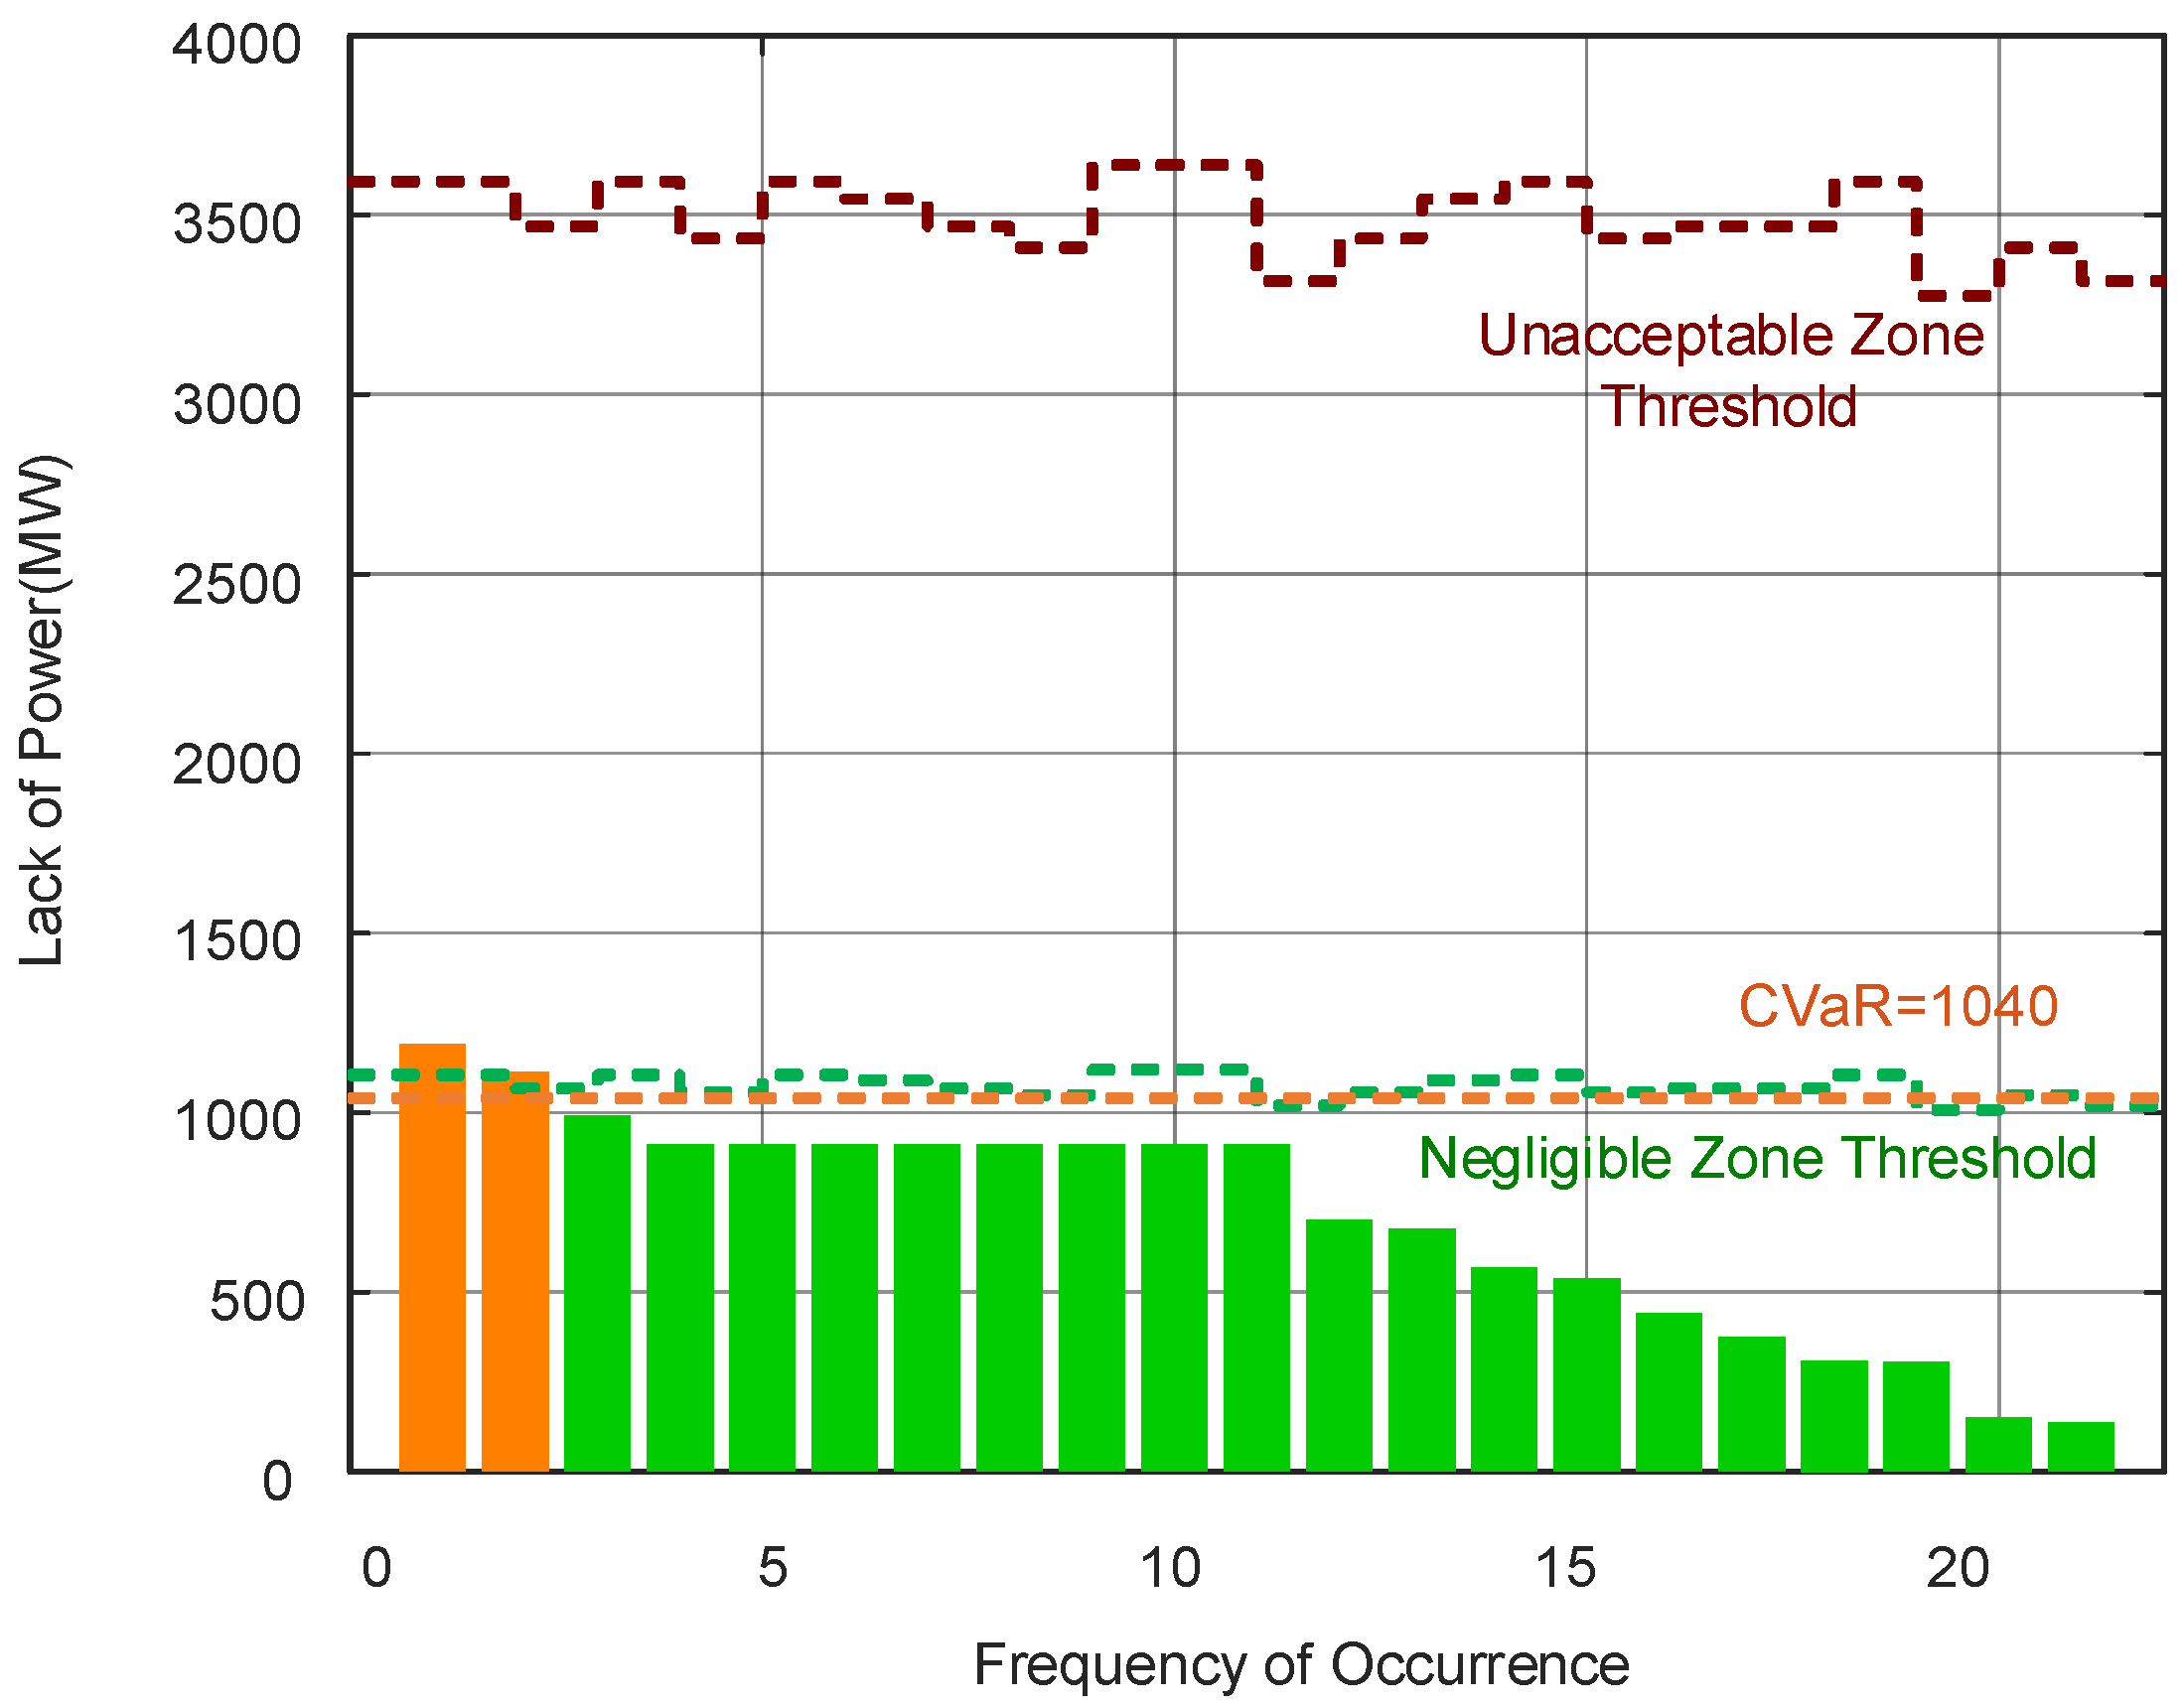
With the intensification of power supply security measures, the CVaR continues to decrease. As depicted in
Figure 14, when the CVaR is reduced to 1040.5 MW after multiple computations, the probability of a disparity between supply and demand in the system’s most extreme operational condition lessens to a negligible degree. This implies that, viewed probabilistically, the critical effects of power scarcities no longer serve as the main risk element for system operation, resulting in the statistical elimination of power shortage hazards in these situations. The previously mentioned guarantee of supply is attainable via conventional approaches such as flexible allocation of resources in the system, gradual energy control, and external power support, all clearly achievable in engineering.
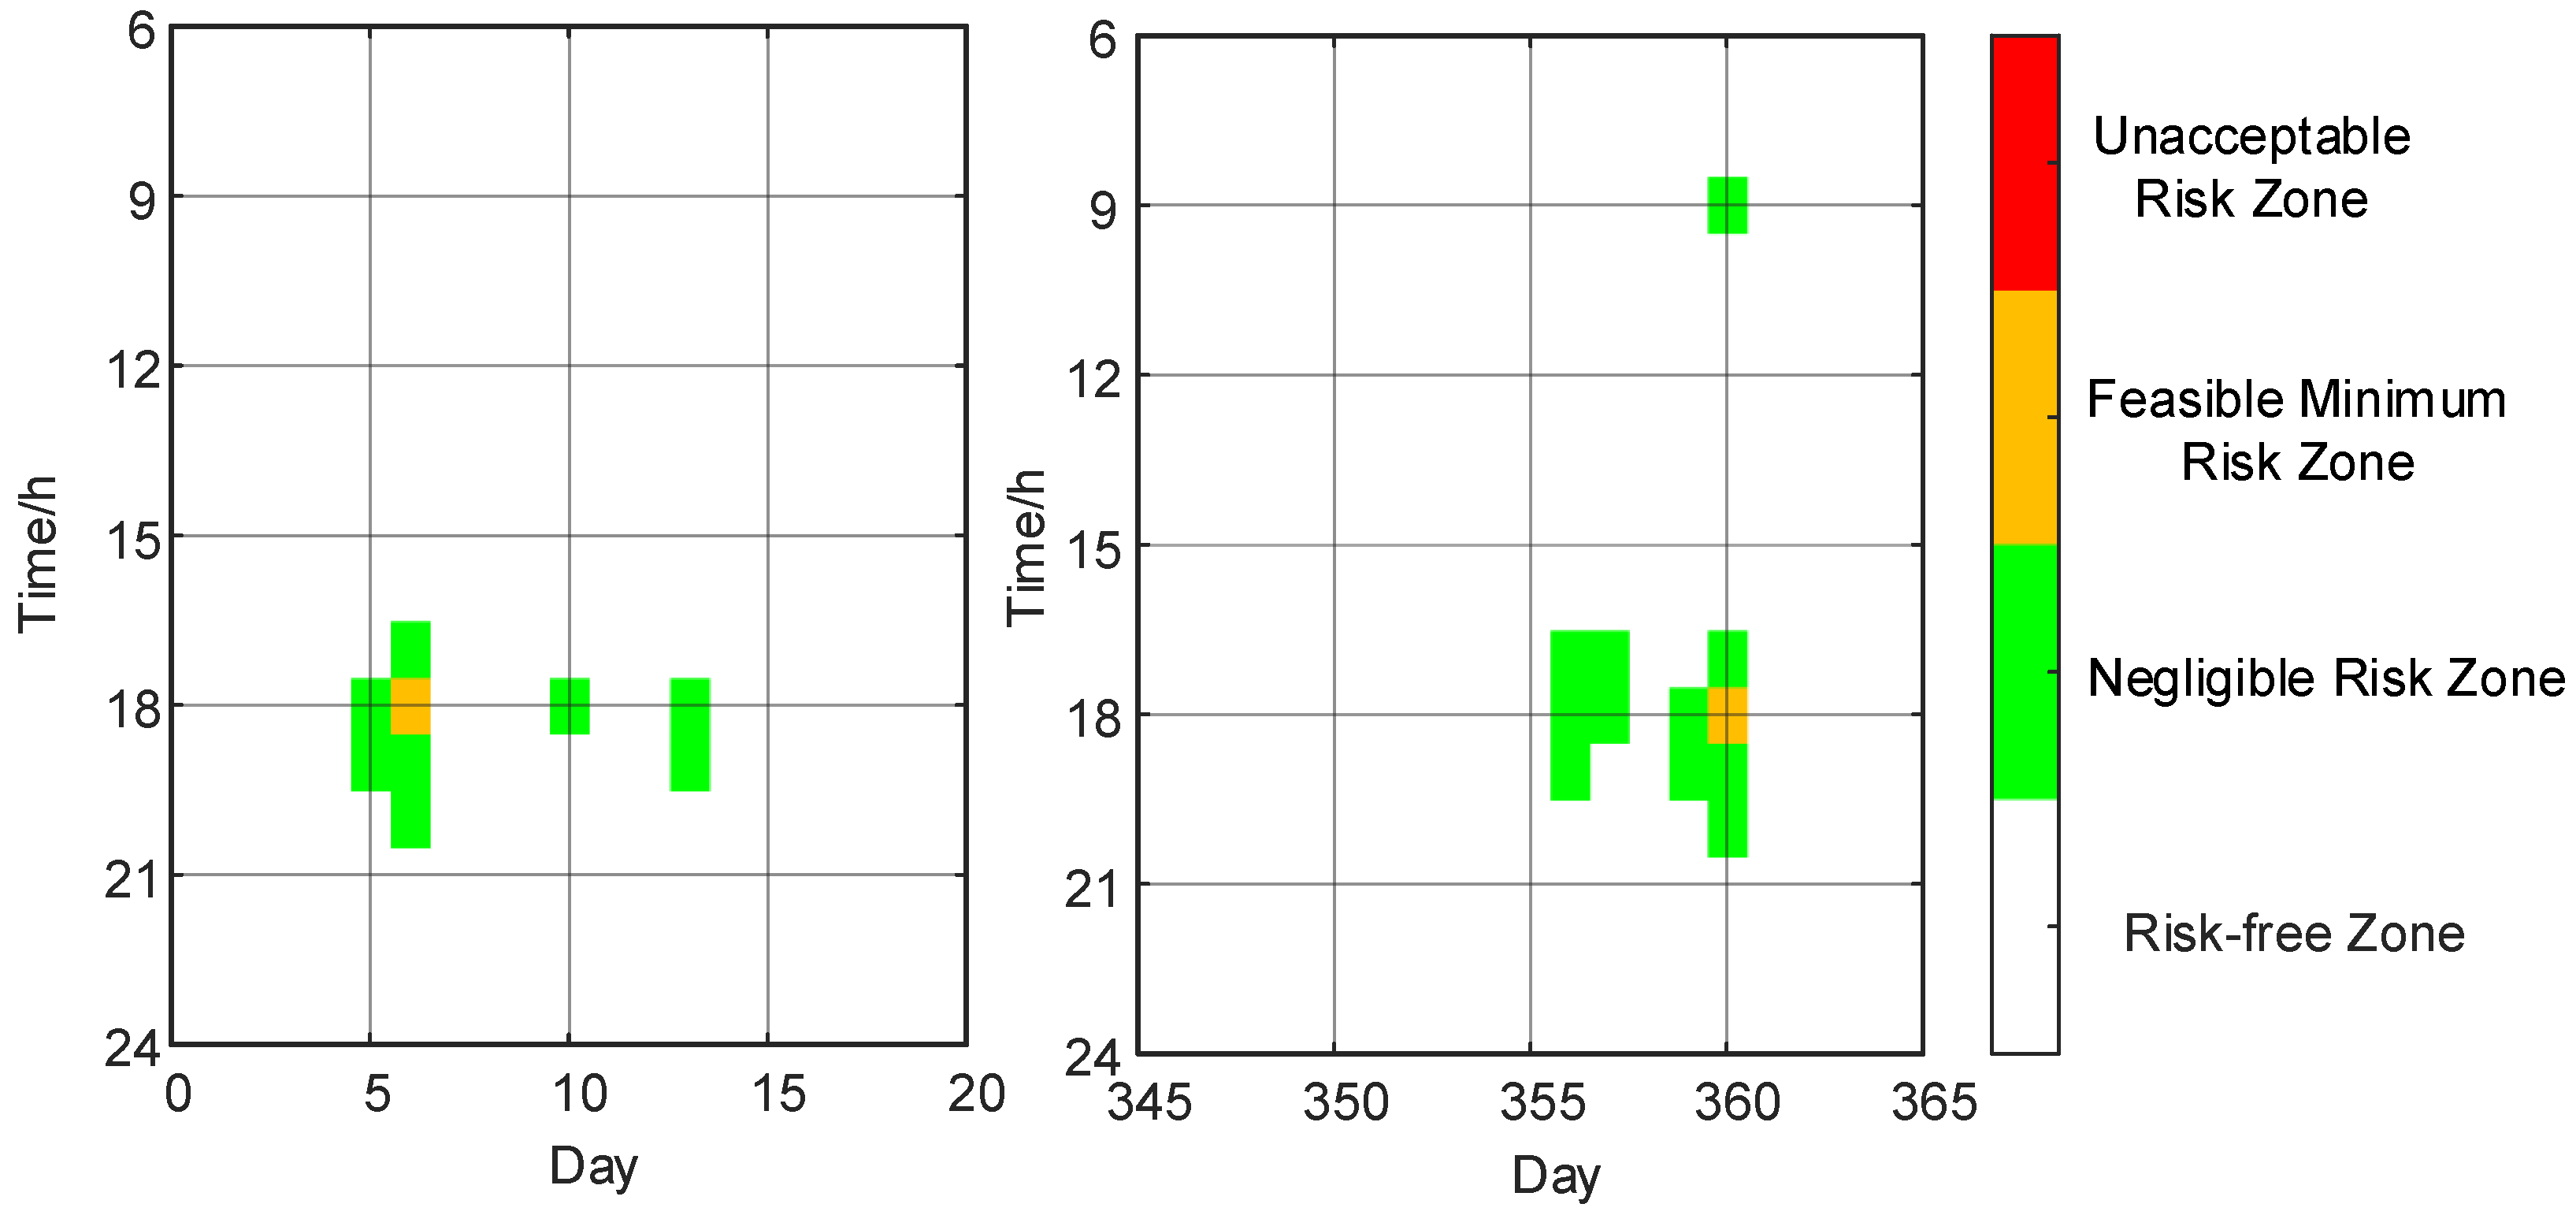
Figure 15 depicts the sequential distribution of critical operational scenarios in the year succeeding the implementation of the power supply assurance. Compared to
Figure 8, there is a significant reduction in critical operational events in the feasible minimum risk area, coupled with an increase in regions with low risk, indicating that power supply assurance tactics effectively reduce the tail risk in severe operational scenarios. Situations entailing intense activities mainly take place at the peak of winter workload, maintaining stable temporal distribution characteristics, although there has been a significant alteration in the risk level structure. Some scenarios, once located in the viable zone of minimal risk, have been reduced to a zone with the same risk level.
The results of the example show that the power supply guarantee based on CVaR k can realize the directional reduction of the tail risk of supply and demand imbalance under the premise of maintaining the timing characteristics of extreme operation scenarios.
5. Conclusions
The research zeroes in on the likelihood of a disparity between supply and demand in large-scale renewable energy networks in extreme scenarios, formulating an evolving ‘identification-classification-quantification’ risk evaluation method, and validates its effectiveness and applicability in engineering through various examples. The key conclusions can be encapsulated thus.
(1) When considering the equilibrium between supply and demand, an extreme operational situation is defined by the peak operational capacity of the net load’s super-adjustable limit. By applying the model that adjusts power supply and limits energy storage, the timing of the critical operation scenario is precisely determined, revealing that its primary source is the stochastic variance in ‘source-load’, where the slight increase in new energy generation is a major driving factor, though not a sufficient precondition.
(2) The ALARP standard classifies the probability of a disparity between supply and demand in critical operational scenarios based on the severity of the power shortage, resulting in the formation of an inappropriate area, a feasible minimum area, and a minimal area. Within the scrutinized system, the associated risk thresholds range from 1100 MW to 3500 MW. In severe operational scenarios, the portrayal of engineering hazards is accomplished, pinpointing the specific target zone for additional assessment.
(3) The CVaR index, focusing on the tail amplification characteristics of power scarcity risk during critical operational scenarios, is introduced to assess the expected state of the power shortage’s tail region. The case study results indicate that the projected CVaR value reaches 2548.8 MW, implying a mean power shortfall of approximately 2548.8 MW under the most extreme 5% operational conditions. This makes up for the limitations of the traditional threshold-based method in defining severe risk.
(4) The results suggest that the risk assessment method based on CVaR can precisely measure the variable aspects of power shortage risks in critical operational scenarios. Following the implementation of particular power-supply guarantees for severe power scarcities, the CVaR was reduced from 2548.8 MW to 1777.7 MW. With the enhancement of the guarantee level, the CVaR drops to 1040.5 MW, resulting in a situation where the likelihood of an imbalance between supply and demand diminishes. Enhancing the level of guarantee allows for an in-depth statistical evaluation of the risk associated with power shortages, providing a numerical basis for formulating future risk management approaches.
In conclusion, the risk assessment method proposed in this document clearly outlines the significant operational dangers linked to large-scale renewable energy systems, taking into account the effects of supply-demand differences, and provides solid support for the system’s understanding of these severe risks and its decision-making processes. Combining these relevant methods with flexible research in resource planning and operational tactics can amplify their significance in engineering contexts.