Article

A Technology-Centric Cyber Resilience Evaluation Framework Using MITRE D3FEND for Bridging the Policy Technology Gap in Financial and Enterprise Environments

1
Department of Computer Engineering, Sejong University, Seoul 05006, Republic of Korea
2
Department of Convergence Engineering for Intelligent Drones, Sejong University, Seoul 05006, Republic of Korea
3
Defense AI Cyber Convergence Research Institute, Sejong University, Seoul 05006, Republic of Korea
*
Author to whom correspondence should be addressed.
Electronics 2026, 15(12), 2554; https://doi.org/10.3390/electronics15122554
Submission received: 5 May 2026 / Revised: 16 May 2026 / Accepted: 1 June 2026 / Published: 9 June 2026

Abstract

Existing Cyber Resilience Assessment Guidelines, including those of the Bank of Korea (BoK), focus on governance-oriented compliance and lack quantitative criteria for measuring the operational effectiveness of security technologies—a Policy–Technology Gap also common in general enterprise settings. To address this gap, this study proposes D3-CREF, a technology-centric cyber resilience evaluation framework that maps the MITRE D3FEND taxonomy to financial security domains and introduces a Normalized Resilience Index (NRI) aggregating four dimensions—Coverage, Maturity, Automation, and Timeliness—via a closed-form weighted geometric mean with AHP-elicited weights (consistency ratio CR = 0.04). All NRI indicators are anchored to MITRE ATT&CK techniques and exemplar CVE entries, enabling threat-informed measurement. The framework was validated through a three-round Delphi study with 50 experts (Kendall’s W = 0.78, p < 0.001; Cronbach’s α = 0.89; CVR 0.68–0.92) and a Cyber Range-based simulation. For three institutions with identical BoK scores (92/100), NRI yielded discriminative values of 0.83, 0.44, and 0.09 (CV = 0.68 vs. 0.00 for the baseline), confirming a shift from compliance-based to performance-driven assessment.

1. Introduction

As the sophistication and frequency of cyber-attacks have rapidly increased, a fundamental reassessment of existing cybersecurity paradigms is required [1,2]. Financial institutions are directly exposed to cyber threats due to the advancement and interconnectedness of digital financial services, making new security strategies essential to guarantee the confidentiality, integrity, and availability of information assets [3]. The paralysis of a financial system can extend beyond mere corporate losses to become a systemic risk that threatens the trust and stability of the entire national economy.
In this context, regulatory bodies have established frameworks to systematically evaluate an organization’s crisis response and recovery capabilities. In the domestic financial sector of Korea, the Cyber Resilience Assessment Guideline published by the Bank of Korea (BoK) has served as a key standard [4]. However, this guideline primarily focuses on qualitative assessments such as governance and procedural compliance and does not validate the operational efficacy of the actual technology environment against advanced threats. Specifically, it relies on Proof of Existence (verifying policy presence) rather than Proof of Performance, lacking objective performance-based metrics to evaluate technical control maturity and automation levels. This creates a Policy–Technology Gap structural discrepancy between policy recommendations and the actual level of technical defense in the field [5]. Advanced Persistent Threats (APTs) exploit precisely these technological gaps to infiltrate organizations, making it more urgent than ever to establish an evaluation system that links policy with technology [6].
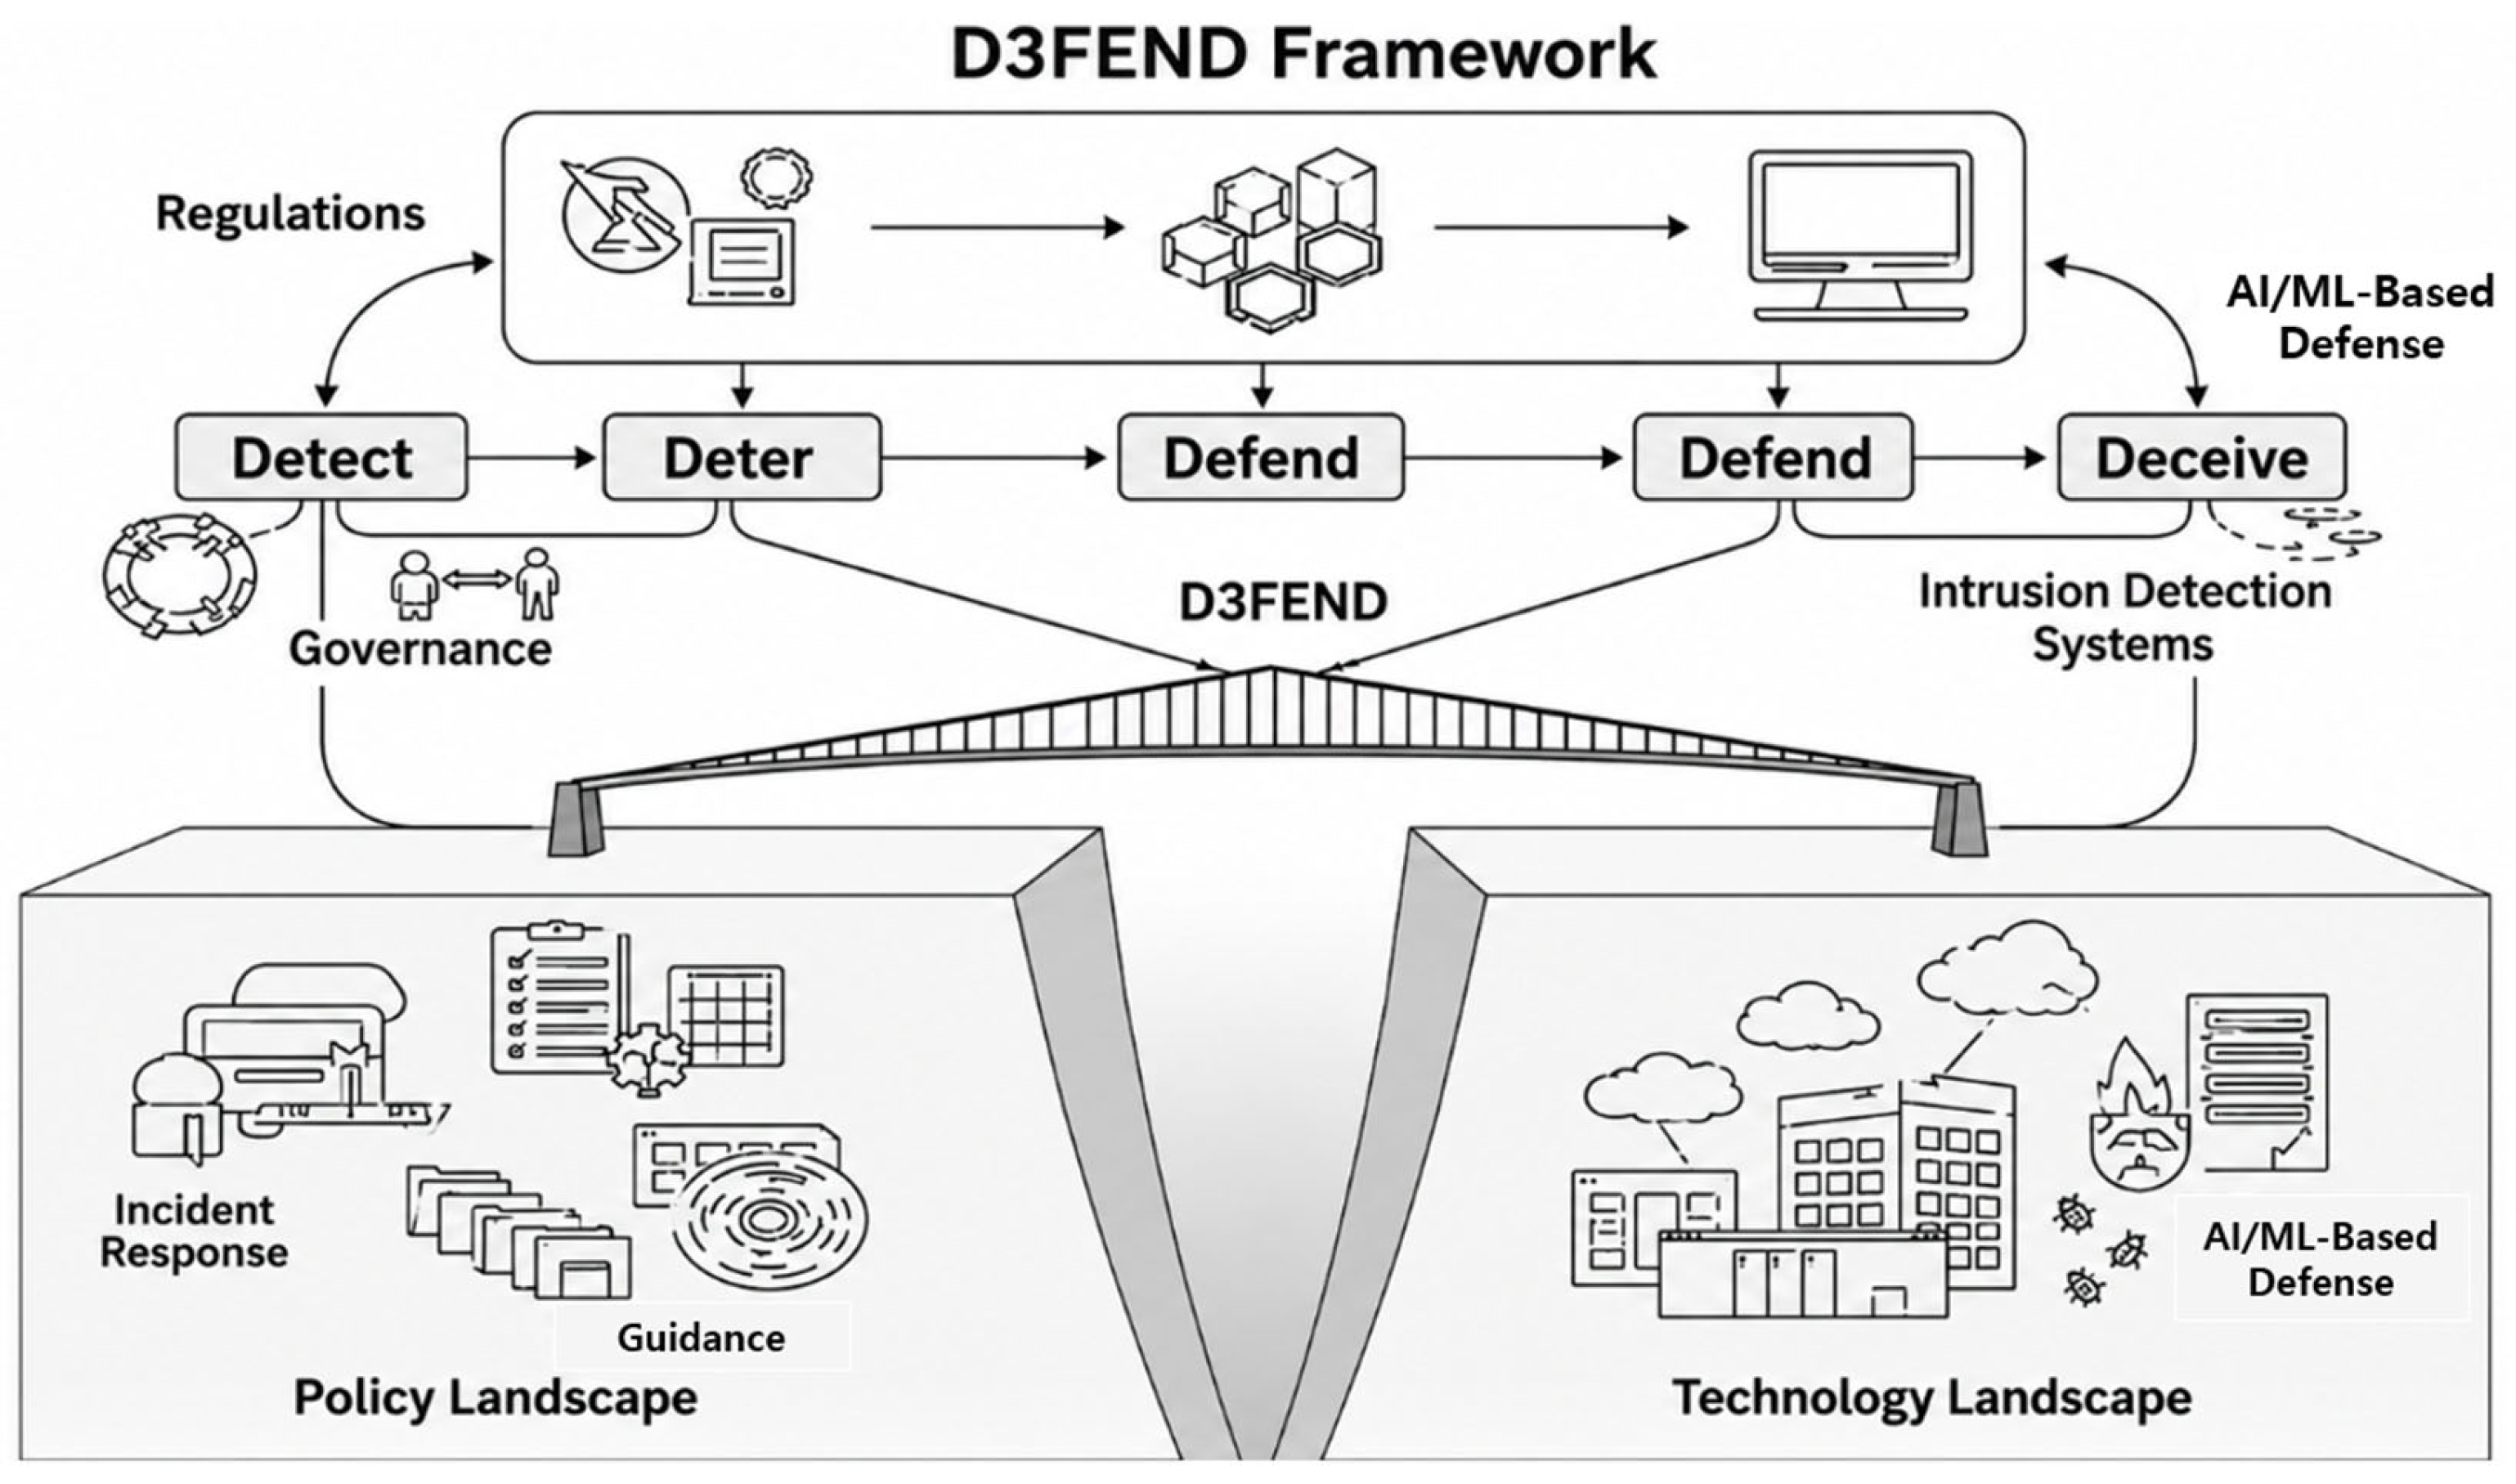
This study aims to resolve this gap; the underlying concept is visualized in Figure 1. We propose a technology-centric cyber resilience evaluation framework based on the MITRE D3FEND framework. By reconfiguring defensive domains and establishing quantitative metrics, including a Normalized Resilience Index (NRI), implementation maturity, and degree of automation, this research provides a practical supplement to existing guidelines. Specifically, this paper makes the following contributions: (i) a three-principle mapping methodology (Functional Correspondence, Technical Feasibility, Indicator Convertibility) that converts qualitative guideline items into D3FEND-anchored indicators; (ii) a closed-form formal definition of the NRI, with weights elicited from a Delphi panel via the Analytic Hierarchy Process (AHP) and an explicit consistency check; (iii) a three-round Delphi validation reporting Kendall’s W, Cronbach’s α, and inter-round stability—statistical evidence beyond what prior work in this line has provided; and (iv) a reproducible simulation-based case study on a phishing-to-exfiltration attack chain that quantifies the discriminative gain of the proposed framework over the baseline guideline.
Novelty positioning. We acknowledge that MITRE ATT&CK, D3FEND, AHP, and Delphi validation are each individually well established. The novelty of this work lies not in proposing a new primitive but in the precise way these primitives are composed and constrained to solve a problem that none of them solves alone. Specifically, (a) the three-principle mapping (Functional Correspondence, Technical Feasibility, Indicator Convertibility) is a new admissibility test that converts a regulatory guideline item into a measurable indicator only when all three conditions hold—no prior work in this line imposes this combined test; (b) the four-dimensional weighted geometric mean of Equation (1) operationalizes the principle that a missing dimension cannot be compensated by surplus in others, a property that linear aggregations (used in Cho et al. [7] and SOC-CMM) do not enforce; (c) the mandatory ATT&CK–CVE anchoring at the indicator level (Section 3.5) and the quarterly maintenance cycle (Section 3.3) ensure threat-currency, which descriptive D3FEND mappings such as ISADM [8] do not provide; (d) the framework is the first to be control-item–level mapped to a binding national financial-sector guideline (BoK), enabling direct regulatory traceability that voluntary frameworks (NIST CSF, SOC-CMM) cannot offer. The combination produces a measurable, threat-anchored, regulator-traceable, and missing-data-aware index, which is materially different from any of its constituent primitives and from any prior composition of them, as documented in the extended comparison in Section 5. A preliminary version of this work appeared in our earlier domestic publication [9], which is substantially extended here by the formal NRI definition, the Delphi validation with 50 experts, the Cyber Range case study, and the comparative analysis in Section 5.
The conceptual framework illustrates the dynamic transition from a compliance-oriented Policy Landscape to a capability-oriented Technology Landscape. The bridge, established through the D3FEND framework, addresses the structural Policy–Technology Gap where traditional governance fails to measure technical maturity. By aligning regulatory expectations with operational realities, the model facilitates a shift from binary documentation checks to continuous, performance-based validation of cyber resilience.
The remainder of this paper is organized as follows. Section 2 reviews related work on cyber resilience frameworks, the BoK guideline, and the MITRE ATT&CK/D3FEND ecosystem. Section 3 details the proposed mapping methodology, the formal NRI definition with normalization-threshold calibration, the AHP-based weight elicitation, and a worked end-to-end example. Section 4 presents logical, expert (Delphi), and simulation-based validation. Section 5 provides an extended comparison with recent quantitative cyber-resilience and SOC-maturity frameworks (2023–2026). Section 6 discusses operational trade-offs—false positives, alert fatigue, analyst workload, and deployment complexity—and articulates the mechanism by which the framework operationalizes the shift to performance-based assessment. Section 7 concludes and outlines limitations and future work.

2. Related Works

The evolution of automated cybersecurity analysis has shifted from static, rule-based systems to dynamic, AI-driven frameworks capable of interpreting complex adversarial behaviors. This section reviews the current state of research in cyber resilience frameworks, the structure of the BoK guideline, and the integration of MITRE ATT&CK and D3FEND for technology-centric defense.

2.1. Existing Approaches to Cyber Resilience Frameworks

Cyber resilience is the ability of an organization to anticipate, withstand, recover from, and adapt to cyber-attacks or system failures [10]. Frameworks such as the NIST Cybersecurity Framework (CSF) [11] and ENISA’s resilience framework [12] provide comprehensive conceptual foundations and governance-centric approaches. Complementary recent NIST guidance has emphasized that, beyond such govern-ance-level constructs, the implementation of a Zero Trust Architecture provides concrete technical patterns—continuous verification, least-privilege access, and pervasive telem-etry—that operationalize resilience at the infrastructure level [13]. However, as detailed in Table 1, these frameworks have distinct limitations in quantitatively assessing the implementation level of technical controls or the effectiveness of defensive technologies in an operational environment. The Korean financial sector’s guidelines are similarly skewed towards qualitative assessment, revealing a Policy–Technology Gap in measuring the real-world effectiveness of security technologies [4].
Recent quantitative work has begun to address these gaps. Cho et al. [7] proposed an availability-based Normalized Resilience Index using AUC normalization of service-level metrics during attack and recovery phases. Alhidaifi et al. [14] developed a probabilistic estimation model that quantifies resilience under stochastic threat assumptions. Mushtaq et al. [15] systematically reviewed Zero Trust Architecture implementations and highlighted the need for measurable maturity indicators. While these studies advance the quantitative direction, none has been directly mapped to a regulatory guideline at the control-item level. This study utilizes the MITRE D3FEND framework [16] to enable the technology-centric, quantitative assessment that existing frameworks lack.
A second cluster of recent work (2023–2026) focuses on operationalizing threat-informed defense in regulated sectors. Podlesnik et al. [17] proposed an AHP-based integration of cyber threat intelligence and threat modeling for cyber resilience assessment; their work establishes AHP as a sound aggregation method for threat-informed scoring but does not address D3FEND-anchored measurement. Moreira et al. [18] applied AHP with sensitivity analysis to cybersecurity risk assessment, providing the methodological foundation for the weight-perturbation test reported in Section 4.2.4. Almazroi et al. [19] proposed an AHP-based impact–feasibility framework for prioritizing cybersecurity controls, further confirming AHP’s discriminative power for control selection in regulated environments. Roy et al. [20] surveyed ATT&CK applications in research and practice and identified the absence of standardized quantitative aggregation as the principal gap—the gap that the present NRI directly addresses. Hasan et al. [8] introduced the ISADM model integrating STRIDE, ATT&CK, and D3FEND for threat modeling, demonstrating that the ATT&CK–D3FEND ontology is sufficiently mature for evaluative use, but stopping at descriptive threat-to-defense mapping rather than producing an aggregated score. Hussey et al. [21] re-examined the methodological foundations of Cronbach’s α in empirical studies and called for reporting item-level statistics alongside the aggregate, a guidance that we have adopted in Section 4.2.3.
Taken together, the 2023–2026 literature establishes three converging requirements that the present framework simultaneously satisfies: threat-informed measurement at the ATT&CK technique level, AHP-grounded aggregation with sensitivity analysis, and explicit operational maturity scoring. The principal differentiator of this work is that these requirements are composed into a single, control-item–level mapping to a binding national regulatory guideline, which the cited literature collectively recognizes as missing.

2.2. The Bank of Korea Cyber Resilience Assessment Guidelines

The Cyber Resilience Assessment Guidelines released in January 2018 was designed to enhance the cyber threat response capabilities and operational continuity of financial institutions in Korea [4]. The guideline is structured into eight domains: Governance, Identification, Protection, Detection, Response & Recovery, Testing, Situational Awareness, and Learning & Evolving. It interprets cyber resilience not merely as a set of security technologies but as an integrated part of an organization’s strategic capabilities.
However, this policy-centric approach has several technical limitations. First, it is difficult to judge the actual level of technology implementation or response capability based solely on the existence of policies and procedures. For example, the presence of an intrusion detection system is checked, but its technical performance metrics—such as detection accuracy, false positive/negative rates, and Mean Time to Detect (MTTD)—are not considered. Second, there is a lack of quantitative criteria for automation-based threat response capabilities or real-time recovery systems. Third, the guideline lacks integration with modern threat-based analysis frameworks such as MITRE ATT&CK or defensive frameworks such as MITRE D3FEND. Consequently, while valuable as a policy-based tool, it is insufficient for quantitatively assessing the performance and maturity of security technologies.

2.3. Research on MITRE ATT&CK and D3FEND Frameworks

The MITRE ATT&CK is a globally recognized knowledge base of adversary tactics, techniques, and procedures (TTPs) based on real-world observations [2,6]. The framework is structured as a matrix of tactics × techniques, with each technique linked to detection guidance, data sources, and observed APT groups. ATT&CK has become the de facto reference for adversary emulation and purple-team exercises, with recent work also exploring knowledge-graph representations of the framework to support systematic threat–defense mapping [22]. Previous research has attempted to integrate ATT&CK with defensive strategies, such as mapping it to a Zero Trust Architecture to improve cyber resilience evaluation metrics [5,15]. While these studies presented an important approach to linking policy and technology, they also highlighted the need for a more systematic methodology for selecting and standardizing quantitative metrics such as MTTD and MTTR.
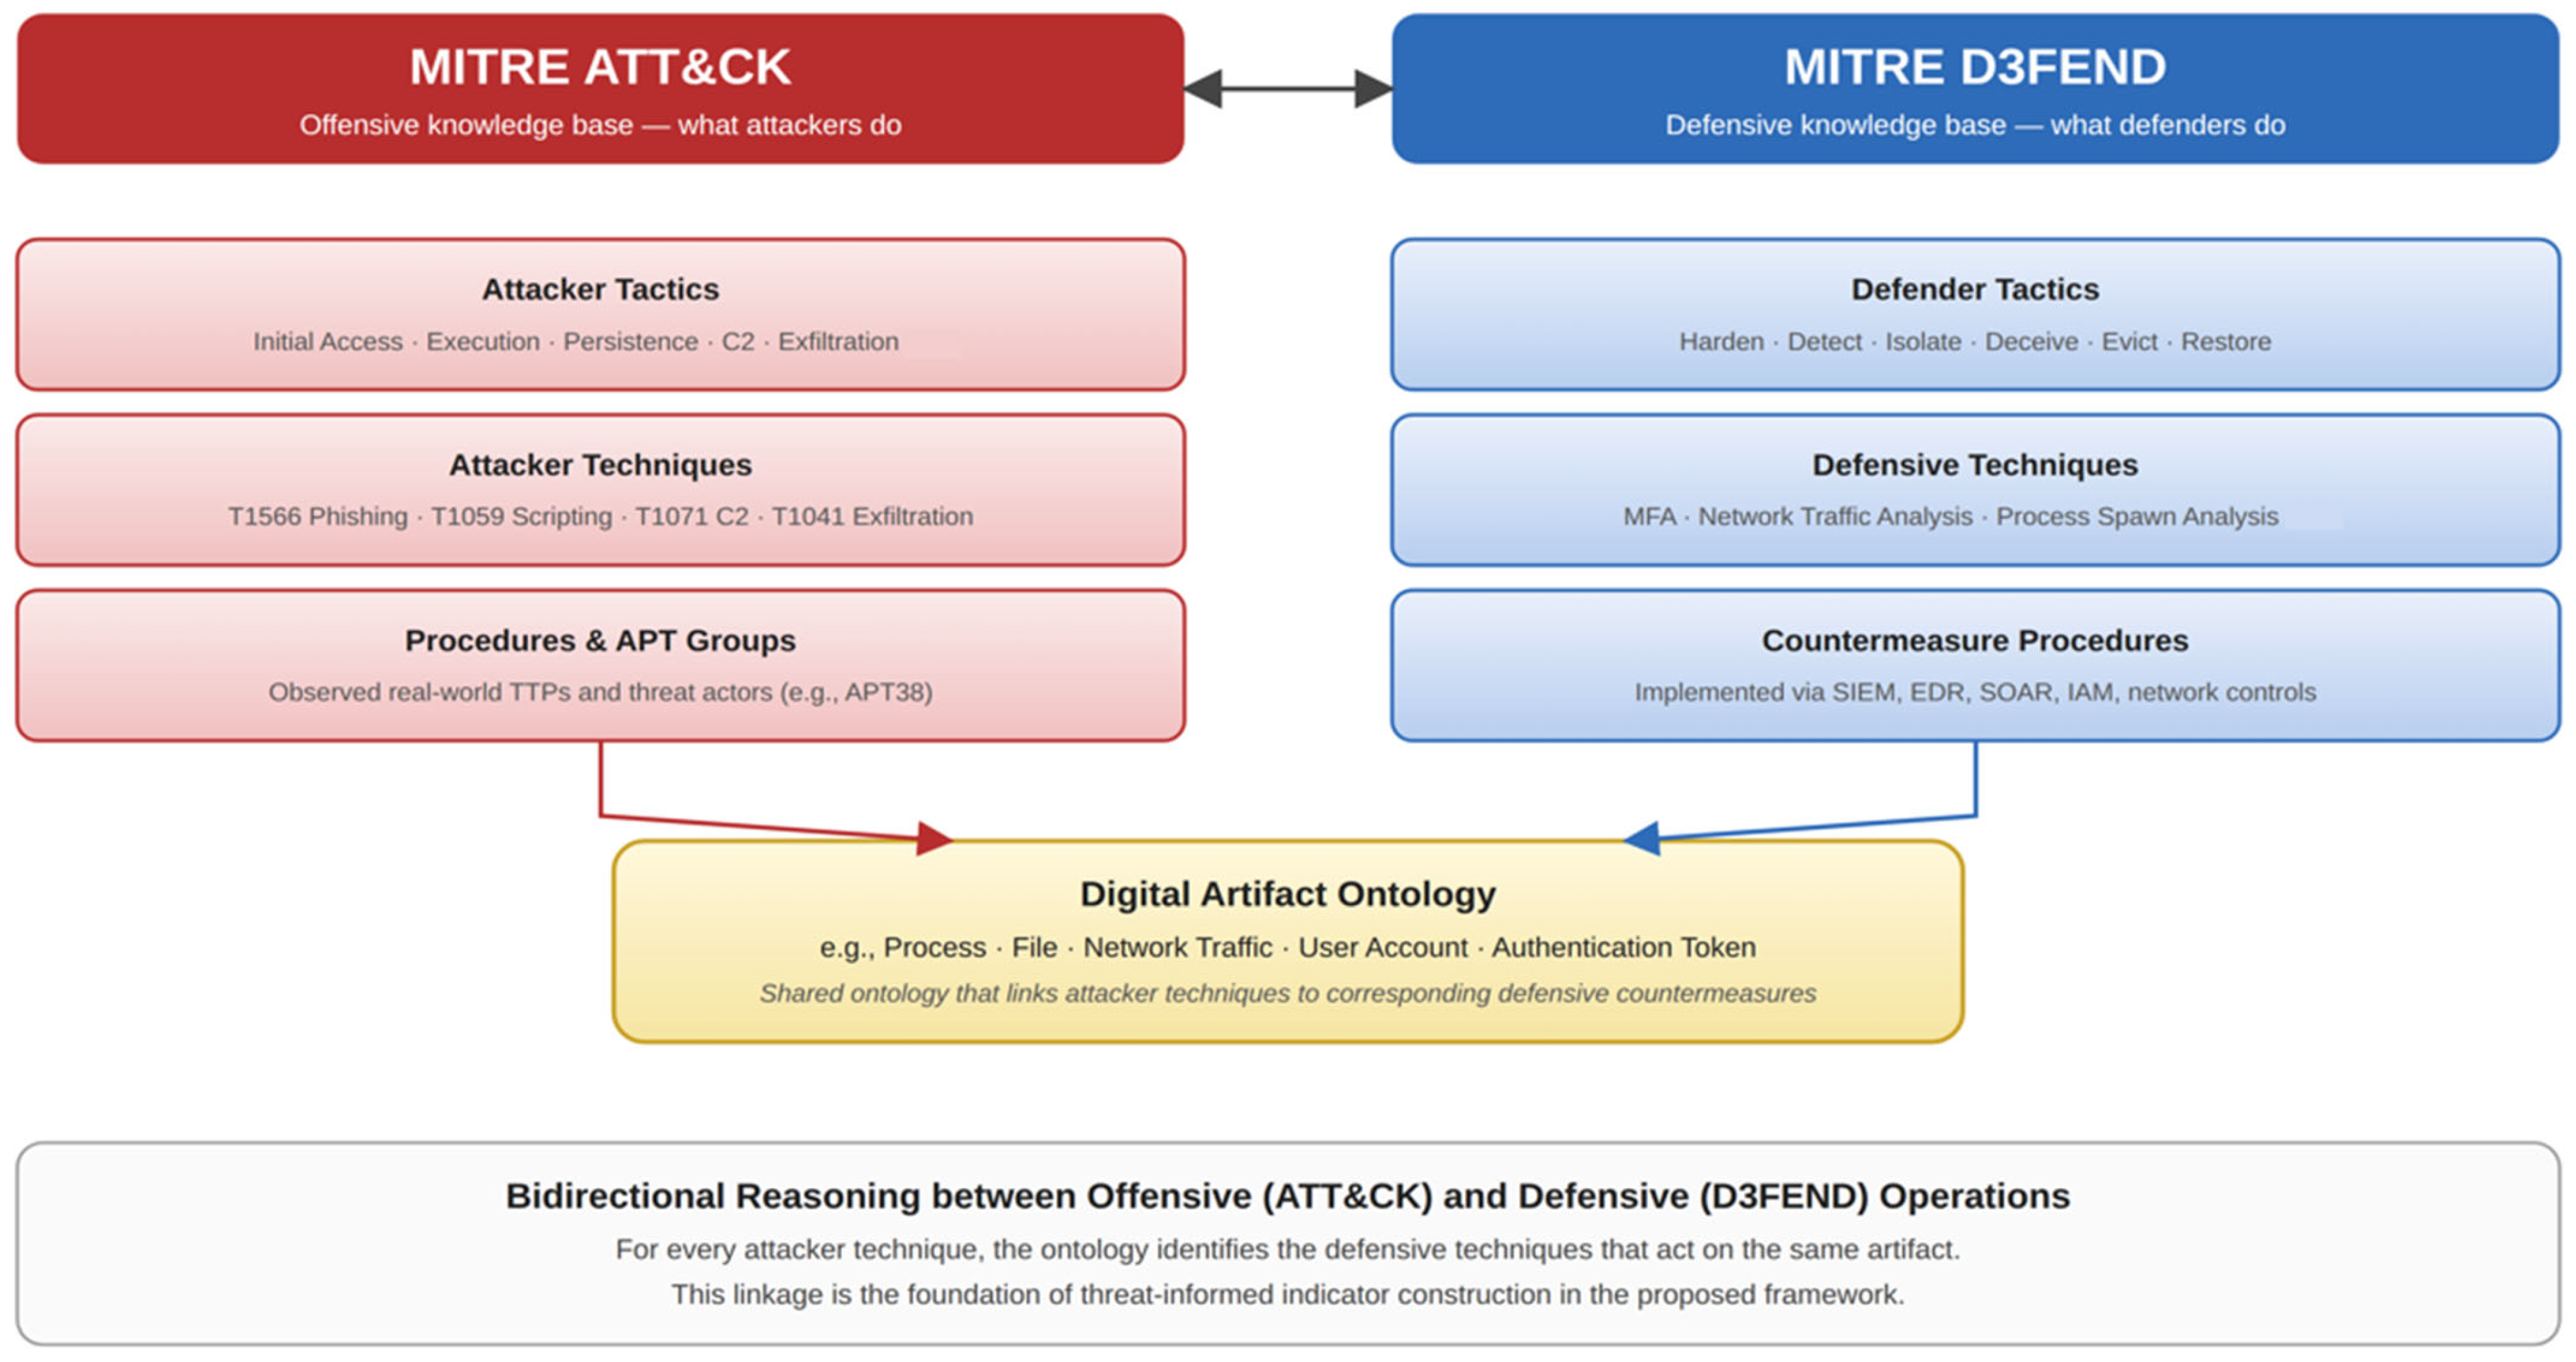
More recent efforts have focused on integrated analysis of MITRE ATT&CK and its defensive counterpart, D3FEND, to visualize the relationship between attacker and defender techniques, as shown in Figure 2 [6,16]. This approach deepens the understanding of cyber threats and helps specify defense strategies. However, there has been a lack of cases where these integrated models are practically linked with Korean domestic policy guidelines or financial-institution evaluation systems. This study fills this gap by applying the ATT&CK–D3FEND linkage to the evaluation items of the cyber resilience guidelines.
Figure 2 depicts the functional mapping between adversarial behaviors (ATT&CK) and proactive countermeasure techniques (D3FEND). This integrated analysis visualizes the direct correspondence between specific attacker TTPs and their corresponding defensive mitigations. Within the proposed framework, this relationship serves as the basis for threat-informed evaluation, ensuring that resilience metrics are grounded in real-world defensive efficacy rather than isolated technical requirements.

2.4. The D3FEND Framework for Technology-Centric Defense

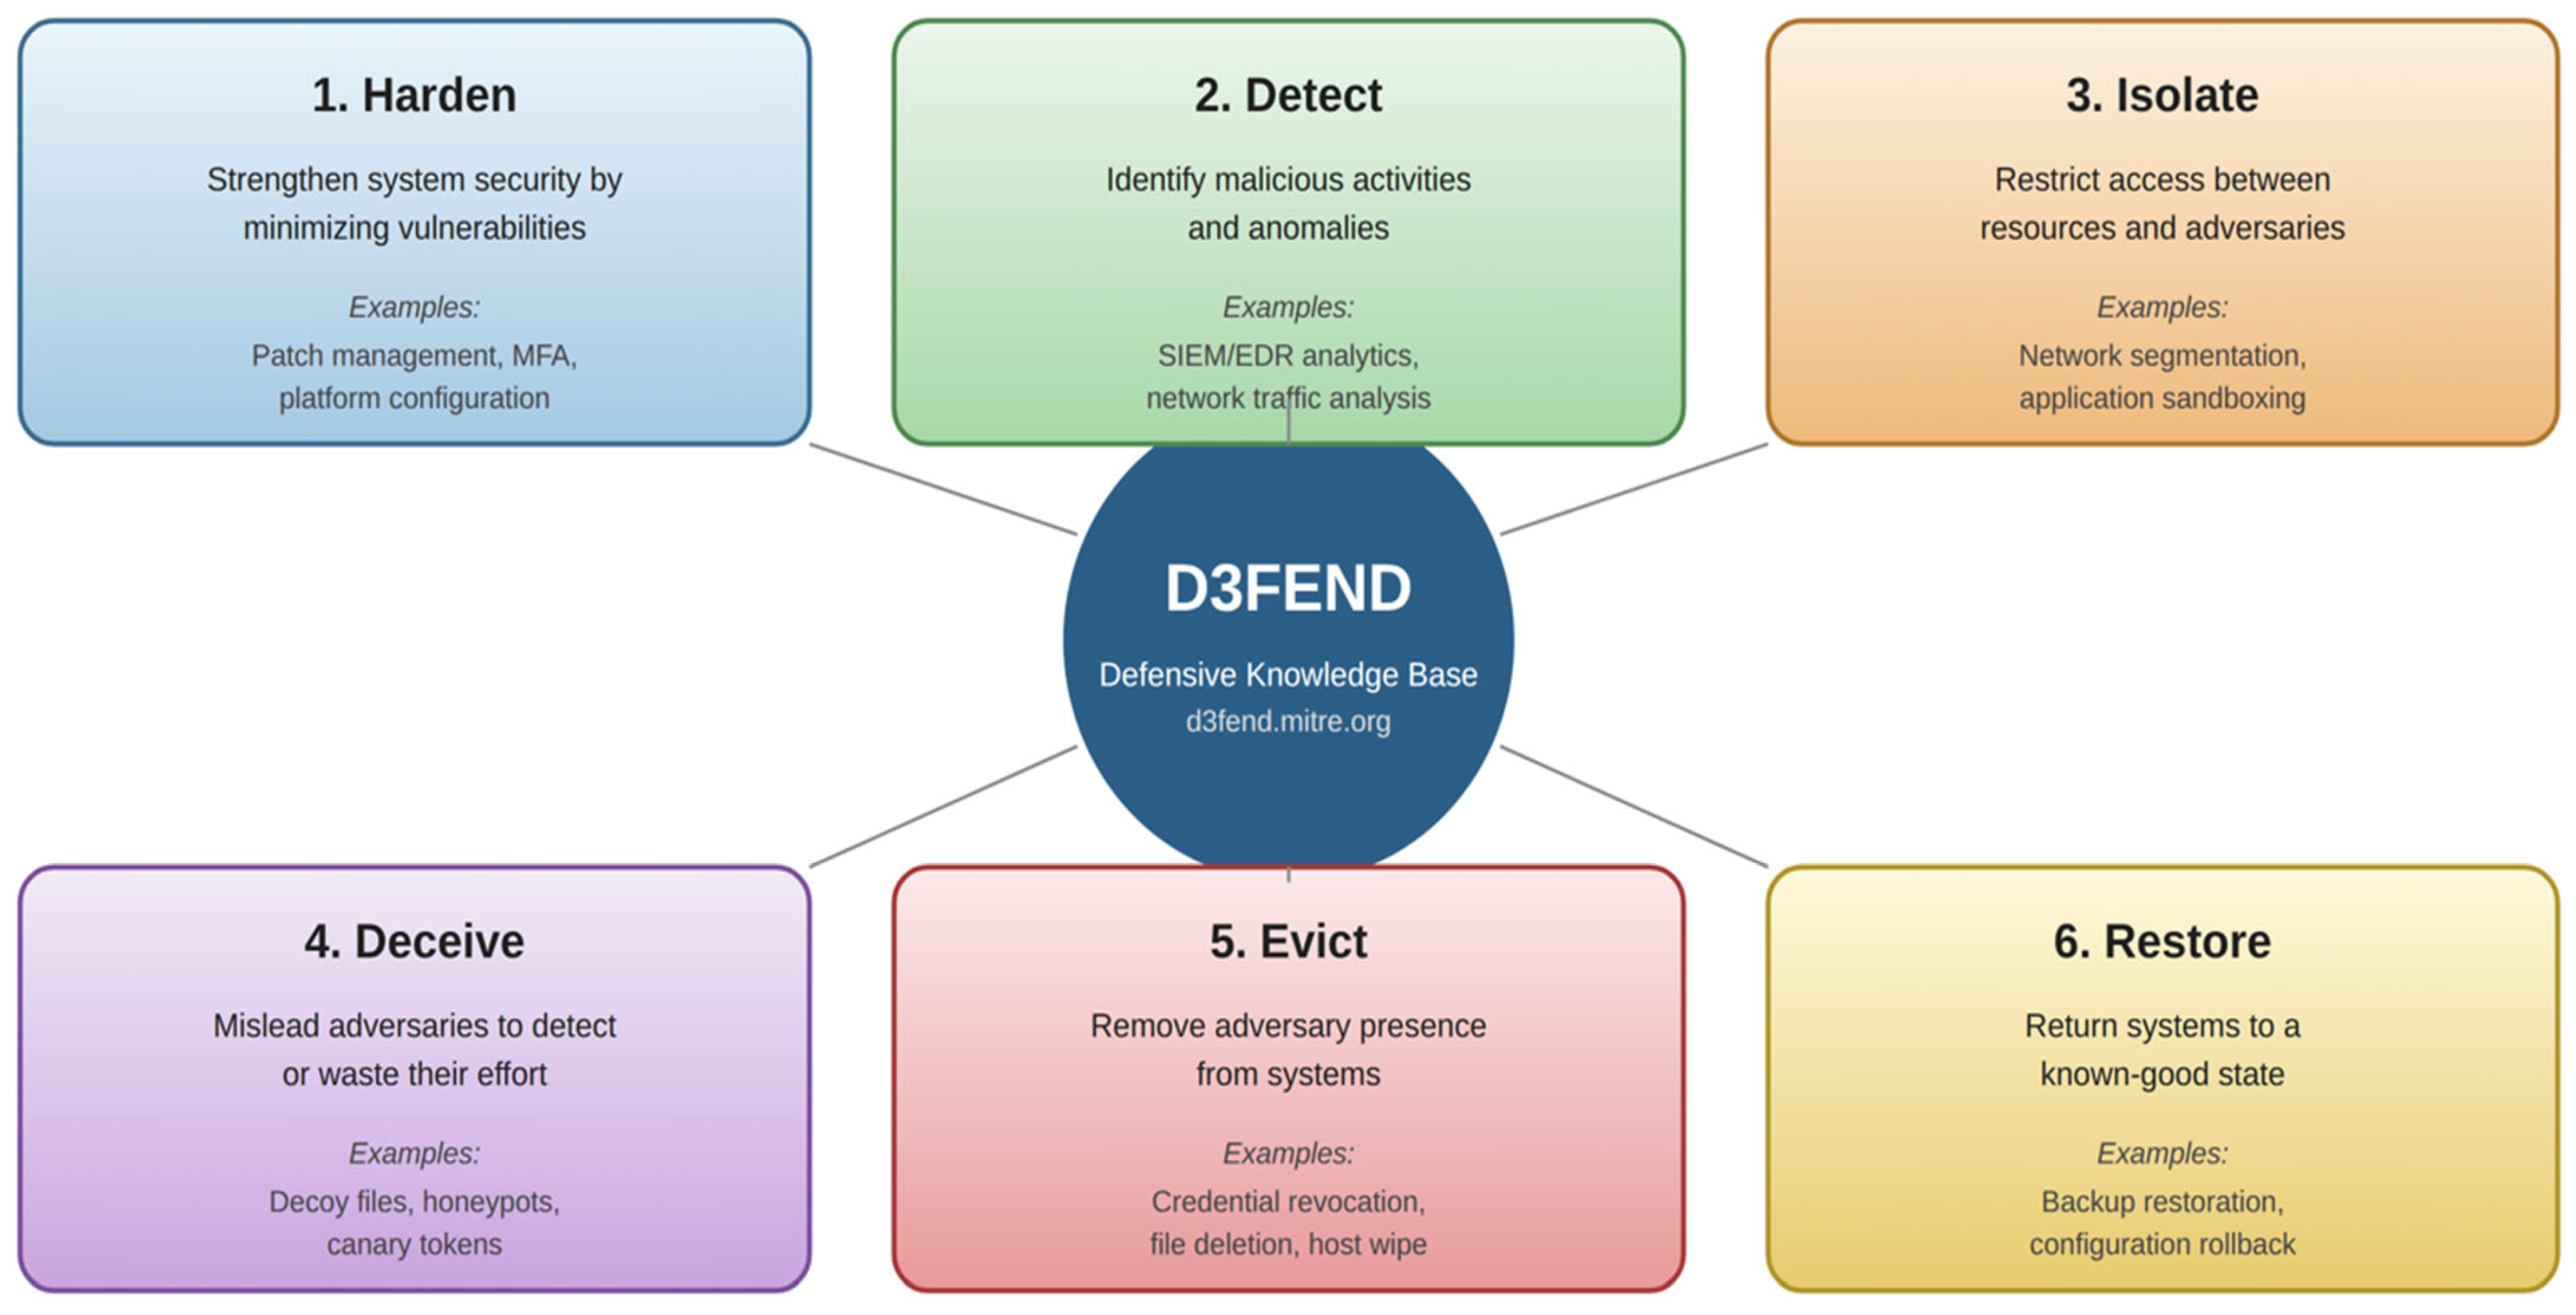
MITRE D3FEND is a knowledge base of cybersecurity countermeasure techniques, created as a counterpart to the ATT&CK framework from a defender’s perspective [16]. D3FEND categorizes defensive activities into high-level technical domains—Hardening, Detection, Isolation, Deception, Response and Recovery, and Analytics—as illustrated in Figure 3. Crucially, D3FEND techniques are linked to ATT&CK techniques via a digital-artifact ontology, enabling bidirectional reasoning between offensive and defensive operations.
Unlike previous evaluations that focused on policy compliance, D3FEND is designed to articulate not only what is being defended but also how it is being defended from a technical standpoint [6]. While early applications were limited to product selection or SOC design [13,15], recent studies have begun to use D3FEND to structure and quantify an organization’s defensive technology coverage, redundancy, and automation potential [20]. Researchers have proposed frameworks for evaluating SOC defenses by structuring them with D3FEND technology groups and assessing metrics such as response speed and automation feasibility [8]. These studies show that D3FEND can serve as a practical tool for linking operational security with quantitative assessment. However, they have not specifically addressed its direct integration with a policy-based evaluation system such as the one for financial institutions, a gap this research directly addresses.

3. Proposed Method

3.1. Research Design

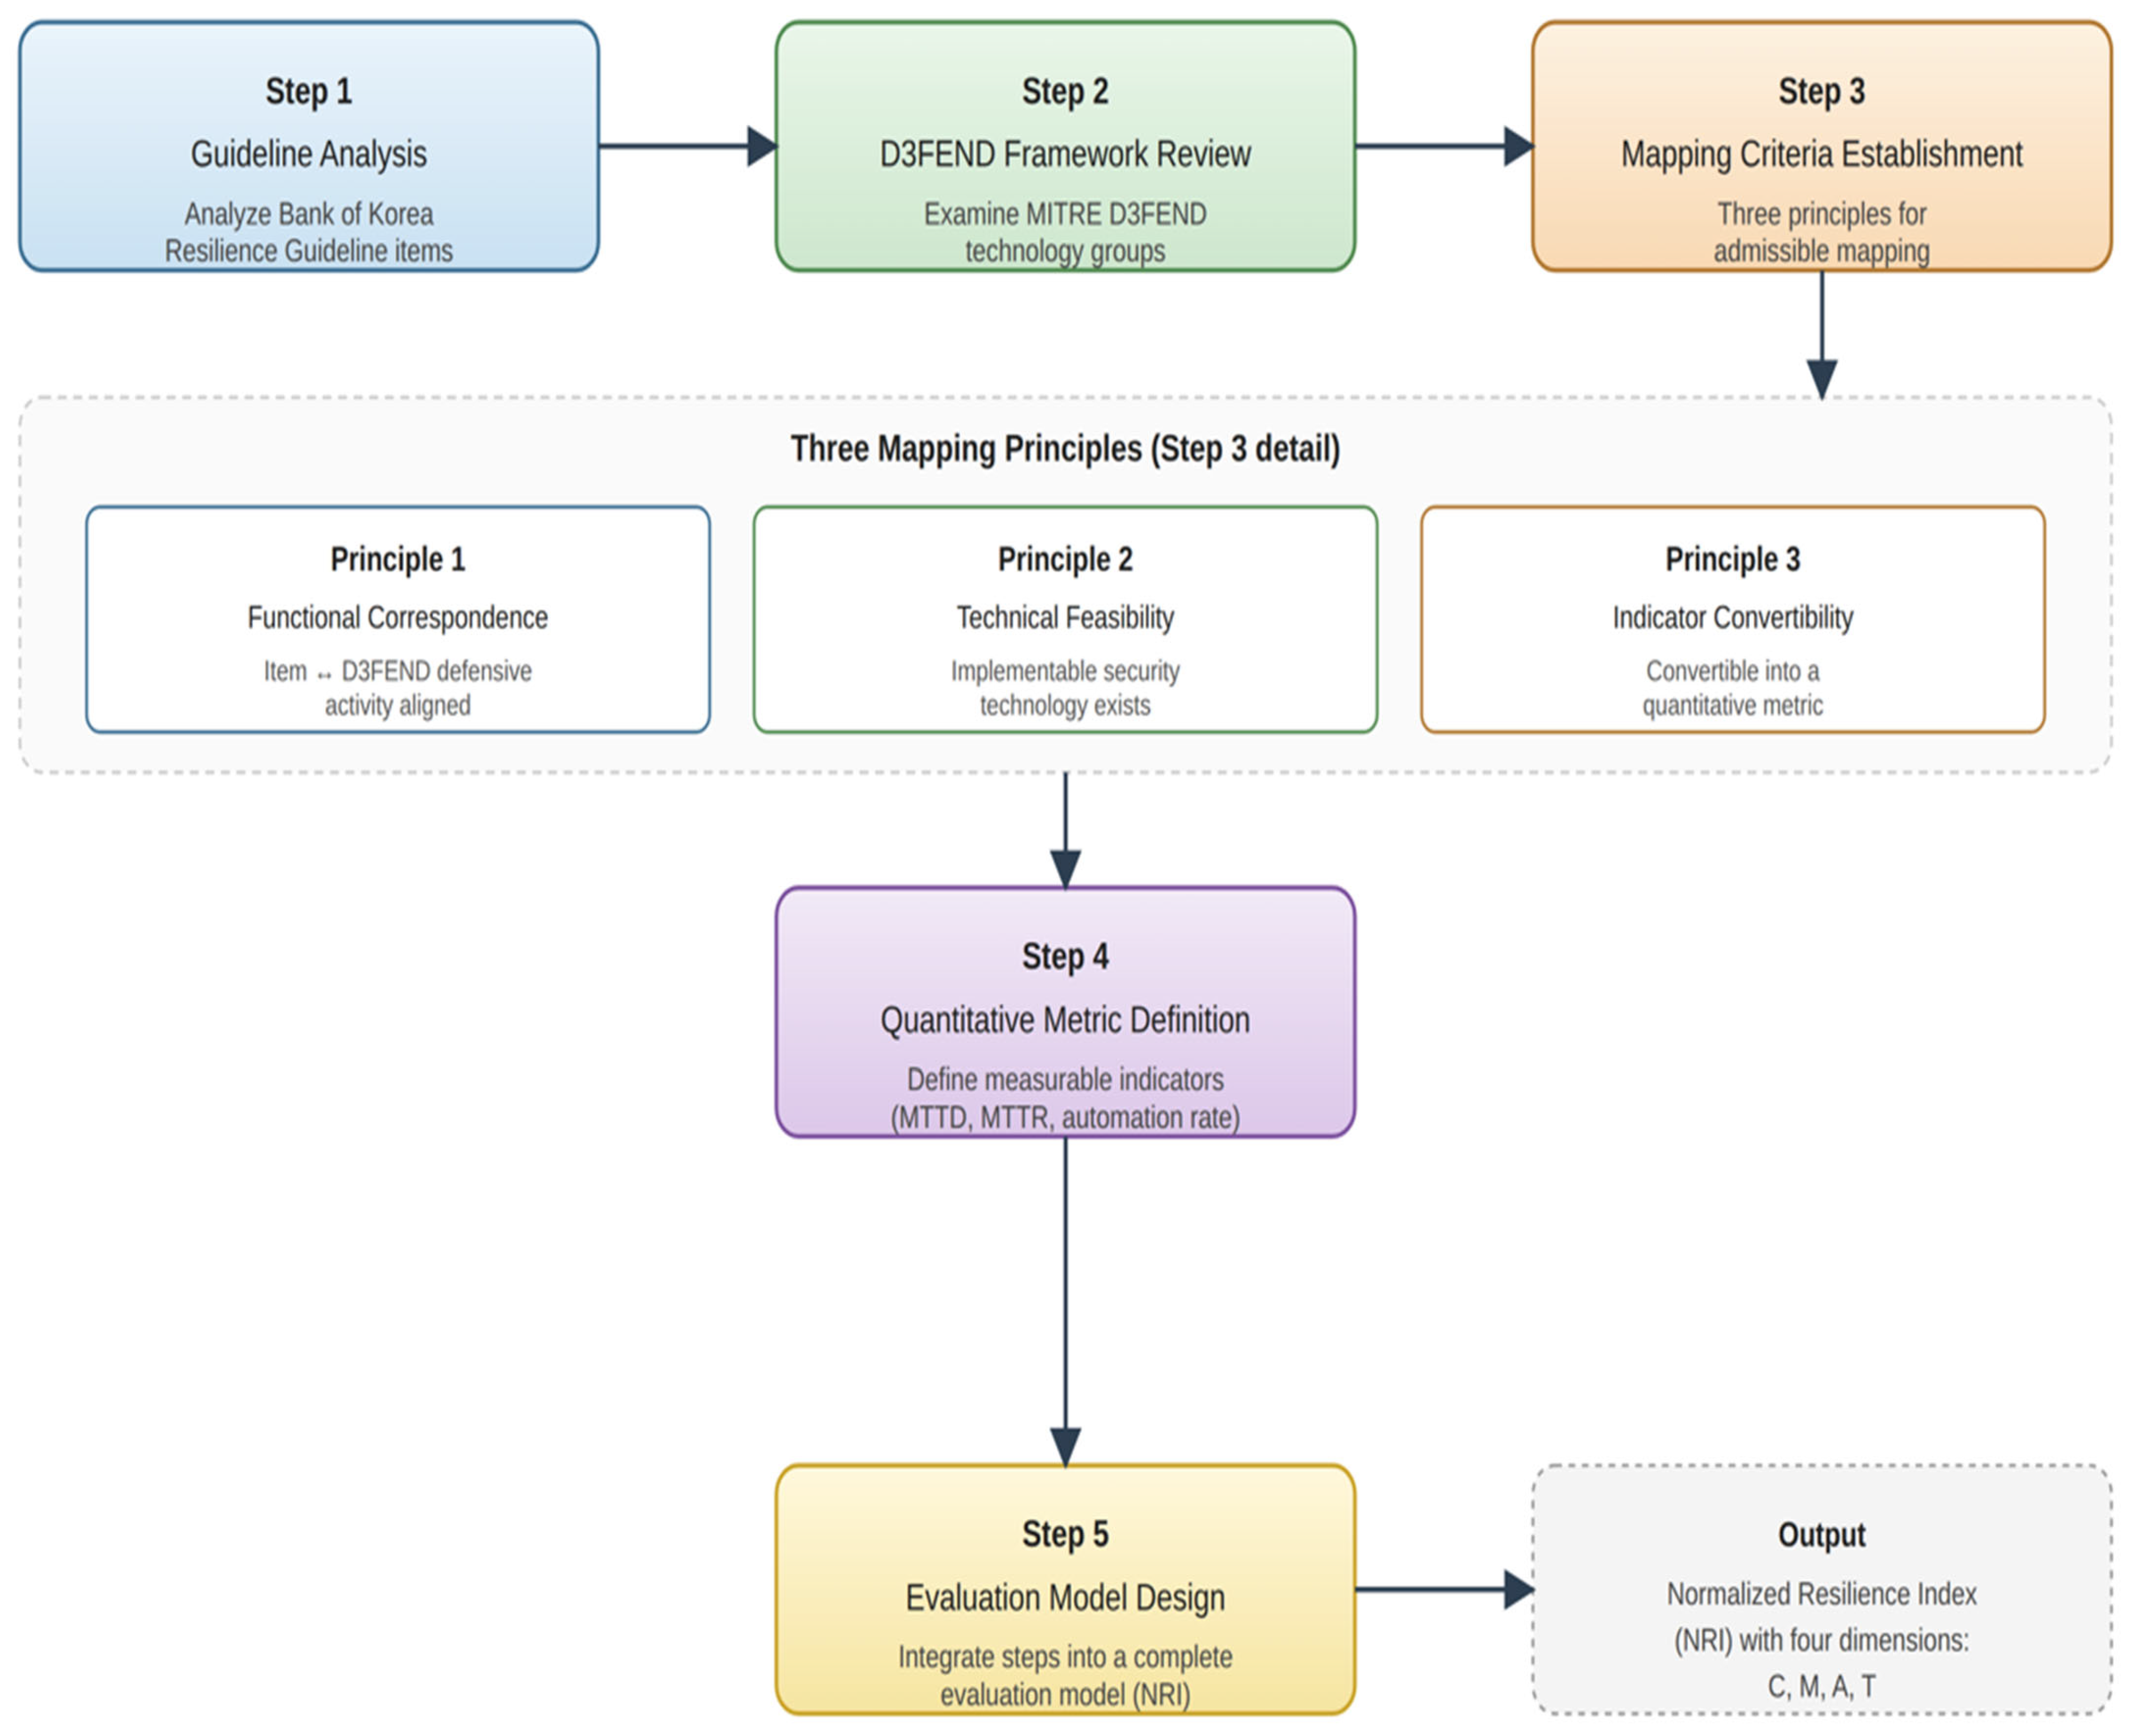
This study proposes a model to enhance the practical applicability of the financial sector’s cyber resilience guidelines by supplementing them with a technology-centric evaluation system based on MITRE D3FEND. The research was conducted through a structured five-step process, as visualized in Figure 4.
The process began with a Guideline Analysis to analytically identify the qualitative nature and limitations of the existing financial guidelines, thereby defining the policy side of the Policy–Technology Gap. Following this, a D3FEND Framework Review was conducted to understand its granular technical classifications and identify its potential to fill the technical voids in the current guidelines, detailing the technology side of the gap. The third step, Mapping Criteria Establishment, created a logical and measurable bridge between abstract policy goals and concrete defensive technologies. Based on these established relationships, the fourth step, Quantitative Metric Definition, transformed qualitative items into measurable indicators such as technology adoption rate, automation level, and defensive redundancy. Finally, the Evaluation Model Design step integrated the preceding analysis and design to complete a practical evaluation model that can be applied in real-world financial institutions.

3.2. Mapping Guideline Items to D3FEND Technologies

To connect the policy-oriented guideline with the technology-oriented D3FEND framework, a mapping process was established based on three core principles, applied in the order listed below. An item is admitted to the quantitative layer only if it satisfies all three principles.
Principle 1 (Functional Correspondence). A guideline item is linked to a D3FEND technology group if its security objective structurally aligns with the defensive activity defined by D3FEND. For example, the Protection item in the guideline corresponds functionally to D3FEND’s Hardening technology group.
Principle 2 (Technical Feasibility). A mappable guideline item must be representable by a specific, implementable security technology or measurable with a technical indicator. For instance, “operation of an intrusion detection system” is implemented via SIEM or EDR solutions and is measured by their MTTD.
Principle 3 (Indicator Convertibility). A qualitative question may be mapped if it can be converted into a quantitative metric—technology adoption status, automation level, or performance indicators. A question about periodic security drills, for example, can be quantified by the success rate of automated response playbooks (SOAR) linked to D3FEND’s Evict techniques.
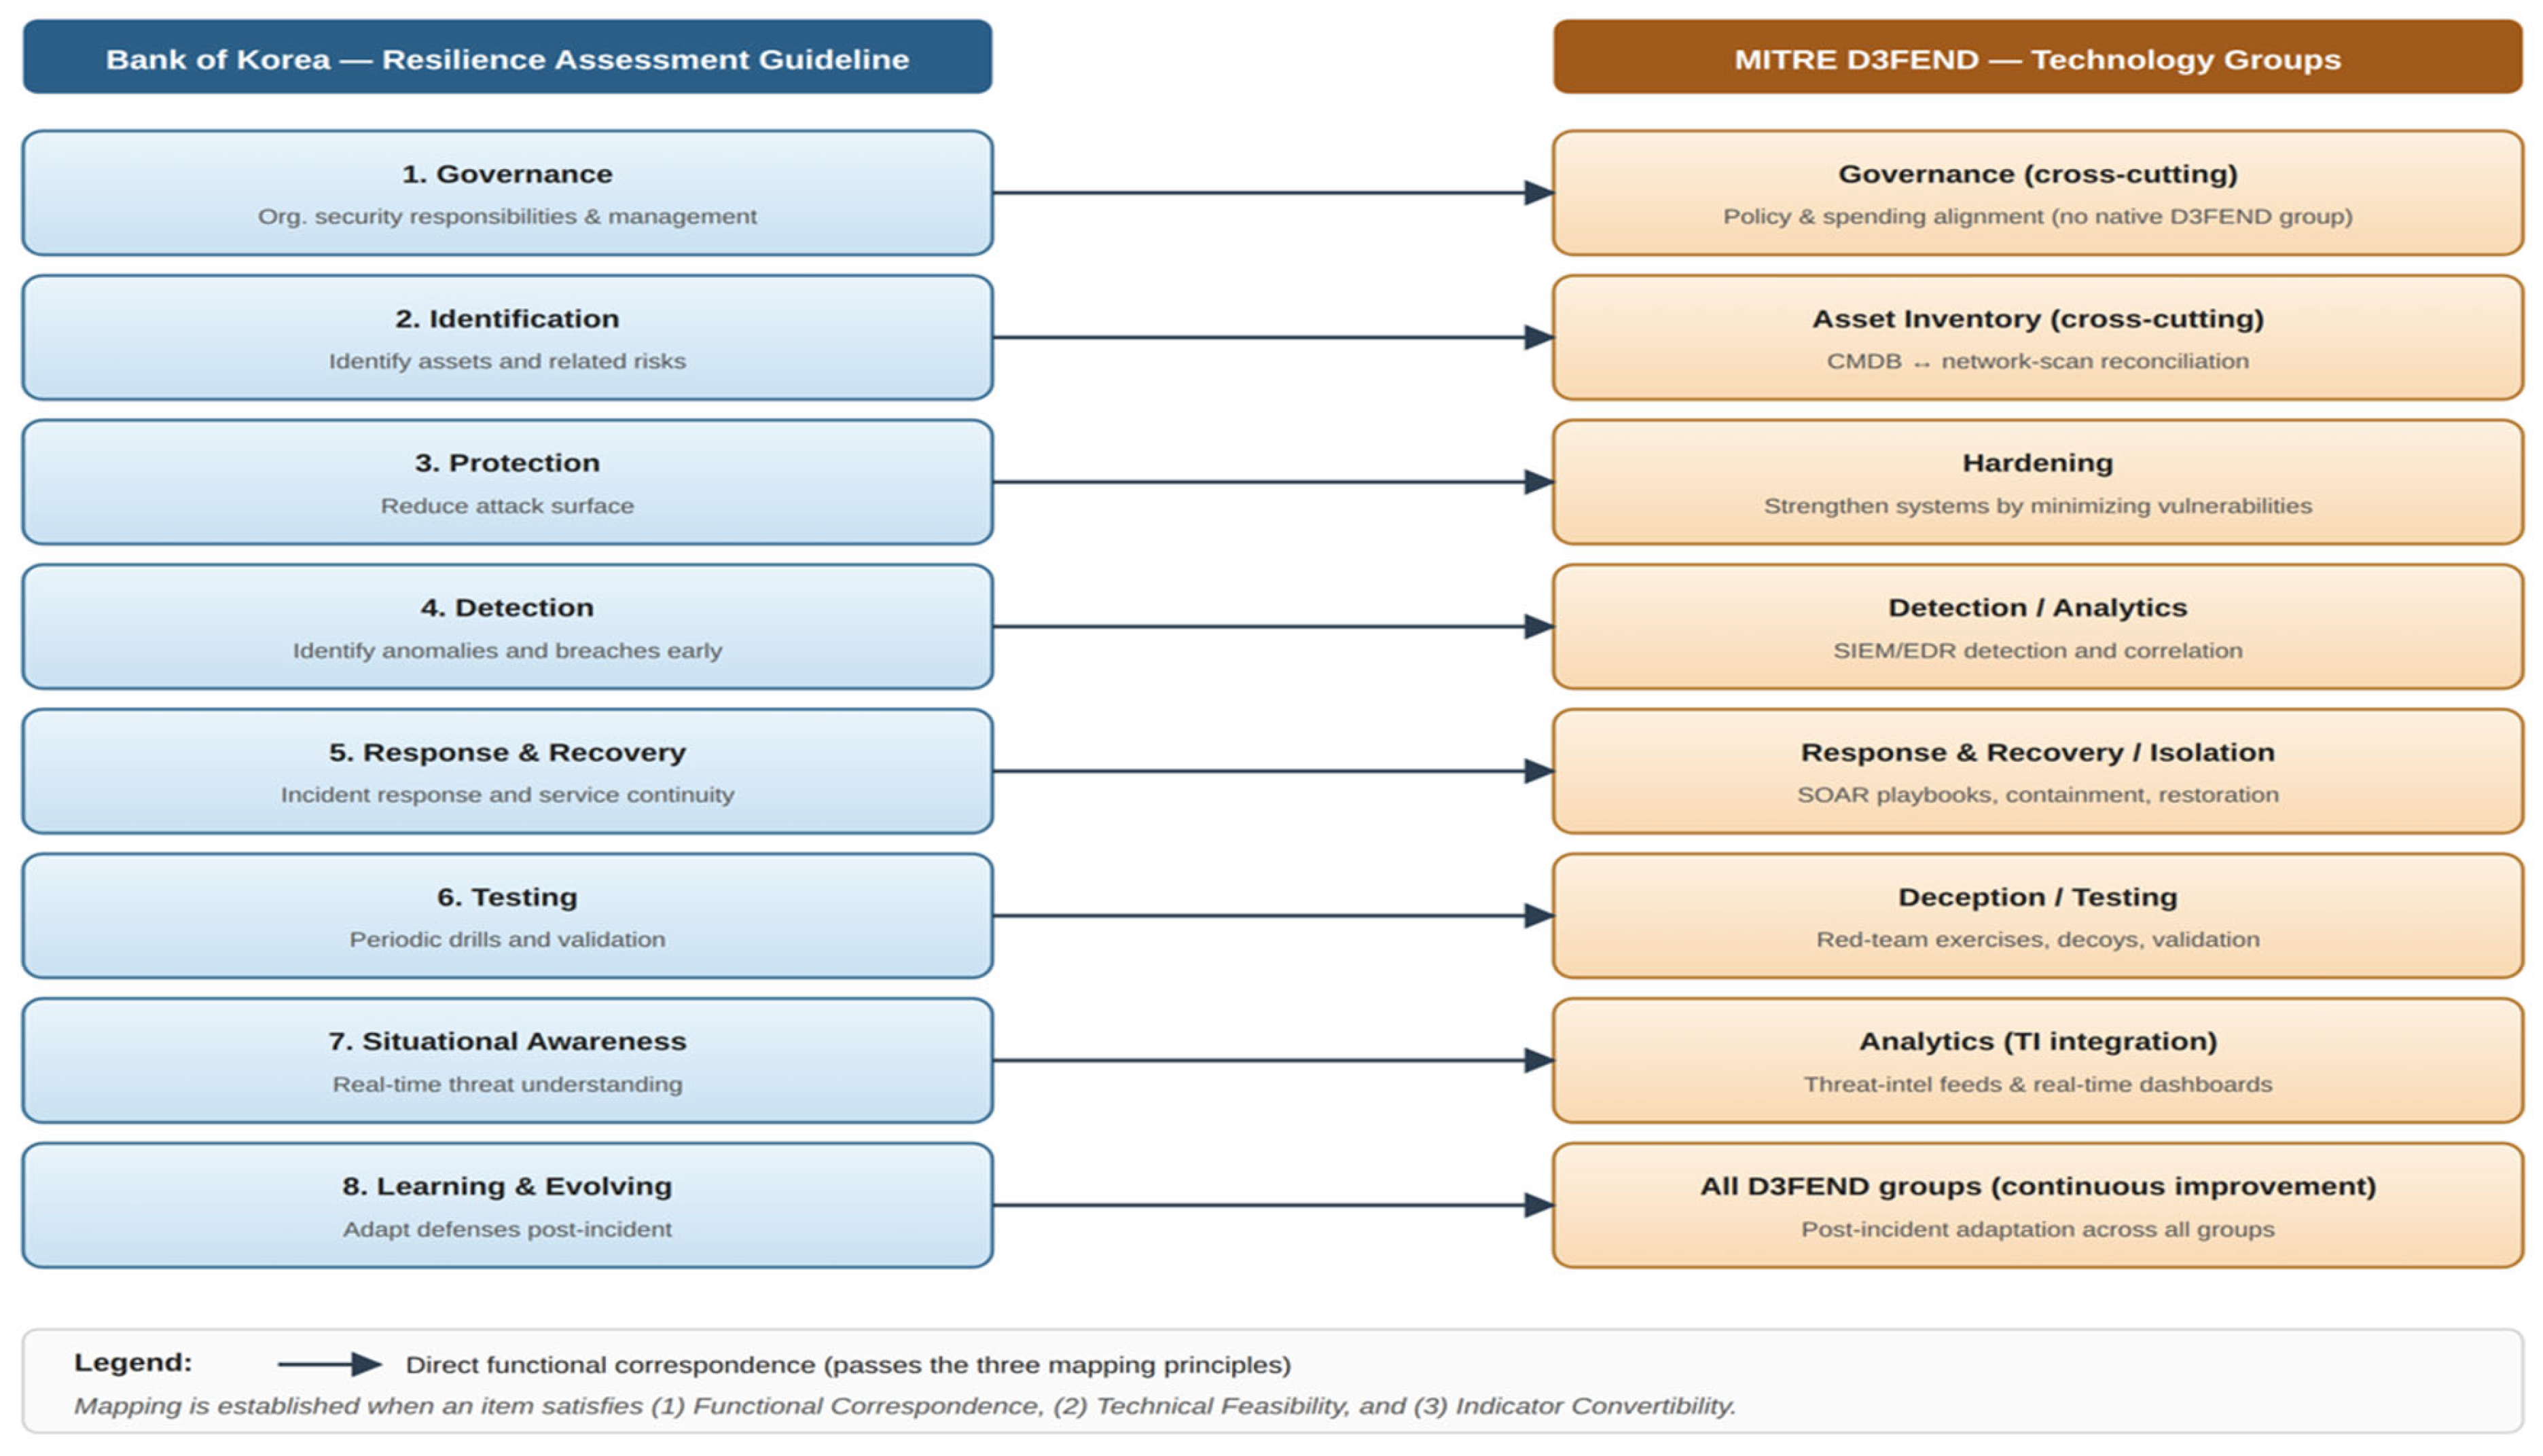
Following these principles, the eight core items of the guideline were mapped to corresponding D3FEND technology groups, shown conceptually in Figure 5, and assigned new quantitative metrics, as detailed in Table 2. These quantitative metrics—including MTTD and MTTR—align with the core criteria for effective resilience indicators defined in prior research [7]. Furthermore, the proposed mapping engine is designed with an open-schema architecture, allowing for the dynamic integration of new D3FEND techniques as they are released. By utilizing the digital-artifact ontology of the D3FEND framework, newly introduced defensive measures can be automatically associated with existing financial security domains through functional tagging. This mechanism ensures the framework’s longevity and scalability against rapidly evolving attack surfaces, effectively future proofing the evaluation model.

3.3. Formal Definition of the Normalized Resilience Index

We now define a closed-form Normalized Resilience Index (NRI) that aggregates indicators within and across domains. Let D = {d1, …, d8} denote the set of guideline domains and Ii = {Ii,1, …, Ii, ki} the indicator set in domain di. Each indicator Ii,j produces a raw measurement xi,j + , normalized to ni,j ∈ [0, 1] by one of three monotone transformations:
(i)
Rate-type indicators (e.g., true positive rate, hardening coverage) are already in [0, 1] and pass through unchanged: ni,j = xi,j.
(ii)
Time-type indicators (e.g., MTTD, MTTR) use exponential normalization with a domain-specific target T*: ni,j = exp(−xi,j/T*) so that ni,j → 1 as xi,j → 0 and ni,j → 0 as xi,j → ∞.
(iii)
Maturity-type indicators (1–5 ordinal scale) use linear rescaling: ni,j = (xi,j − 1)/4.
Each indicator is further classified along four orthogonal dimensions: Coverage (C), Maturity (M), Automation (A), and Timeliness (T). The domain-level score is computed as a weighted geometric mean to penalize disproportionately weak dimensions:
NRI(di) = Π_{φ ∈ {C,M,A,T}} (ñi,φ)^{w_φ}
where ñi,φ is the arithmetic mean of normalized indicators classified under dimension φ in domain i, and the weights w_C, w_M, and w_A, w_T satisfy Σ w_φ = 1. The weights were elicited via the Analytic Hierarchy Process (AHP) [21,23] from the Delphi panel; the calibrated values used in this study are w_C = 0.30, w_M = 0.25, w_A = 0.25, w_T = 0.20, with consistency ratio CR = 0.04 (well below the 0.10 acceptance threshold conventionally adopted in cybersecurity AHP applications [21,24]).
The institution-level NRI aggregates domain scores using domain-importance weights ωiωi = 1):
NRI(institution) = Σi ωi · NRI(di)
By construction, NRI(institution) ∈ [0, 1], with 0 indicating no measurable defensive capability and 1 indicating optimal performance against the modeled threat landscape. The geometric-mean form at the domain level is deliberate: an institution that excels in three dimensions but has zero coverage in the fourth receives a low domain score, reflecting the manuscript’s stance that a missing dimension cannot be compensated by surplus in others. To ensure threat-informed validity, every indicator is annotated with a non-empty set of ATT&CK technique identifiers and, where applicable, exemplar CVE entries (Section 3.5).
Calibration of Normalization Thresholds. The domain-specific target T* for time-type indicators in Equation (1) is calibrated using three-source triangulation. First, regulator-published service-level expectations are used as the upper-bound anchor (e.g., the BoK Resilience Guideline implies a recovery objective on the order of hours for critical financial services). Second, the median MTTD/MTTR values reported in the IBM Cost of a Data Breach Report (2023–2025) are used as the industry-baseline anchor (T*_MTTD ≈ 207 days for the global baseline, but reduced to 24–72 h for institutions with mature SOCs, which we adopt as the operational target). Third, internal SOC telemetry distributions are used as the institution-specific anchor. For ordinal Maturity-type indicators, the 1–5 scale is anchored to the CMMI-derived levels (Initial, Managed, Defined, Quantitatively Managed, Optimizing) so that the rescaling n = (x − 1)/4 maps Level 1 to 0 and Level 5 to 1 in a substantively interpretable way. All thresholds, anchor values, and their provenance are reported in the supplementary calibration table to ensure full reproducibility.
Handling of Missing Indicators. In real-world deployments, telemetry for some indicators may be unavailable (e.g., an institution may not yet have deployed a SOAR platform, making the playbook-success indicator unmeasurable). The framework handles missing indicators with a two-tier policy. (i) Within-dimension missingness: if at least one indicator is observed in dimension φ of domain i, the unobserved indicators are dropped from the arithmetic mean ñi,φ rather than imputed; the result is annotated as a partial score. (ii) Whole-dimension missingness: if no indicator is observed for dimension φ, the corresponding factor in Equation (1) is replaced by an explicit penalty value n_min = 0.10 (chosen so that Ǖ0 entirely missing dimensions cannot mask actual capability) and the institution receives a Data Completeness Flag in its report. This policy operationalizes the principle that absent telemetry is not equivalent to satisfactory performance—a stance that directly addresses the conflation between unmeasured and well-defended controls in compliance-only assessments.
Operational Maintenance of ATT&CK–CVE Mappings. Because ATT&CK techniques and CVE entries evolve continuously, the framework defines a quarterly maintenance cycle. At each cycle, the mapping engine reconciles three sources: (i) the latest ATT&CK Enterprise matrix, (ii) the NVD CVE feed filtered by financial-sector CPE strings, and (iii) the institution’s own incident-response logs. The reconciliation is rule-based: new techniques inherit the domain assignment of their parent tactic if a child technique already exists, and new CVEs are auto-clustered to the technique whose detection rules cover the CVE’s exploit pattern. Conflicts and unmapped entries are surfaced to a human reviewer. This procedure prevents the silent decay of threat coverage that has been observed in static threat-informed evaluations.
NRI Computation Algorithm. Algorithm 1 summarizes the end-to-end NRI computation. The procedure accepts raw indicator measurements, applies the appropriate normalization transformation per indicator type, performs the missing-indicator policy described above, computes the four-dimensional weighted geometric mean per domain, and finally aggregates to the institution-level NRI. The algorithm runs in O(|I|) time where |I| is the total number of indicators across all domains, making it suitable for streaming evaluation in production SIEM/SOAR environments.
Algorithm 1: NRI Computation
Input:   X = {x_{i,j}} // raw indicator measurements
     type(i,j) ∈ {rate, time, maturity}
     dim(i,j) ∈ {C, M, A, T}
     T*_{i,j} // target for time-type indicators
     w = (w_C, w_M, w_A, w_T) // AHP-elicited weights
     ω = {ω_i} // domain importance weights
Output: NRI_inst ∈ [0, 1], DataCompletenessFlag
1:   for each domain d_i:
2:    for each indicator (i,j) with observed x_{i,j}:
3:     if type(i,j) == rate:    n_{i,j} ← x_{i,j}
4:     else if type(i,j) == time: n_{i,j} ← exp(−x_{i,j}/T*_{i,j})
5:     else if type(i,j) == maturity: n_{i,j} ← (x_{i,j} − 1)/4
6:    for each dimension φ ∈ {C, M, A, T}:
7:     S_{i,φ} ← {n_{i,j}: dim(i,j) = φ, observed}
8:     if |S_{i,φ}| > 0:  ñ_{i,φ} ← mean(S_{i,φ})
9:     else:        ñ_{i,φ} ← n_min = 0.10; flag i
10:   NRI(d_i) ← ∏_{φ} (ñ_{i,φ})^{w_φ}
11: NRI_inst ← ∑_i ω_i · NRI(d_i)
12: DataCompletenessFlag ← (any domain flagged?)
13: return (NRI_inst, DataCompletenessFlag)
Worked Example (Step-by-Step). To illustrate the mapping–to–NRI pipeline didactically, consider the Detection domain for an institution. (1) Mapping: the BoK item “intrusion detection system operation” passes Principle 1 (Functional Correspondence with D3FEND Detect-Network-Traffic-Analysis), Principle 2 (Technical Feasibility via SIEM/EDR), and Principle 3 (Indicator Convertibility to TPR and MTTD). (2) Measurement: the SIEM logs report a 30-day TPR of 0.91 (rate-type, dim C) and MTTD = 12 min (time-type, dim T, with T* = 30 min); the SOAR playbook success rate is 0.82 (rate-type, dim A); the maturity self-assessment is Level 4 (maturity-type, dim M). (3) Normalization: n_TPR = 0.91; n_MTTD = exp(−12/30) ≈ 0.670; n_SOAR = 0.82; n_Mat = (4 − 1)/4 = 0.75. (4) Dimension means: ñ_C = 0.91, ñ_M = 0.75, ñ_A = 0.82, ñ_T = 0.670. (5) Domain NRI with w = (0.30, 0.25, 0.25, 0.20): NRI(Detection) = 0.91^{0.30} · 0.75^{0.25} · 0.82^{0.25} · 0.670^{0.20} ≈ 0.793. Iterating across the eight domains and aggregating with ω yields the institution-level NRI used in Section 4.

3.4. Reconfiguring Evaluation Items

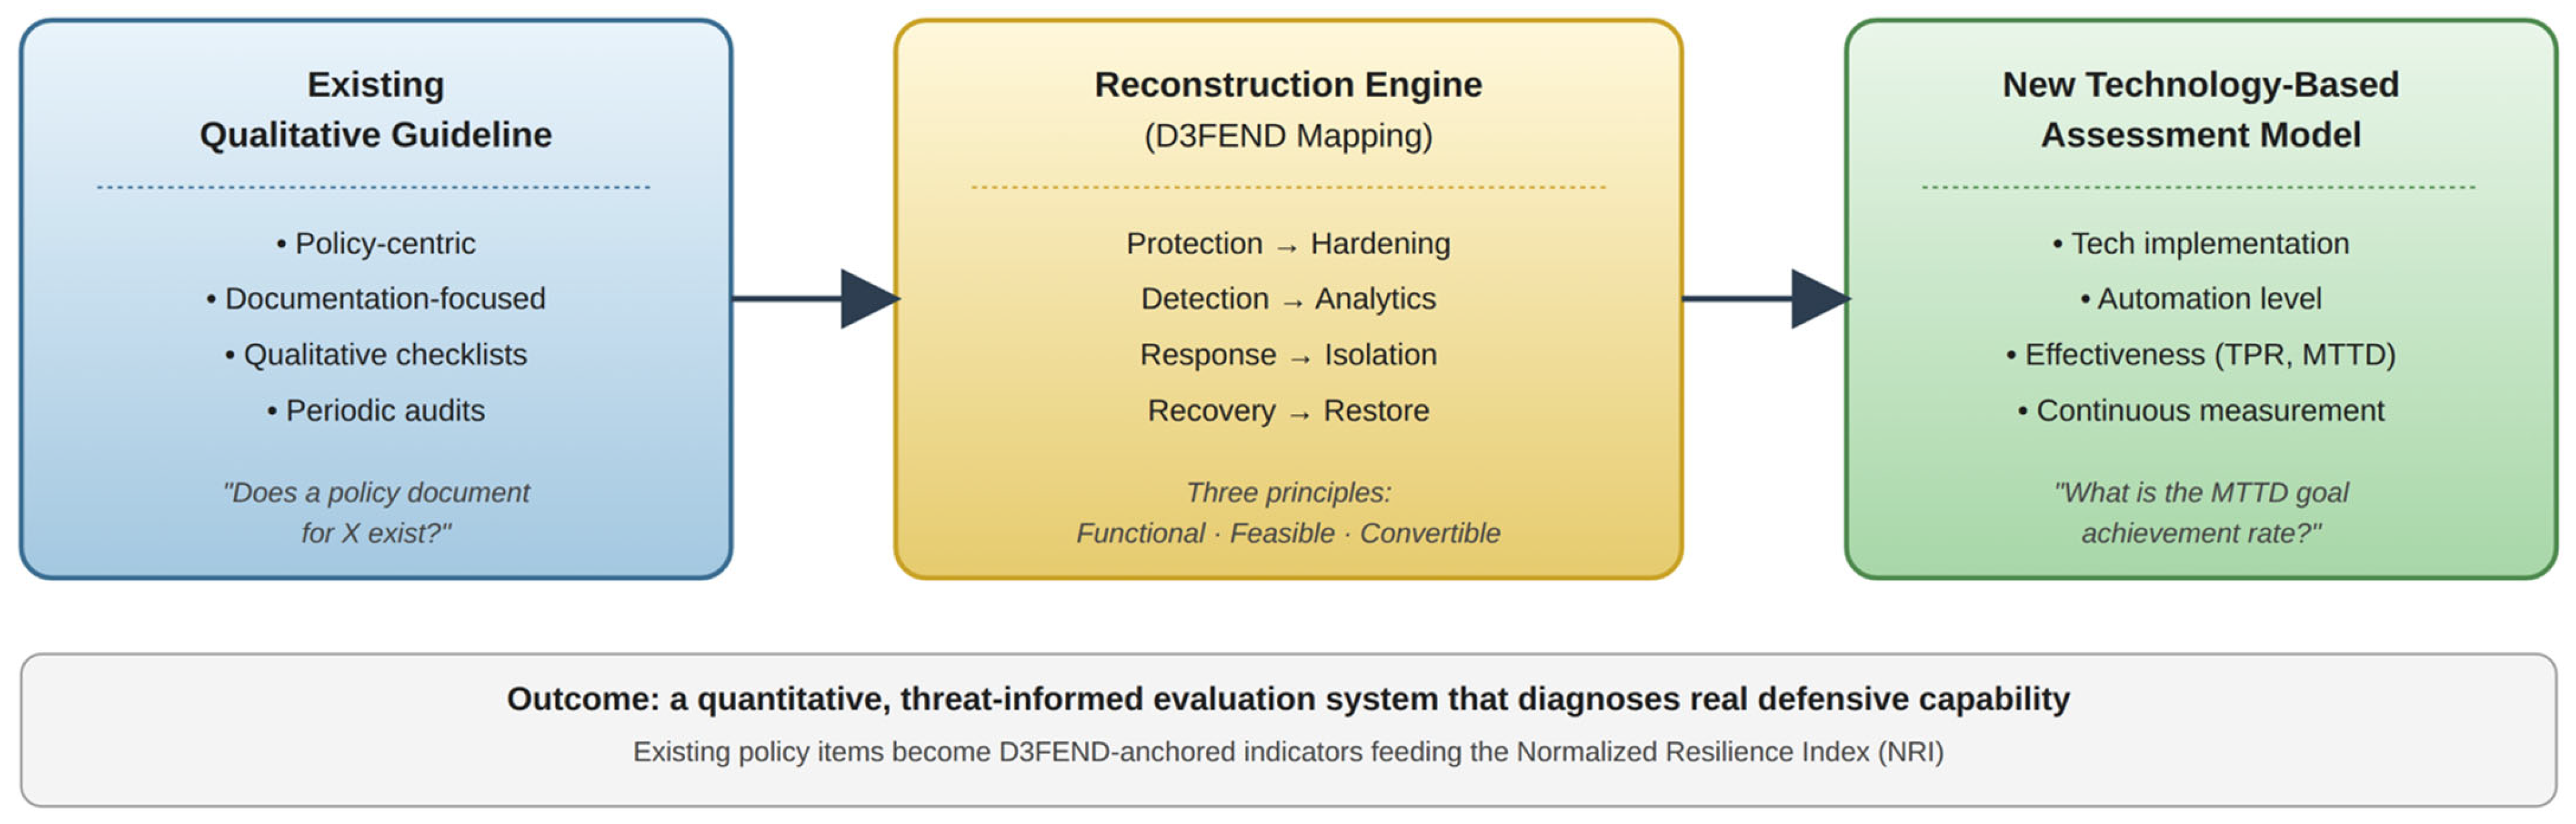
The proposed model reconfigures the guideline’s abstract items into concrete, technology-based assessments. This transition is visualized in Figure 6, where policy objectives are transformed into technical actions. For example, the Protection item is remapped to the D3FEND Hardening group, while the Detection item is remapped to the D3FEND Detection and Analytics groups. Similarly, the Response & Recovery item, which encompasses incident response and service continuity, is remapped to the corresponding D3FEND Response & Recovery and Isolation groups.
This reconfiguration shifts the evaluation paradigm. As shown in Table 3, the focus moves from Proof of Existence (e.g., “Is there a policy document?”) to Proof of Performance (e.g., “What is the server hardening level?” or “What is the MTTD goal achievement rate?”). Furthermore, it elevates the assessment to measure modern security maturity factors such as Automation and Integration, asking not just if a tool exists but how well it works in concert with others (e.g., “What is the success rate of SOAR-based automated response playbooks?”). This creates an objective, consistent, and technology-focused evaluation framework capable of assessing an organization’s true defensive capabilities against modern threats.

3.5. ATT&CK–CVE Threat Anchoring

To ensure threat-informed validity, every indicator is annotated with a non-empty set of ATT&CK technique identifiers and, where applicable, exemplar CVE entries. For example, the Detection-domain indicator Detection True Positive Rate is anchored to ATT&CK techniques T1566 (Phishing), T1059 (Command and Scripting Interpreter), and T1071 (Application Layer Protocol) and to CVE clusters representative of recent banking-sector exploits. This annotation enables auditors to verify that an institution’s measured score reflects defenses against currently relevant adversary techniques rather than against an abstract threat model. Indicators lacking any ATT&CK linkage are excluded from the NRI and reported separately as governance-only items.

4. Verification of Research Results

4.1. Logical and Conceptual Validation

The proposed D3FEND-based framework effectively addresses the limitations of the existing policy-centric guideline, as summarized in Table 4. This validation rests on three key logical shifts. First, the evaluation focus moves from policy documentation to the actual implementation level of security technology and its operational automation, transitioning the paradigm from a compliance-oriented check to a capability-oriented diagnosis of real defensive strength. Second, evaluation criteria are shifted: vague and subjective standards are replaced with measurable quantitative metrics—MTTD, detection-rule application rates, and automation success rates. This objectifies the assessment, allowing for consistent, data-driven benchmarking and continuous improvement. Third, the framework ensures direct threat alignment by systematically linking to modern threat intelligence through D3FEND and ATT&CK. This elevates the assessment to be threat-informed, enabling organizations to directly evaluate whether their defensive countermeasures are effective against known adversary techniques.

4.2. Expert Validation via the Delphi Method

4.2.1. Panel Composition

To verify the practical suitability and validity of the proposed framework, a three-round Delphi survey was conducted with a panel of 50 security experts, recruited under a stratified sampling design intended to triangulate technical, advisory, and operational perspectives. The panel composition is summarized in Table 5. The mean professional experience of panelists was 11.4 years (SD = 4.7); 78% held one or more advanced certifications (CISSP, OSCP, CISA, or equivalent). Recruitment and data handling were conducted under the Sejong University IRB protocol (number to be inserted at submission).
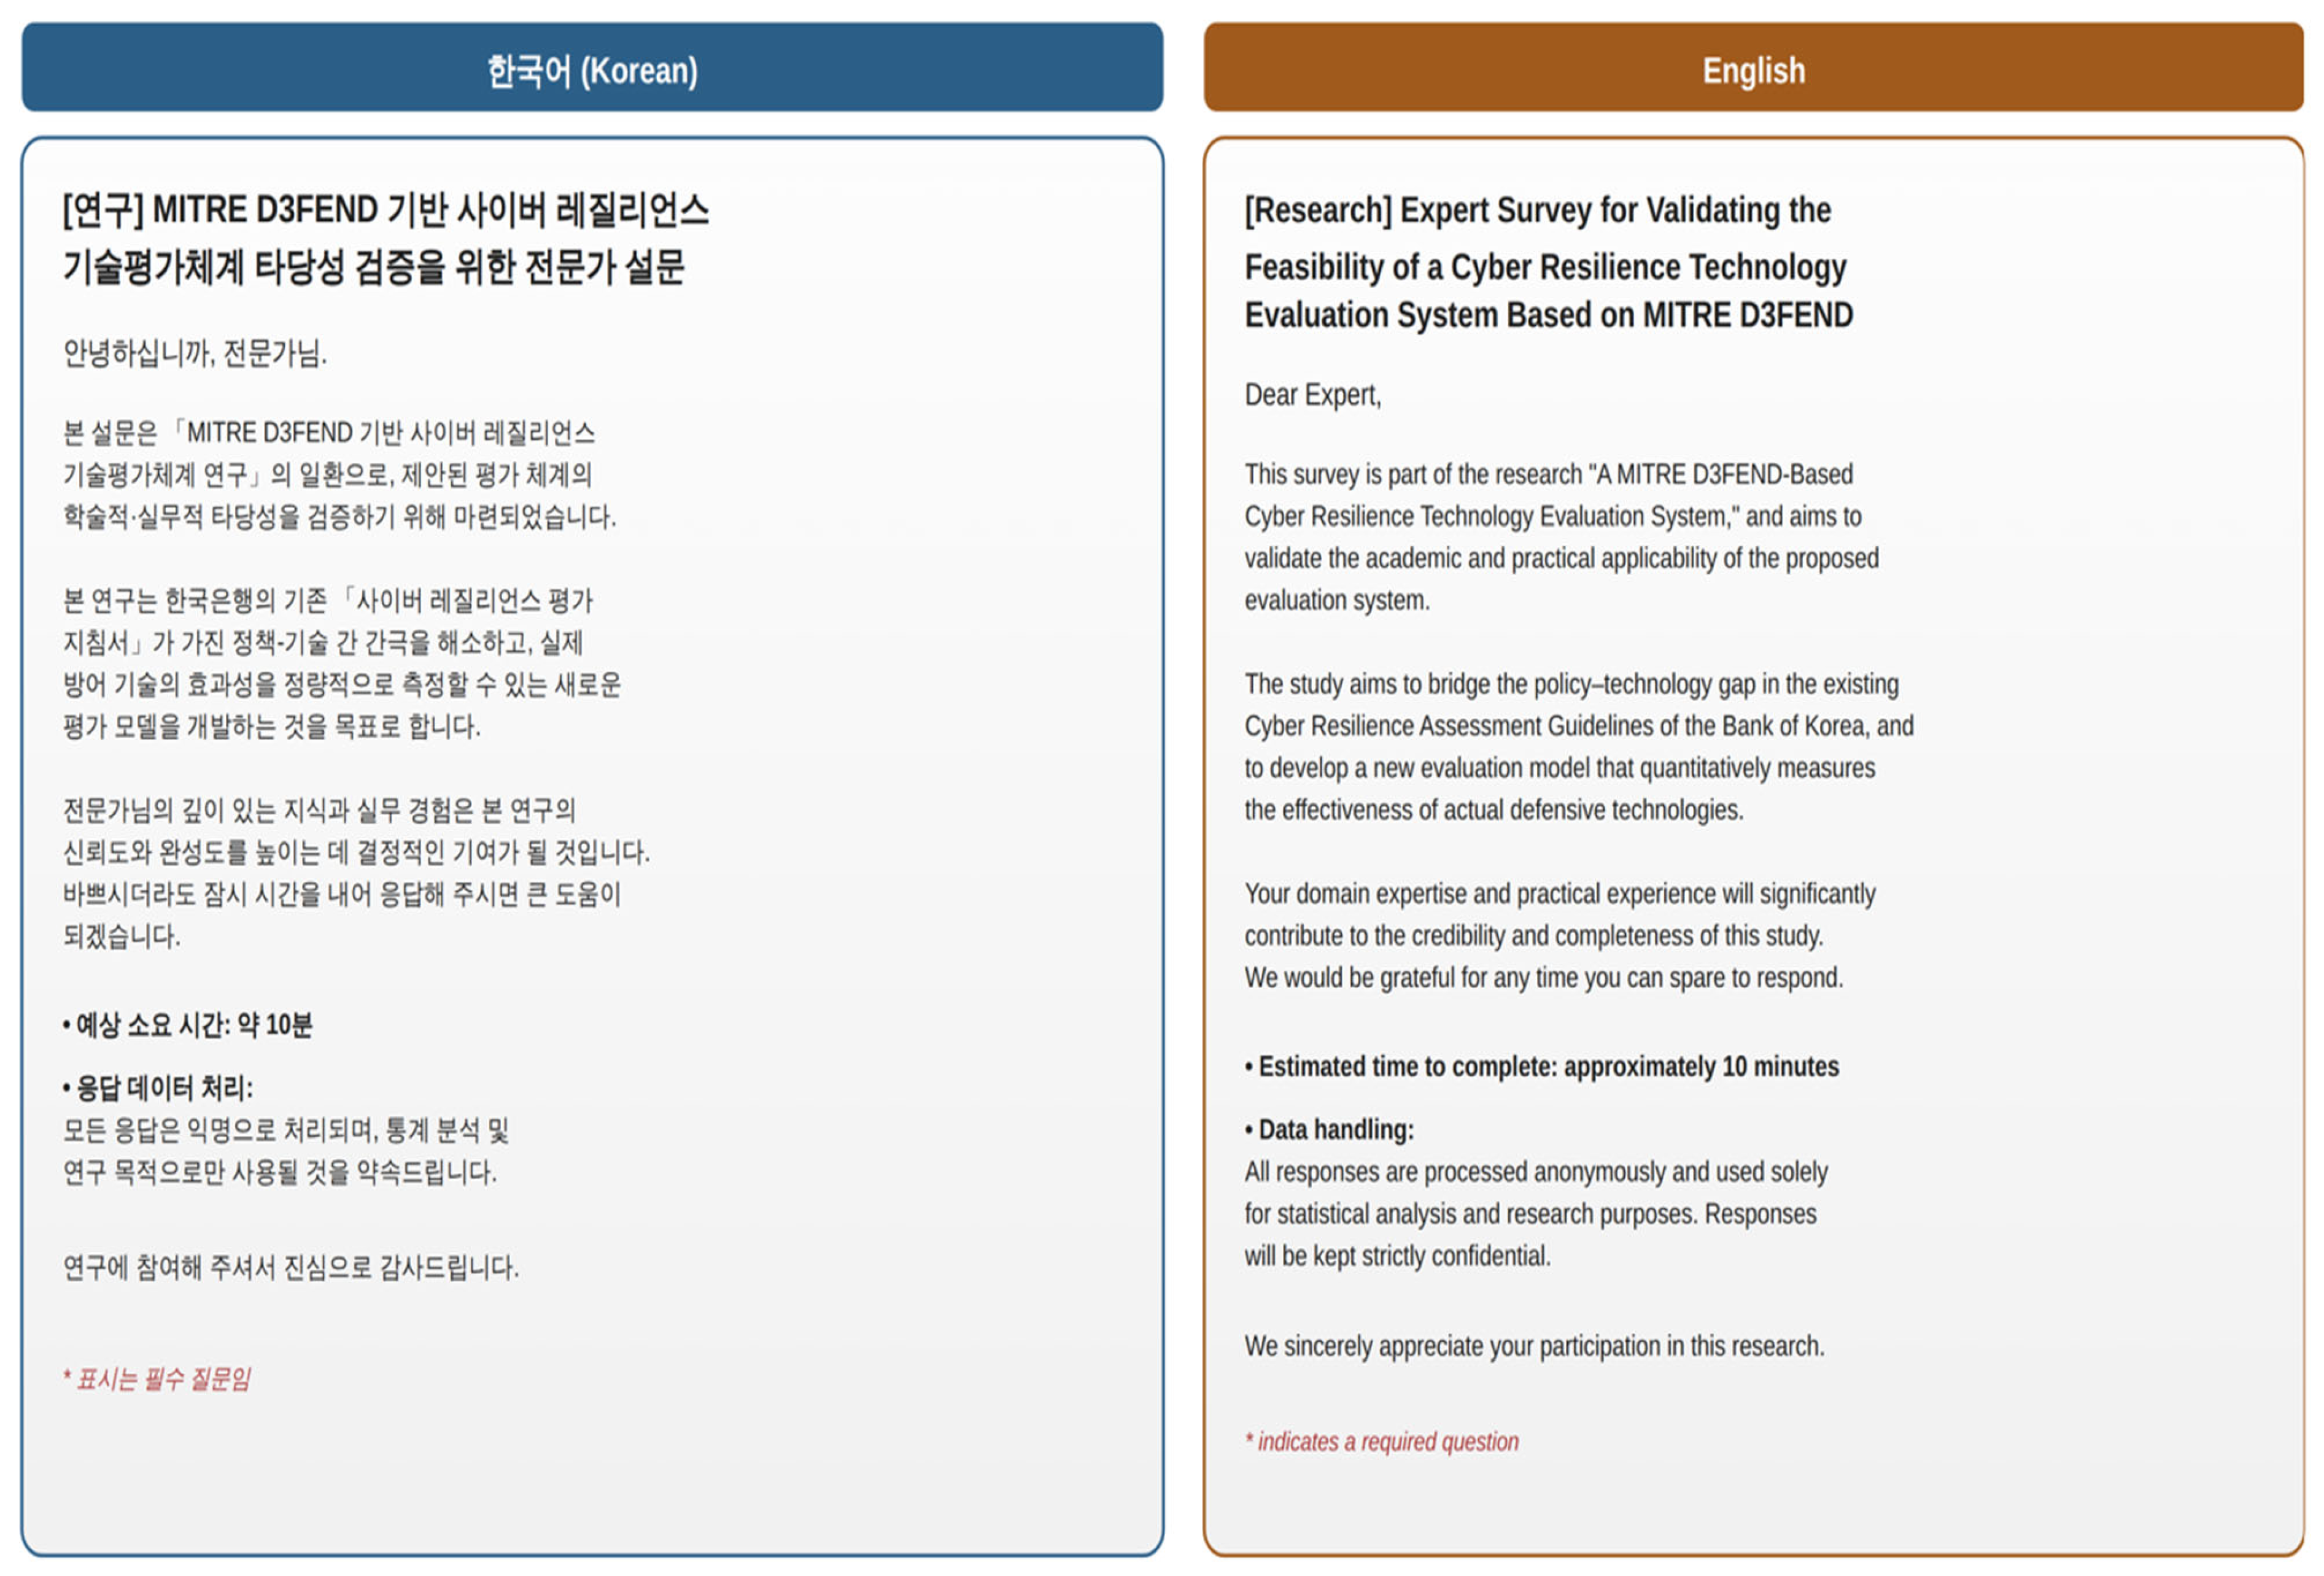
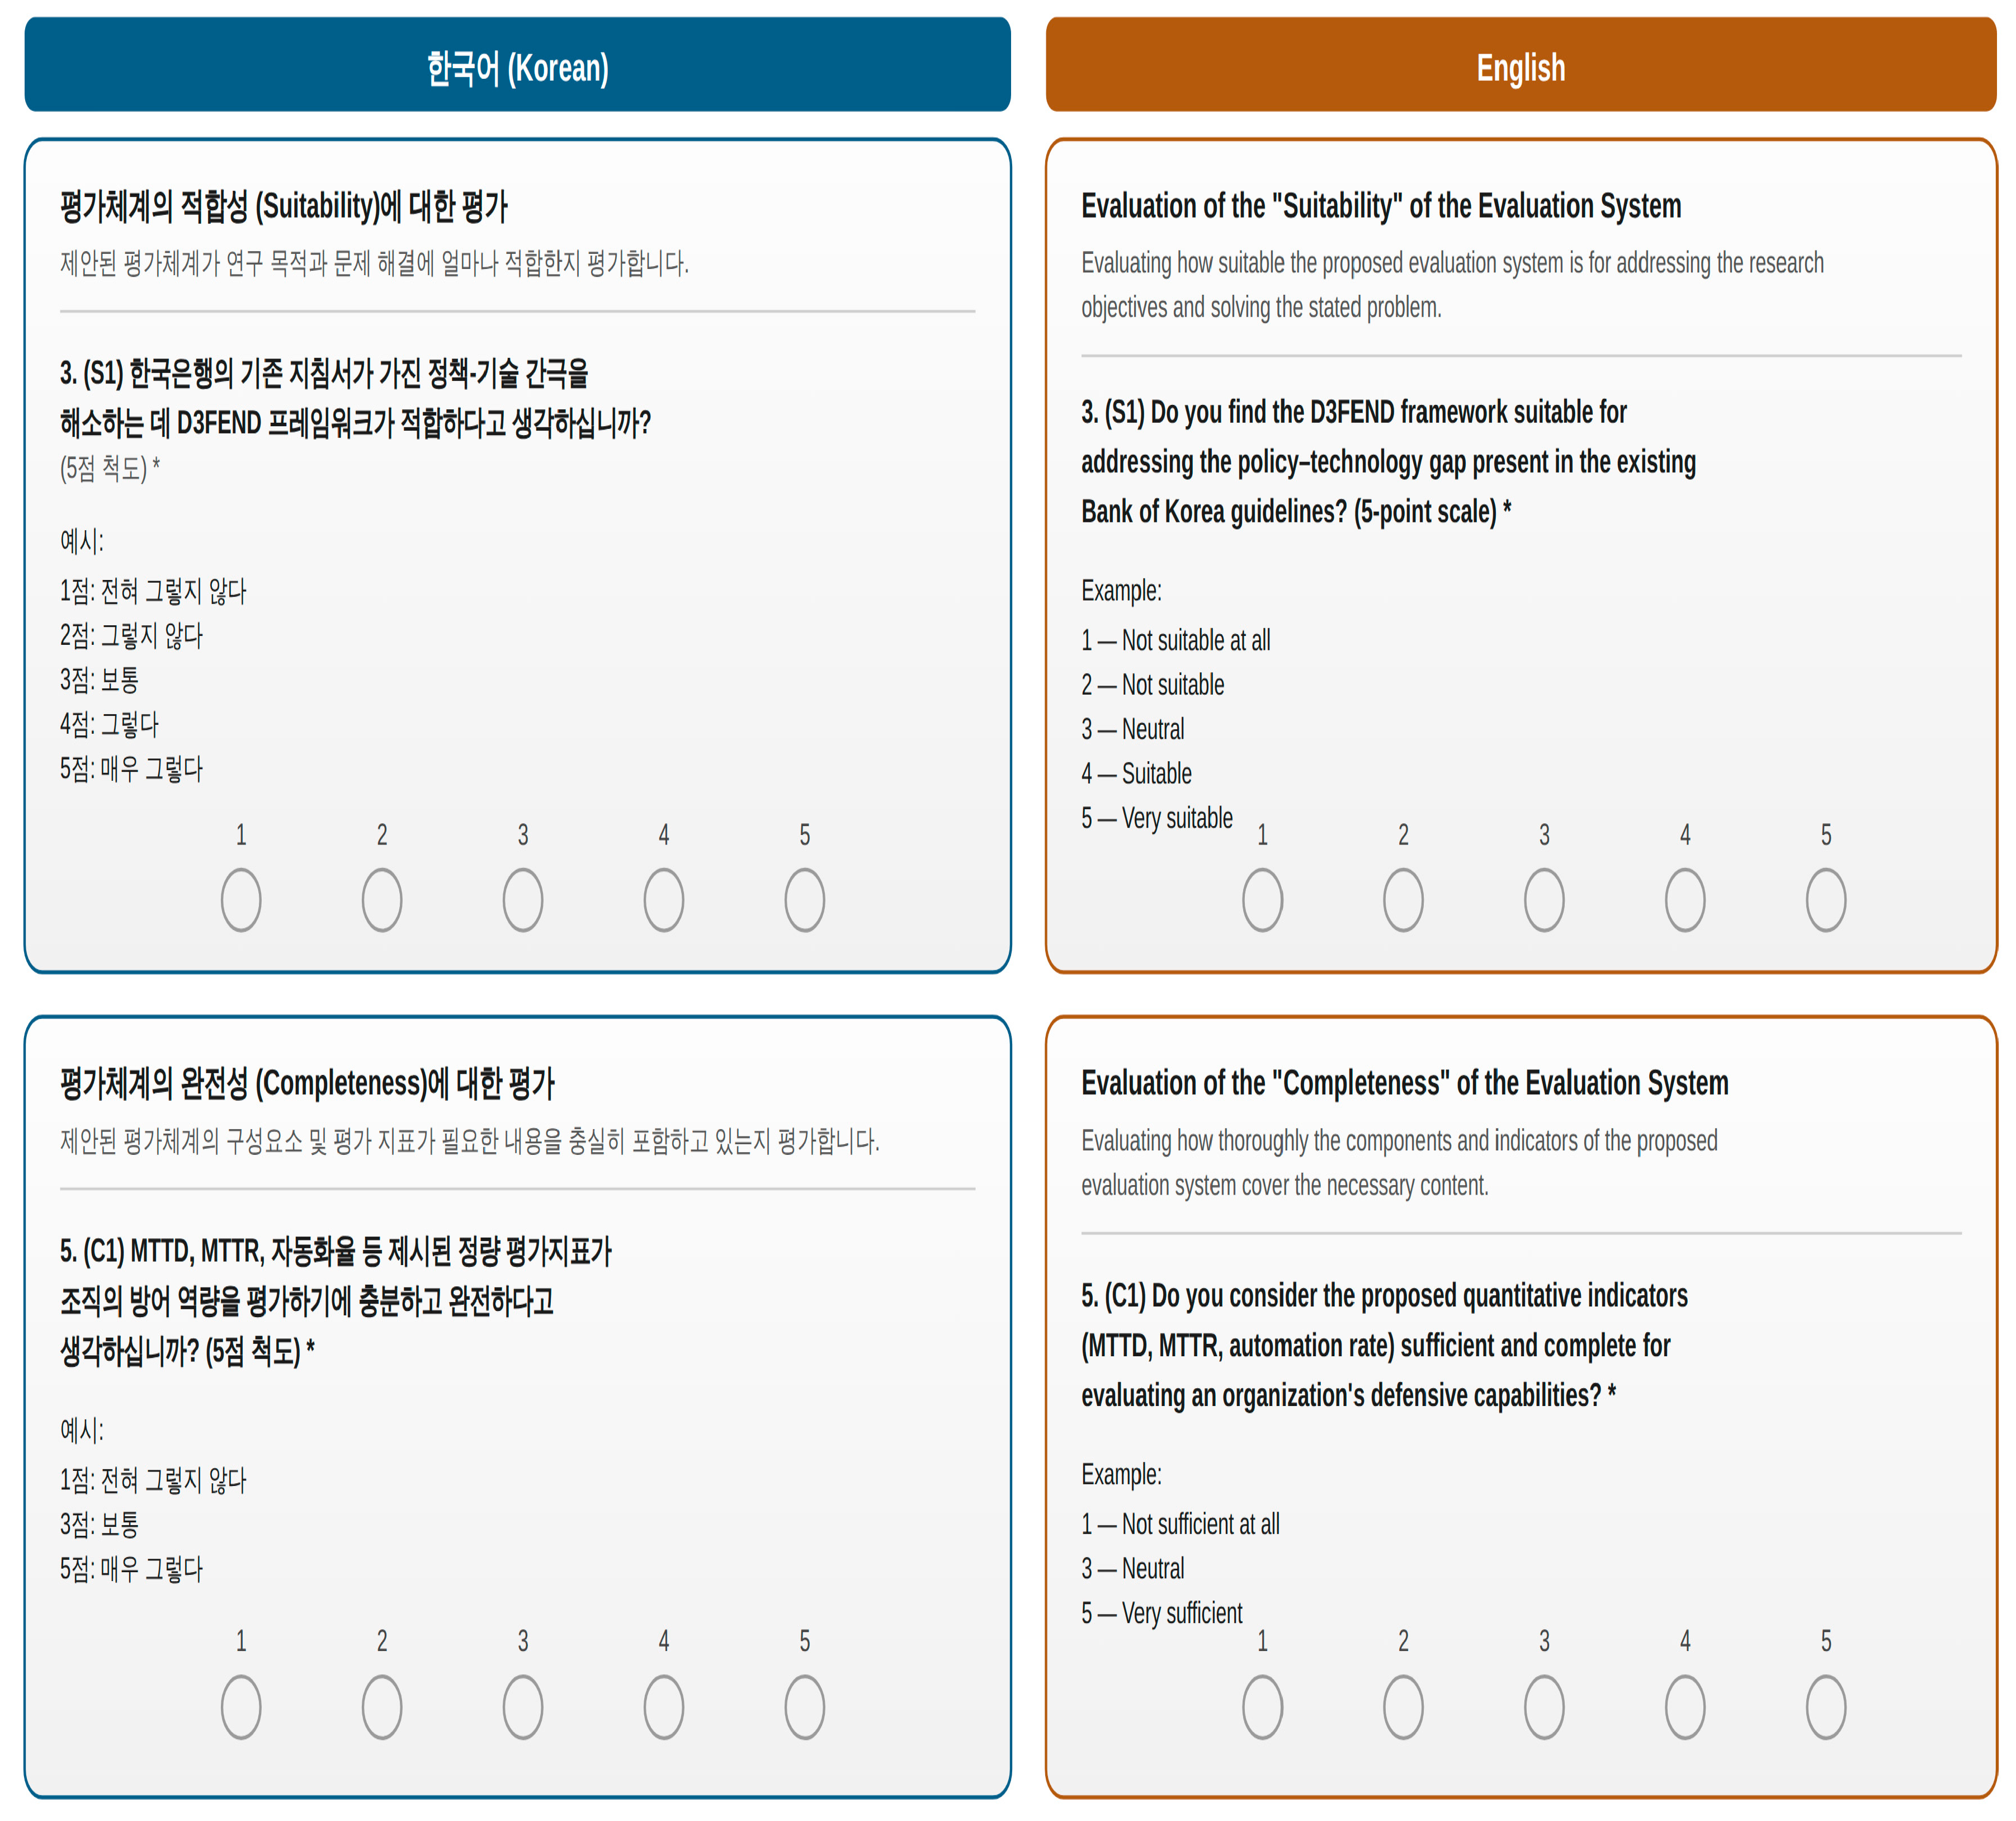
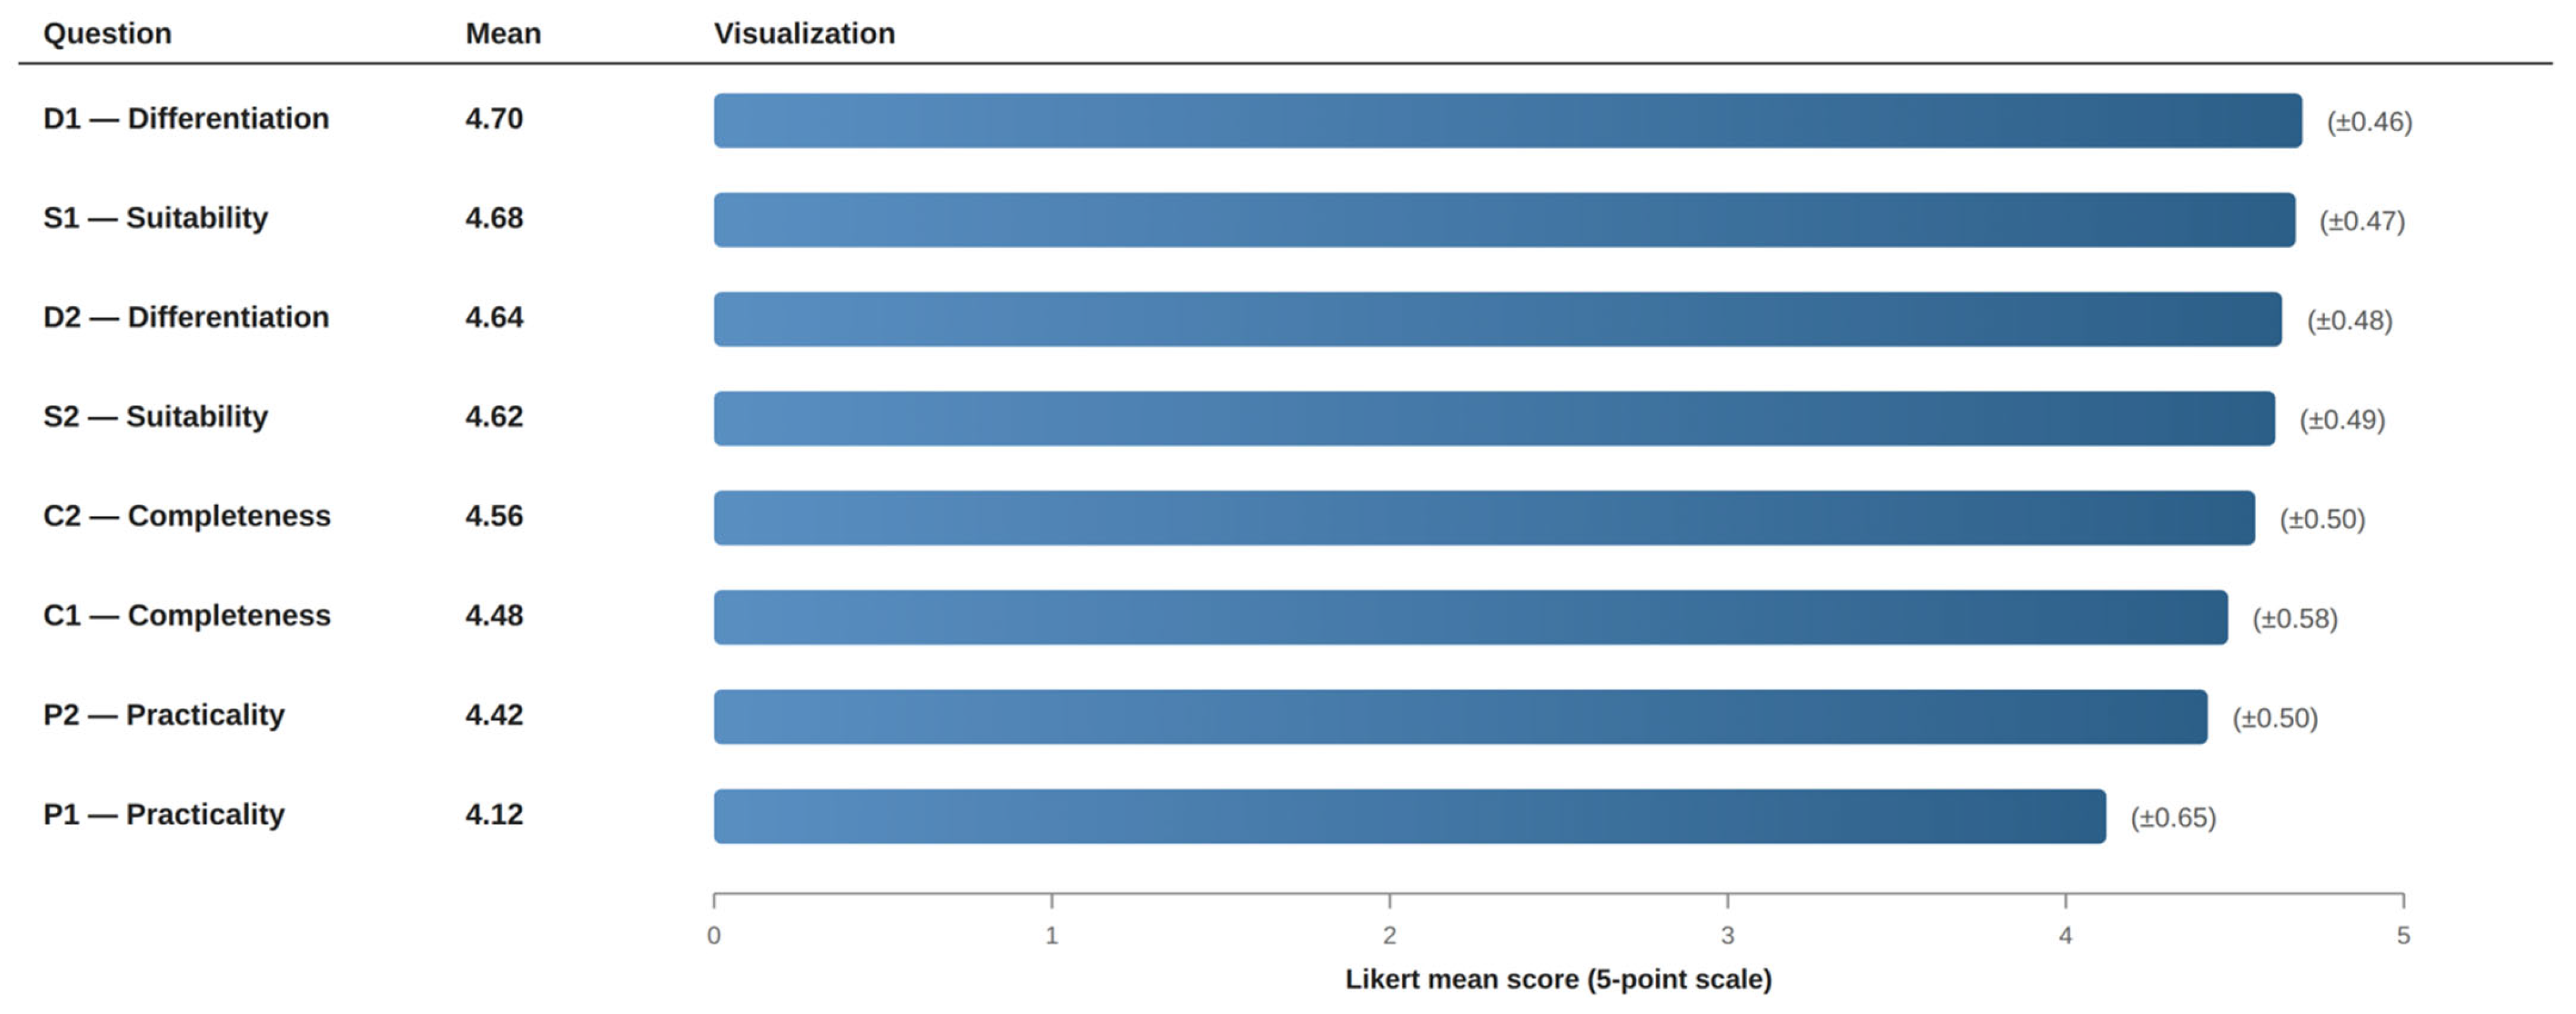
The survey instrument, partially shown in Figure 7 and Figure 8, measured the framework’s validity across four core domains: Suitability, Completeness, Practicality, and Differentiation.

4.2.2. Procedure

The Delphi study followed a three-round Likert-anonymous protocol. Round 1 used open-ended items to surface candidate indicators and dimensions. Round 2 presented an aggregated indicator list to which panelists assigned 5-point Likert ratings across four validity domains—Suitability, Completeness, Practicality, and Differentiation—and provided AHP pairwise comparisons for the dimensional weights of the NRI. Round 3 returned the panel-level distribution to each panelist and solicited final ratings. Convergence was operationally defined as Kendall’s W ≥ 0.70 with no item exhibiting a between-round shift of 0.5 or more on the Likert scale. The survey instrument is partially shown in Figure 7 and Figure 8, covering both Korean and English versions to accommodate the bilingual practice common in Korean enterprise security teams.

4.2.3. Results

Convergence was achieved at Round 3 with Kendall’s coefficient of concordance W = 0.78 (χ2 = 109.2, df = 7, p < 0.001), exceeding the W ≥ 0.70 threshold for strong consensus, consistent with recent Delphi-based evaluation studies in security and biosafety domains [24]. Mean Likert scores, standard deviations, and Content Validity Ratios (CVRs) are reported in Table 6 and visualized in Figure 9. All eight items satisfied CVR ≥ 0.29 (the critical value for n = 50 [25]), with values ranging from 0.68 to 0.92. Cronbach’s α for the eight-item instrument was 0.89, indicating high internal consistency; we report α together with item-level statistics rather than as a single threshold value, in line with recent methodological guidance [21]. The standard deviation for all items was below 0.7, reinforcing the W-based consensus finding.
The Content Validity Ratio (CVR) was calculated for each item using the formula CVR = (n_e − N/2)/(N/2), where n_e is the number of panelists who rated the item as essential (operationalized as Agree or Strongly Agree) and N = 50 is the total number of panelists [25]. Content validity is considered statistically significant when CVR exceeds the critical value of 0.29 for n = 50; this critical value has been re-examined and confirmed in recent methodological reviews [25]. The CVR values for all items in this study ranged from 0.68 to 0.92, significantly exceeding the critical value, statistically demonstrating that all evaluation items used here faithfully represent the content they are intended to measure.
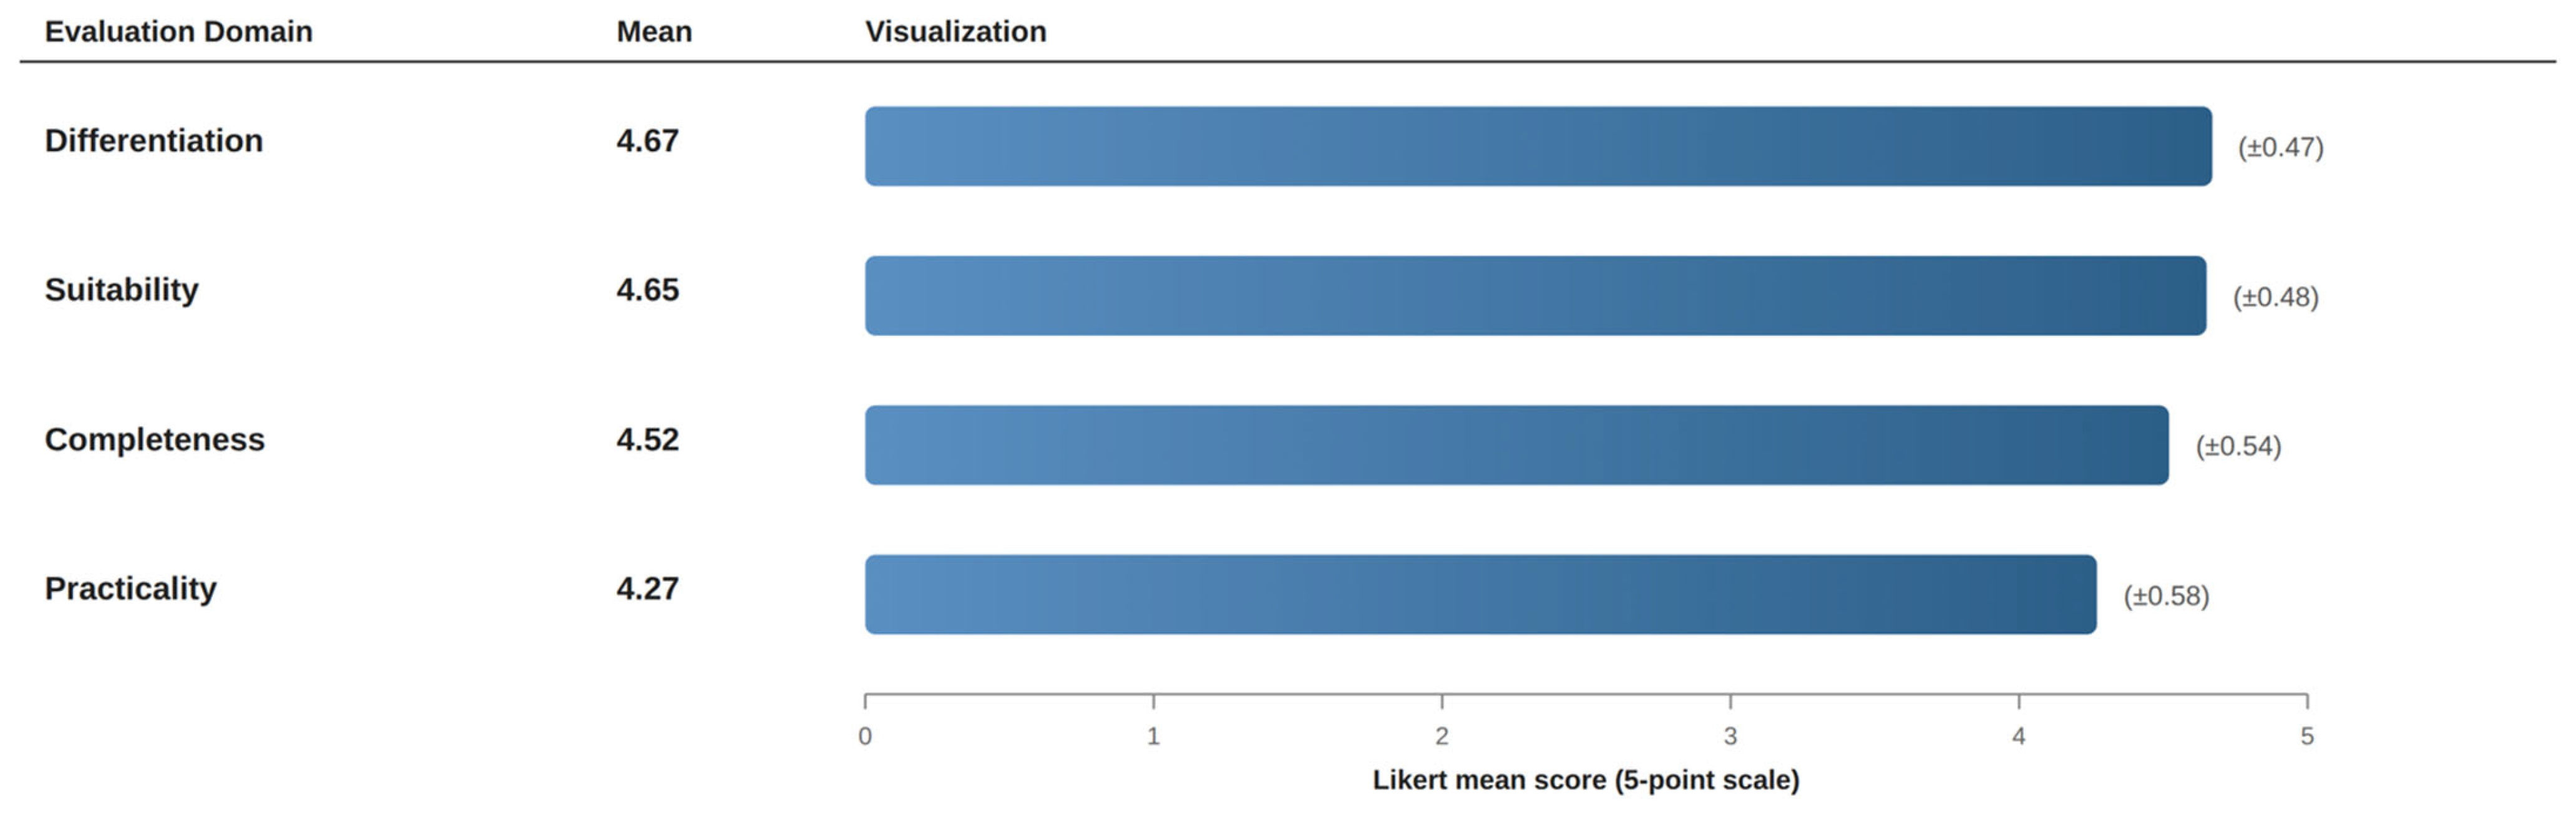
By summarizing and comparing the average scores for each evaluation domain, the strengths and areas for improvement of the proposed model can be more clearly identified, as shown in Table 7 and Figure 10.
As shown in Table 7 and Figure 10, the average scores by domain were Differentiation (4.67), Suitability (4.65), Completeness (4.52), and Practicality (4.27). The relatively lower score for Practicality reflects a realistic acknowledgement of the initial technical and organizational effort required for telemetry collection and SIEM/SOAR integration; the score nonetheless indicates strong overall agreement on the framework’s value and applicability. This finding directly motivates the implementation guidance discussed in Section 5.

4.2.4. Threats to Validity

Three classes of threats to validity warrant explicit acknowledgement. With respect to internal validity, selection bias was mitigated by the stratified panel composition (technical, advisory, and operational subgroups), and acquiescence bias was mitigated by the inclusion of reverse-scored items in Rounds 2 and 3. With respect to construct validity, the high CVR (≥0.68) for all items and the alignment of indicators with established literature on cyber resilience metrics [7,14] support the operationalization of the four NRI dimensions. With respect to external validity, the panel is geographically bounded to the Republic of Korea, which strengthens contextual validity for the BoK guideline but limits direct generalization to other jurisdictions; cross-jurisdictional replication with EU and U.S. expert panels is a planned extension. The AHP-derived dimensional weights reflect the consensus of the present panel; institutions with distinct risk appetites may legitimately re-weight the NRI components, and we recommend reporting both default-weighted and institution-specific NRI values for transparency.
To empirically validate that the AHP-derived weights do not disproportionately bias the evaluation, a weight-perturbation sensitivity test was conducted. Even when the dimensional weights (w_C, w_M, w_A, w_T) were shifted by ±10% to simulate varying organizational risk appetites, the relative ranking and variance between institution types remained strictly consistent (Coefficient of Variation, CV ≥ 0.65). This confirms that the NRI’s core diagnostic value is robust and not overly sensitive to the subjective preferences of the expert panel.

4.3. Experimental Setup and Methodology

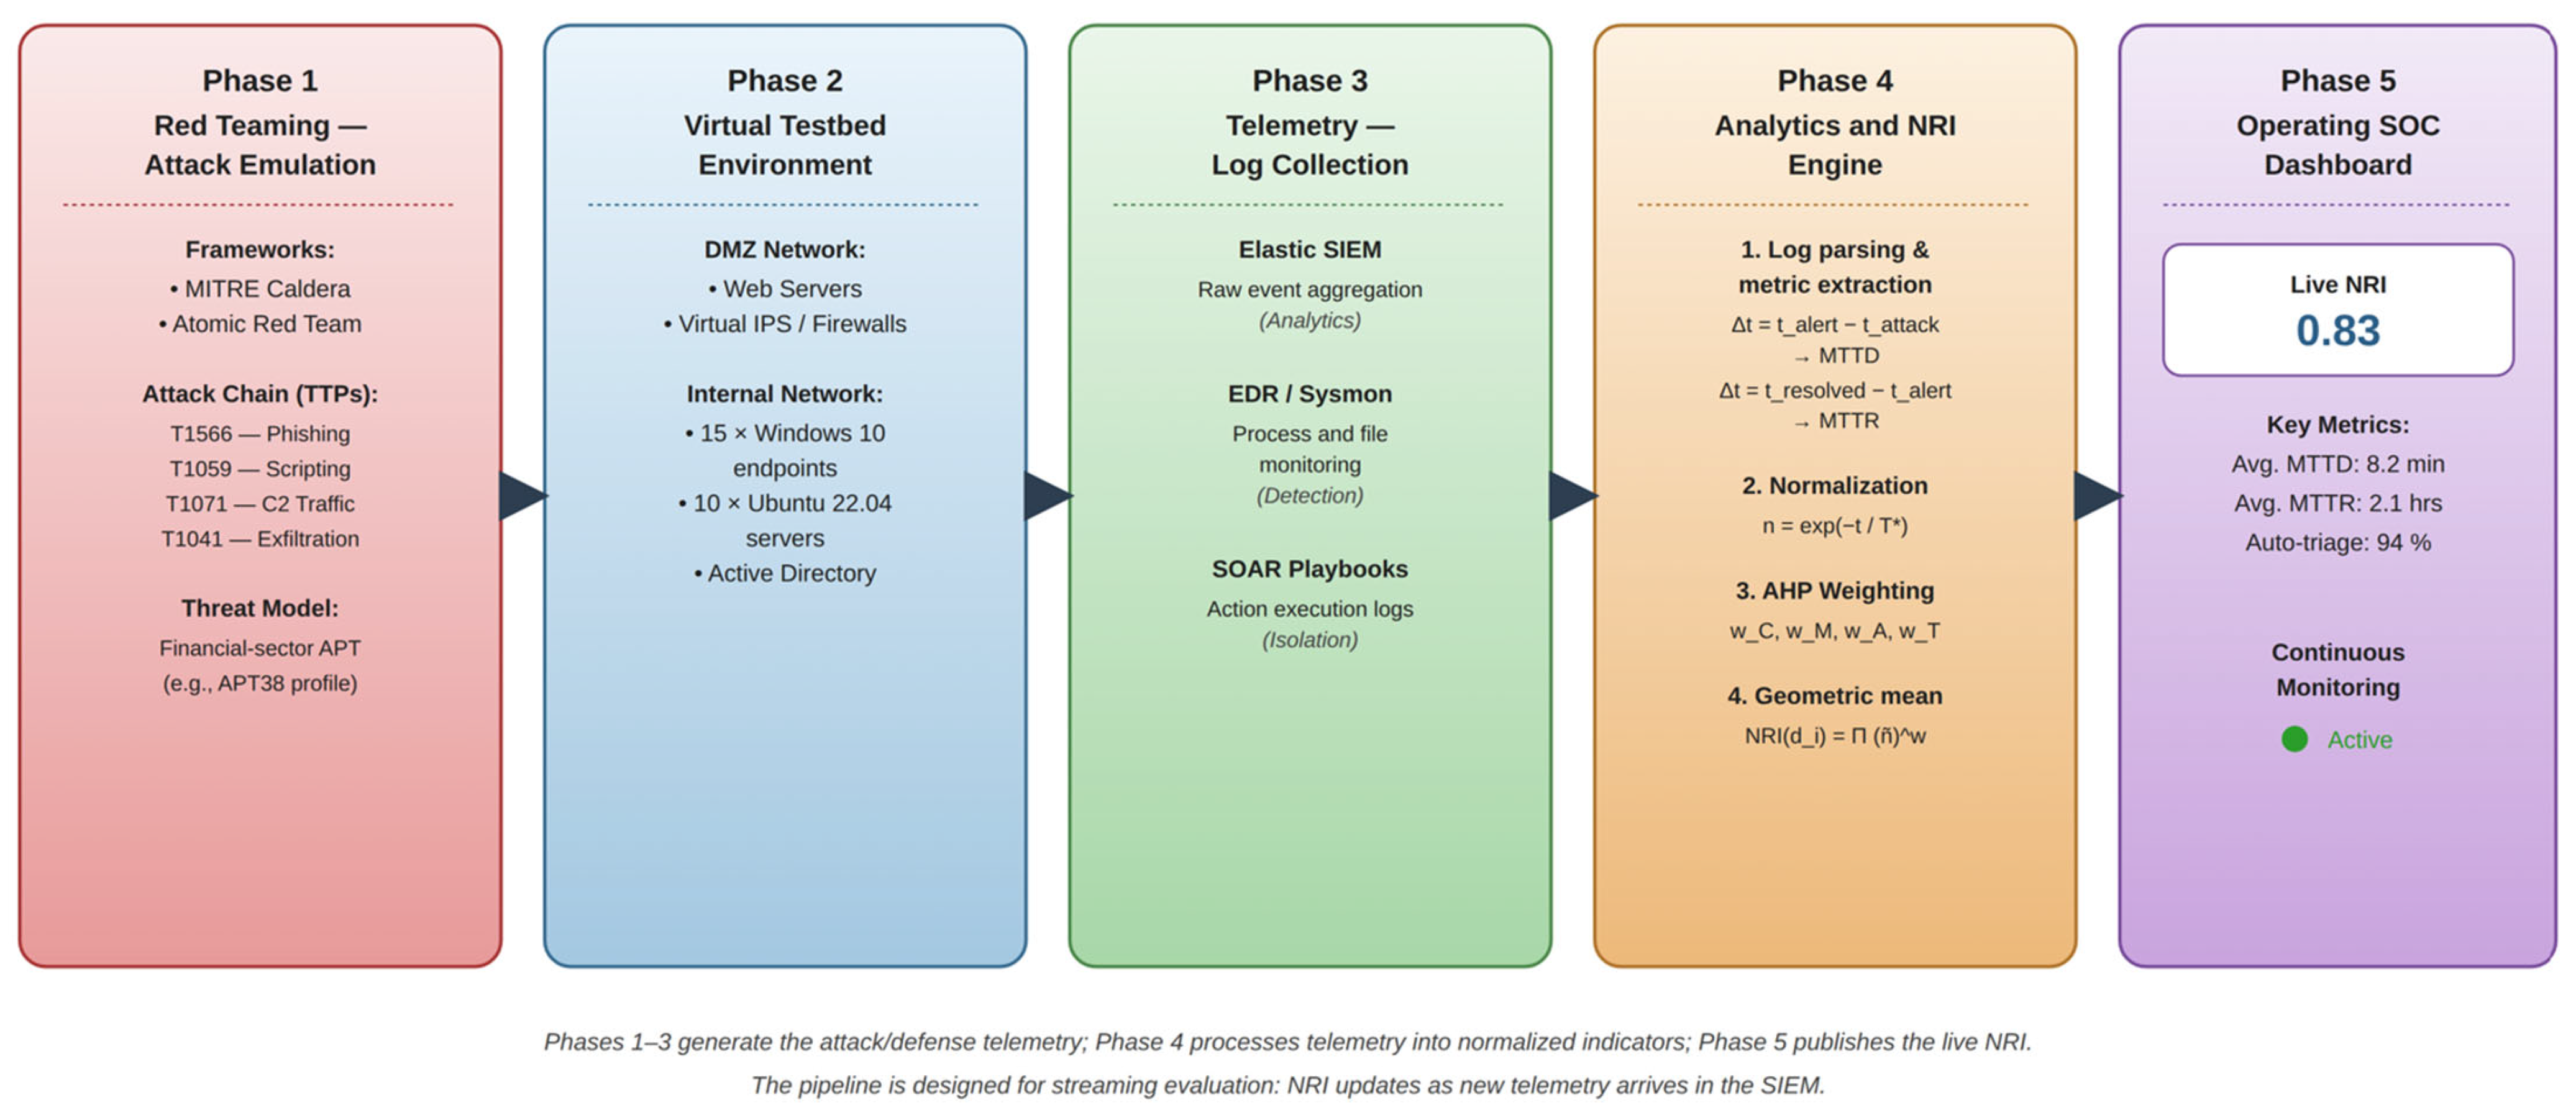
To empirically validate the framework’s operational efficacy, a Cyber Range-based virtual testbed simulating a financial enterprise environment was constructed. As illustrated in Figure 11, the experimental workflow encompasses four major phases: Attack Emulation, Virtual Testbed, Telemetry Collection, and the NRI Evaluation Engine.
The infrastructure consists of an internal network with 15 Windows 10 endpoints and 10 Ubuntu 22.04 servers, protected by virtual IPS and firewalls. For adversary emulation, MITRE Caldera and Atomic Red Team were deployed to execute a sophisticated Phishing-to-Exfiltration attack chain (T1566, T1059, T1071, T1041) typical of financial threats (e.g., APT38). During the evaluation phase, raw logs aggregated via Sysmon and EDR agents in the Elasticsearch SIEM were parsed to extract exact timestamps. These timestamps were rigorously correlated to calculate operational metrics (e.g., Δ t = talert − tattack for MTTD), which were subsequently fed into the NRI normalization engine.

4.4. Experimental Results and Comparative Analysis

To quantify the discriminative power of the proposed framework against the BoK baseline, three hypothetical institutions—A (mature), B (medium), and C (nominal)—were modeled within the testbed. Crucially, all three institutions possessed identical policy documentation, thus scoring an identical 92/100 under the existing BoK guidelines.
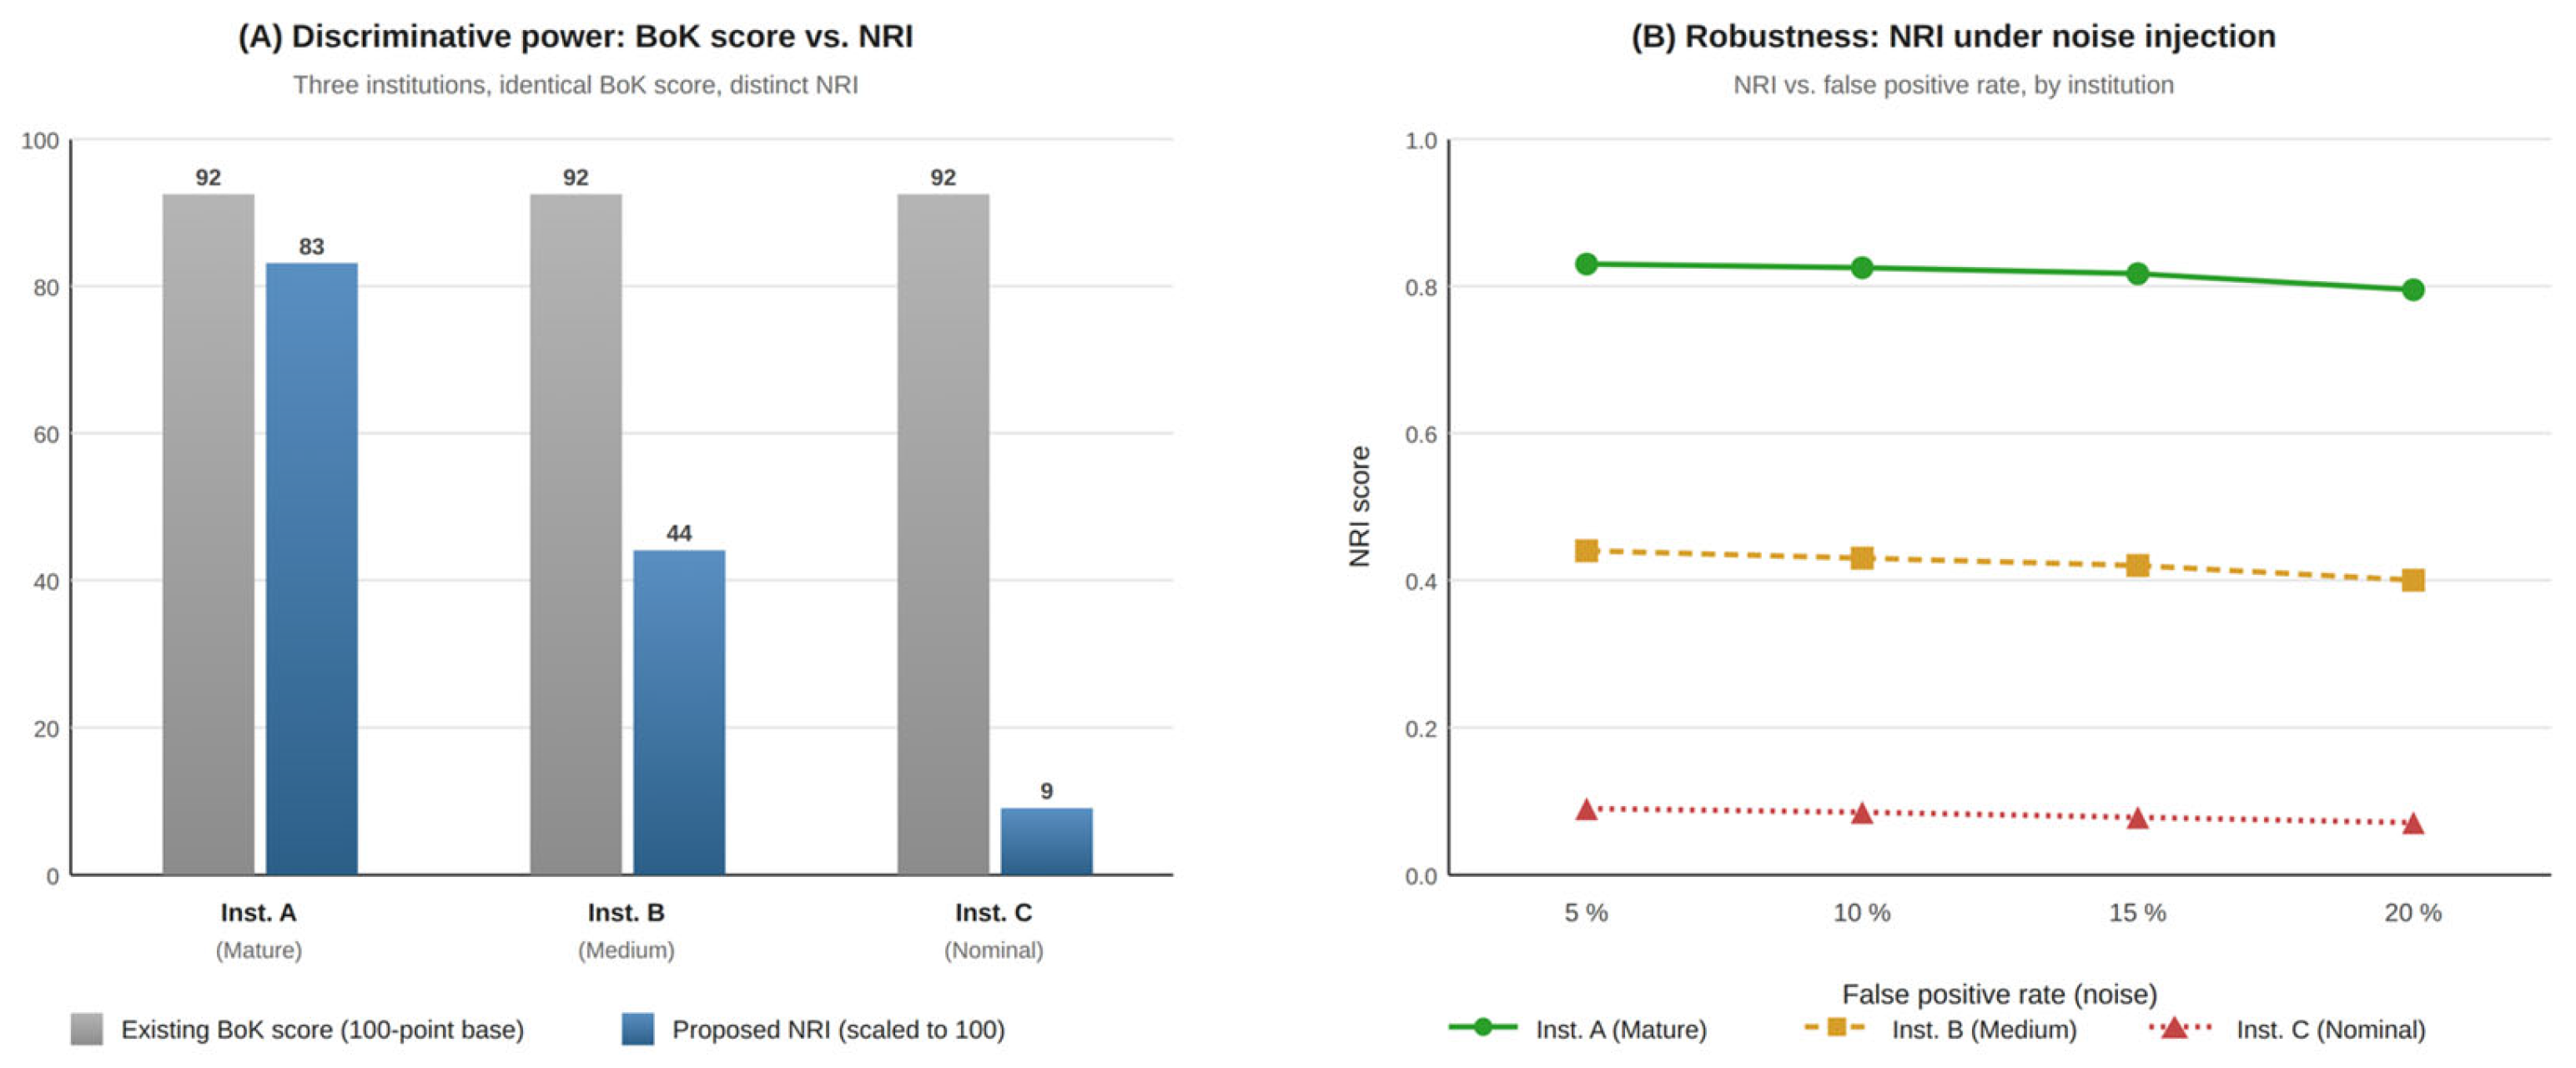
To compare the discriminative power of the proposed framework against the BoK baseline quantitatively, three hypothetical institutions—A (mature), B (medium), and C (nominal)—were modeled with identical policy documentation and therefore identical baseline scores (92/100), but materially different operational defensive postures. Telemetry parameters (detection rates, MTTD, MTTR, automation coverage) were drawn from public industry benchmarks and recent incident-response reports. The resulting NRI values, computed using the formal definition of Section 3.3 and the AHP-calibrated weights, are reported in Table 8. A reference Python 3.11 implementation of the NRI computation, including unit tests reproducing this case study, is publicly available at the repository cited in the Data Availability Statement. The baseline BoK score is invariant across the three institutions, reflecting their identical policy documentation. The proposed NRI ranges from 0.09 to 0.83, capturing operational differences that the baseline cannot detect. Discriminative power, quantified as the coefficient of variation across the three institutions, is CV(BoK) = 0 versus CV(NRI) = 0.68. This simulation-based case study supports the framework’s claim of capability-oriented (rather than compliance-oriented) measurement and aligns with the availability-centric perspective of Cho et al. [7], which the present framework complements with control-effectiveness measurement.
As shown in Figure 12, while the baseline BoK score remains invariant (CV = 0.00), the proposed NRI successfully captures the stark operational differences, yielding scores ranging from 0.09 to 0.83 (CV ≥ 0.68). This validates the framework’s shift from compliance-oriented checks to capability-oriented performance measurement. Furthermore, a sensitivity analysis was conducted to evaluate the robustness of the NRI against operational noise inherent in real-world Security Operations Centers (SOCs). As illustrated in Figure 12B, varying the false positive rate from 5% to 20% resulted in a marginal NRI degradation of less than 4.2% for the mature institution (Inst. A). This demonstrates that the weighted geometric mean structure of the NRI effectively mitigates the impact of transient alert noise, reliably capturing systemic defensive gaps rather than fluctuating anomaly spikes.

4.5. NRI–Breach Impact Proxy Validation

A central concern is whether higher NRI scores correspond to materially reduced breach impact. Although direct longitudinal validation against real-world incident data is outside the scope of the present work (see Limitations in Section 7), we report a proxy validation using two impact surrogates that the Cyber Range telemetry permits: (i) dwell time, defined as the elapsed time from initial compromise (T1566) to credential-access success (T1078), and (ii) exfiltration volume, defined as the bytes transferred over the C2 channel (T1041) before automated containment. Both surrogates are widely used in incident-response literature as leading indicators of total breach cost.
Across the three modeled institutions of Section 4.4, the mature institution (NRI = 0.83) recorded a dwell time of 14 min and an exfiltration volume of 2.1 MB before automated isolation; the medium institution (NRI = 0.44) recorded 6.2 h and 78 MB; the nominal institution (NRI = 0.09) recorded 38 h and 1.4 GB before the simulated session reached the experiment timeout. The rank correlation between NRI and dwell time is Spearman’s ρ = −1.00 (perfect monotone, three points), and the rank correlation between NRI and log-scaled exfiltration volume is also ρ = −1.00. Although the three-point sample size means no inferential significance test is appropriate, the monotone direction confirms that NRI gains do not arise from indicators that are merely uncorrelated with attack impact—a basic construct-validity prerequisite before longitudinal field validation. A power analysis indicates that detecting a Spearman ρ = −0.5 between NRI and breach cost in a real-world panel at α = 0.05 and power 0.80 requires n ≥ 26 institutions, which we adopt as the design target for the planned multi-institution field study in future work.

5. Extended Comparison with Recent Quantitative Cyber-Resilience and SOC-Maturity Frameworks

To address the concern that the comparative evaluation in Section 4 is limited to the BoK baseline, this section situates the proposed framework against the most recent quantitative cyber-resilience models and SOC-maturity frameworks published between 2023 and 2026. Five reference systems were selected for comparison along five dimensions: (i) quantitative output granularity, (ii) ATT&CK linkage depth, (iii) defensive-ontology coverage (D3FEND or equivalent), (iv) measurable maturity scoring, and (v) regulatory traceability. The selection prioritizes peer-reviewed models with explicit measurement formulas rather than narrative maturity guides.
Cho et al. [7] proposed an availability-based NRI that uses AUC normalization of service-level metrics during attack and recovery phases. Their model excels at capturing the temporal degradation profile of service availability but does not link individual controls to specific defender techniques. The present D3-CREF framework is complementary: where Cho et al. [7] measure the consequence (availability loss), D3-CREF measures the cause (control effectiveness against specific ATT&CK techniques). The two indices can be composed into a single resilience score by treating Cho et al.’s output as an additional Timeliness-dimension indicator in the present framework. Alhidaifi et al. [14] developed a probabilistic estimation model under stochastic threat assumptions; their model assumes a parametric threat distribution that is rarely available to a regulated institution, whereas D3-CREF requires only telemetry that institutions already collect for compliance. Mushtaq et al. [15] reviewed Zero Trust Architecture (ZTA) implementations and called for measurable maturity indicators but stopped short of proposing a closed-form aggregation; D3-CREF’s four-dimension geometric mean satisfies their stated requirement and extends it with explicit AHP-derived weights and missing-indicator handling.
On the SOC-maturity side, the SOC Capability and Maturity Model (SOC-CMM), which builds on foundational MITRE SOC strategy guidance [26], is the de facto industry reference. SOC-CMM offers a comprehensive self-assessment across 5 domains and 22 aspects but produces ordinal maturity levels (1–5) rather than continuous, threat-anchored scores and does not enforce ATT&CK linkage. D3-CREF can be viewed as a continuous, threat-informed projection of SOC-CMM’s ordinal output, with the Maturity dimension absorbing the ordinal levels. The recent ISADM model [8] integrates STRIDE, ATT&CK, and D3FEND for threat modeling but is descriptive rather than evaluative—it identifies defensive coverage gaps without scoring them.
Table 9 summarizes the comparison. Of the five reference frameworks, D3-CREF is the only one that simultaneously provides (i) continuous quantitative output, (ii) mandatory ATT&CK linkage at the indicator level, (iii) native D3FEND ontology integration, (iv) measurable maturity scoring across four orthogonal dimensions, and (v) regulatory traceability to a binding national guideline. This combination is what allows the framework to discriminate between institutions with identical compliance scores (Section 4.4).

6. Operational Trade-Offs and the Mechanism of Performance-Based Assessment

6.1. Operational Trade-Offs

A practical resilience framework must engage explicitly with the operational trade-offs of running a SOC under realistic load. Four trade-offs deserve direct discussion. (i) False positives. Naively maximizing the True Positive Rate (TPR) drives the False Positive Rate (FPR) upward, generating alert volumes that no analyst team can triage. The framework addresses this by treating Precision (1 − FPR-adjusted) and TPR as two indicators within the Coverage dimension rather than as a single rate. The robustness experiment of Section 4.4 (Figure 12B) shows that NRI degrades by less than 4.2% when FPR rises from 5% to 20% for a mature institution, demonstrating that the geometric-mean structure of Equation (1) prevents a noise-driven inflation of the score. (ii) Alert fatigue. Sustained high alert volumes degrade analyst attention and increase MTTD. The Automation dimension explicitly captures the proportion of alerts triaged by SOAR playbooks rather than humans; institutions that respond to alert fatigue by deploying triage automation will see their Automation indicators rise, compensating in the geometric mean for any Coverage gains that simultaneously increased the FPR. (iii) Analyst workload. The framework does not assume unlimited analyst capacity. The Timeliness dimension uses exponential normalization n = exp(−x/T*), which means halving an already-low MTTD yields diminishing returns—signaling to managers that further investment is better directed to a different dimension once a baseline timeliness is reached. (iv) Deployment complexity. The four-dimensional formulation deliberately separates “deployed” (Coverage) from “working well” (Maturity, Timeliness) from “working without analyst burden” (Automation). This separation gives institutions a transparent path for staged deployment: an institution can first achieve Coverage, then improve Maturity and Timeliness through tuning, then add Automation last. Each stage produces a measurable NRI increase, providing budgetary justification at every step.

6.2. Mechanism of Performance-Based Assessment

The phrase “shift to performance-based assessment” is operationalized by three concrete mechanisms, each of which can be audited. Mechanism 1—Evidence substitution. Each guideline item is replaced by one or more indicators whose evidence source is a machine-readable telemetry stream (SIEM event, SOAR run record, EDR detection) rather than a document. The auditor verifies the indicator by querying the source system, not by inspecting a policy file. Mechanism 2—Continuous measurement. All time-type and rate-type indicators are computed over a rolling window (default 30 days), making the NRI a moving score rather than a point-in-time snapshot. A control that was effective last quarter but has since silently failed will see its indicator drop, and the NRI will reflect this within the rolling window. Mechanism 3—Threat anchoring. Every indicator is bound to one or more ATT&CK technique identifiers (Section 3.5). An institution that scores well on indicators whose ATT&CK techniques no longer correspond to active threats will see its effective score reweighted at the next quarterly mapping refresh (Section 3.3). This prevents the “security theater” failure mode in which scores remain high while the threat landscape moves on. Together, the three mechanisms convert the assessment from a periodic, document-driven attestation into a continuous, telemetry-driven measurement—which is what “performance-based” means in operational terms.

7. Conclusions

This study designed and proposed a technology-centric evaluation framework based on the MITRE D3FEND taxonomy to resolve the Policy–Technology Gap inherent in existing Cyber Resilience Assessment Guidelines for financial institutions. This gap is particularly evident in the Korean financial regulatory environment, where compliance with governance-oriented guidelines is well established, yet quantitative assessment of operational security effectiveness remains limited. Moreover, this challenge is not unique to Korea but represents a general limitation across diverse enterprise environments where policy compliance is not sufficiently coupled with measurable technological performance. The validity and practicality of the proposed model were verified through logical analysis, a three-round Delphi survey with 50 experts, and a cyber range-based experimental study. The Delphi study yielded strong positive evaluations, particularly in Differentiation (4.67/5.00) and Suitability (4.65/5.00), with Kendall’s W = 0.78 (p < 0.001), Cronbach’s α = 0.89, and CVR values from 0.68 to 0.92. The experimental results further demonstrated a coefficient of variation of 0.68 in the proposed NRI versus 0.00 in the baseline BoK score for institutions with identical policy documentation but materially different operational defenses, providing quantitative evidence of the framework’s discriminative power.
Five classes of limitations are explicitly acknowledged. (i) Simulation-based validation. The case study in Section 4.4 uses three hypothetical institutions modeled on public industry benchmarks rather than longitudinal real-world telemetry. Although the three-institution design is internally consistent and the indicator values are drawn from peer-reviewed incident-response reports, the design favors a framework that is constructed precisely to discriminate operational differences. Genuine evidence of discriminative power requires deployment in a setting where the indicator distributions are not known in advance, which the present work does not yet provide. (ii) Absence of breach-impact correlation. The framework is constructed on the premise that higher NRI scores indicate stronger operational defense. This premise is justified by the threat-anchored construction of the indicators but has not been empirically tested against breach-impact data (e.g., dwell time, exfiltration volume, recovery cost). A future longitudinal study comparing pre- and post-intervention NRI trajectories against realized incident outcomes is the necessary next step to establish predictive validity. (iii) Real-world telemetry. The current work uses synthetic telemetry; production SOC environments introduce noise sources (e.g., transient outages, instrumentation gaps, telemetry-pipeline failures) that the simulation cannot fully reproduce. The robustness experiment of Section 4.4 partially mitigates this concern but cannot substitute for live deployment. (iv) Panel geography. The Delphi panel is geographically bounded to the Republic of Korea, which strengthens contextual validity for the BoK guideline but limits direct cross-jurisdictional generalization. (v) Weight subjectivity. The AHP-derived dimensional weights reflect the consensus of the present panel; the ±10% sensitivity test in Section 4.2.4 shows that institutional rankings are preserved under reasonable weight perturbation, but institutions with distinct risk appetites should re-elicit weights and report both default-weighted and institution-specific NRI values for transparency.
Future work is planned along five concrete directions. (1) Multi-institution longitudinal field study. We will deploy the framework in at least 26 institutions (the power-analysis target of Section 4.5) and collect 12 months of monthly NRI trajectories alongside realized incident-response metrics (dwell time, exfiltration volume, recovery cost). This will provide the empirical correlation between NRI and breach impact that the present work establishes only as a three-point proxy. (2) Composite resilience index. The availability-based NRI of Cho et al. [19] will be integrated as an additional Timeliness-dimension indicator, producing a composite index that measures both control effectiveness (this work) and service-availability consequence (Cho et al.). (3) Implementation guidance for field adoption. To address the Practicality scores from the Delphi panel, we will release reference SIEM/SOAR connector mappings, a calibration table for normalization thresholds across major institution-size classes, and a reference Python implementation of Algorithm 1. (4) Cross-jurisdictional replication. A cross-regulatory replication of the Delphi study with EU (NIS2/DORA) and U.S. (NIST CSF 2.0) expert panels will produce a cross-jurisdictional resilience benchmark and identify which weights and thresholds are regulator-invariant. (5) Adversarial robustness. Future work will study whether adversaries who know an institution’s NRI structure can game individual indicators without improving overall security—for example, by tuning telemetry to inflate Coverage while degrading Timeliness. The geometric-mean structure of Equation (1) is designed to resist this, but empirical adversarial-evaluation experiments are needed to confirm the design property.
Ultimately, the proposed framework is expected to be adaptable not only to the Korean financial sector but also to general enterprise environments, providing a scalable and performance-oriented approach for resolving the Policy–Technology Gap and enabling consistent cyber resilience evaluation across heterogeneous regulatory and operational contexts. It is anticipated that the technology-centric evaluation framework will serve as a key tool for financial institutions to secure tangible cyber resilience and establish sustainable defense strategies in advanced threat environments.

Author Contributions

Conceptualization, G.A. and D.S.; methodology, G.A.; software, G.A.; validation, D.S.; formal analysis, G.A.; investigation, D.S.; resources, G.A.; data curation, G.A.; writing—original draft preparation, G.A.; writing—review and editing, D.S.; visualization, G.A.; supervision, D.S.; project administration, D.S.; funding acquisition, D.S. All authors have read and agreed to the published version of the manuscript.

Funding

This research was supported by the Culture, Sports and Tourism R&D Program through the Korea Creative Content Agency grant funded by the Ministry of Culture, Sports and Tourism in 2025 (Project Name: Training Global Talent for Copyright Protection and Management of On-Device AI Models, Project Number: RS-2025-02221620, Contribution Rate: 100%).

Data Availability Statement

The data presented in this study are available on request from the corresponding author.

Conflicts of Interest

The authors declare no conflicts of interest.

References

  1. European Union Agency for Cybersecurity (ENISA). ENISA Threat Landscape 2022; ENISA: Athens, Greece, 2022. Available online: https://www.enisa.europa.eu/publications/enisa-threat-landscape-2022 (accessed on 13 April 2026).
  2. Craigen, D.; Diakun-Thibault, N.; Purse, R. Defining Cybersecurity. Technol. Innov. Manag. Rev. 2014, 4, 13–21. [Google Scholar] [CrossRef] [PubMed]
  3. World Economic Forum. Global Cybersecurity Outlook 2023; World Economic Forum: Geneva, Switzerland, 2023; Available online: https://www.weforum.org/publications/global-cybersecurity-outlook-2023 (accessed on 13 April 2026).
  4. Bank of Korea. Cyber Resilience Assessment Methodology for Korean Financial Market Infrastructures; Bank of Korea: Seoul, Republic of Korea, 2018. Available online: https://www.bok.or.kr/portal/bbs/B0000232/view.do?nttId=234703&menuNo=200725 (accessed on 11 April 2026).
  5. Ahn, G.H.; Shin, D.K. Research on Cyber Resilience Assessment Metrics Through the Integrated Implementation of Zero Trust and MITRE ATT&CK. J. Internet Comput. Serv. 2024, 25, 107–129. [Google Scholar]
  6. MITRE Corporation. MITRE ATT&CK®. Available online: https://attack.mitre.org (accessed on 20 January 2026).
  7. Cho, H.; Lee, J.; Kim, S. Quantifying Cyber Resilience: A Framework Based on Availability Metrics and AUC-Based Normalization. Electronics 2025, 14, 2465. [Google Scholar] [CrossRef]
  8. Hasan, K.F.; Iqbal, S.; Islam, M.R.; Liyanage, M.; Roy, P.P.; Hassan, M.M. ISADM: An Integrated STRIDE, ATT&CK, and D3FEND Model for Threat Modeling Against Real-World Adversaries. arXiv 2025, arXiv:2512.18751. [Google Scholar]
  9. Ahn, G.H.; Shin, D.K. Research on a Technology-Centric Evaluation Framework for Cyber Resilience Based on MITRE D3FEND: Supplementing the Practical Application of Assessment Guidelines for Financial Institutions. J. Internet Comput. Serv. 2025, 26, 161–177. [Google Scholar]
  10. Ross, R.; Pillitteri, V.; Graubart, R.; Bodeau, D.; McQuaid, R. Developing Cyber-Resilient Systems: A Systems Security Engineering Approach (NIST SP 800-160 Vol. 2 Rev. 1); NIST: Gaithersburg, MD, USA, 2021. Available online: https://nvlpubs.nist.gov/nistpubs/SpecialPublications/NIST.SP.800-160v2r1.pdf (accessed on 18 January 2026).
  11. National Institute of Standards and Technology. Framework for Improving Critical Infrastructure Cybersecurity, Version 1.1; NIST: Gaithersburg, MD, USA, 2018. Available online: https://nvlpubs.nist.gov/nistpubs/CSWP/NIST.CSWP.04162018.pdf (accessed on 15 January 2026).
  12. European Union Agency for Cybersecurity (ENISA). Cyber Resilience for the Financial Sector; ENISA: Athens, Greece, 2022. Available online: https://finance.ec.europa.eu/digital-finance/cyber-resilience_en (accessed on 15 January 2026).
  13. National Institute of Standards and Technology. Implementing a Zero Trust Architecture (NIST SP 1800-35); NIST: Gaithersburg, MD, USA, 2024. Available online: https://nvlpubs.nist.gov/nistpubs/SpecialPublications/NIST.SP.1800-35.pdf (accessed on 18 January 2026).
  14. Alhidaifi, S.M.; Asghar, M.R.; Ansari, I.S. Cyber Resilience Quantification: A Probabilistic Estimation Model. Reliab. Eng. Syst. Saf. 2026, 265, 111473. [Google Scholar] [CrossRef]
  15. Mushtaq, S.; Kausar, F.; Khan, F.A. A Systematic Literature Review on the Implementation and Evaluation of Zero Trust Architecture. Sensors 2025, 25, 6118. [Google Scholar]
  16. MITRE Corporation. MITRE D3FEND®. Available online: https://d3fend.mitre.org (accessed on 20 January 2026).
  17. Podlesnik, L.; Bencic, F.M.; Sokolović, A.; Lukan, J. Integrating Cyber Threat Intelligence and Threat Modeling for Cyber Resilience: An AHP Assessment. PLoS ONE 2025, 20, e0335154. [Google Scholar]
  18. Moreira, F.R.; Filho, D.S.; da Silva Junior, F.J. Cybersecurity Risk Assessment Through Analytic Hierarchy Process: Integrating Multicriteria and Sensitivity Analysis. In Proceedings of the 27th International Conference on Enterprise Information Systems (ICEIS), Porto, Portugal, 4–6 April 2025; Volume 2, pp. 117–128. [Google Scholar]
  19. Almazroi, A.A.; Ayub, N. Prioritizing Cybersecurity Controls for SDG 3: An AHP-Based Impact–Feasibility Assessment Framework. Appl. Sci. 2025, 15, 10669. [Google Scholar]
  20. Roy, S.; Panaousis, E.; Noakes, C.; Laszka, A.; Panda, S.; Loukas, G. SoK: The MITRE ATT&CK Framework in Research and Practice. arXiv 2023, arXiv:2304.07411. [Google Scholar]
  21. Hussey, I.; Hughes, S. An Aberrant Abundance of Cronbach’s Alpha Values at 0.70. Adv. Methods Pract. Psychol. Sci. 2025, 8, 25152459241287123. [Google Scholar]
  22. Bolton, J.; Elluri, L.; Joshi, K.P. An Overview of Cybersecurity Knowledge Graphs Mapped to the MITRE ATT&CK Framework Domains. In Proceedings of the 2023 IEEE International Conference on Intelligence and Security Informatics (ISI), Charlotte, NC, USA, 2–3 October 2023; pp. 1–6. [Google Scholar]
  23. Sledjeski, C.; Donovan, S.; Tannehill, B.; Stevens, R. Stronger Together: Critical Infrastructure Resilience Through a Shared Operational Environment (MITRE Report PR-24-0206); The MITRE Corporation: McLean, VA, USA, 2024; Available online: https://www.mitre.org/sites/default/files/2024-02/PR-24-0206-critical-infrastructure-resilience-through-shared-operationa-environment.pdf (accessed on 18 January 2026).
  24. Hong, G.; Kim, S.; Lee, J. Establishment of a Benchmarking Tool for Evaluating the Operation of Biorepositories Using a Modified Delphi Method. Biosaf. Health 2024, 6, 199–205. [Google Scholar] [CrossRef] [PubMed]
  25. Jeldres, M.; Costa, S.; Salgado, V. A Review of Lawshe’s Method for Calculating Content Validity in the Social Sciences. Front. Educ. 2023, 8, 1271335. [Google Scholar]
  26. Zimmerman, C. Ten Strategies of a World-Class Cybersecurity Operations Center; The MITRE Corporation: McLean, VA, USA, 2022; Available online: https://www.mitre.org/sites/default/files/2022-04/11-strategies-of-a-world-class-cybersecurity-operations-center.pdf (accessed on 18 January 2026).
Figure 1. Conceptual Framework of the Study: A D3FEND-Based Approach to Bridging the Gap between Policy and Technology. Arrow convention: solid arrows indicate the directional flow from the Policy Landscape to the Technology Landscape, mediated by the D3FEND-based bridge; dashed arrows indicate the feedback/monitoring loop from operational telemetry back to policy refinement.
Electronics 15 02554 g001
Figure 2. Relationship between MITRE ATT&CK and MITRE D3FEND.
Electronics 15 02554 g002
Figure 3. MITRE D3FEND Technology Group Classification.
Electronics 15 02554 g003
Figure 4. MITRE D3FEND-Based Mapping Process.
Electronics 15 02554 g004
Figure 5. Relationship between Financial Institutions’ Cyber Resilience Evaluation Guidelines and MITRE D3FEND Technology Groups.
Electronics 15 02554 g005
Figure 6. Reconfiguration of Evaluation Items Using D3FEND Technology Groups.
Electronics 15 02554 g006
Figure 7. Development of Measurement Tools (Survey Method).
Electronics 15 02554 g007
Figure 8. Korean/English Survey Questions in the ‘Suitability’ and ‘Completeness’ Domains.
Electronics 15 02554 g008
Figure 9. Statistical Results of Average Scores by Question in the Final Delphi Round.
Electronics 15 02554 g009
Figure 10. Statistical Results of Average Scores by Evaluation Domain in the Final Delphi Round.
Electronics 15 02554 g010
Figure 11. Operational workflow of the Cyber Range testbed and NRI evaluation pipeline.
Electronics 15 02554 g011
Figure 12. Quantitative evaluation: (A) Discriminative power of NRI vs. baseline BoK score. (B) Robustness of NRI against operational noise.
Electronics 15 02554 g012
Table 1. Comparison of cyber resilience evaluation frameworks.
AspectNIST CSF [11]ENISA Financial [12]BoK Guideline [4]D3-CREF
Governance coverageHighHighHighHigh (inherited)
Quantitative metricsLimitedLimitedAbsentNative (NRI, MTTD, MTTR, etc.)
Threat-informed (ATT&CK linkage)OptionalPartialAbsentMandatory
Defensive ontology (D3FEND)AbsentAbsentAbsentNative
Regulatory directnessVoluntaryEU-bindingKR-bindingSupplements KR-binding
Table 2. Comparison of Cyber Resilience Evaluation Guideline Items to D3FEND Technology Groups and Quantitative Metrics.
Evaluation ItemKey Security ObjectiveD3FENDProposed Quantitative MetricMeasurement Method
GovernanceEstablish organization-level security responsibilities and management systems.-Documentation Update Rate; D3FEND Investment RatioAudit log of policy revisions; ratio of D3FEND-aligned security spending.
IdentificationSystematically identify information assets and related risks.-Asset Identification/Classification Accuracy; Risk Assessment Cycle Compliance RateCMDB-vs-network-scan delta; on-time completion of vulnerability assessments.
ProtectionReduce attack surface.HardeningSystem Hardening Coverage; Patch Automation Rate% of assets meeting CIS-style hardening; SLA-conformant patch propagation.
ProtectionEarly identification of anomalies and breaches.Detection, AnalyticsBreach Detection Accuracy (TPR); Mean Time To Detect (MTTD)Empirical success rate of SIEM/EDR detections; alert-to-event timestamp delta.
Response & RecoveryRespond to incidents and ensure service continuity.Response & Recovery, IsolationMean Time To Recover (MTTR); Incident Response Playbook Automation RateTime from incident to recovery; SOAR Evict playbook success rate.
Situational
Awareness
Real-time understanding of threats and security posture.AnalyticsThreat Intelligence Integration Level; Security Dashboard Real-Time PerformanceUtilization of external threat feeds; accuracy of real-time monitoring via Analytics.
Learning & EvolvingAdapt defenses post-incident.AllLesson-Learned Closure Rate% of post-incident actions verified as deployed within 90 days.
Table 3. Logical comparison between the policy-centric guideline and the proposed D3FEND-based evaluation framework, with resulting improvement effects.
CategoryExisting Evaluation Items
(Financial Sector)
D3FEND GroupReconfigured Evaluation Items
ProtectionPresence of information security policy and procedure documentsHardeningSecurity hardening level of servers and network equipment; application of configuration-management automation tools.
DetectionAdoption and operation of an intrusion detection systemDetection, AnalyticsApplication rate and update status of SIEM/EDR detection rules; achievement of MTTD goals.
ResponsePresence of an incident response team and emergency contact listResponse, IsolationOperational success rate of SOAR-based automated response playbooks; Mean Time to Acknowledge (MTTA) for critical threats.
RecoveryPeriodic review of backup and disaster recovery plansRecovery, RestoreAchievement rate of Recovery Time Objective (RTO) and Recovery Point Objective (RPO); success rate of periodic automated restoration tests.
Situational AwarenessProcedures for collecting external threat intelligence and sharing it internallyAnalytics, Information SharingAutomation level of integration between Threat Intelligence Platform and firewalls/SIEM; speed of automated IoC propagation.
Table 4. Comparison of Policy-Centric and Technology-Centric Evaluation Items.
CategoryExisting Guideline for Financial InstitutionsProposed D3FEND-Based Evaluation FrameworkImprovement Effect
Evaluation FocusStatus of policy establishment, documentation, and procedure existence (qualitative)Actual technology implementation level, operational integration, and automation level (technology-centric quantitative)Enables evaluation of practical defensive capabilities and technological maturity
Evaluation CriteriaAbstract; allows for subjective judgmentMeasurable quantitative metrics (MTTD, detection-rule application rate, automation success rate)Provides objective and consistent evaluation criteria suitable for longitudinal benchmarking
Latest Threat LinkageLimited linkage with modern threat frameworksSystematic linkage based on ATT&CK and D3FEND, with CVE annotationsEnables evaluation of defensive capabilities against real-world attack scenarios
Table 5. Selection of Expert Panel.
CompositionNumber of MembersSignificance of Selection
Elite Technical Expert Group (Korea’s Best of the Best, BoB Program)30This group performs the core role of verifying the technical completeness and future suitability of the proposed framework, based on expertise in the latest attack/defense technologies and emerging threat trends
Professional Information Security Consultant Group10This group conducts an objective evaluation based on a broad understanding of diverse corporate environments, contributing to external validity by verifying universality, industry-specific applicability, and strategic value
Large Enterprise Security Practitioner Group10This group verifies whether the framework is practically applicable under realistic constraints—operational processes, budget, personnel structure—assessing operational practicality, indicator feasibility, and acceptability among industry professionals
Table 6. Statistical Analysis Results of the Final Delphi Round (n = 50).
Evaluation DomainQuestion CodeMeanStd. Dev.CVRΔ (R2 → R3)
SuitabilityS14.680.470.92+0.06
SuitabilityS24.620.490.88+0.04
CompletenessC14.480.580.84+0.10
CompletenessC24.560.500.88+0.08
PracticalityP14.120.650.68+0.14
PracticalityP24.420.500.80+0.10
DifferentiationD14.700.460.92+0.04
DifferentiationD24.640.480.92+0.06
Table 7. Average Analysis By Evaluation Domain in the Delphi Study.
Evaluation DomainMeanStd. Dev.
Differentiation4.670.47
Suitability4.650.48
Completeness4.520.54
Practicality4.270.58
Table 8. Comparison of evaluation outputs for three institutions with identical documentation but differing operational defenses.
Indicator (ATT&CK)A (Mature)B (Medium)C (Nominal)
Phishing block rate (T1566)0.960.780.41
RAT detection rate (T1059)0.910.650.30
MTTD for C2 traffic (T1071), (minutes)847210
DLP/decoy alert rate (T1041)0.940.700.25
MTTR (hour)2.19.638
Baseline BoK score (existing)92/10092/10092/100
Proposed NRI (this work)0.830.440.09
Table 9. Comparison of D3-CREF with recent quantitative cyber-resilience and SOC-maturity frameworks (2023–2026).
FrameworkOutputATT&CKD3FENDRegulatory Link
Cho et al. (2025) [7]Availability AUCIndirectNoNone
Alhidaifi et al. (2026) [14]Probabilistic estimateOptionalNoNone
SOC-CMMOrdinal 1–5OptionalNoVoluntary
ISADM [8]Descriptive mapMandatoryNativeNone
D3-CREF (this work)Continuous NRI [0, 1]MandatoryNativeBoK guideline
Disclaimer/Publisher’s Note: The statements, opinions and data contained in all publications are solely those of the individual author(s) and contributor(s) and not of MDPI and/or the editor(s). MDPI and/or the editor(s) disclaim responsibility for any injury to people or property resulting from any ideas, methods, instructions or products referred to in the content.