Article

Resilient SDN-Based Communication Architecture for Adaptive Control in Green Hydrogen Hybrid Microgrids

by
Joaquín Ascencio Villagra
1,
Ricardo Pérez Guzmán
1,*,
Marco Rivera
2,*,
Patrick Wheeler
2 and
Frede Blaabjerg
3
1
Department of Computer Science, Universidad de Talca, Curico 3340000, Chile
2
Power Electronics, Machines and Control (PEMC) Research Institute, University of Nottingham, Nottingham NG7 2RD, UK
3
Department of Energy Technology, Aalborg University, 9220 Aalborg, Denmark
*
Authors to whom correspondence should be addressed.
Electronics 2026, 15(11), 2335; https://doi.org/10.3390/electronics15112335
Submission received: 11 April 2026 / Revised: 22 May 2026 / Accepted: 25 May 2026 / Published: 28 May 2026

Abstract

Integrating green hydrogen systems into hybrid microgrids introduces nonlinear dynamics that compromise control stability during operational transitions. The performance of the advanced control loops depends on the latency and reliability provided by the communication infrastructure. This paper proposes a Software-Defined Networking (SDN) architecture integrated with an adaptive Quality of Service (AQoS) framework to support time-critical data flows in a hybrid microgrid with green hydrogen integration. An emulated network topology in GNS3, with OpenDaylight as the SDN controller and Open vSwitch as the forwarding plane, reproduces IEC 61850 traffic patterns, including GOOSE, control set-points and MMS. These traffic classes coordinate key microgrid components, including electrolysers, fuel cells and battery storage. Experimental results show that the SDN-AQoS framework reduces latency variance by 60% compared to unmanaged SDN configurations and delivers 49.4% higher throughput than traditional TCP/IP networks under congestion. The SDN-AQoS configuration achieves a median latency of 9.68 ms, keeping 97.5% of the measurements below the 20 ms safety threshold for electrolyser control. This level of reliability represents a substantial improvement over the plain TCP/IP at 90%, unmanaged SDN at 66.7% and static QoS policing at 60%. QoS rules are configured through the RESTCONF interface and remain fixed during each experiment while enabling the future integration of reinforcement learning agents for autonomous QoS adaptation. At the same time, this framework supports the bounded communication delay required to sustain frequency control and electrolyser safety coordination in low-inertia hydrogen microgrids during network congestion. The physical layer impact of these communication improvements remains a subject of future hardware-in-the-loop validation.

1. Introduction

Energy systems are evolving towards decentralisation and full decarbonisation, positioning green hydrogen (H2) as a key vector for renewable integration, long-term storage and multi-domain energy applications [1]. In contrast to conventional synchronous machines, which provide rotational inertia and contribute to the stability of the grid, hydrogen technologies such as Proton Exchange Membrane (PEM) electrolysers and fuel cells operate via power electronic interfaces. However, this interface results in low-inertia microgrids that are more susceptible to frequency deviations, control delays and coordination failures [2].
Hybrid microgrids integrate photovoltaic generation, Battery Energy Storage Systems (BESS) and hydrogen technology to operate in tightly coupled electrical, chemical and thermal domains [3]. The coordination of these components introduces multiple network constraints. Time-critical protection signals must arrive within 4 ms to comply with the IEC 61850 standards [4], simultaneously sharing the infrastructure with fast control setpoints and standard SCADA telemetry [5]. Fulfilling these strict requirements demands a communication network that delivers deterministic latency and bounded latency variance (jitter).
The international standard IEC 61850 defines the timing requirements governing communication in smart grids and microgrids [6,7]. Within this framework, Generic Object-Oriented Substation Event (GOOSE) messages used for protection and fast control must arrive within milliseconds [8]. Primary control signals can tolerate slightly longer delays but must stay below the 50 ms threshold. These constraints become particularly demanding during transient operating conditions, when the system shifts from grid-connected to islanded mode. In this critical window, the network must orchestrate a rapid-fire sequence of actions for islanding detection, load shedding, electrolyser power reduction, fuel cell activation and battery dispatch. The network’s capacity to process time-critical data bursts determines whether the microgrid maintains stability during transients or triggers protective disconnection [9].
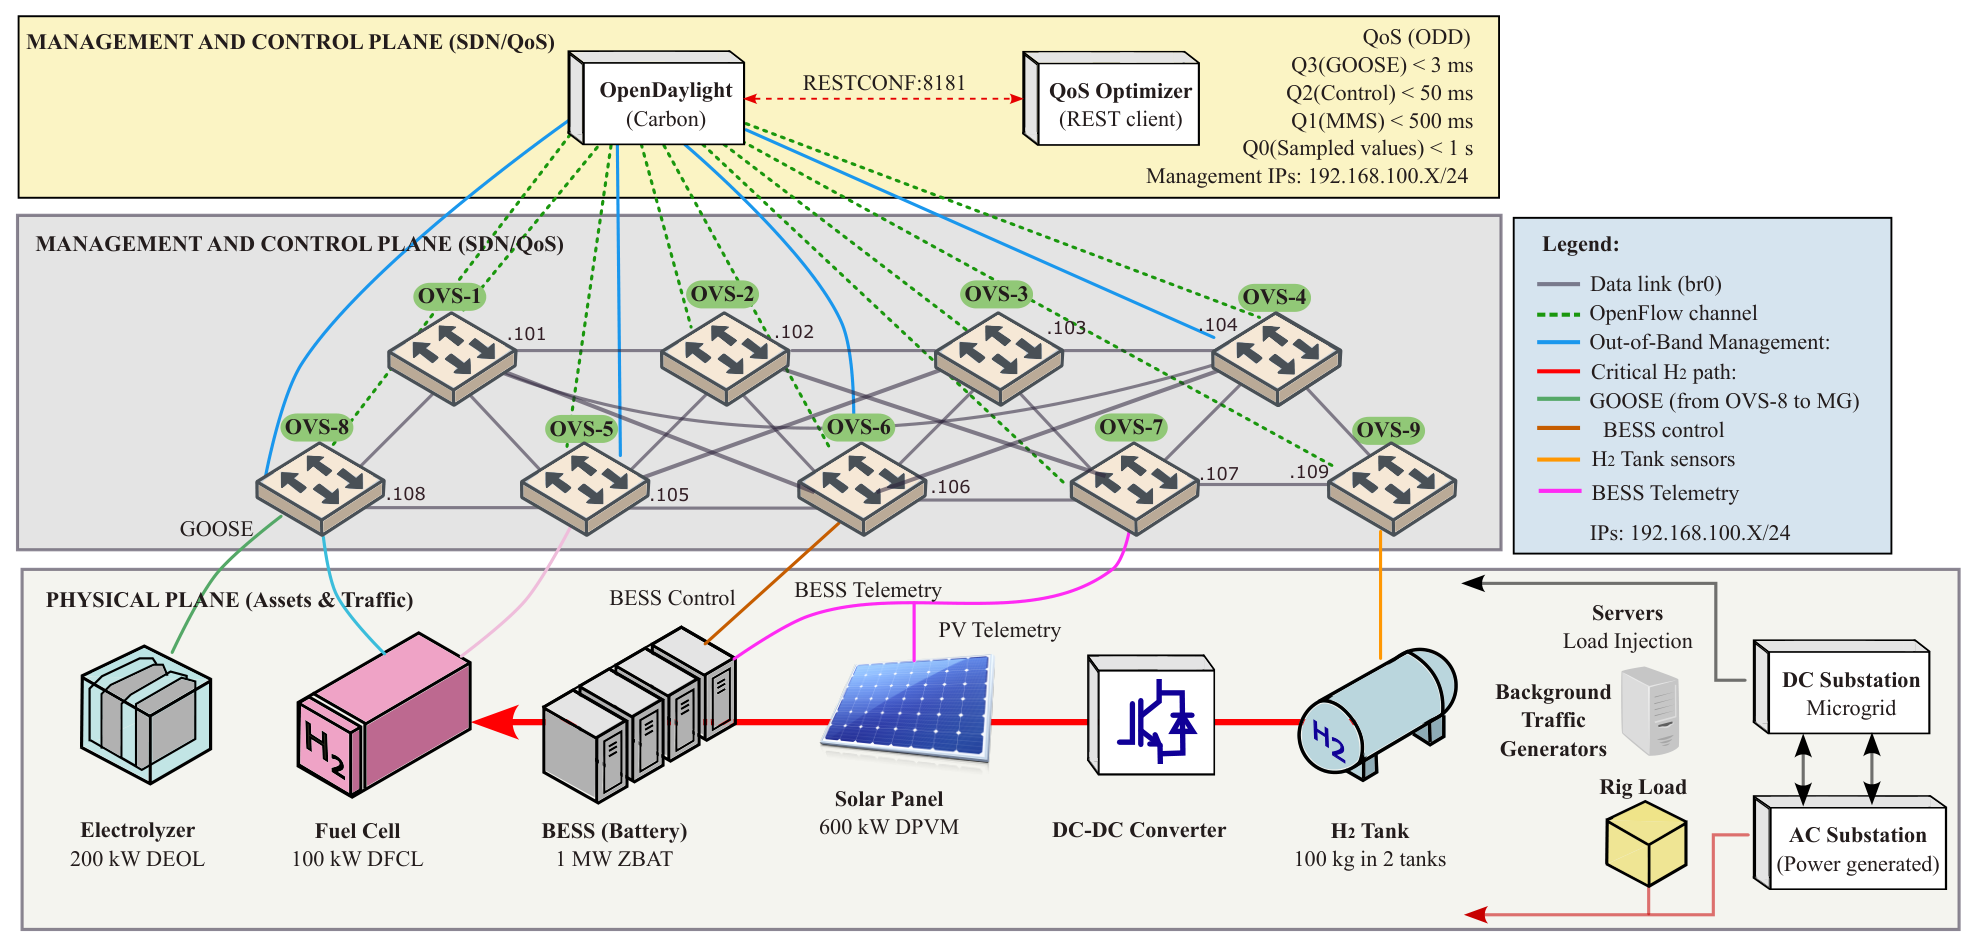
The Future Energy Efficiency with DC Microgrid Technologies (FEED-MT) facility at the University of Nottingham [10] offers a representative case study for this work. The system is shown in Figure 1, which integrates 600 kW of photovoltaic generation, 1 MW of battery storage, 200 kW PEM electrolyser, and a 100 kW fuel cell. In this low-inertia microgrid, control-loop delays of 15–20 ms can trigger power oscillations [11,12]. Unlike passive loads, the electrolyser actively participates in power balance. During islanding, the control system must rapidly ramp down electrolyser consumption or activate fuel cell injection to preserve frequency stability. Communication interruptions compromise these frequency control loops, potentially causing oscillations to force microgrid isolation. Beyond stability, communication loss blocks safety-critical signals. For example, failure to receive hydrogen-in-oxygen purity readings triggers hard-wired shutdowns, halting production and subjecting the membrane stack to thermal and chemical stress [13,14].
This study focuses on PEM electrolysers because their rapid power-modulation capability (response times of the order of seconds) makes them particularly sensitive to communication delay and jitter, in contrast to alkaline electrolysers, whose slower thermal and gas dynamics make the per-message latency budget less critical [15]. The IEC 61850 traffic envelope evaluated in this research is configured to the requirements of PEM systems. In contrast, alkaline or solid-oxide technologies would permit wider communication windows and less strict QoS constraints.
It is important to note that this work does not claim to directly measure electrical frequency, hydrogen production efficiency, membrane degradation, or closed-loop control quality in the physical plant. Instead, it evaluates the communication-layer conditions required to support this physical performance. The mapping between latency, jitter and physical safety is therefore based on the timing requirements reported for low-inertia microgrid control and PEM electrolyser operation. In this context, bounded communication delay is treated as a necessary, but not sufficient, condition for maintaining frequency regulation, thus avoiding abrupt electrolyser setpoint discontinuities and preserving the timely exchange of hydrogen safety signals. However, achieving bounded and predictable communication delays remains a critical challenge that conventional networks often cannot address.
Conventional network infrastructures were not designed to meet the hierarchical communication demands of microgrids. Standard TCP/IP [16,17] operates on best-effort delivery, lacking granularity to prioritise routine SCADA polling over critical GOOSE trip commands, which require less than 4 ms latency [18]. This limitation remains latent under steady conditions but becomes critical during transients. Sudden message bursts can fill switch egress buffers within a few milliseconds, inflating queuing delay above the GOOSE timing budget and constraining even sophisticated control algorithms.
Several deterministic communication technologies have been proposed to meet these timing demands. Time-Sensitive Networking (TSN), defined by the IEEE 802.1 working group, provides bounded latency and low jitter at the data-link layer through time-aware shaping and traffic scheduling [19]. At the network layer, the IETF Deterministic Networking (DetNet) architecture extends these guarantees across routed domains [20], while private 5G and edge-computing deployments have also been explored for latency-bounded smart-grid communication [21,22]. These approaches deliver strong timing guarantees, but they typically require specialised hardware, clock synchronisation across all nodes, or operator-managed infrastructure that is not always available in a research-scale or existing hydrogen microgrid. To overcome these limitations, Software-Defined Networking (SDN) emerges as a highly deployable solution. Operating over commodity forwarding devices, SDN introduces a programmable control plane capable of dynamically prioritising IEC 61850 traffic without altering the underlying physical infrastructure. This critical balance between deterministic guarantees and deployability motivates the SDN-based approach adopted in this work.
By decoupling the control and data planes, Software-Defined Networking (SDN) introduces the programmability required to manage latency-constrained traffic. However, SDN alone does not guarantee deterministic delivery. Without a QoS policy explicitly mapped to IEC 61850 traffic classes, the forwarding plane still behaves as a best-effort network during congestion. This limitation leads to the central research question of this study: can an SDN-controlled and IEC 61850-aware QoS pipeline reduce latency dispersion and preserve communication windows relevant to the safe operation of hydrogen assets under stressed network conditions? To answer this question, this work evaluates the proposed architecture in a FEED-MT-inspired hydrogen microgrid communication topology, considering latency, jitter, throughput and safety-threshold compliance under normal and congested operating conditions.

1.1. Related Work

Research on SDN-based communication for power systems has expanded considerably over the past decade, although most studies still target conventional substations rather than decentralised hydrogen microgrids. Early work in this area [23] demonstrated that OpenFlow, sFlow monitoring and OVSDB management can support IEC 61850 traffic engineering at the substation level. That research established SDN as a useful mechanism for centralised visibility and traffic management. Its evaluation, however, was conducted on a flat substation topology and did not address fine-grained queue scheduling for time-critical messages, metering for Sampled-Values bursts, or the bursty traffic interactions introduced by hydrogen-specific events such as electrolyser ramp-down, fuel-cell activation and BESS dispatch. Building on that baseline, the framework proposed in [24] mapped GOOSE, MMS and Sampled Values to differentiated queues managed by OpenDaylight and confirmed that queue-based scheduling reduces latency for high-priority traffic. The evaluation, nevertheless, was restricted to a single switch topology and did not analyse multi-hop congestion or competing background flows.
A second line of research approaches SDN from a resilience and cybersecurity perspective. The study in [25] demonstrates that OpenFlow fast failover groups can restore MMS connectivity with minimal packet loss following a link failure. However, because the setup is restricted to two switches and a single fault scenario, the scalability of recovery times during cascading failures or concurrent traffic surges remains open. The optimisation framework introduced in [26] formulates route reconfiguration as a problem that preserves the observability of phasor-measurement traffic while minimising rule updates. The formulation, however, assumes a static traffic matrix and does not account for the bursty IEC 61850 mix that characterises hydrogen asset coordination.
High-scale initiatives have moved beyond single-issue setups towards integrated architectures. The SDN-microSENSE project [27] demonstrates a multi-layer architecture that combines connectivity, risk assessment and intrusion detection. Its reported metrics, however, focus on detection latency rather than on per-class QoS compliance against the IEC 61850 timing envelope. More recently, a dynamic cybersecurity framework for IEC 61850 digital substations was introduced in [28], where SDN-based smart switching isolates compromised Intelligent Electronic Devices (IEDs). That framework shows that SDN can simultaneously improve performance, availability and cybersecurity. However, its evaluation traffic still follows conventional substation patterns and does not account for the additional constraints introduced by electrolyser, fuel-cell and hydrogen safety instrumentation. These works leave open the need for a quantitative characterisation of latency, jitter, and throughput under a hydrogen-specific IEC 61850 traffic mix, which is the contribution of the present study.
Beyond the power system literature, adaptive large-scale decision making provides a useful conceptual parallel for the QoS adaptation problem addressed in this paper. The approach in [29] proposes a group decision-making system that combines clustering and fuzzy consensus to scale adaptive policy refinement across heterogeneous data sources. This approach demonstrates that adaptation can be decoupled from the transport layer via a well-defined northbound interface, allowing the optimisation strategy to evolve independently of the data-plane infrastructure. The northbound REST interface described in Section 1.3 adopts the same separation of concerns, which makes it possible to substitute future learning-based or consensus-based QoS adapters without modifying the OpenFlow pipeline.
On the hydrogen side, several studies assume that the communication layer is ideal even when the dynamic behaviour of the plant is modelled. The co-simulation effort in [30] coupled MATLAB/Simulink with OMNeT++ and observed a clear degradation of microgrid resilience as network delays increased. A complementary hardware-in-the-loop setup based on OPAL-RT and a Raspberry Pi controller [31] showed that communication latencies as low as 50–100 ms already compromise frequency regulation in a DC microgrid. Together, these results indicate that neglecting the network layer produces overly optimistic models that fail to capture the true limits of system performance. Recent reviews on cyber-physical microgrid systems [32] identify latency, jitter, packet loss and throughput as critical QoS parameters for stable operation, and note that many case studies still assume nearly perfect communication channels. In the hydrogen context, the analysis in [15] emphasises that the fast response capability of electrolysers materialises only if control signals arrive within the required time windows. Otherwise, the fast dynamics of the device remain unused.

1.2. Research Gaps

The previous research reveals three specific gaps that this work aims to address. First, experimental validation of SDN-QoS for hydrogen microgrids is lacking. While SDN-QoS proposals [23,24] validate queue-based scheduling in substation topologies, they fail to address interactions among hydrogen traffic. During islanding transients, GOOSE protection signals coincide with electrolyser power reduction commands, fuel cell activation, and BESS telemetry bursts. Whether SDN OpenFlow pipelines can maintain the strict 4 ms GOOSE latency under these conditions remains to be seen and requires experimental validation.
Second, existing studies measure network delays but do not actively manage the supporting communication infrastructure. The co-simulation work quantifies the effects of 50–100 ms latency on frequency regulation, but models communication as an external variable instead of a controllable network layer. The present research introduces an end-to-end architecture designed to mitigate delay rather than merely observe it. This system integrates OpenFlow classification, per-queue scheduling and application-layer latency management.
Third, the effects of network congestion on hydrogen safety remain uncharacterised. Safety analyses identify consequences of communication loss (membrane degradation, thermal stress) but typically model the network failures as binary events. This study experimentally measures how adaptive-ready QoS policies reshape path-level latency distributions under controlled congestion, evaluating whether the resulting communication conditions remain compatible with safety-relevant timing bounds for hydrogen assets.
These gaps define the experimental design of this work. The absence of hydrogen-specific SDN-QoS validation motivates the four configuration comparisons under a FEED-MT-inspired IEC 61850 traffic mix. The lack of an actively managed communication layer motivates the OpenFlow classification, per-queue scheduling and RESTCONF QoS pipeline. Finally, the limited characterisation of safety signal degradation motivates the use of empirical cumulative distribution functions (CDFs), tail percentiles and explicit 20 ms threshold-compliance metrics. To address the gaps identified above, this paper makes the following contributions.

1.3. Contributions of the Paper

  • An SDN-based communication architecture with adaptive QoS for hydrogen microgrids. employs an OpenDaylight controller to classify IEC 61850 traffic directly at the OpenFlow pipeline level. It maps specific traffic categories, including GOOSE, control setpoints, MMS and Sampled Values, to dedicated priority queues across nine Open vSwitch nodes. Critical GOOSE protection messages receive strict priority scheduling. Meanwhile, the system manages the remaining classes using weighted fair queuing combined with per-flow metering. Compared with prior SDN-QoS studies focused mainly on substation communication, this work combines IEC 61850 QoS differentiation, multi-switch SDN forwarding and an externally reconfigurable northbound interface within the traffic envelope of a green hydrogen microgrid. The proposed architecture is designed for continuous adaptation. The QoS pipeline is configured through RESTCONF rather than through per-switch CLI rules, which allows future closed-loop optimisation without changing the forwarding pipeline.
  • Systematic performance evaluation under realistic congestion. The FEED-MT network is emulated in GNS3 with Docker endpoints generating IEC 61850 traffic based on real system specifications. The study compares four specific configurations: conventional TCP/IP, SDN without QoS, TCP/IP with static OpenFlow-based QoS policing and SDN with adaptive QoS (SDN-AQoS). To avoid relying on single-point estimates, this proposal evaluates each scenario under both normal and congested conditions using over 40 independent latency measurements and five full-throughput transfer runs. The inclusion of a static QoS policing baseline isolates the contribution of centralised SDN management and queue-based scheduling from simple rate-limiting approaches.
  • Quantitative characterisation of QoS impact on hydrogen safety margins. Instead of relying solely on mean latency, this study analyses full empirical distributions, including cumulative distribution functions, tail percentiles (P90, P99), jitter ranges, and throughput variance. The results show that SDN-AQoS keeps 97.5% of congestion latency below the critical 20 ms safety threshold. In contrast, static QoS policing achieves only 60%, plain TCP/IP 90%, and unmanaged SDN 66.7%. Furthermore, the proposed adaptive QoS approach reduces jitter by 60% compared to unmanaged SDN and improves throughput by 49% compared to conventional TCP/IP.
  • An extensible interface for future autonomous adaptation. A northbound REST API connects the SDN controller to an external optimisation layer, enabling future reinforcement learning integration for real-time rate limiting. The interface is implemented and used to configure the experimental QoS policies, providing the basis for future closed-loop experimentation beyond static rules.

1.4. Paper Organisation

The remainder of this paper is organised as follows. Section 2 describes the proposed SDN-based architecture, the topology setup, and the experimental scenarios. Section 3 presents and analyses the results in terms of latency, jitter, throughput, and resilience under stressed network conditions. Section 4 discusses the impacts on the stability and operational resilience of the hydrogen microgrid, including limitations and future research directions. Section 5 concludes the paper.

2. Methodology

This section describes the methodology used to validate SDN-based adaptive QoS mechanisms for the FEED-MT hydrogen microgrid. The approach uses a network emulation strategy that replicates the cyber-physical constraints of the experimental platform at the University of Nottingham [10]. The emulation topology was implemented using GNS3 version 2.2.59 [33] integrated with Docker containers. The OpenDaylight Carbon SDN controller [34] is integrated with a virtualised infrastructure plane to manage traffic prioritisation for critical hydrogen assets. All artefacts required to replicate the proposed architecture, including the GNS3 topology, configuration files, setup instructions and test scenarios, are available in the GitHub repository https://github.com/ascenciovil/SDN-based-Communication-Architecture-for-Autoadaptative-Control-in-Green-Hydrogen-Hybrid-Microgrids (accessed on 10 April 2026).

2.1. Physical Layer of the FEED-MT Hybrid Microgrid

The cyber-physical experiments use the FEED-MT hybrid microgrid configuration at the University of Nottingham as the reference architecture, as summarised in Figure 1 and Table 1. The reference plant includes photovoltaic generation rated at 600 kW, a 1 MW battery energy storage system, a 200 kW PEM electrolyser, a 100 kW PEM fuel cell, controllable loads, a grid interface and hydrogen storage. The hydrogen subsystem considered in the communication mapping follows the architecture shown in Figure 1, with two storage tanks of 50 kg each, one at 20 bar and one at 200 bar. Logical IEC 61850 nodes are mapped to the physical assets as follows: DPVM/MMXU for photovoltaic measurement, ZBAT for the BESS, DEOL for the electrolyser and DFCL for the fuel cell. These logical nodes are reproduced by the traffic generators in the GNS3 emulation, so that each Docker endpoint corresponds to a physical asset with a defined operational role. The electrical converters and hydrogen process equipment are not simulated as dynamic physical models in this paper; instead, their communication endpoints and timing requirements are represented to evaluate whether the network can support deterministic exchange of protection, control and monitoring messages.

2.2. Cyber-Physical System Architecture

As illustrated in Figure 1, the system comprises solar photovoltaic generation, battery storage, a PEM electrolyser with hydrogen storage, a fuel cell, and multiple loads, all interconnected through an SDN communication layer managed by an OpenDaylight controller with QoS queue differentiation.
The communication architecture is organised into four logical planes, as shown in Figure 2, thereby separating forwarding logic from network intelligence. The Application Plane includes the microgrid orchestrator (SCADA/EMS) and the QoS optimisation layer. The current implementation employs static QoS rules configured through the RESTCONF API. The architecture is designed to enable a reinforcement-learning agent in this layer for future autonomous adaptation. The Control Plane is orchestrated by the OpenDaylight (ODL) controller, which manages network QoS policies via OpenFlow 1.3. The data plane comprises a mesh of Open vSwitch (OVS) nodes that forward IEC 61850 traffic (GOOSE and Sampled Values) between hydrogen assets. On the other hand, the physical plane represents the emulated FEED-MT microgrid components.
Throughout this paper, the term adaptive QoS (AQoS) denotes a QoS architecture whose prioritisation rules are aware of traffic classes and IEC 61850 service requirements, and are externally reconfigurable at runtime through the RESTCONF northbound interface. This contrasts with conventional static QoS, where policies are typically hard-coded as per-switch CLI configurations. In the experiments presented here, the AQoS rules are configured before each test scenario and remain fixed throughout its execution. Thus, the proposed implementation is adaptation-ready, but it does not yet constitute a closed-loop adaptive scheme. Moving from open-loop reconfiguration to closed-loop adaptation would require an external optimiser, for example, a reinforcement-learning agent, to update queue weights and meter rates during operation. This capability is enabled by the same northbound interface.

2.3. Experimental Implementation Environment

The emulation environment considers a server running Ubuntu 20.04 with 6 virtual CPUs and 8 GB of RAM. To reproduce the network conditions with low virtualisation overhead, the topology was implemented using GNS3 integrated with Docker containers, which minimises the overhead associated with full virtualisation [35].
OpenDaylight [36] is selected as the SDN controller for its mature DLUX web interface [37] and robust RESTCONF API [38]. The controller is deployed as a Docker container (opendaylight/odl:latest) and initialised via the Karaf shell. The following features presented in Listing 1 are installed to enable topology discovery, REST interaction, and OpenFlow management:
Listing 1. OpenDaylight Carbon feature installation commands.
feature:install odl-restconf
feature:install odl-mdsal-apidocs
feature:install odl-openflowplugin-flow-services
feature:install odl-dlux-core
feature:install odl-dluxapps-nodes
feature:install odl-dluxapps-topology
feature:install odl-dluxapps-yangui
feature:install odl-dluxapps-yangvisualizer
feature:install odl-dluxapps-yangman
Listing 2 shows the host-side commands used to create the TAP interface. A TAP interface exposes the controller’s Northbound API to external applications. This step is essential for the QoS optimisation layer to inject and modify flow rules from outside the GNS3 simulation environment:
Listing 2. Host-side TAP interface configuration for OpenDaylight access.
sudo ip tuntap add dev tap0 mode tap
sudo ip addr add 192.168.100.1/24 dev tap0
sudo ip link set tap0 up
sudo iptables -t nat -A POSTROUTING -s 192.168.100.0/24 -o enp0s3 -j MASQUERADE
An Out-of-Band Management (OOBM) architecture replicates a production-grade microgrid network design. This separation physically isolates control traffic (OpenFlow) from data traffic (GOOSE/SV), preventing saturation of the management channel during burst events. Each Open vSwitch node operates with two distinct bridges:
  • br1 (Management Bridge): Dedicated to the OpenFlow connection with the ODL controller. Each switch was assigned a static IP address (e.g., 192.168.100.101) on this bridge to maintain a stable control channel.
  • br0 (Data Bridge): Dedicated to FEED-MT asset communication. This bridge operates without an IP address, functioning only at Layer 2.
Listing 3 shows the Open vSwitch commands used to configure OOBM separation, enforce OpenFlow 1.3, and connect the switch to the OpenDaylight controller.
Listing 3. Open vSwitch commands for OOBM separation and OpenDaylight controller connection.
Interface reassignment for OOBM
ovs-vsctl del-port br0 eth0
ovs-vsctl add-port br1 eth0
ip addr add 192.168.100.101/24 dev br1
 
Protocol enforcement and controller link
ovs-vsctl set bridge br0 protocol=OpenFlow13
ovs-vsctl set-controller br0 tcp:192.168.100.2:6633
ovs-vsctl set bridge br0 \
  other-config:manage-addr=192.168.100.101
This configuration ensures that the QoS policies pushed by the controller are strictly applied to traffic flowing through br0, while management instructions travel safely through br1.

2.4. Traffic Engineering and QoS Pipeline

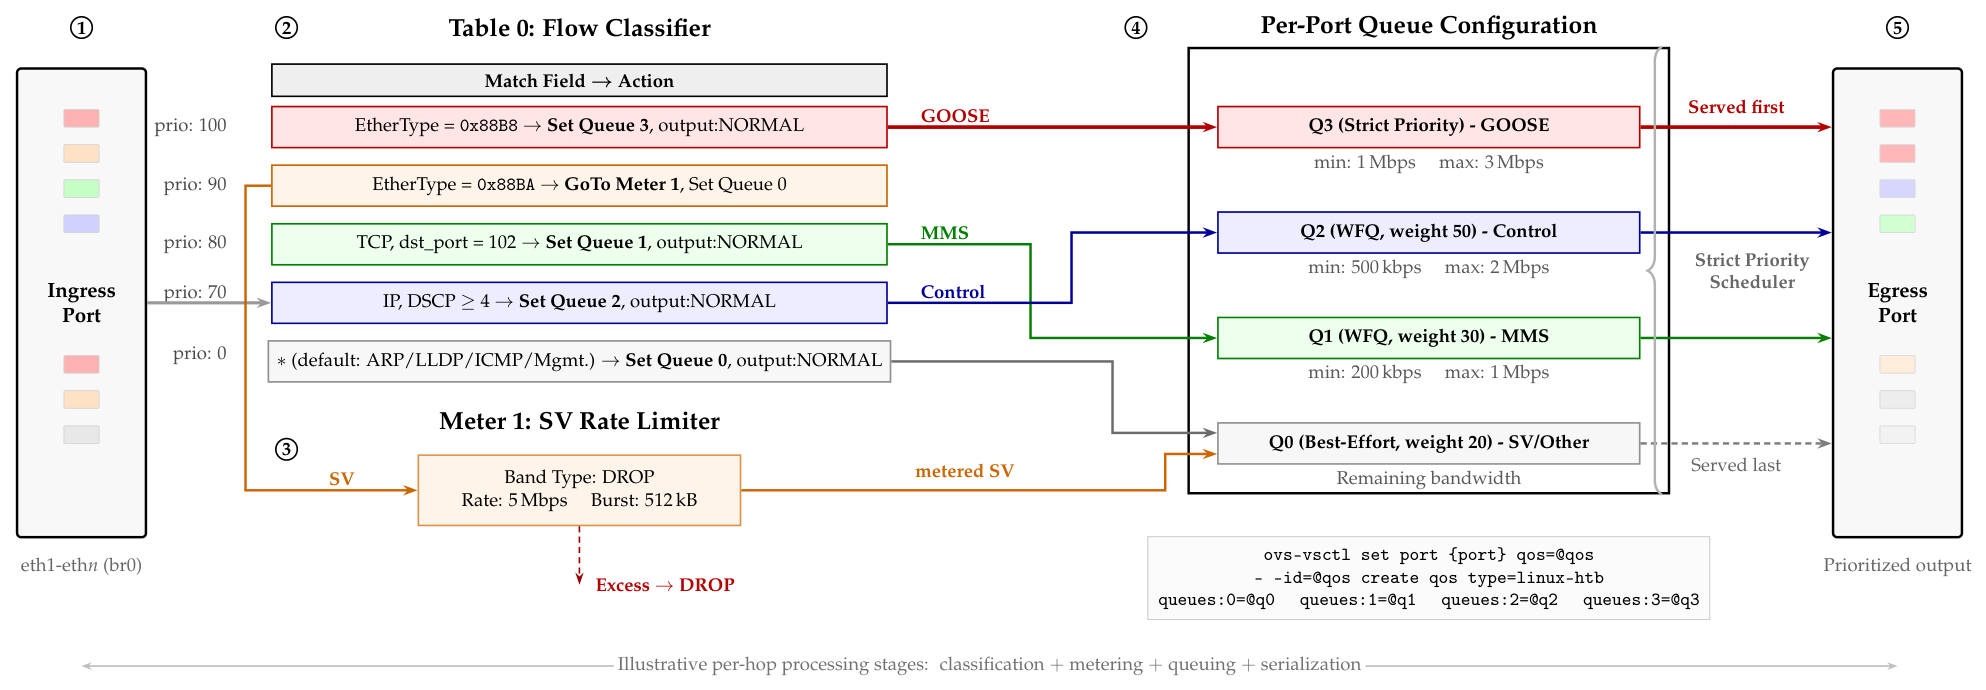
The core element of the proposed methodology is the internal processing of IEC 61850 traffic within the Open vSwitch nodes. As Figure 3 illustrates, a multi-stage QoS pipeline classifies, metres, and prioritises traffic according to hydrogen asset requirements. The numbered markers indicate the packet-processing sequence: (1) frames enter the data-plane bridge through the ingress port; (2) Table 0 classifies each frame according to EtherType, transport-layer port or DSCP marking, assigning GOOSE traffic (EtherType 0x88B8) to Queue 3, MMS traffic (TCP port 102) to Queue 1, control traffic to Queue 2 and default traffic to Queue 0; (3) Sampled Values traffic (SV, EtherType 0x88BA) is redirected through Meter 1, which enforces a 5 Mbps rate limit and drops excess traffic; (4) the per-port Linux HTB queue configuration applies strict priority to Q3 for GOOSE protection messages and weighted fair queuing to Q2, Q1 and Q0 for control, MMS and best-effort traffic, respectively; (5) packets leave through the egress port according to the scheduler order, with GOOSE served first and best-effort traffic served last. GOOSE supports time-critical IEC 61850 protection and control signalling, SV carries continuous measurement streams, and MMS supports supervisory communication.
The QoS rules are injected into the switches through the RESTCONF API. JSON payloads are sent via HTTP PUT requests to the controller’s configuration datastore at:
  • restconf/config/opendaylight-inventory:nodes/node/{switchid}
This approach provides granular control over two key mechanisms:
  • Meters: Rate-limiting logic applied to SV traffic to prevent bandwidth exhaustion during measurement bursts.
  • Queues: Prioritisation logic in which GOOSE messages (EtherType 0x88B8) are assigned to Queue 3 (Priority 65,535), ensuring that they bypass the First-In-First-Out buffer used by standard traffic.

2.5. Experimental Design and Statistical Framework

The experimental design is implemented as a controlled comparison of four network configurations (TCP/IP, TCP/IP+sQoS, SDN, SDN-AQoS) under two operating envelopes (normal and congestion). The independent factor is the network configuration. The controlled factors are the GNS3 topology, the IEC 61850 traffic generators, the duration of each iperf3 test window (30 s) and the background-traffic injection rate. The dependent variables are end-to-end latency, jitter, transfer time, throughput and the empirical proportion of packets below the 20 ms safety threshold.
The analysis is framed as a descriptive comparison rather than as a formal hypothesis test. The objective is to determine whether the proposed SDN-AQoS configuration produces lower latency dispersion, higher throughput and higher empirical compliance with the 20 ms electrolyser-control threshold under the same congestion envelope.
Each scenario was repeated until at least 40 independent latency samples ( n lat [ 40 , 42 ] ) and five iperf3 transfer runs ( n thr = 5 ) were collected. The sampling interval was set to 1 s, which is longer than the round-trip time observed in every configuration (reducing the temporal dependence among consecutive ICMP probes). Error bars in throughput plots correspond to one standard deviation across the five transfer runs.
For latency, the analysis is descriptive and distribution-based. This research reports medians, interquartile ranges, empirical CDFs, tail behaviour and the proportion of samples below the 20 ms threshold. No parametric normality assumption or formal hypothesis test is imposed on the latency vectors. The empirical separation between SDN-AQoS and the remaining configurations is presented observationally instead of inferentially. The empirical CDFs do not cross within the 20 ms safety envelope. Furthermore, the pairwise differences in P 50 exceed the interquartile ranges of the corresponding distributions, and the proportion of samples below 20 ms differs by more than three standard errors between SDN-AQoS and every other configuration.

2.6. Microgrid Asset Mapping

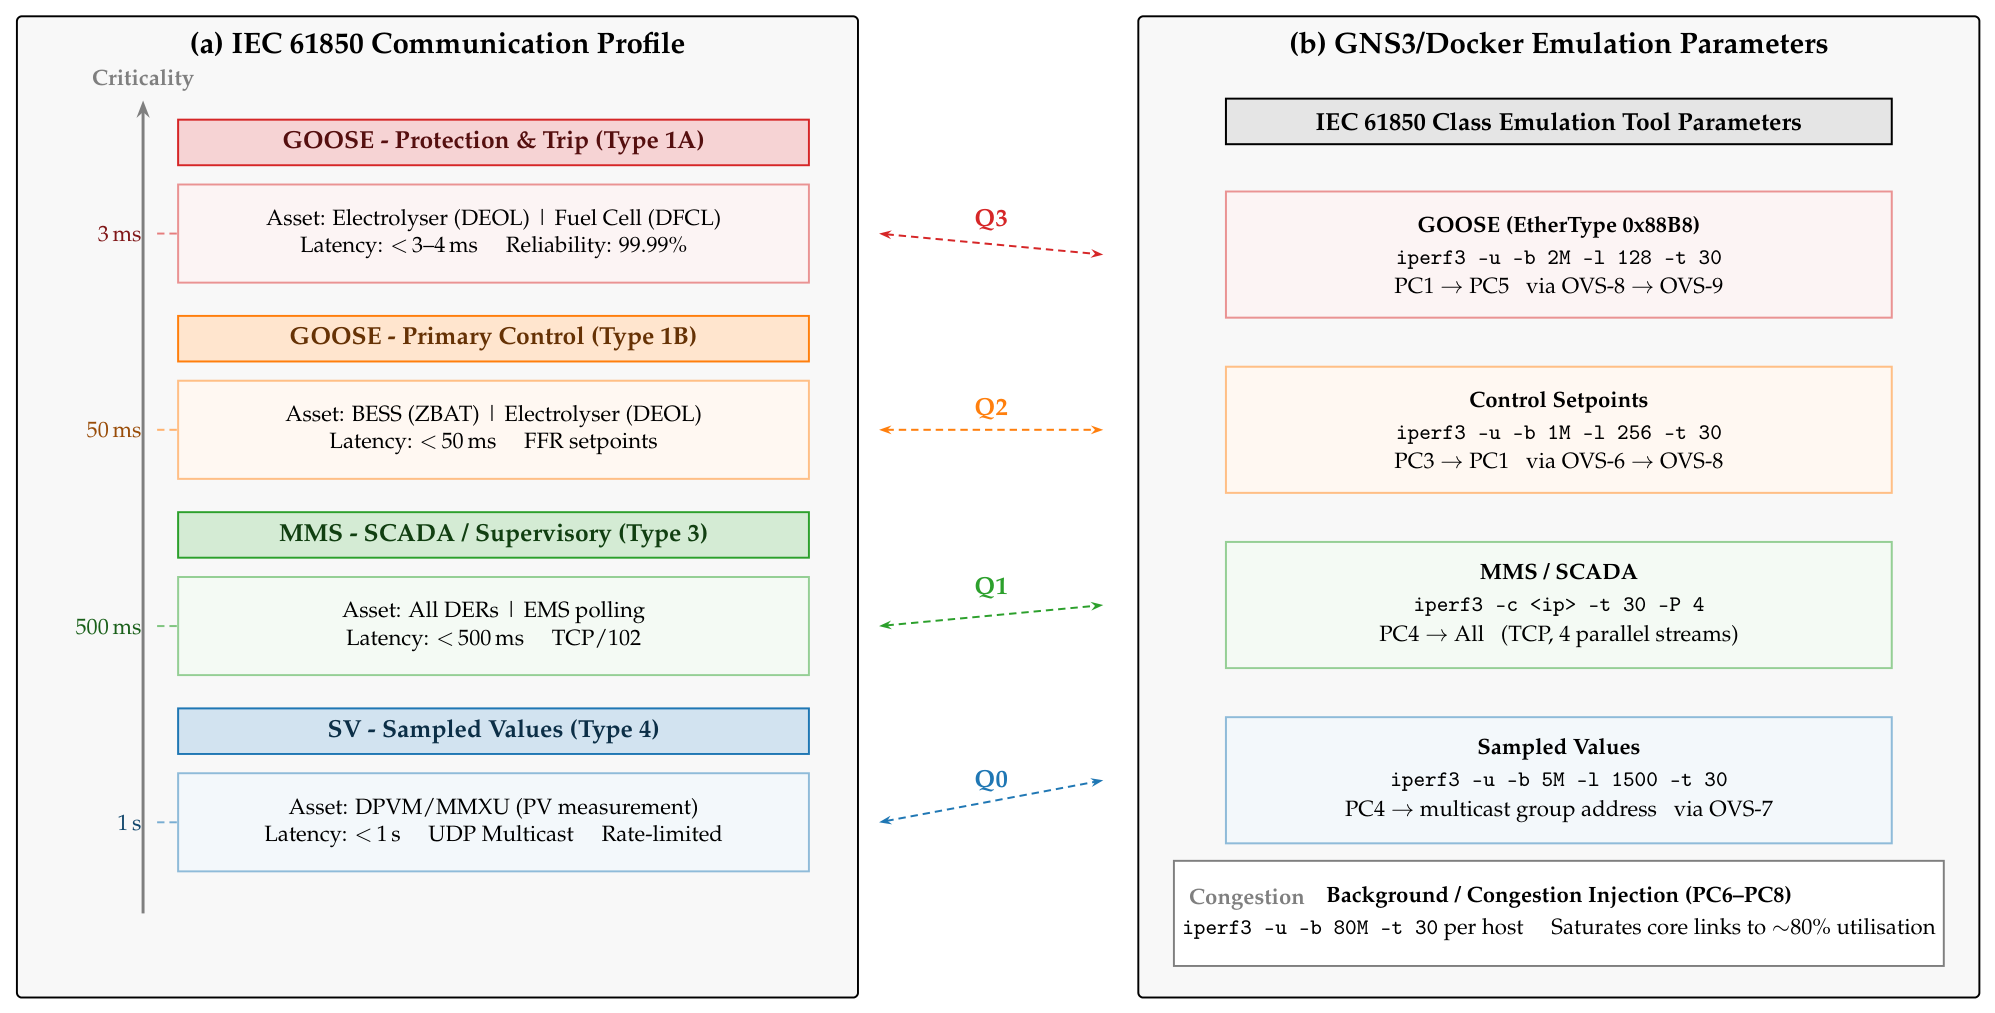
The GNS3 nodes are directly linked to the specific assets of the FEED-MT microgrid. Figure 4 shows the correspondence between the logical nodes of IEC 61850 and their Docker-based implementation. Each hydrogen microgrid asset operates as a Docker container that generates traffic patterns emulating real IEC 61850 protocol behaviour: GOOSE messages appear as UDP bursts with high priority, Sampled Values as UDP multicast streams, and MMS as TCP streams via iperf3.
The traffic generators were configured with iperf3 to approximate the relative bandwidth, payload size and transport behaviour of the IEC 61850-like traffic classes considered in this study. GOOSE protection traffic was emulated as high-priority UDP bursts with a target bandwidth of 2 Mbps, 128-byte datagrams and 30 s transmission windows, which approximates the compact-frame and burst-oriented nature of event-driven protection messages. Primary control set-points were emulated as UDP traffic at 1 Mbps with 256-byte datagrams, representing periodic exchanges between the BESS, the electrolyser and the microgrid controller. MMS supervisory traffic was emulated with TCP streams using four parallel flows to represent concurrent SCADA polling and supervisory exchanges. Sampled-Values traffic was emulated as continuous UDP measurement traffic at 5 Mbps with 1500-byte datagrams. Background traffic generators injected 80 Mbps UDP streams per host, producing an aggregate offered load of approximately 240 Mbps and stressing the core links to about 80% utilisation. The semantics of each native iperf3 flag used in the experiments, namely -u, -b, -l, -t, -c and -P, together with the selected value for every traffic class, are summarised in Table 2.
This emulation strategy was selected because iperf3 provides precise control over the transport protocol, payload size, offered rate, test duration and stream parallelism. However, it should be interpreted as a traffic-class emulation rather than as a native IEC 61850 implementation. The experiments do not reproduce GOOSE retransmission intervals ( T 0 T 4 ), sequence-number semantics, VLAN-priority tagging, publisher-subscriber synchronisation, SV application service data units or MMS object modelling. Consequently, the reported measurements quantify the behaviour of the proposed QoS pipeline under IEC 61850-like timing and bandwidth conditions, but they do not constitute an IEC 61850 conformance test. The limitations of this approach are discussed further in Section 4.

3. Results and Analysis

This section presents the experimental results from the GNS3 emulation environment. The evaluation covers four network configurations: (i) a traditional TCP/IP topology with standard Layer 2 switching; (ii) TCP/IP with static QoS policing (relying on locally configured OpenFlow meters without a centralised controller); (iii) an unmanaged SDN topology without QoS policies; (iv) an SDN topology featuring the proposed Adaptive QoS rules (SDN-AQoS). Throughput and stress conditions for the individual traffic classes were generated using iperf3.
The end-to-end latency was measured via ping (ICMP echo) under these exact congestion envelopes. Because ICMP traffic falls under the default flow table rule of the proposed pipeline (Figure 3, row 5), the reported values quantify the overall path delay imposed by each policy rather than the direct latency of GOOSE or control messages. Consequently, these measurements serve as a reproducible indicator of the baseline delay conditions for each configuration. Although the iperf3 streams accurately emulate the offered load, packet size and transport behaviour of the IEC 61850 traffic categories, extracting latency metrics for individual classes remains a subject for future work using native timestamping or explicitly marked probes.

3.1. Baseline Performance Under Normal Operating Conditions

Table 3 presents the network performance under normal operating conditions, representing steady-state telemetry from distributed energy resource agents without congestion.
Under normal conditions, the SDN architecture without QoS achieves the lowest transfer time (6.85 s), a 6.4% improvement over traditional TCP/IP. The SDN-AQoS configuration exhibits a slightly higher transfer time (8.08 s) due to the overhead of flow classification and queue management. However, its variance is significantly lower (±0.09 s compared to ±0.45 s for TCP/IP), indicating more deterministic forwarding behaviour, which is essential for real-time control applications.
The TCP/IP plus static QoS setup shows the worst performance under normal conditions among all four configurations. The transfer time reaches 11.42 s, with a throughput of just 73.66 Mbps. That marks a 36% drop from the unmanaged TCP/IP baseline of 115.0 Mbps. Performance drop occurs because the OpenFlow meter restricts all background IP traffic to 5 Mbps, bottlenecking the actual performance test flow. When the network is free of congestion, this limit does not offer an advantage and increases latency for legitimate data. This shows that rigid rate limits without intelligent scheduling reduce the performance when bandwidth is available.
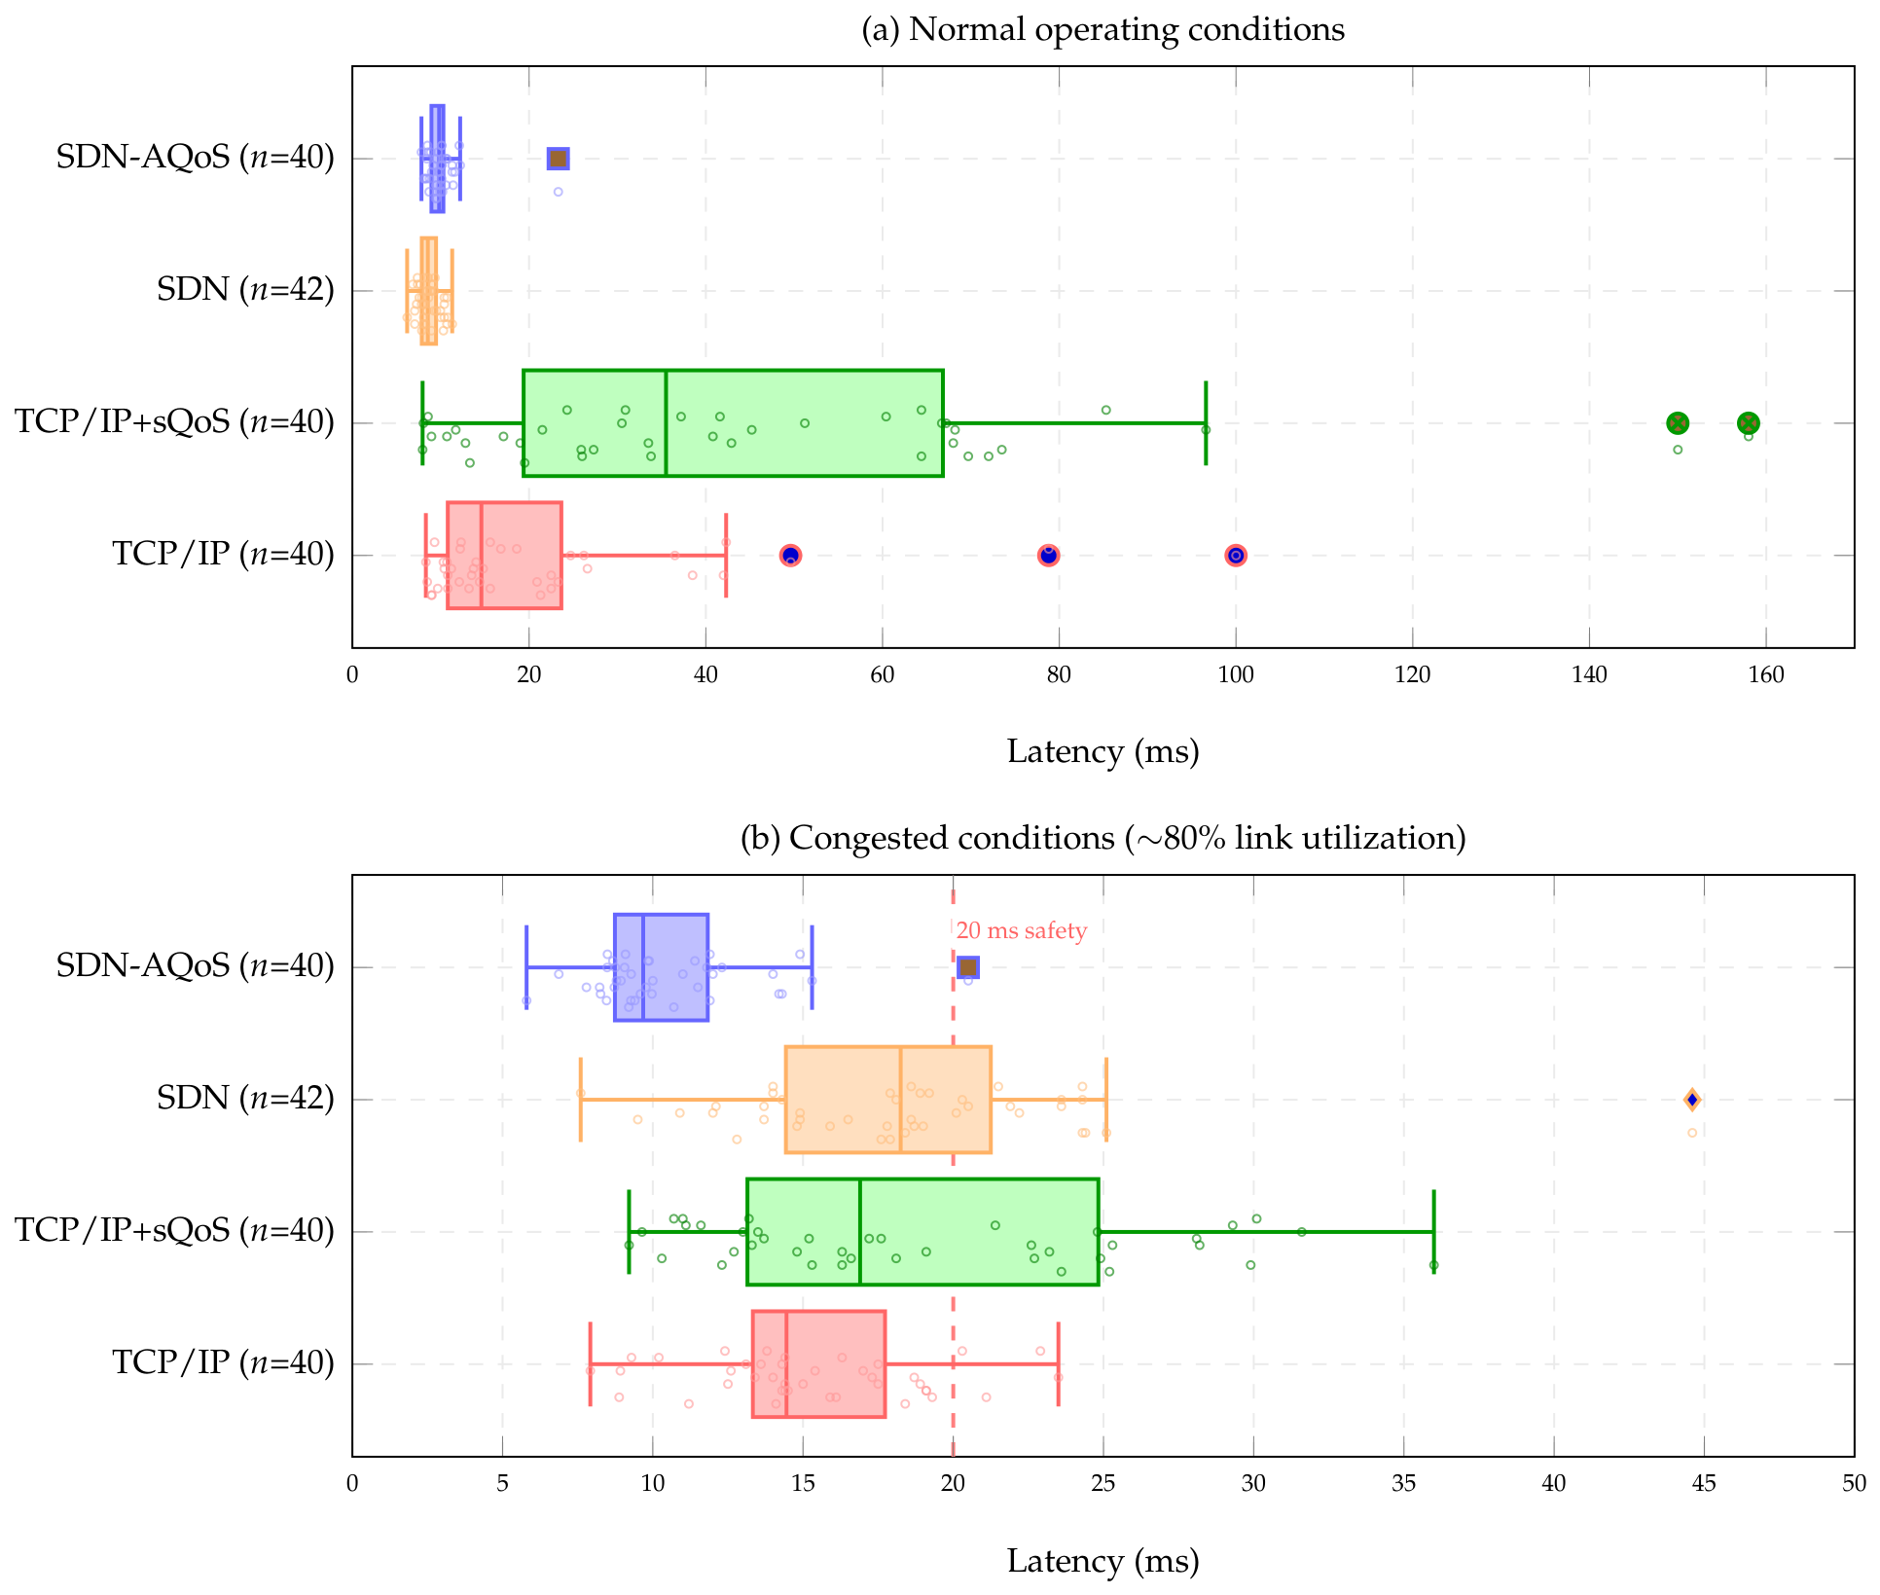
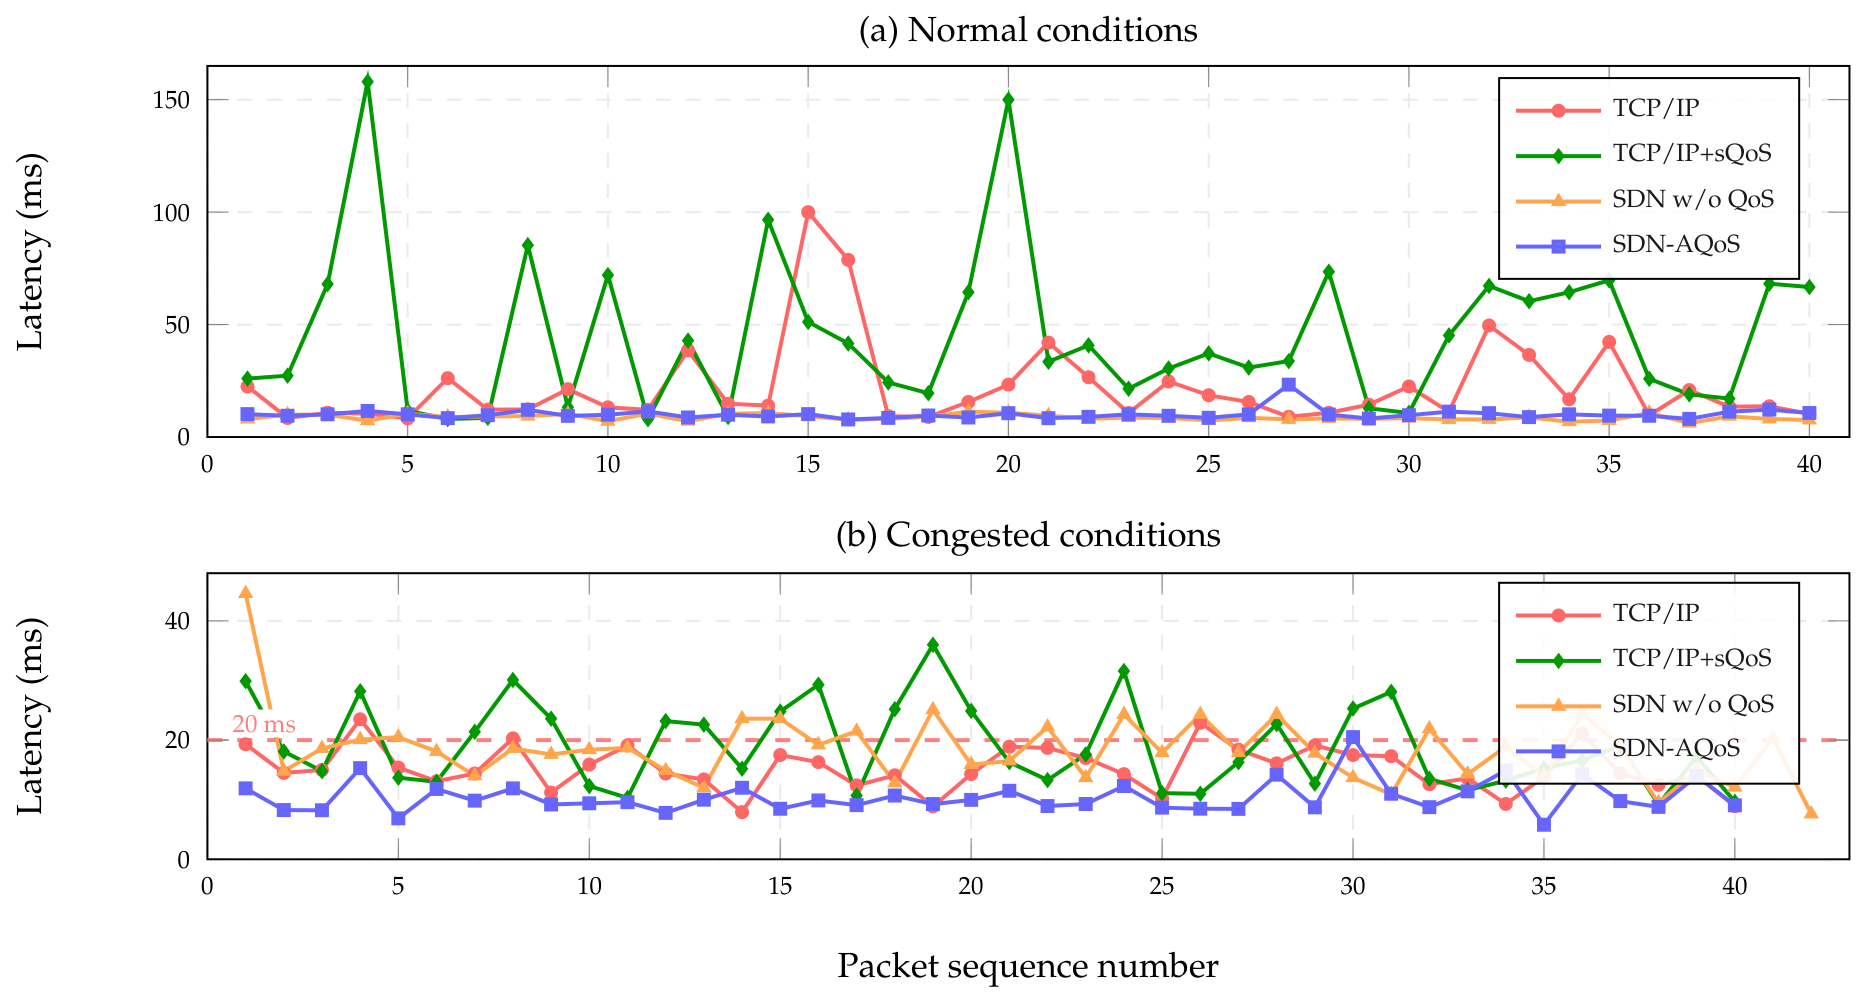
Figure 5a shows the latency distribution under normal conditions. The SDN without QoS configuration maintains latencies predominantly between 6.20 and 11.30 ms with a total variation of only 5.1 ms, compared to 91.68 ms for TCP/IP. The TCP/IP configuration exhibits a wide spread, with outliers exceeding 100 ms, likely due to ARP resolution delays and buffer management in conventional switches under sporadic traffic. The TCP/IP + static QoS configuration shows the widest latency spread of all four configurations, with a median of 35.5 ms and values ranging from 7.95 to 158 ms (total variation 150.05 ms). This extreme variability results from the interaction between the token bucket mechanism of the metre and TCP congestion control [39]. The SDN-AQoS configuration shows latencies between 8.95 and 10.3 ms with a variation of 15.48 ms (including a single outlier at 23.3 ms), confirming that the QoS classification overhead introduces minimal additional latency while allowing traffic prioritisation.
Under normal conditions, the measured path-level latencies remain well below the IEC 61850 timing envelopes associated with Sampled Values (<1 s) and MMS reports (<500 ms). This result indicates that the emulated topology has sufficient baseline communication capacity for steady-state monitoring traffic.

3.2. Performance Under Network Congestion

The critical evaluation scenario introduces high-traffic conditions that simulate post-fault data storms, concurrent SCADA polling, and network stress during grid disturbances. Table 4 reports the performance metrics under congestion.
Performance under congestion diverges from normal conditions. The SDN configuration without QoS now exhibits the lowest throughput (36.96 Mbps) and the longest transfer time (22.72 s), in contrast to its superior performance under light load. This degradation originates from the controller processing packets-in messages for every unclassified flow without any prioritisation strategy to mitigate contention. Under congested conditions, the TCP/IP + static QoS configuration achieves a throughput of 49.32 Mbps. This represents a 25.7% improvement over plain TCP/IP, which achieved only 39.24 Mbps. These results demonstrate that even basic rate limiting of competing traffic provides a measurable benefit when the network is under high-traffic load. In contrast, the SDN-AQoS configuration delivers the highest throughput (58.64 Mbps), outperforming TCP/IP + static QoS by 18.9% and plain TCP/IP by 49.4%. The transfer time follows the same ranking: SDN-AQoS (14.33 s) outperforms TCP/IP + static QoS (17.06 s) by 16.0% and the unmanaged SDN (22.72 s) by 36.9%.
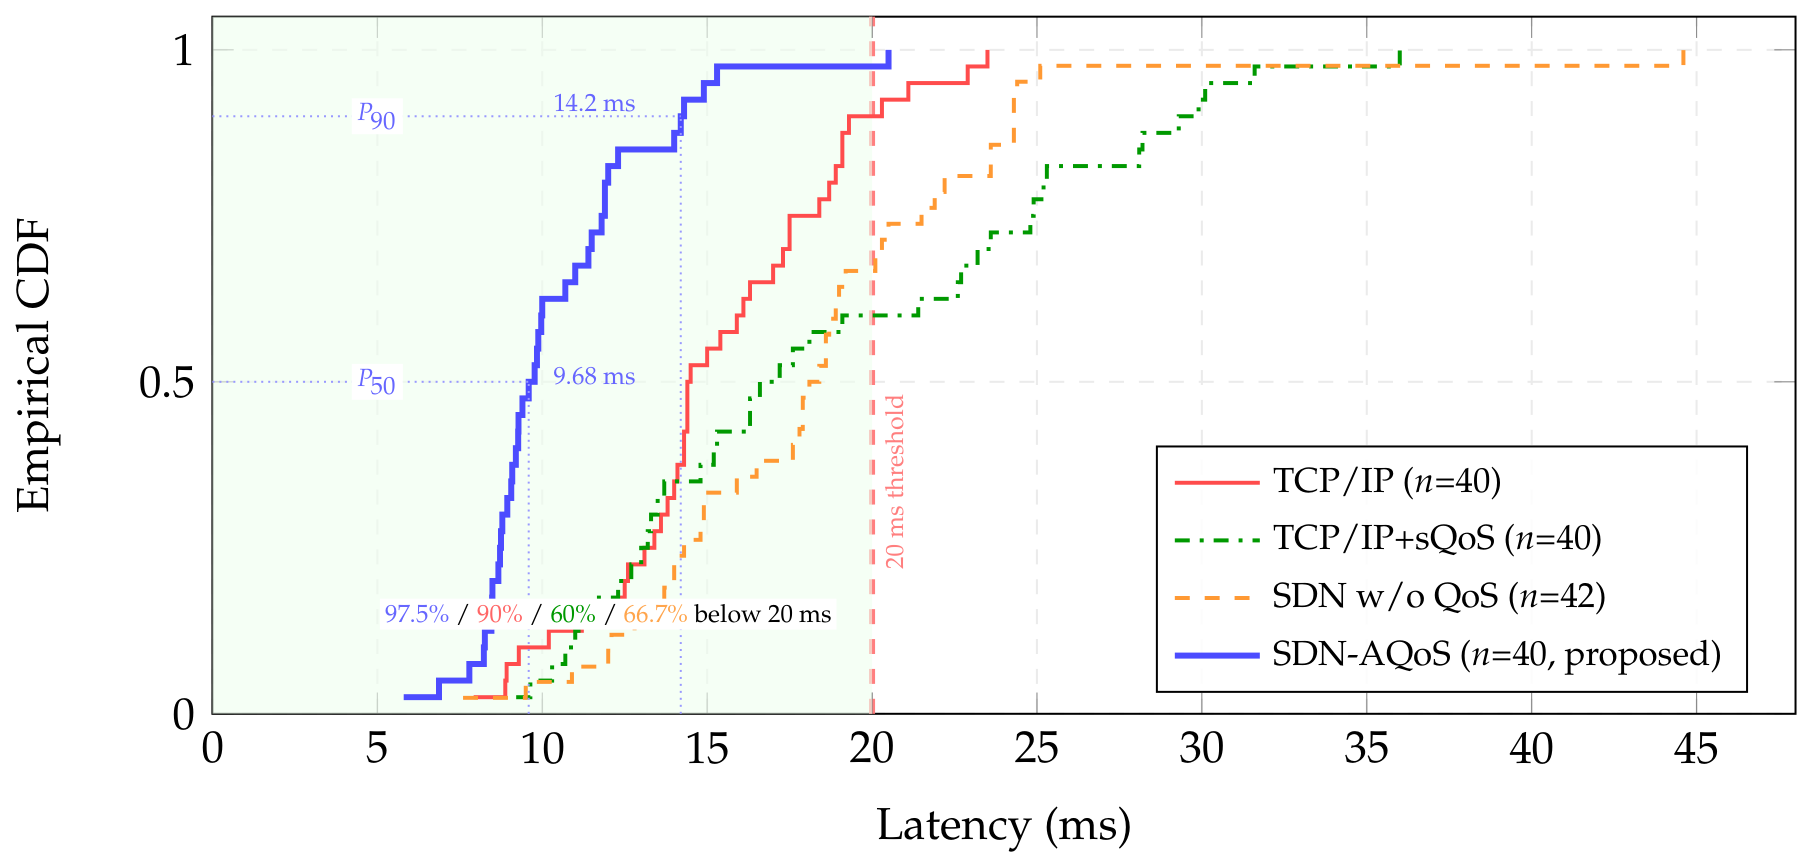
Figure 5b presents the latency distribution under congestion, which reveals the critical performance divergence between configurations. To better characterise the full latency distribution, Figure 6 plots the empirical Cumulative Distribution Function (CDF) of end-to-end latency under congestion. The SDN-AQoS configuration delivers 90% of ICMP latency samples below approximately 14.2 ms ( P 50  = 9.68 ms), with the entire distribution contained within the 20 ms safety envelope except for a single outlier at 20.5 ms. In contrast, the unmanaged SDN has a long tail that reaches 46.6 ms, with only 66.7% of packets delivered below 20 ms. Figure 7 shows the temporal sequence of all individual measurements, revealing that TCP/IP outliers under normal conditions are sporadic bursts rather than sustained degradation, while the SDN-AQoS trace remains consistently flat throughout the entire measurement window.
The SDN-AQoS configuration maintains a median latency of 9.68 ms, with an interquartile range of 8.74–11.83 ms. A single outlier at 20.5 ms was observed, corresponding to a transient congestion peak during the initial phase of the background traffic injection. This outlier slightly exceeds the 20 ms electrolyser-control threshold used in this study, but it remains within the 50 ms IEC 61850 timing envelope associated with primary control traffic. Therefore, the SDN-AQoS configuration achieves 97.5% compliance with the 20 ms threshold; the single outlier accounts for the remaining 2.5%.

3.3. Jitter Analysis

Jitter, defined as the total latency variation (max − min observed latency), is a relevant metric for PEM electrolyser control because delay variability reduces the timing margin available for coordinated setpoint updates. When this variation becomes excessive, it can amplify control-loop oscillations and force more conservative operating strategies. Table 5 summarises the jitter measurements across both operating conditions.
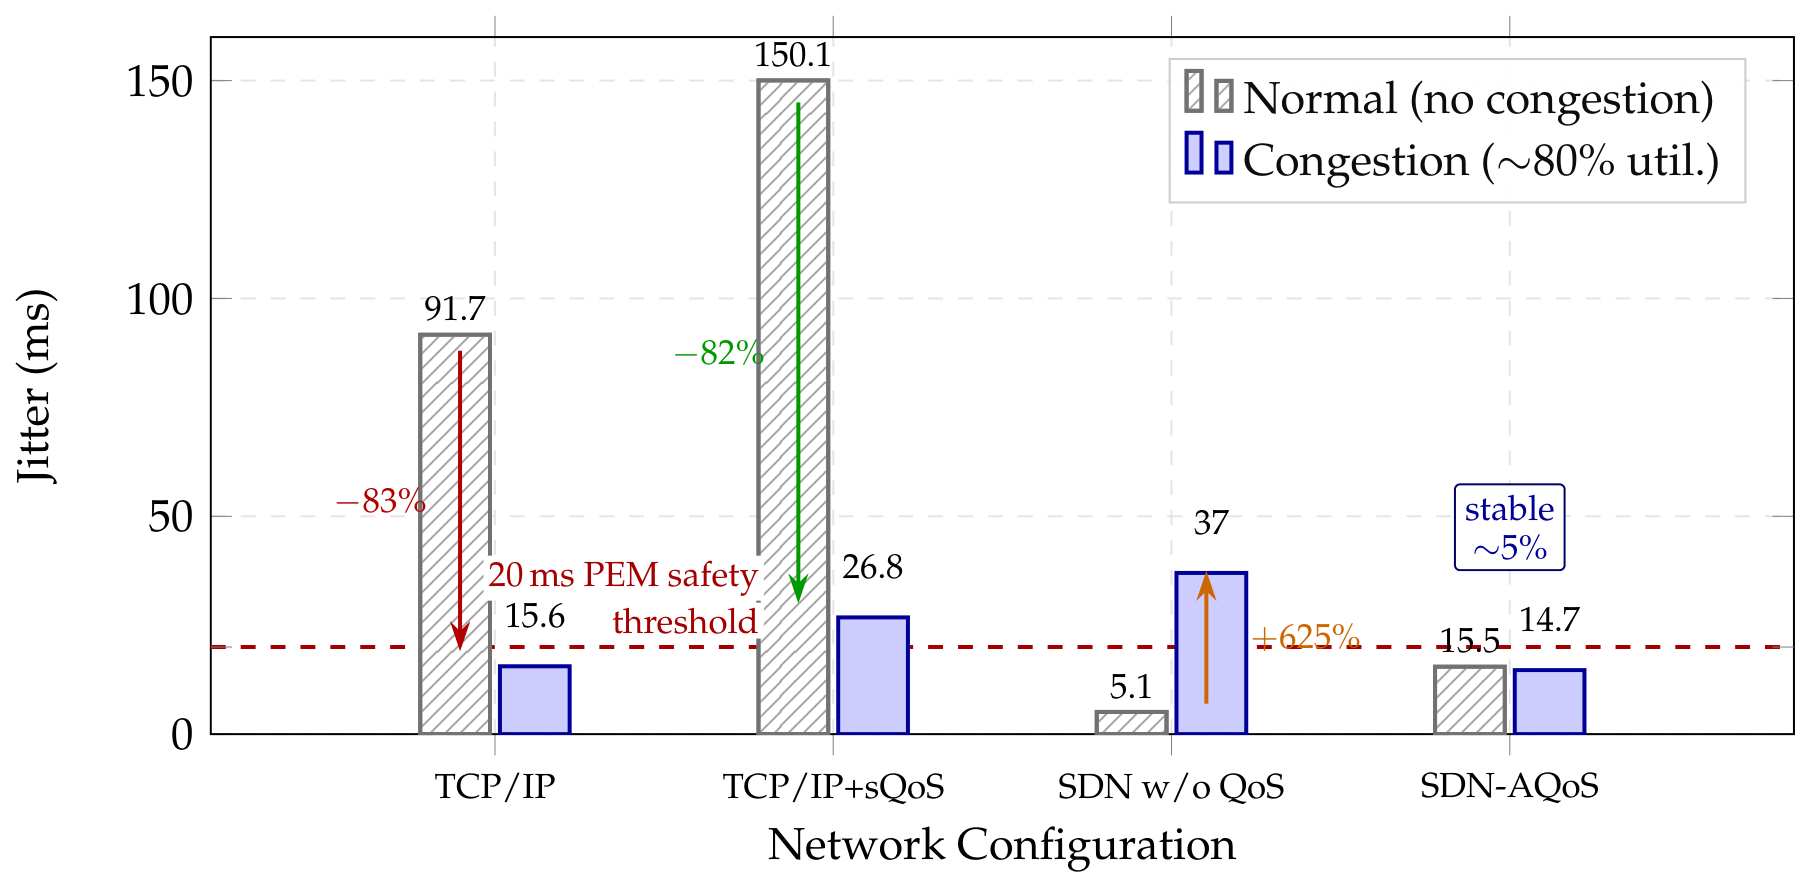
Three observations from this table stand out. First, TCP/IP jitter decreases from 91.68 ms under normal conditions to 15.58 ms under congestion. Under light load, sporadic traffic produces extreme outliers (up to 100 ms, as seen in Figure 5a). These are likely caused by ARP cache misses and buffer allocation delays in idle switches. However, under sustained congestion, all packets experience more uniform, moderate delays, which compresses the overall latency range. Second, the TCP/IP + static QoS configuration exhibits the highest jitter of all configurations under normal conditions (150.05 ms), due to the meter’s interaction with TCP dynamics, as discussed earlier. Under congestion, its jitter drops to 26.79 ms (−82.1%), but this value still exceeds the 20 ms safety threshold. Third, the SDN without QoS configuration exhibits the opposite behaviour to TCP/IP. Its jitter increases from 5.10 ms to 37.00 ms under congestion. Without prioritisation rules, the controller cannot effectively resolve contention.
The SDN-AQoS configuration achieves 14.70 ms jitter under congestion, representing a 60% reduction compared to the 37.00 ms observed with the unmanaged SDN. This value remains below the 20 ms threshold above which control-loop oscillations pose a tangible risk for PEM electrolyser operation [13]. The near identical jitter values under normal (15.48 ms) and congested (14.70 ms) conditions indicate that the QoS pipeline reduces the sensitivity of the measured path delay to background load variations.
Figure 8 visualises the jitter comparison under congestion, with the 20 ms safety threshold indicated.

3.4. Throughput Analysis

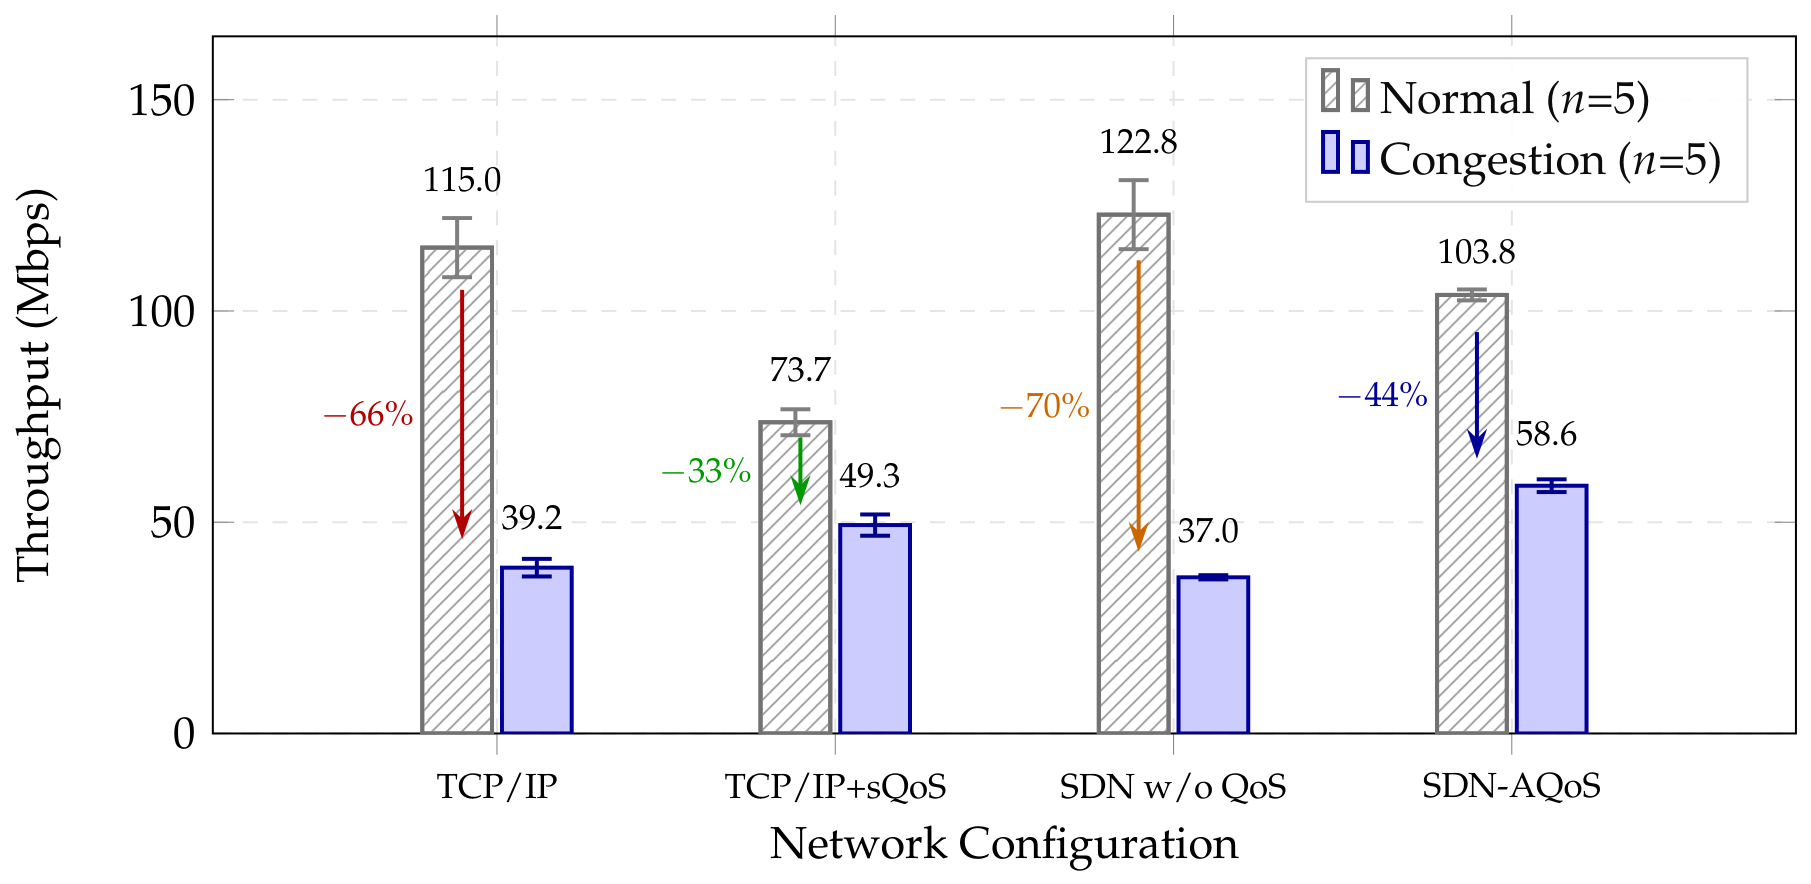
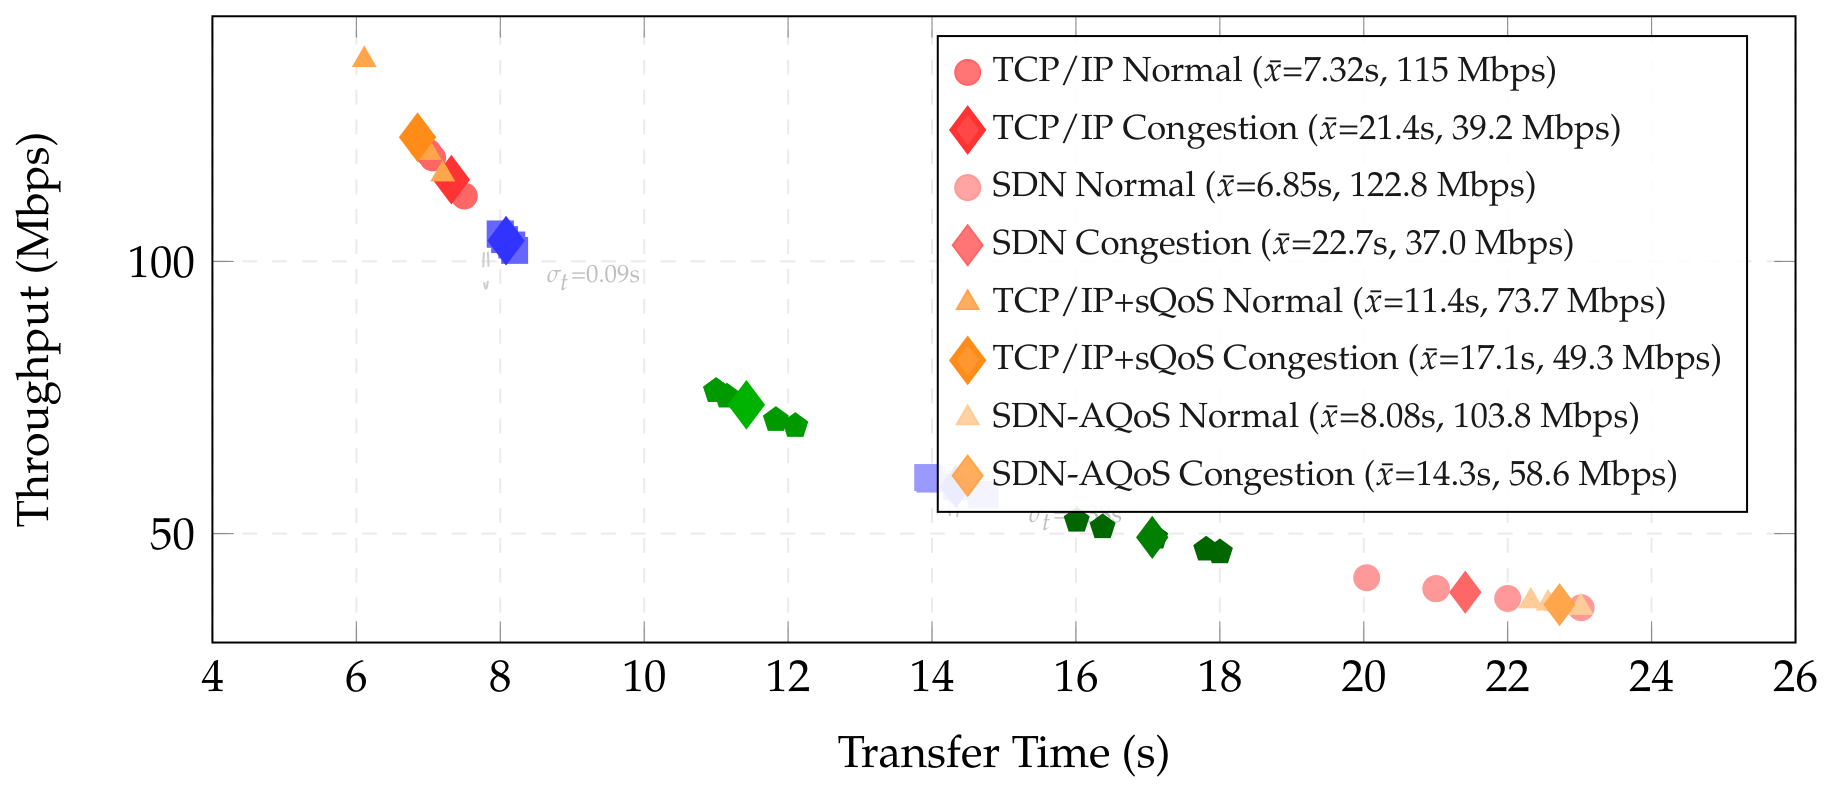
Figure 9 compares the throughput across configurations under congestion. The SDN-AQoS architecture sustains 58.64 Mbps under congestion, followed by TCP/IP + static QoS (49.32 Mbps), plain TCP/IP (39.24 Mbps) and the unmanaged SDN (36.96 Mbps). The static policing approach provides a 25.7% throughput improvement over plain TCP/IP by constraining competing flows, but falls short of SDN-AQoS by 18.9% because it lacks queue-based scheduling to prioritise critical traffic. Under normal conditions, the throughput ranking inverts: TCP/IP + static QoS (73.66 Mbps) underperforms all other configurations due to indiscriminate meter throttling, while SDN-AQoS maintains 103.8 Mbps with the lowest variance (±1.30 Mbps). Figure 10 plots the individual iperf3 runs, confirming the tight clustering of SDN-AQoS measurements ( σ t  = 0.09 s under normal conditions and 0.38 s under congestion).

3.5. Summary of Key Findings

Three findings synthesise the quantitative results reported in this section. First, the SDN-AQoS configuration is the only one that simultaneously satisfies the median ( P 50 = 9.68  ms), the tail ( P 90 = 14.2  ms, P 99 < 20.5  ms) and the throughput target (58.64 Mbps under congestion) required for safe electrolyser operation. Second, SDN-AQoS preserves jitter stability across operating conditions, decreasing slightly from 15.48 ms under normal traffic to 14.70 ms under congestion. This 5% reduction suggests that the QoS pipeline isolates critical traffic from background traffic variations. By contrast, the remaining configurations either exhibit an order-of-magnitude increase in jitter, as in the SDN case without QoS, or produce tail latencies above the 20 ms safety threshold, as in TCP/IP+sQoS. Third, the cost of SDN-AQoS is asymmetric. Under normal conditions, it introduces a limited overhead, increasing transfer time by 6.83% relative to unmanaged SDN. Under congestion, however, it reduces transfer time by 36.9%, thereby compensating for the baseline overhead. This asymmetry provides the empirical basis for the load-aware activation strategy discussed in Section 4.

4. Discussion

The experimental results support the main premise of this work. An SDN architecture with adaptive QoS management provides superior communication performance compared to traditional TCP/IP networks, TCP/IP with static policing and unmanaged SDN topologies. This advantage is most evident under high-traffic conditions during grid disturbances and coordinated control actions in hydrogen microgrids. These findings align with prior work demonstrating the resilience advantages of SDN in wide-area network applications. They also extend the analysis to the specific timing and safety needs of hydrogen-based distributed energy resources.
The inclusion of the TCP/IP + static QoS configuration isolates the contribution of centralised control from simple rate limiting. Under congestion, static policing improves throughput by 25.7% over plain TCP/IP (49.32 vs. 39.24 Mbps) by constraining competing flows to 5 Mbps. However, only 60% of latency measurements fall below the 20 ms threshold, compared to 90% for plain TCP/IP and 97.5% for SDN-AQoS. The explanation lies in the fundamental difference between policing and scheduling. Policing controls the volume of competing traffic but does not control the order in which packets are served. When the meter drops excess packets, TCP retransmissions and congestion window adjustments introduce latency variability, shifting a significant fraction of measurements into the 20–36 ms range. In contrast, the SDN-AQoS architecture employs strict-priority scheduling for critical flows, ensuring that electrolyser control packets are served before lower-priority traffic regardless of congestion level.
The reduction in latency variance should be interpreted as a reduction of the network-induced component of the total control delay. This is relevant for low-inertia hydrogen microgrids because communication delay and jitter consume the timing margin available for coordinated actions such as electrolyser ramp-down, BESS dispatch and fuel-cell activation. The present experiments, however, do not quantify the resulting frequency response, hydrogen production dynamics or closed-loop control quality. Those effects require integration with a dynamic power system model or validation on the physical FEED-MT platform. The results therefore show that SDN-AQoS improves the communication conditions required for safety-relevant coordination, but they do not by themselves prove physical stability improvement.
The proposed SDN layer can be interpreted as a programmable communication substrate for microgrid operation. Open vSwitch exposes queues, meters and flow rules as controllable network resources, allowing the controller to allocate bandwidth and priority according to the operational criticality of each traffic class. The current rule-based allocation, described in Section 2.4, is the simplest instantiation of this concept. A future optimisation layer could extend this mechanism into a dynamic virtual resource-management problem, in which queue weights, meter rates and path selection are adjusted according to congestion state, asset criticality and predicted operating transitions. Hardware-level acceleration through SR-IOV or DPDK, formal compliance assessment with IEC 61850-90-4 and IEC 62443, and integration with NFV-MANO orchestration are relevant extensions of the proposed architecture. These aspects are not validated in the present experimental campaign and are therefore identified as future work.
Under normal conditions, TCP/IP+static QoS exhibits the worst performance of the four configurations (73.66 Mbps, 150.05 ms jitter), because the 5 Mbps policing limit applies indiscriminately to the diagnostic traffic. The unmanaged SDN, by contrast, slightly outperforms the QoS-enabled setup under light load (6.85 s versus 8.08 s transfer time), because the classification, meter matching and queue assignment stages add overhead without resolving any actual contention. QoS policies should be activated dynamically based on the observed network load rather than applied unconditionally (a capability that the existing REST-based interface already supports).
The TCP/IP jitter range drops from 91.68 ms under normal conditions to 15.58 ms under congestion. This result has two explanations. Under sporadic light load, TCP/IP networks produce occasional extreme outliers (typically ARP-cache misses or transient buffer reallocation in idle switches), which inflate the measured range. Under sustained congestion, all packets experience more uniform, moderate delays, which compresses the range. The result exposes a limitation of range-based jitter metrics and motivates the use of the full empirical latency distribution adopted in Section 3.
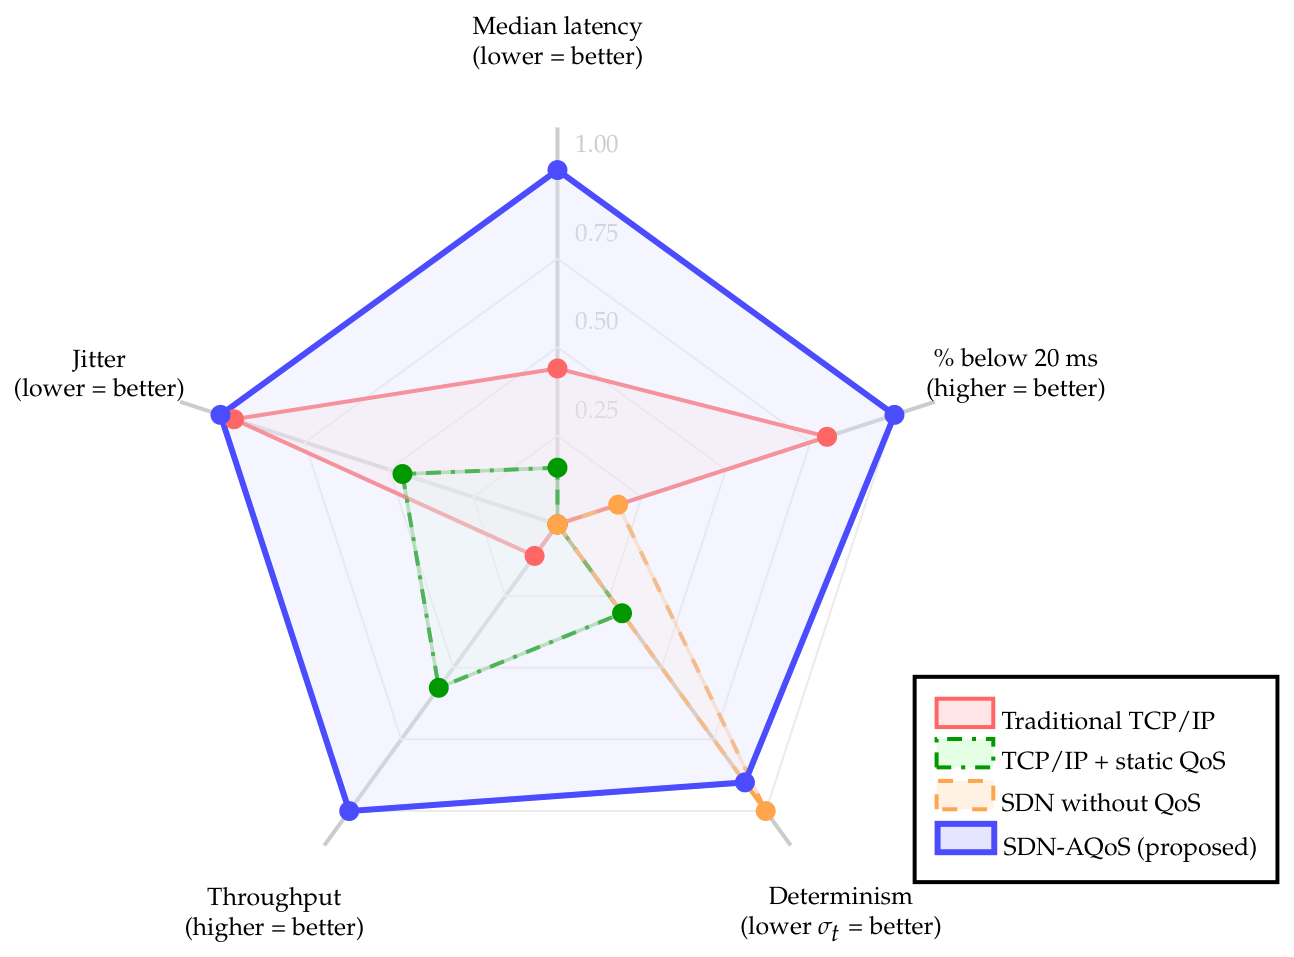
Figure 11 provides a normalised multi-dimensional comparison of the four configurations across five performance metrics under congestion. The SDN-AQoS architecture dominates in four of five dimensions (latency, jitter, throughput, and safety compliance), with only a marginal disadvantage in transfer-time determinism ( σ t ) relative to the unmanaged SDN. The TCP/IP + static QoS configuration occupies an intermediate position in throughput but scores worst in safety compliance, confirming that throughput improvement alone does not guarantee strict latency thresholds.
The reported experiments use a nine-switch topology managed by a single OpenDaylight controller. This setup matches the FEED-MT pilot but remains smaller than a utility-scale hydrogen plant or a smart grid deployment. Three bottlenecks emerge. First, the centralised control plane concentrates risk: a controller outage or a denial-of-service attack on the southbound channel would leave the data plane forwarding under stale rules. Second, the control plane round trip grows linearly with the number of packet_in events, with public OpenDaylight benchmarks placing the ceiling between 10 4 and 10 5 flows per s per controller. Third, Open vSwitch on commodity hardware degrades wildcard look-ups beyond roughly 5000 entries.
Three mitigations align with the proposed design and require no redesign: (i) active OpenDaylight clustering through the MD-SAL distributed datastore; (ii) hierarchical control plane partitioning, with one local controller per substation or electrolyser stack and a root controller for inter-domain reservations; (iii) Flow aggregation, where IEC 61850 logical-node ranges (for example, all MMXU/DPVM instances of a PV string) are matched by a single wildcarded entry. Validation of these mitigations under realistic multi-domain workloads is left as a dedicated extension.

Limitations of This Research

Traffic model. This proposal emulates IEC 61850 traffic with iperf3 streams. This abstraction preserves the EtherType, the multicast destination, the frame length (128 B for GOOSE Type 1A and 1500 B for SV), the per-flow bit-rate and the duration of the test windows. It does not reproduce the GOOSE retransmission machine ( T 0 = 4  ms, T 1 = 8  ms, up to T 4 = 1  s under IEC 61850-8-1) nor the 80 μs coherence window of IEC 61850-9-2. The latency tail we report is therefore slightly conservative since fast retransmissions tend to smooth the upper GOOSE tail; SV jitter is also not amplified by group-membership churn, which can add 1–5 ms during topology changes. Neither effect alters the qualitative ranking of the four configurations.
Sensing chain. The network-induced delay was isolated from the sensor budget. Electrical merging units (IEC 61869-9) typically contribute 1–4 ms, thermal conductivity H2-in-O2 purity meters contribute 50–500 ms, and combustion catalytic perimeter leak sensors contribute a t 90 of 1–30 s due to mass-transport and reaction kinetics. The end-to-end loop therefore remains within the IEC 61850 Type 3 envelope for fast electrical variables but extends into the seconds for slow gas variables. The cyber component must be bounded aggressively so that it does not erode the already narrow margin left by the chemistry of the sensors.
Adaptation level. The QoS rules remain fixed during every experimental run. Closed-loop adaptation, in which an external optimiser modifies the queue weights and meter rates during operation, is the natural extension and is enabled by the same northbound interface. Hardware-in-the-loop verification with native IEC 61850 stacks and explicit sensor models forms the next stage of the work.
The proposed architecture enables several future research directions. The integration of a Deep Reinforcement Learning agent [40] into the application layer would enable autonomous identification and resolution of network anomalies without manual intervention. Additionally, validation with real IEC 61850 protocol stacks and hardware-in-the-loop co-simulation with a power system model would strengthen the practical applicability of these results. Deployment on the physical FEED-MT platform at the University of Nottingham would provide the definitive test of the architecture under real operating conditions.

5. Conclusions

This paper presented a resilient SDN-based communication architecture with adaptive QoS for time-critical communication in hybrid green hydrogen microgrids. The architecture was evaluated in a FEED-MT-inspired GNS3 emulation environment under four network configurations: traditional TCP/IP, TCP/IP with static QoS policing, unmanaged SDN and SDN-AQoS. The experiments considered normal and congested operating conditions, using latency, jitter, throughput and empirical compliance with a 20 ms electrolyser-control threshold as performance indicators.
Under the evaluated 80% link utilisation congestion scenario, SDN-AQoS provided the best overall communication performance. It reduced jitter to 14.70 ms, corresponding to a 60% reduction relative to unmanaged SDN and a 45% reduction relative to TCP/IP with static QoS policing. It also achieved a median path latency of 9.68 ms and kept 97.5% of the measured samples below the 20 ms threshold. Throughput reached 58.64 Mbps, outperforming TCP/IP+sQoS by 18.9%, plain TCP/IP by 49.4% and unmanaged SDN by 58.7% for the congestion scenario considered in this study. The only sample exceeding the 20 ms threshold reached 20.5 ms, which is still below the 50 ms IEC 61850 timing envelope for primary control.
The comparison with TCP/IP + static QoS shows that rate limiting alone is not sufficient for latency-bounded microgrid communication. Static policing improves throughput under congestion, but it does not control packet service order and therefore achieves only 60% compliance with the 20 ms threshold. In contrast, SDN-AQoS combines flow classification, metering and queue-based scheduling, allowing critical traffic to receive preferential service during congestion. The results also show a performance inversion: unmanaged SDN is more efficient under light load, but degrades severely once competing traffic saturates the network. This supports a load-aware use of QoS policies, which is enabled by the RESTCONF-based northbound interface of the proposed architecture.
These findings support centralised SDN-based communication with queue-based QoS as a promising approach for improving deterministic message delivery for hydrogen assets in low-inertia microgrids. The results demonstrate communication-layer improvements that are consistent with the timing requirements of safety-relevant PEM-electrolyser coordination, including electrolyser ramp-down, BESS dispatch and fuel-cell activation. However, they do not replace physical validation of frequency response, hydrogen process dynamics or closed-loop control performance. Future work will integrate native IEC 61850 protocol stacks, explicit modelling of sensor and actuator delays, deployment on the physical FEED-MT platform and experimental validation of autonomous reinforcement-learning-based QoS adaptation.

Author Contributions

Conceptualisation, J.A.V. and R.P.G.; methodology, J.A.V. and R.P.G.; software, J.A.V.; validation, J.A.V. and R.P.G.; formal analysis, J.A.V. and R.P.G.; investigation, J.A.V.; resources, R.P.G. and M.R.; data curation, J.A.V.; writing original draft preparation, J.A.V. and R.P.G.; writing, review and editing, R.P.G., M.R., P.W. and F.B.; visualisation and supervision, R.P.G., M.R. and P.W.; project administration, R.P.G. and M.R.; funding acquisition, R.P.G. and M.R. All authors have read and agreed to the published version of the manuscript.

Funding

This research was funded by ANID (Agencia Nacional de Investigación y Desarrollo de Chile) through grant number ENER250008 of the Programa de Pasantías en el Extranjero para Profesionales y Técnicos/as del Sector Energía, Year 2025 and through the FONDECYT Iniciación Project no. 11261540.

Institutional Review Board Statement

Not applicable.

Informed Consent Statement

Not applicable.

Data Availability Statement

The GNS3 topology configuration files and measurement scripts supporting the findings of this study are publicly available in the GitHub repository at https://github.com/ascenciovil/SDN-based-Communication-Architecture-for-Autoadaptative-Control-in-Green-Hydrogen-Hybrid-Microgrids.git (accessed on 10 April 2026).

Acknowledgments

The authors appreciate the support provided by the FONDECYT Iniciación Project No. 11261540; the research project PINV01-272 of the National Council of Science and Technology (CONACYT); the A7C200 IRCF Project from the University of Nottingham; and the Programa de Redução de Assimetrias na Pós-Graduação (PRAPG) – Edital nº 14/2023 - DRI - CAPES under ID Number: 046.821.818-15. The authors also thank the Power Electronics, Machines and Control (PEMC) Research Institute at the University of Nottingham for providing access to the FEED-MT platform specifications.

Conflicts of Interest

The authors declare no conflicts of interest. The funders had no role in the design of the study; in the collection, analyses, or interpretation of data; in the writing of the manuscript; or in the decision to publish the results.

Abbreviations

The following abbreviations are used in this manuscript:
ACAlternating Current
APIApplication Programming Interface
AQoSAdaptive Quality of Service
ARPAddress Resolution Protocol
BESSBattery Energy Storage System
CDFCumulative Distribution Function
CLICommand-Line Interface
DCDirect Current
DERDistributed Energy Resource
DPDKData Plane Development Kit
DSCPDifferentiated Services Code Point
EMSEnergy Management System
FEED-MTFuture Energy Efficiency with DC Microgrid Technologies
FFRFast Frequency Response
GOOSEGeneric Object-Oriented Substation Event
HILHardware-in-the-Loop
HTBHierarchical Token Bucket
HTTPHypertext Transfer Protocol
ICMPInternet Control Message Protocol
IECInternational Electrotechnical Commission
IEDIntelligent Electronic Device
IPInternet Protocol
IQRInterquartile Range
JSONJavaScript Object Notation
LLDPLink Layer Discovery Protocol
MMSManufacturing Message Specification
NFVNetwork Function Virtualisation
ODLOpenDaylight
OOBMOut-of-Band Management
OVSOpen vSwitch
PCCPoint of Common Coupling
PEMProton Exchange Membrane
PMUPhasor Measurement Unit
PVPhotovoltaic
QoSQuality of Service
RESTRepresentational State Transfer
RESTCONFRESTful Configuration Protocol
RLReinforcement Learning
RSTPRapid Spanning Tree Protocol
SCADASupervisory Control and Data Acquisition
SDNSoftware-Defined Networking
SDN-AQoSSoftware-Defined Networking with Adaptive Quality of Service
SR-IOVSingle-Root Input/Output Virtualisation
SVSampled Values
TCPTransmission Control Protocol
UDPUser Datagram Protocol
WFQWeighted Fair Queuing

References

  1. Franco, A. Green hydrogen and the energy transition: Hopes, challenges, and realistic opportunities. Hydrogen 2025, 6, 28. [Google Scholar] [CrossRef]
  2. Wei, C.G.; Shangguan, X.C.; Yang, Y.H.; He, Y.; Zhang, C.K. Delay-Dependent H Robust Frequency Control in Microgrids: Coordination of Secondary Frequency Control and Virtual Inertia Control. IEEE Trans. Ind. Inform. 2025, 21, 6465. [Google Scholar] [CrossRef]
  3. Sarwar, F.A.; Hernando-Gil, I.; Vechiu, I. Review of energy management systems and optimization methods for hydrogen-based hybrid building microgrids. Energy Convers. Econ. 2024, 5, 259–279. [Google Scholar] [CrossRef]
  4. Apostolov, A. IEC 61850: Digitizing the Electric Power Grid; Artech House: Norwood, MA, USA, 2022. [Google Scholar]
  5. Rubio, S.; Bogarra, S.; Nunes, M.; Gomez, X. Smart grid protection, automation and control: Challenges and opportunities. Appl. Sci. 2025, 15, 3186. [Google Scholar] [CrossRef]
  6. International Electrotechnical Commission. IEC 61850:2026 SER: Communication Networks and Systems for Power Utility Automation–All Parts; International Electrotechnical Commission: Geneva, Switzerland, 2026; Available online: https://webstore.iec.ch/en/publication/6028 (accessed on 10 April 2026).
  7. Nomandela, S.; Mnguni, M.E.; Raji, A.K. Systematic Development and Hardware-in-the-Loop Testing of an IEC 61850 Standard-Based Monitoring and Protection System for a Modern Power Grid Point of Common Coupling. Energies 2025, 18, 5281. [Google Scholar] [CrossRef]
  8. Lopez, H.; Pashajavid, E.; Rajakaruna, S.; Liu, Y.; Yin, Y. Development of Programmable Digital Twin via IEC-61850 Communication for Smart Grid. Energies 2026, 19, 703. [Google Scholar] [CrossRef]
  9. Almuzakki, M.Z.; Jayawardhana, B. Cooperative nearest-neighbor control of multi-agent systems: Consensus and formation control problems. IEEE Control Syst. Lett. 2023, 7, 1873–1878. [Google Scholar] [CrossRef]
  10. University of Nottingham. Revolutionary New Smart Energy Grid to Be Installed at the University of Nottingham. Available online: https://www.nottingham.ac.uk/news/revolutionary-new-smart-energy-grid-to-be-installed-at-the-university-of-nottingham (accessed on 15 February 2026).
  11. Bitew, G.T.; Beza, T.M.; Shahzad, M. Model-based hierarchal control framework for frequency and voltage stability in islanded microgrids with low inertia. APL Energy 2025, 3, 026104. [Google Scholar] [CrossRef]
  12. Zasadzinski, M.; Ait Ziane, M.; Rafaralahy, H. Robust control of PEM electrolyzer in a renewable energy context. In Proceedings of the 2024 IEEE 63rd Conference on Decision and Control (CDC); IEEE: New York, NY, USA, 2024; pp. 113–119. [Google Scholar]
  13. European Industrial Gases Association. Hydrogen Safety: IGC Doc 121/21; EIGA: Brussels, Belgium, 2021. [Google Scholar]
  14. Phan-Van, L.; Nguyen Dinh, V.; Nguyen-Duc, T. Universal modelling and analysis of grid-scale electrolysers frequency response in wind-dominated power systems. In Proceedings of the IET Conference Proceedings CP857; IET: Hertfordshire, UK, 2023; Volume 2023, pp. 8–14. [Google Scholar]
  15. Cozzolino, R.; Bella, G. A review of electrolyzer-based systems providing grid ancillary services: Current status, market, challenges and future directions. Front. Energy Res. 2024, 12, 1358333. [Google Scholar] [CrossRef]
  16. Postel, J. RFC 791: Internet Protocol; Defense Advanced Research Projects Agency: Arlington, VA, USA, 1981. [Google Scholar] [CrossRef]
  17. Eddy, W.M. RFC 9293: Transmission Control Protocol (TCP); RFC Editor: Fremont, CA, USA, 2022. [Google Scholar] [CrossRef]
  18. Aftab, M.A.; Roostaee, S.; Hussain, S.M.S.; Ali, I.; Thomas, M.S.; Mehfuz, S. Performance evaluation of IEC 61850 GOOSE-based inter-substation communication for accelerated distance protection scheme. IET Gener. Transm. Distrib. 2018, 12, 4089–4098. [Google Scholar] [CrossRef]
  19. IEEE Standards Association. IEEE Std 802.1Qbv-2015: IEEE Standard for Local and Metropolitan Area Networks–Bridges and Bridged Networks–Amendment 25: Enhancements for Scheduled Traffic; IEEE Standards Association: New York, NY, USA, 2016. [Google Scholar]
  20. Finn, N.; Thubert, P.; Varga, B.; Farkas, J. Deterministic Networking Architecture; RFC 8655; RFC Editor: Fremont, CA, USA, 2019. [Google Scholar] [CrossRef]
  21. Boeding, M.; Hannon, C.; Pearson, M.; Konstantinou, C. An Evaluation of Protocol Latencies in an Open-Source 5G Standalone Network for Smart Grid Communications. Energies 2024, 17, 373. [Google Scholar] [CrossRef]
  22. Taveras Cruz, A.J.; Aybar-Mejía, M.; Díaz Roque, Y.; Coste Ramírez, K.; Durán, J.G.; Rosario Weeks, D.; Mariano-Hernández, D.; Hernández-Callejo, L. Implications of 5G Technology in the Management of Power Microgrids: A Review of the Literature. Energies 2023, 16, 2020. [Google Scholar] [CrossRef]
  23. Molina, E.; Jacob, E.; Matias, J.; Moreira, N.; Astarloa, A. Using software defined networking to manage and control IEC 61850-based systems. Comput. Electr. Eng. 2015, 43, 142–154. [Google Scholar] [CrossRef]
  24. Leal, A.; Botero, J.F.; Jacob, E. QoS Proposal for IEC 61850 traffic under an SDN environment. In Proceedings of the 2018 IEEE 10th Latin-American Conference on Communications (LATINCOM); IEEE: New York, NY, USA, 2018; pp. 1–6. [Google Scholar]
  25. Aydeger, A.; Akkaya, K.; Cintuglu, M.H.; Uluagac, A.S.; Mohammed, O. Software defined networking for resilient communications in smart grid active distribution networks. In Proceedings of the 2016 IEEE International Conference on Communications (ICC); IEEE: New York, NY, USA, 2016; pp. 1–6. [Google Scholar]
  26. Qu, Y.; Liu, X.; Jin, D.; Hong, Y.; Chen, C. Enabling a resilient and self-healing PMU infrastructure using centralized network control. In Proceedings of the 2018 ACM International Workshop on Security in Software Defined Networks & Network Function Virtualization, Tempe, AZ, USA, 21 March 2018; pp. 13–18. [Google Scholar]
  27. European Commission. Integrated Solutions for Green Hydrogen Production and Consumption (INTEGRATE); Project ID: 833955, H2020-EU.3.3.2.; CORDIS|European Commission: Brussels, Belgium, 2019. [Google Scholar]
  28. Girdhar, M.; Park, K.; Su, W.; Hong, J.; Herath, A.; Liu, C.C. SDN-based smart cyber switching (SCS) for cyber restoration of a digital substation. In Proceedings of the 2025 IEEE Power & Energy Society General Meeting (PESGM); IEEE: New York, NY, USA, 2025; pp. 1–5. [Google Scholar]
  29. Trillo, J.R.; Herrera-Viedma, E.; Morente-Molinera, J.A.; Cabrerizo, F.J. A large scale group decision making system based on sentiment analysis cluster. Inf. Fusion 2023, 91, 633–643. [Google Scholar] [CrossRef]
  30. Aslam, M.M.; Li, W.; Liu, W.; Qi, Y.; Saleem, U.; Riaz, S. Integrated modeling and simulation of control and communication system in smart grid using CSMO (Co-simulation of MATLAB and OMNeT++). Comput. Electr. Eng. 2025, 122, 109989. [Google Scholar] [CrossRef]
  31. Krishnan, S.G.; Aftab, M.A.; Ahmed, S.; Konstantinou, C. Real-Time Co-Simulation for DC Microgrid Energy Management with Communication Delays. In Proceedings of the 2025 IEEE International Communications Energy Conference (INTELEC); IEEE: New York, NY, USA, 2025; pp. 27–32. [Google Scholar]
  32. Ali, O.; Mohammed, O.A. A review of multi-microgrids operation and control from a cyber-physical systems perspective. Computers 2025, 14, 409. [Google Scholar] [CrossRef]
  33. GNS3 Technologies Inc. GNS3 GUI, Version 2.2.59; GNS3 Technologies Inc.: Austin, TX, USA, 2026. Available online: https://github.com/GNS3/gns3-gui/releases/tag/v2.2.59 (accessed on 10 April 2026).
  34. OpenDaylight Project. OpenDaylight Carbon Documentation; Linux Foundation: San Francisco, CA, USA, 2017; Available online: https://docs.opendaylight.org/en/stable-carbon/ (accessed on 10 April 2026).
  35. GNS3. GNS3 Official Documentation. 2026. Available online: https://docs.gns3.com/ (accessed on 2 April 2026).
  36. OpenDaylight. OpenDaylight Official Documentation. 2026. Available online: https://docs.opendaylight.org/en/latest/index.html (accessed on 2 April 2026).
  37. OpenDaylight Project. OpenDaylight User Guide; Linux Foundation: San Francisco, CA, USA, 2023. [Google Scholar]
  38. OpenDaylight NETCONF Project. OpenDaylight NETCONF/RESTCONF Documentation; Linux Foundation: San Francisco, CA, USA, 2023. [Google Scholar]
  39. Sarpkaya, F.B.; Francini, A.; Erman, B.; Panwar, S. Evaluation of TCP Congestion Control for Public High-Performance Wide-Area Networks. arXiv 2026, arXiv:2603.12660. [Google Scholar]
  40. Pei, X.; Sun, P.; Hu, Y.; Li, D.; Chen, B.; Tian, L. Enabling efficient routing for traffic engineering in SDN with deep reinforcement learning. Comput. Netw. 2024, 241, 110220. [Google Scholar] [CrossRef]
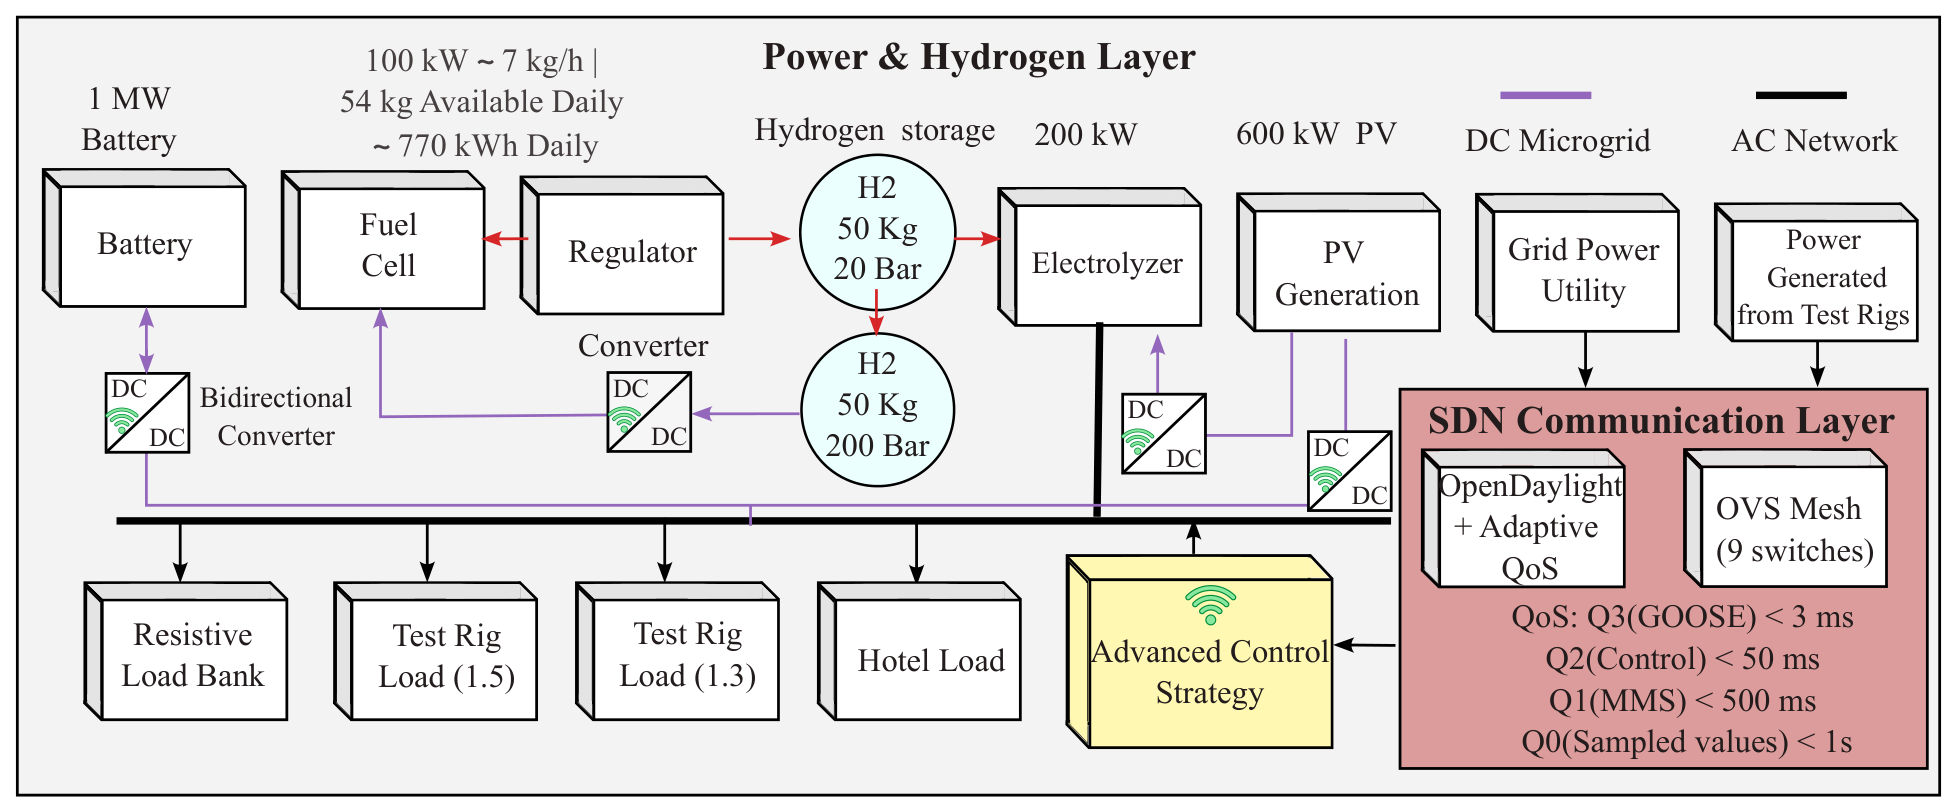
Figure 1. Overview of the FEED-MT-inspired hybrid microgrid and the proposed SDN communication layer. The figure separates the physical power-hydrogen layer from the communication layer to clarify how PV generation, battery storage, PEM electrolyser, hydrogen tanks, fuel cell, grid interface and controllable loads are mapped to SDN-managed traffic classes. The communication layer includes the OpenDaylight controller, the OVS mesh and four QoS queues aligned with IEC 61850-like traffic classes: Q3 for GOOSE protection messages (<3 ms), Q2 for primary control commands (<50 ms), Q1 for MMS supervisory traffic (<500 ms), and Q0 for Sampled Values or background traffic (<1 s).
Electronics 15 02335 g001
Figure 2. GNS3 emulation topology implementing the SDN-based communication architecture for the FEED-MT microgrid. The GNS3 emulation topology comprises nine Open vSwitch nodes arranged in a redundant mesh. The Out-of-Band Management (OOBM) plane separates the OpenFlow control channel (br1, 192.168.100.0/24) from IEC 61850 data traffic (br0, Layer 2). OpenDaylight manages the switches via OpenFlow 1.3, and the QoS optimisation layer uses the RESTCONF API. Labels .101–.109 denote the last octet of the OVS management IP addresses in the 192.168.100.X/24 subnet.
Electronics 15 02335 g002
Figure 3. OpenFlow-based QoS processing pipeline implemented within each Open vSwitch node. Colors distinguish the IEC 61850-like traffic classes: red for GOOSE, orange for Sampled Values, green for MMS, blue for control traffic and grey for default traffic. Numbered markers indicate the packet-processing stages: ingress, classification, metering, queuing and egress. Arrows show the forwarding path from classification to the corresponding meter or queue. The asterisk (*) denotes the default match rule for traffic not captured by higher-priority entries, including ARP, LLDP, ICMP and management traffic.
Electronics 15 02335 g003
Figure 4. Mapping between the IEC 61850 communication profile of the FEED-MT microgrid and the GNS3 emulation parameters. Panel (a) links each traffic class to its criticality level, timing envelope, associated asset and SDN queue; colors identify the corresponding traffic classes: red for GOOSE protection, orange for control setpoints, green for MMS/SCADA and blue for Sampled Values. The dashed bidirectional arrows indicate the mapping between IEC 61850-like traffic classes and their emulated GNS3/iperf3 configurations. Panel (b) reports the iperf3 command parameters used in the experiments, including transport protocol, offered rate, payload size, duration and background congestion load. The figure clarifies that the experiments emulate IEC 61850-like traffic classes rather than native IEC 61850 protocol semantics.
Electronics 15 02335 g004
Figure 5. Latency distribution across all four network configurations under normal and congested operating conditions. Box plots show the median (line), interquartile range (box), 1.5×IQR whiskers, and outliers (filled dots). Individual measurements are overlaid as semi-transparent markers to reveal the underlying data distribution (n = 40–42 per scenario). Under normal conditions, TCP/IP+sQoS exhibits the widest spread (7.95–158 ms) due to meter-induced variability. Under congestion, the SDN-AQoS configuration maintains a compact distribution (IQR: 8.74–11.83 ms) with 97.5% of measurements below the 20 ms safety threshold (dashed red line).
Electronics 15 02335 g005
Figure 6. Empirical cumulative distribution function (CDF) of end-to-end latency under congestion. The SDN-AQoS configuration delivers 97.5% of latency below the 20 ms safety threshold (shaded region), with P 50 = 9.68 ms and P 90 = 14.2 ms. The TCP/IP configuration achieves 90% compliance. The TCP/IP+SQoS configuration achieves only 60% compliance, with a tail of 36 ms, and performs worse than plain TCP/IP despite its rate limiting. The unmanaged SDN delivers 66.7% of packets within the safe envelope, with a long tail to 44.6 ms.
Electronics 15 02335 g006
Figure 7. Temporal sequence of all individual latency measurements (ICMP echo) under normal and congested conditions. The dashed horizontal line in panel (b) marks the 20 ms safety threshold. Under normal conditions, TCP/IP+sQoS exhibits the most erratic pattern (peaks at 158 and 150 ms), reflecting periodic token-bucket depletion. The TCP/IP configuration shows sporadic outliers (up to 100 ms at packet 15). The SDN configurations maintain flat traces. Under congestion, TCP/IP+sQoS displays wide oscillations (9.2–36 ms), while the SDN-AQoS trace remains consistently low with a single excursion at packet 30 (20.5 ms).
Electronics 15 02335 g007
Figure 8. Jitter defined as the maximum–minimum latency range, under normal and congested conditions for the four network configurations. The red and green downward arrows indicate jitter reduction from normal to congested operation for TCP/IP and TCP/IP+sQoS, respectively, whereas the orange upward arrow indicates the jitter increase observed for unmanaged SDN under congestion. The blue label identifies the stable behaviour of SDN-AQoS, and the red dashed horizontal line marks the 20 ms PEM electrolyser safety threshold. TCP/IP+sQoS shows the largest jitter under normal conditions (150.05 ms), decreasing to 26.79 ms under congestion but still exceeding the threshold. SDN-AQoS remains consistent across both conditions (15.48 and 14.70 ms), staying below the 20 ms threshold.
Electronics 15 02335 g008
Figure 9. Mean throughput across five iperf3 runs using the command iperf3 -c 192.168.0.1 -n 100M, where 100M denotes a 100 MB transfer size. Error bars represent ± 1 σ . The arrows indicate the throughput variation from normal to congested operation for each configuration. Under congestion, the SDN-AQoS architecture retains the highest effective throughput (58.64 ± 1.51 Mbps, −44% degradation), followed by TCP/IP+sQoS (49.32 ± 2.52 Mbps, −33%), TCP/IP (39.24 ± 2.08 Mbps, −66%), and unmanaged SDN (36.96 ± 0.50 Mbps, −70%).
Electronics 15 02335 g009
Figure 10. Individual iperf3 measurements for the 100 MB transfer test (n = 5 per scenario), plotted as transfer time versus throughput. Each color identifies one network configuration: red for TCP/IP, green for TCP/IP+sQoS, orange for SDN and blue for SDN-AQoS. Diamond markers indicate the mean value of each cluster. The TCP/IP+sQoS clusters occupy a distinct region, with lower throughput under normal conditions due to meter throttling and intermediate throughput under congestion. The SDN-AQoS clusters show the tightest grouping, with σ t  = 0.09 s under normal conditions and 0.38 s under congestion.
Electronics 15 02335 g010
Figure 11. Normalised radar chart comparing the four configurations across five performance dimensions under congestion. Each axis is min-max normalised so that the outermost ring represents the best value (1.0). The SDN-AQoS architecture dominates in four of five dimensions, while TCP/IP+sQoS performs worst in safety compliance, revealing that policing alone does not guarantee latency-bounded delivery.
Electronics 15 02335 g011
Table 1. Physical assets represented in the FEED-MT-based SDN emulation.
AssetRated QuantityRole in the Communication Mapping
PV generation (DPVM/MMXU)600 kWRenewable generation telemetry
Battery system (ZBAT)1 MWFast power balancing and control telemetry
PEM electrolyser (DEOL)200 kWControllable hydrogen-production load
PEM fuel cell (DFCL)100 kWDispatchable generation support
H2 storage2 × 50 kgHydrogen storage monitoring
Controllable loadsTest-rig/load banksDisturbance and demand-side emulation
SDN communication layer9 OVS nodesIEC 61850 traffic forwarding and QoS enforcement
Table 2. iperf3 parameters used to emulate each IEC 61850-like traffic class.
IEC 61850 ClassTransportRatePayloadDurationCommand Parameters
GOOSE (Type 1A)UDP2 Mbps128 B30 s-u -b 2M -l 128 -t 30
Control set-pointsUDP1 Mbps256 B30 s-u -b 1M -l 256 -t 30
MMS/SCADATCPdefaultdefault30 s-c ip  -t 30 -P 4
Sampled Values (Type 4)UDP5 Mbps1500 B30 s-u -b 5M -l 1500 -t 30
Background congestionUDP80 Mbpsdefault30 s-u -b 80M -t 30 per host
Table 3. Network performance under normal operating conditions (no congestion).
Network ConfigurationTransfer Time (s)Throughput (Mbps)
Traditional TCP/IP7.32 ± 0.45115.0 ± 7.00
TCP/IP + static QoS11.42 ± 0.5173.66 ± 3.07
SDN without QoS6.85 ± 0.43122.8 ± 8.17
SDN with Adaptive QoS8.08 ± 0.09103.8 ± 1.30
Table 4. Network performance under high congestion conditions.
Network ConfigurationTransfer Time (s)Throughput (Mbps)
Traditional TCP/IP21.41 ± 1.1339.24 ± 2.08
TCP/IP + static QoS17.06 ± 0.8749.32 ± 2.52
SDN without QoS22.72 ± 0.3036.96 ± 0.50
SDN with Adaptive QoS14.33 ± 0.3858.64 ± 1.51
Table 5. Jitter (latency variation) under different operating conditions.
ConfigurationNormal (ms)Congestion (ms)Relative Change
Traditional TCP/IP91.6815.58−83.0%
TCP/IP + static QoS150.0526.79−82.1%
SDN without QoS5.1037.00+625% (degraded)
SDN with AQoS15.4814.70−5.0% (stable)
Disclaimer/Publisher’s Note: The statements, opinions and data contained in all publications are solely those of the individual author(s) and contributor(s) and not of MDPI and/or the editor(s). MDPI and/or the editor(s) disclaim responsibility for any injury to people or property resulting from any ideas, methods, instructions or products referred to in the content.