1. Introduction
Modern higher education institutions have increasingly adopted systems and platforms that support distance learning (Learning Management Systems—LMSs), as these platforms are widely used for distributing and tracking educational materials through digital platforms and channels [
1,
2]. Most institutions rely on ready-made technical solutions that are open source and can be tailored to their needs; one such solution is the LMS platform itself, which supports the integration of various educational services [
3]. In order for the LMS to meet all the requirements and needs of an institution, it must be expanded with various plugins or through the integration of API services. This shows that LMS platforms have become an important part of modern education and support many key educational processes [
4]. The increasing demand for such systems and the extent of their use lead to a key problem regarding the performance and infrastructure of an LMS. Numerous studies indicate that the choice of infrastructure (e.g., local installation in relation to the cloud environment) significantly affects the distribution of information, the response of certain operations, and the overall loading time of the LMS environment.
In many cases, cloud solutions achieve a significant difference in performance compared to local implementations [
5]. In addition, institutions indicate that poor technology choices can also affect the process of successful implementation and the use of the distance learning platform, which can lead to platform overload and occasional outages. Such situations often encourage the application of container and orchestration technologies for greater availability and sustainability of the system [
6]. The system must be capable of withstanding all activities from start to finish and be prepared for a sudden surge in concurrent users and demands [
7]. The period of such load is identified as the main cause of traffic congestion and increased latency that is visible on the user side during the loading process [
8,
9]. In high-demand architectures, systems can suffer significant degradation or even partial failure, which is why special architectural strategies are necessary to preserve them during sudden load spikes [
10]. In distributed web services, the biggest problem is the sudden load that often leads to failures, known as the Thundering Herd effect. This process occurs when too many clients send identical requests to the system at the same time, resulting in a sudden spike in requests instead of a gradual increase, which is preferable. In practice, this means that the components of the system responsible for receiving and processing requests become overloaded and may increase execution time or latency, or experience downtime due to an insufficient number of available working units [
11]. From a technical standpoint, a large number of simultaneous requests encounter the Load Balancer, which at that moment becomes a chokepoint in the processing of user requests. It accepts all requests from users and distributes them to a limited number of instances [
12]. Although it distributes requests across available instances, it cannot by itself increase the resources needed to process them. It often happens that the number of incoming requests exceeds the number of available instances, causing processes to pile up until the waiting queues become very large, not due to the processing itself, but because of the waiting time to reach that processing. As backend instances are gradually scaled up, their internal state changes. This can lead to more errors and additional strain on a system that is already burdened with traffic control, monitoring, and overload recovery. All of these issues need to be identified when designing the architecture that will be tasked with handling a large number of requests and sessions [
13]. Even microservices architecture suffers the same consequences, and the pressure is even more pronounced, as the network communication between services, as well as the mechanisms for monitoring routing and error handling, are also burdened. A significant limitation in a large number of implementations is the auto-scaling of processors based on resource utilization thresholds. Numerous implementations of cloud solutions often automatically add or remove instances when the CPU exceeds a certain threshold [
14]. The problem can be viewed as a mismatch between the layers of the system, primarily the network and traffic layer, which first detects and suffers the consequences of a sudden spike in load, while the computing layer only reacts when system overload is reached.
The primary goal of this research is to design and analyze a simulation-based model that integrates the network layer with the computing layer in a Kubernetes-like cloud-native environment. In this case, network intelligence is integrated at the very entry point of the Kubernetes environment through the Ingress/traffic-management component, while the computing layer is designed through container orchestration and automatic scaling mechanisms within the platform. This approach is based on research that shows distributed systems under heavy load experience sudden spikes that can lead to overload, service degradation, or temporary service unavailability. Therefore, it is necessary to manage the load in a balanced way and to utilize the capabilities of auto-scaling, combining them into an integrated mechanism capable of continuous monitoring [
15]. Previous traffic management and routing must play an even greater role in maintaining service availability due to variable load.
The motivation for this research arises from the need for LMSs to be designed to be resilient during critical moments of the educational process, which involves high loads. It is particularly important to ensure that operations in specific scenarios where classical auto-scaling techniques using resource metrics are employed do not respond in time to prevent system degradation or service failure.
The research gap lies in the fact that existing studies largely analyze the performance of LMS platforms from the perspective of infrastructure choice, cloud implementation, containerization, or the application of standard auto-scaling processes, while integrated approaches in which latency is used as a trigger for adaptive scaling are significantly less frequently addressed. In this context, latency can be treated as an early control variable because it reflects increased user activity before CPU utilization reaches the scaling threshold. In other words, the connection between the intelligence of the network layer for traffic management and the resource orchestration mechanisms in the context of the resilience of LMSs to sudden spikes in load has not been sufficiently explored.
Analyzing all these assumptions, the work is focused on designing and analyzing a model that integrates the network with the computing layer within a Kubernetes-like simulated environment, with the aim of recognizing traffic congestion anomalies at the earliest possible stage and responding as efficiently as possible. Instead of relying on CPU utilization, the proposed approach uses the measured network latency at the very entry point as an early signal to activate horizontal scaling mechanisms.
The key contributions of this work are:
The proposed conceptual model for LMS environments integrates ingress-layer latency and orchestration mechanisms in a Kubernetes-like simulated cloud-native environment in order to examine autoscaling behavior under sudden load spikes.
In the proposed architecture, latency is introduced at the entry point as a control mechanism for activating adaptive horizontal scaling. In the simulation, this signal enabled earlier activation of the scaling mechanism than the CPU-based baseline under the same workload assumptions.
A management mechanism based on the MAPE-K paradigm (Monitor-Analyze-Plan-Execute over Knowledge) is defined, which enables monitoring of the system’s state, analysis of load conditions, planning of responses, and execution of scaling actions in a closed control loop [
16].
A simulation-based evaluation of the proposed approach was conducted in a Python 3.13 environment using NumPy 2.2 and Matplotlib 3.10.0. The results were compared with a CPU-threshold-based autoscaling baseline implemented within the same Python simulation. Both models use the same workload, replica limits, and simulated service-capacity assumptions, while they differ only in the metric used to trigger scaling. The baseline, therefore, represents a CPU-based autoscaling policy, not a full monolithic or centralized production architecture [
17].
The contribution of this paper is not the introduction of latency-based autoscaling as a completely new concept, but its application and simulation-based evaluation in the context of LMS platforms exposed to sudden and intensive traffic peaks.
The novelty of this paper should therefore be interpreted in a limited and specific sense. More specifically, the contribution of the paper is limited to the definition of a simplified threshold-based feedback controller and its use in a controlled Python simulation to compare CPU utilization and ingress-layer latency as autoscaling triggers under identical LMS burst-load assumptions. The study does not claim to introduce latency-based autoscaling as a completely new autoscaling paradigm, nor does it provide production-level validation in a real Kubernetes cluster. The paper does not propose an optimized, predictive, or production-ready autoscaling algorithm. Therefore, the results should be understood as evidence of the behavior of the proposed control logic under defined simulation assumptions, rather than as general proof of performance improvement in Kubernetes-based LMS deployments.
The paper follows the following structure, starting with an introduction that provides the motivation for the research, identifies the research gap, and presents the goals and contributions of the work. The second part examines the relevant literature that encompasses the fields of microservice architecture, containerization, Kubernetes autoscaling, and traffic management in cloud systems, with a particular focus on the limitations of existing approaches. The third part presents the proposed architecture along with a description of the model based on the MAPE-K loop. In the fourth part, the experimental environment, research methodology, and load scenarios are presented. The last, fifth part examines and analyzes the results of the simulation-based research. Guidelines for future work, limitations of the research, and a summary of the entire study are provided in the conclusion of this paper.
3. Research Methodology
3.1. Research Approach and Experimental Design
This research uses a simulation-based experimental approach to investigate the behavior of the proposed latency-aware autoscaling model under controlled load conditions. The model was not deployed in a real Kubernetes cluster but was implemented as a Python-based simulation that represents the logical components of a cloud-native LMS environment. These components include ingress-level latency monitoring, metrics collection, scaling decision logic, and horizontal replica adjustment. In this paper, the term Kubernetes environment refers to a Kubernetes-like cloud-native model represented in simulation rather than a deployment in a real production Kubernetes cluster. The simulated LMS workload represents aggregated request patterns related to common LMS activities, including simultaneous user login, access to course materials, opening of online assessments, and assignment submission. These activities were not modeled as separate LMS functional modules but were represented through gradual and burst request patterns in order to capture the short-term load behavior typical of examinations, deadlines, and simultaneous access to learning resources.
In the simulation, the LMS workload was interpreted as an aggregated request stream composed of several typical academic activities rather than as a set of separately modeled LMS functions. The burst phase was assumed to be dominated by simultaneous user logins and access to examination or course-content pages, since these actions commonly occur within a narrow time window at the beginning of an online examination or scheduled learning activity. During the middle part of the scenario, the workload was assumed to include repeated content access, page navigation, assessment interactions, and background requests generated by the LMS interface. Toward the latter part of the scenario, assignment submission or file-upload activity was considered as an additional source of short-term pressure on the system. These activities were not assigned separate request weights or independent service models in the present simulation. Instead, they were represented as a combined traffic pattern in order to keep the comparison focused on the selected autoscaling trigger, namely CPU utilization versus ingress-layer latency.
The reason for using a simulation environment is to provide repeatable conditions in which different loads and traffic patterns can be examined, together with latency thresholds, cooldown periods, and scaling conditions. This also avoids the additional variability introduced by real cluster configuration, node performance, container startup behavior, and provider infrastructure. In this way, the simulation allows different scaling mechanisms to be compared under the same service load conditions.
The experimental research included two approaches. The baseline model is defined as a CPU-threshold-based autoscaling policy within the same Python simulation environment. It is not used as a representation of a complete monolithic LMS architecture. The difference between the proposed model and the base case lies in the scaling trigger, where the base case relies on CPU usage, whereas the proposed model relies on ingress-layer latency. This setup makes it possible to isolate the impact of the selected control signal. The first approach therefore represents a traditional CPU-based scaling model, where scaling decisions are made only after a defined infrastructure load threshold is exceeded. The second approach is based on measuring network latency at the ingress layer, which is then used as a trigger for activating adaptive horizontal scaling. The same load scenario was applied to both models in order to compare system behavior during sudden load spikes. The primary reported variables in this simulation were average latency, replica count, threshold-crossing time, and time to the first scaling action after a load spike. Throughput, error rate, and full recovery time are recognized as important service-quality indicators, but they were not evaluated with the same depth in the present simulation and are therefore treated as limitations and targets for future real-cluster validation. This approach made it possible to assess how the selected scaling trigger affects autoscaling reaction and latency behavior under burst-load conditions.
3.2. Architecture of the Experimental Environment
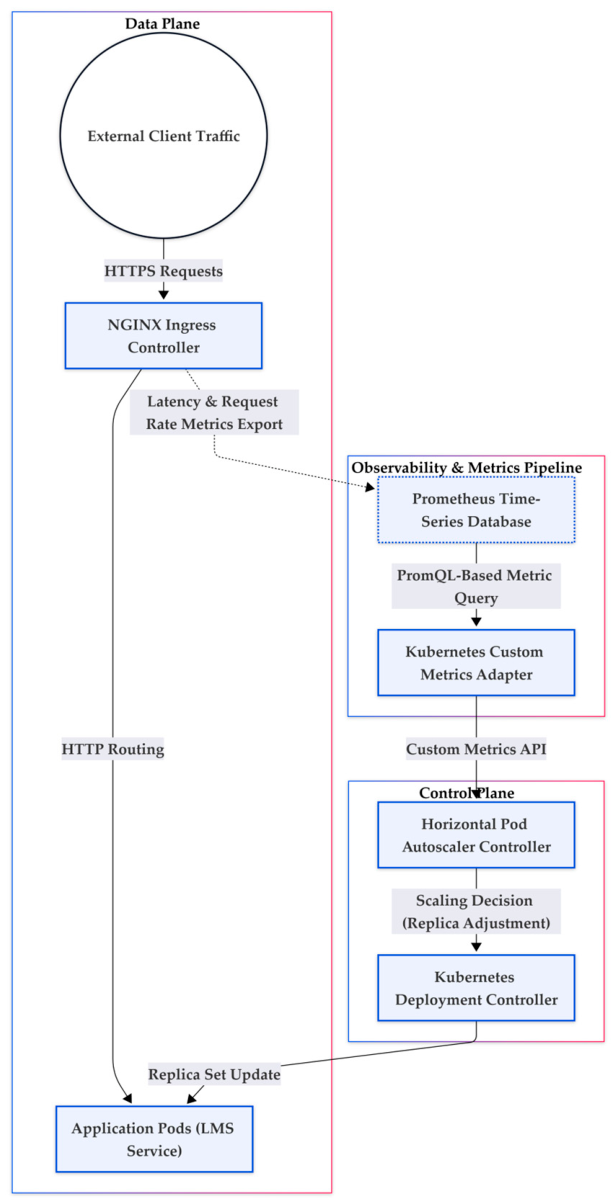
The architecture of the experimental environment is shown in
Figure 2, designed as a multilayer model that illustrates the key functionalities of the components. This model is based on the assumption that traditional approaches relying on CPU and memory metrics are not always adequate for maintaining quality of service under dynamic and unpredictable load spikes. At the Data Plane layer, all traffic passes through the NGINX Ingress Controller, which performs TLS termination and routes requests to the appropriate microservices using layer 7. In this model, the ingress layer is not only a network gateway, but also a key point for measuring performance, as it enables the collection of latency-related data that reflects the user experience. The ingress layer, therefore, becomes the source of important information about system behavior under load. The Telemetry Pipeline layer establishes a bridge between network telemetry and orchestration decision-making. NGINX Ingress provides latency-related metrics [
45], while Prometheus performs periodic data collection at defined time intervals. Unlike the standard approach, where HPA relies mainly on resource metrics, the proposed model uses a Custom Metrics Adapter that normalizes the data through defined PromQL queries. In this way, latency is transformed into an indicator suitable for control logic, enabling the transition from a resource-based to a performance-oriented management model. Within the Control Plane layer, the Horizontal Pod Autoscaler is represented as part of a closed MAPE-K cycle. In the monitoring phase, the system tracks deviations from the defined latency threshold, after which the analysis phase assesses the degree of performance degradation. If a deviation from the defined value is detected, an appropriate system response in the form of scaling is planned and then executed by adding or removing pods in the simulation model. This closed control loop enables dynamic adaptation of instances in accordance with the load and perceived quality of service. In this way,
Figure 2 explains how the network and orchestration layers are connected, with latency serving as the primary control signal for resource allocation.
3.3. Configuration of the Experimental Environment
In order to make the testing procedure repeatable, an experimental environment was defined through several parameters, including the logical structure of the cluster, available resources, network communication, and automatic scaling mechanisms. This environment does not represent a production Kubernetes cluster. Instead, it is modeled as a simulation-based cloud-native LMS environment that allows the behavior of different scaling mechanisms to be examined under controlled conditions. The simulation environment is modeled as a Kubernetes-like cluster consisting of one control-plane node and three worker nodes. In the simulation, each worker node has limited memory and processing capacity. This allows the observation of how horizontal scaling affects system stability and resource availability. The service itself starts with the minimum number of replicas defined in the simulation, while the upper replica limit is predefined according to the modeled capacity and available system resources. The network layer was configured to represent HTTPS communication through an ingress component and application-layer traffic routing, with bandwidth limitations modeled in line with typical cloud-native environments [
46]. Network behavior included baseline latency, variations in delay during traffic growth, and the interval at which metrics were collected. These values were used as parameters of the Prometheus-like telemetry model. A latency threshold was defined as the main control parameter for activating the latency-aware scaling mechanism. To reduce oscillatory behavior, a cooldown period and limits on the minimum and maximum number of pods were also introduced. Load scenarios were generated in a Python environment as sequences of requests with gradual growth and sudden traffic spikes [
47]. This enabled the examination of system behavior during stable traffic, short-term overload, and recovery after a load spike. Locust, JMeter, and k6 were not used in the current simulation. They are listed only as recommended load-generation tools for future validation in a real Kubernetes cluster. The defined configuration allows for reproducibility of the experiment and positions the results within the context of a limited, yet representative, cloud-native LMS environment.
Table 1 presents the main parameters used to define the simulation environment and the control logic of the proposed model.
The parameters used in the simulation approximate a realistic load scenario for the LMS platform during a period of load growth. The upper bound of the load range of up to 2000 concurrent users or requests per second represents aggregated values across scenarios, most commonly when students are accessing online exams, just before an assignment deadline, or during concurrent access to course materials. The latency threshold of 500 ms was used as a practical latency boundary, as users might already notice delays above this value during LMS operations such as logging in, opening assessment pages, navigating learning materials, or uploading files. The 15 s metric collection interval was a compromise between timely detection and the need to avoid excessive telemetry noise for the tracking-based autoscaling process. The 10 s cooldown period was introduced to avoid repeated scaling decisions resulting from short-term latency fluctuations. The replica range of 1–6 pods represents a small to medium-sized institutional LMS installation, where horizontal scaling is possible but is still limited by finite computing capacity. Finally, the simulated pod activation delay represents the time lag between the scaling decision and the time an additional replica becomes available to process LMS requests. These assumptions do not claim to reproduce a specific production LMS installation but provide a controlled and repeatable approximation of the bursty load conditions typically observed during exams, assignment submissions, and synchronized access to learning resources.
In this study, the delay in activating the pod is considered a simulation parameter in the model rather than the actual Kubernetes pod start-up time. It refers to the gap between the point at which a scaling decision is made and the time when a new pod is ready to process requests. Such a simplification was made since the model does not simulate all the processes performed in a real Kubernetes cluster.
3.4. Telemetry Scaling Control Model
The proposed model is based on the assumption that traditional approaches relying mainly on CPU and memory utilization may not respond quickly enough during unpredictable load spikes [
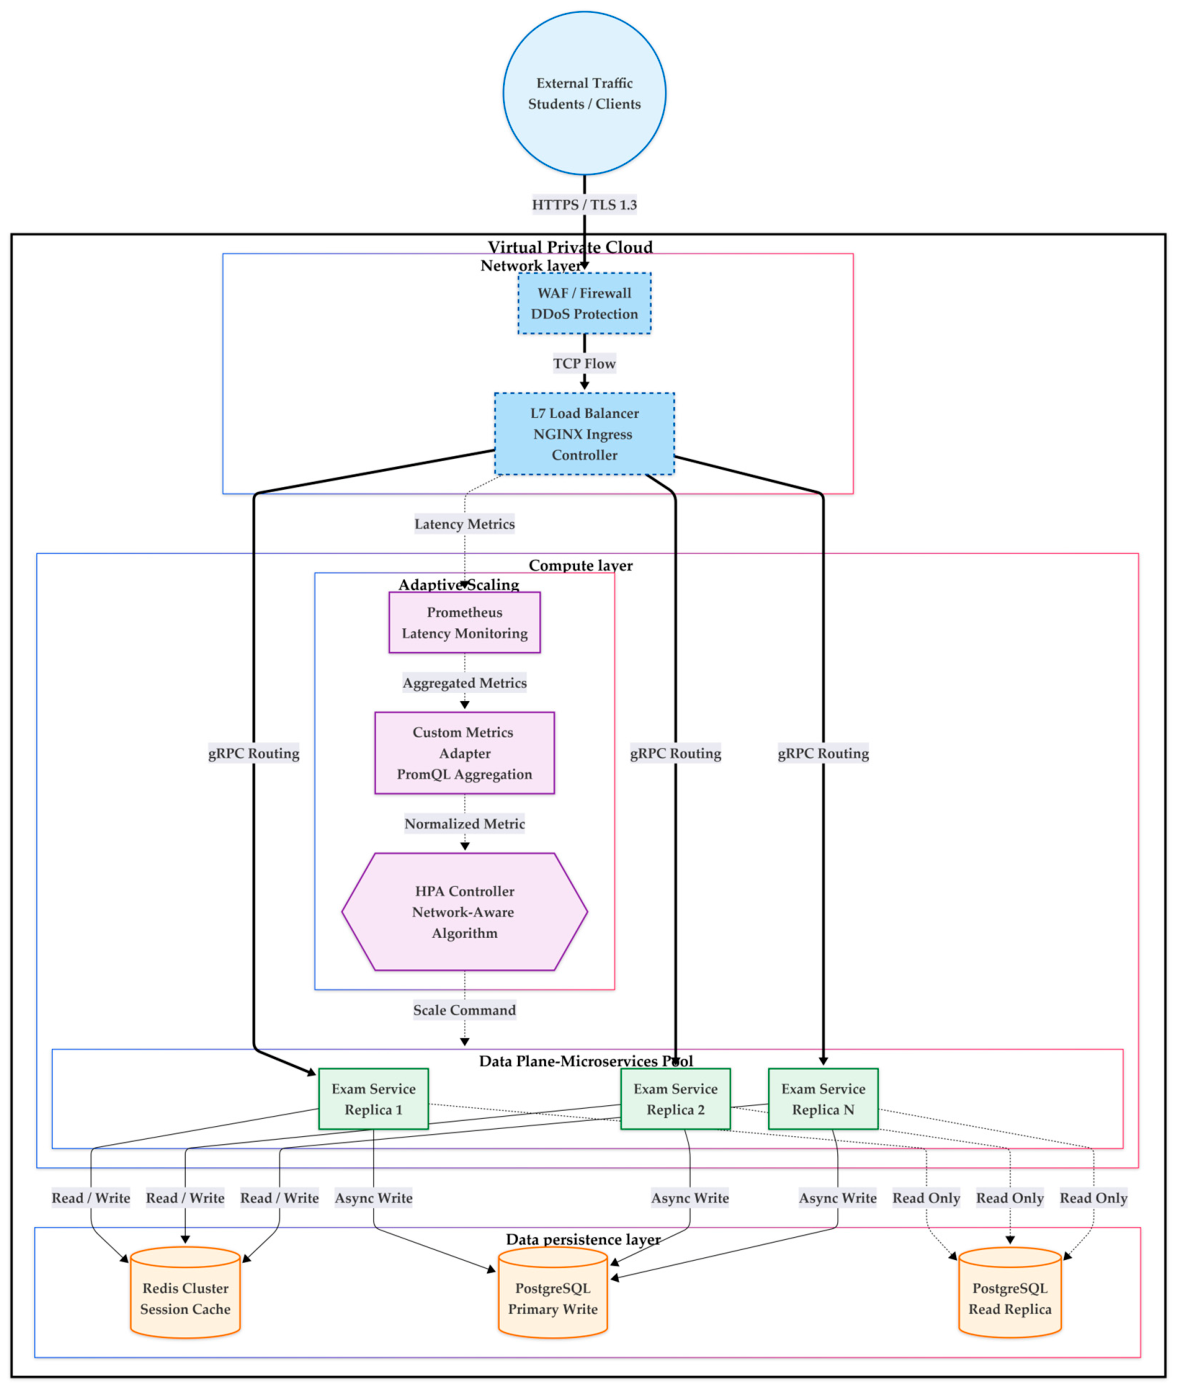
48]. For these reasons, this paper discusses an approach that allows for the utilization of network latency measured at the very entry point of the system as the main trigger for activating adaptive resource management. At the system entry point, all traffic passes through the NGINX Ingress Controller, which also performs TLS termination and routes requests to the appropriate microservice units using layer 7. At the data plane layer, data on system behavior is also collected by measuring latency and other indicators that can help maintain the user experience. By establishing a telemetry pipeline between the networking and orchestration layers, NGINX Ingress can provide raw metrics from the very entry point of this data stream, while Prometheus will periodically collect and aggregate them for the needs of the Custom Metrics Adapter, which will further process them into a format suitable for the Kubernetes Custom Metrics API. In this way, latency becomes a signal suitable for the control logic of the Horizontal Pod Autoscaler mechanism. Within the control plane layer, the Horizontal Pod Autoscaler is used as a closed-loop adaptation cycle. After that, in the monitoring section, deviations in measured latencies from the defined threshold are tracked in order to assess the degree of degradation. If the system detects exceedances of the allowed values, responses to these are defined in the planning phase using appropriate scaling actions, which are implemented in the execution phase through the Deployment controller by adding or removing pods. With this approach, the model integrates the network and orchestration layers, with latency set as the primary trigger for resource allocation.
Figure 3. Conceptual architectural model of automatic horizontal scaling based on application-level metrics.
3.5. Formal Model of a Closed Control Loop
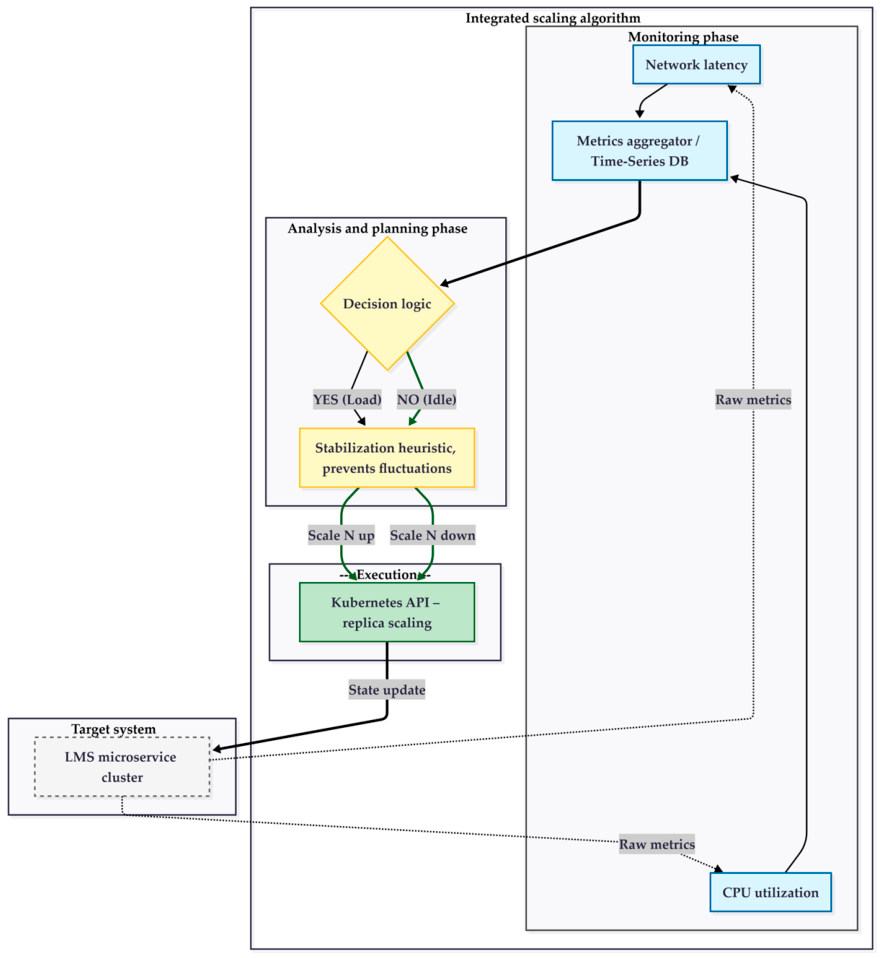
As part of this research, a formal model of an adaptive control mechanism based on feedback coupling has also been defined, which dynamically manages the modeled infrastructure capacities of the LMS under conditions of variable load, as presented in
Figure 4. This control model includes the following phases of monitoring, analysis, planning, and execution [
49], thereby ensuring continuous adjustment of the required number of microservice replicas. Through the loop phases, the operation of the proposed model is described. The monitoring phase collects performance metrics of the simulated microservice cluster, primarily network latency and CPU utilization, which are forwarded to the decision-making logical layer. In the next phase of analysis, the values of measured latencies are compared with the defined threshold values, based on which it is determined whether the system is currently in a stable or overloaded state. If anomalies regarding the degradation of the system’s performance are detected during the check, a horizontal scaling strategy is activated, while if the system is under conditions of reduced load, capacity reduction is initiated, and unnecessary resources are removed. In order to minimize the oscillatory behavior of the system [
50], there are stabilization mechanisms, including cooldown, which represents the period between two scaling decisions, and the limitation of the maximum and minimum number of active replicas. In the simulation, scaling is performed by increasing or decreasing the number of active replicas by one step, while respecting the defined minimum and maximum replica limits and the cooldown period. The decision made in the control mechanism is then forwarded to the execution layer, where the number of active replicas is modified within the simulation model. In a real Kubernetes implementation, this action would correspond to changing the replica count through the Kubernetes API interface, thereby closing the feedback loop over the system.
3.6. Formal Representation of the MAPE-K Model
Let the state of the system at time t be defined by a vector:
where
L(t) denotes the measured latency,
C(t) denotes processor utilization,
M(t) denotes memory utilization,
P(t) denotes the number of active pods in the system.
The monitoring phase can be represented as a function of collecting metrics:
The analysis phase examines whether the desired operating condition of the system has been violated:
where
is a predefined latency threshold. In this model, latency is used as the primary control signal for the proposed scaling mechanism, while CPU utilization is used for comparison with the traditional scaling approach.
The planning phase defines the target number of pods according to the current latency state, cooldown condition, and the minimum and maximum replica limits:
where
indicates the scaling step,
and
represent the minimum and maximum number of active pods, and
represents the minimum time interval between two scaling decisions. In this simulation, the scaling step is defined as one pod.
The execution phase applies a planned action to the system:
The knowledge component K contains historical metric values, decision rules, threshold values, cooldown information, and information about previous scaling actions. Therefore, the complete model can be viewed as
This formalization presents the adaptive scaling mechanism as a closed control loop, in which the decision to act depends on monitoring and analyzing system behavior in real time. In the simulation model, the number of active pods changes only when the latency and cooldown conditions are met, while the number of replicas remains within the defined minimum and maximum limits.
3.7. Adaptive Scaling Engine Pseudocode
Algorithm 1 presents the proposed adaptive scaling logic. It does not execute real Kubernetes API calls; instead, it models the behavior of horizontal scaling by changing the number of active replicas according to latency, cooldown, and replica limit conditions.
| Algorithm 1: Latency-aware adaptive scaling |
1. Input:
2. L_thr //Latency threshold
3. P_min, P_max //Minimum and maximum number of replicas
4. cooldown //Minimum time interval between two scaling decisions
5. Initialize:
6. P = P_min
7. last_scale_time = 0
8. Loop:
9. measure L(t), C(t), M(t)
10. current_time = t
11. if current_time-last_scale_time >= cooldown then
12. if L(t) > L_thr and P < P_max then
13. P = P + 1
14. execute scale_out(P)
15. last_scale_time = current_time
16. else if L(t) < L_thr and P > P_min then
17. P = P − 1
18. execute scale_in(P)
19. last_scale_time = current_time
20. end if
21. end if
22. store metrics and decisions in knowledge base K
23. End Loop |
This algorithm provides an example of the process of adaptive horizontal scaling according to the latency parameter in a feedback control loop [
51]. Initially, the number of replicas equals the minimum value. Then, the system continuously evaluates latency, CPU usage, and memory consumption. If the cooldown interval expires, the current latency value is compared with the predefined threshold. If the latency value exceeds the predefined threshold and the maximum number of replicas has not been reached, the process of scaling out occurs automatically by adding one more replica. Otherwise, if the latency value stays below the predefined threshold and the number of replicas exceeds the predefined minimum, the process of scaling in takes place by reducing the number of replicas by one. In this way, scaling remains bound by the minimum and maximum number of replicas and by the cooldown interval, which helps reduce unnecessary scaling oscillations in the simulated scenario.
The proposed control logic should be interpreted as a threshold-based feedback controller rather than as an optimal or predictive autoscaling algorithm. Its purpose is to examine whether ingress-layer latency can serve as an earlier scaling trigger than CPU utilization under the defined simulation assumptions. The model does not optimize the latency threshold, cooldown period, metric-collection interval, or pod activation delay. These parameters were fixed in the present experiment, and their sensitivity is recognized as an important limitation of the current study. Therefore, the pseudocode should be understood as a simplified decision model for simulation-based evaluation, rather than as a complete production-ready Kubernetes autoscaling implementation.
4. Discussion
The simulation results indicate that, under the defined workload and parameter assumptions, the latency-aware autoscaling signal activated scaling earlier than the CPU-based signal and kept simulated latency closer to the defined threshold.
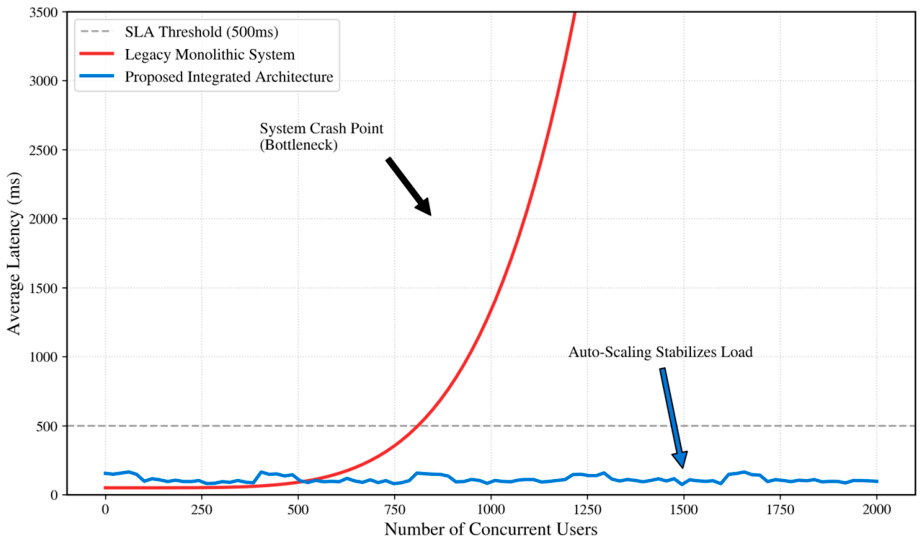
Figure 5 shows the relationship between average latency and the number of concurrent users for the two autoscaling control signals evaluated in the same Python simulation: CPU utilization and ingress-layer latency. Therefore, the comparison should be interpreted as a simulation-based comparison of two autoscaling signals under the same workload and parameter assumptions, rather than as a comparison of two complete architectural models. The figure compares the CPU-based baseline policy and the latency-aware policy under the same simulated increase in user load. The key point shown in the figure is the moment when the traditional model reaches its capacity limit, after which latency increases sharply. In contrast, the proposed model keeps latency closer to the defined threshold under simulated conditions because scaling is activated earlier based on ingress-layer latency.
To avoid ambiguity in the interpretation of the presented figures, it is important to distinguish between conceptual representations, simulated outputs, and inferred indicators.
Figure 1,
Figure 2,
Figure 3 and
Figure 4 are conceptual and methodological representations of the proposed architecture, control loop, and adaptive scaling logic. They do not present measured performance data.
Figure 5 and
Figure 6 are based on outputs generated by the Python simulation under the defined workload and parameter assumptions. The latency values, replica counts, workload growth, and scaling behavior shown in these figures are therefore simulated values rather than direct measurements from a real Kubernetes cluster. The reported time to the first scaling action was inferred from the simulated timeline by identifying the moment at which the scaling condition was satisfied and the first replica adjustment was triggered. No production Kubernetes deployment was used in this study, and, therefore, the figures should not be interpreted as directly measured operational metrics from a real LMS. Instead, they illustrate the expected behavior of the proposed control logic under the selected simulation assumptions.
In the CPU-based baseline policy, latency increases sharply when the simulated workload reaches the modeled capacity limit. In this case, the limit is around 600 simultaneous users. This is also a critical load point in the system, where the response time sharply exceeds values of 2000 ms, directly violating the defined SLA threshold of 500 ms. This behavior can be defined according to the M/M/1 queueing model, where the delay dramatically increases as the system approaches maximum resource utilization [
52]. In contrast, the latency-aware policy shows more stable simulated latency behavior in the simulated scenario, even as the number of users increases. The spike in latency over short intervals of around 60 ms represents early signals of a load surge that activate automatic scaling mechanisms. This principle clearly distinguishes itself from the classical approach, where the system reacts only after the load occurs, while the proposed solution responds as soon as the first signs of performance degradation appear. The main reason for this behavior lies in the fact that the proposed model uses network latency as an early indicator of overload, thereby enabling the activation of scaling mechanisms before the overload occurs. This mechanism is modeled based on the measured latency at layer 7, specifically, latency-based telemetry, which serves as a trigger compared to traditional approaches where CPU and memory metrics are used in state analysis. While resource-based metrics often respond with a delay, the proposed model uses the latency signal as an early indicator, reducing the reaction time of the control mechanism in the simulated scenario.
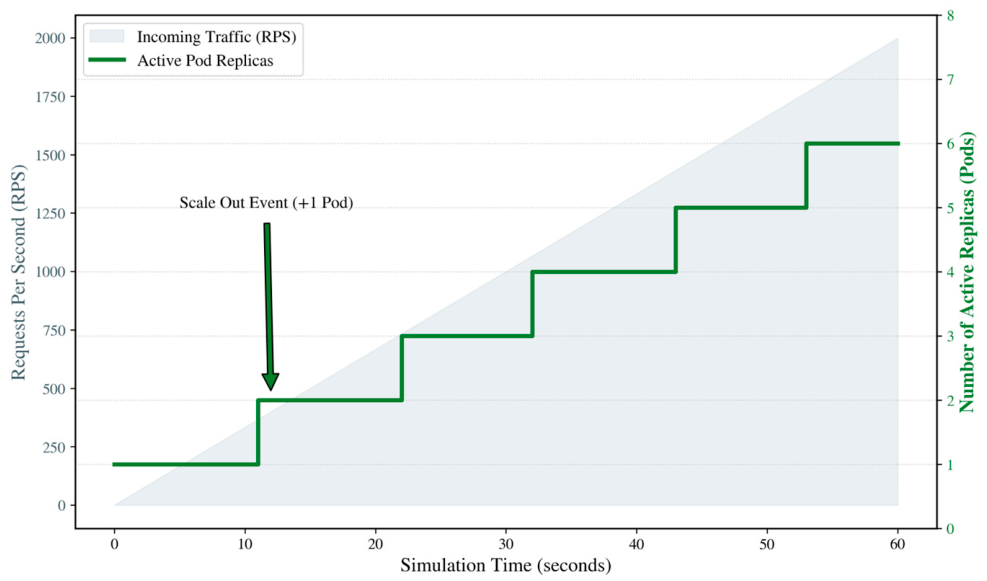
The dynamics of this process are shown in
Figure 6, which provides a detailed insight into the behavior of the control mechanism in real time during traffic growth. Traffic was simulated up to 2000 requests per second over a time interval of 60 s, while the number of active replicas was shown as a power function, with a new replica added every 350 requests per second. The figure also illustrates when the latency-aware mechanism reacts to threshold violation and how the number of replicas changes after the scaling conditions are met.
The simulation results suggest that the latency-aware model reacts earlier to the increase in load. In the displayed graph, the first scaling reaction is visible after approximately 12–15 s, when the simulated ingress-layer latency exceeds the defined threshold. This value represents the time to the first scaling action in the simulation. It should not be interpreted as end-user application response time or as the complete recovery time of the system. Complete recovery would require additional measurement of the time needed for latency to return below the defined threshold after new replicas become available. Additional replicas are then added within the interval of approximately 20–30 s, following the modeled traffic growth and the defined cooldown condition. The number of replicas is consistent despite the traffic being at a manageable average, illustrating the importance of the stabilization technique in preventing unnecessary scaling fluctuations. Within the simulation, the number of replicas in use does not surpass the predetermined upper limit. This approach allows the model to avoid excessive scaling within the selected simulation configuration, compared with the CPU-based baseline.
In a broader sense, viewed from the perspective of distributed systems, the obtained results are consistent with the general assumption that cloud-native architectures benefit from horizontal load distribution [
53]. When new replicas are added, the concentration of requests on individual instances is reduced, which can reduce bottleneck effects and support more stable system behavior. In the context of this simulation, autoscaling should therefore be interpreted as a mechanism for adjusting modeled replica capacity in response to the selected control signal, rather than as direct evidence of improved user experience or production-level service stability. The obtained results are consistent with existing research that also points to the limitations of the classic Horizontal Pod Autoscaler when it relies solely on CPU and memory metrics [
54]. This research further suggests that network latency collected at the ingress point can support earlier scaling decisions in the simulated LMS workload scenario [
55]. The proposed model may also be applicable in larger distributed environments, but this would require additional validation. As the number of nodes, replicas, and services increases, the volume of telemetry data may also rise, which can complicate decision-making in a short time frame.
However, the proposed model in this research is not without limitations, as its efficiency and use depend to a considerable extent on the proper configuration of parameters, such as latency thresholds, intervals for collecting network traffic metrics, and cooldown periods. In larger and more demanding distributed computing systems, another challenge may be the increased amount of telemetry data, variations in network latency, and delays in launching new replicas, which can lead to temporary performance degradation due to the delayed availability of additional replicas. In such situations, it is necessary to anticipate the expansion of the model, including hierarchical aggregation of metrics, per-service scaling, and forecasting mechanisms [
56]. Despite these limitations, the simulation results indicate that the proposed model can contribute to autoscaling by shifting the response from a purely resource-based approach to a performance-oriented management approach based on early latency signals. This simulated capability for earlier recognition of potential degradation and earlier scaling activation represents a key contribution of the proposed model within the scope of the present study.
Another limitation is that the research lacks sensitivity analysis regarding the latency threshold, cooldown duration, collection frequency, and simulated pod activation delay. The chosen values of these parameters could have a significant effect on autoscaling behavior, especially when applied to systems with varying workload intensity. Thus, the presented outcomes should be interpreted as evidence for the selected configuration only and cannot be used to prove the optimality of the suggested values in other LMS/Kubernetes systems.
Conceptually, lower latency thresholds would probably activate scaling earlier, which could reduce latency peaks but also increase the risk of unnecessary scaling and higher resource consumption. Higher latency thresholds would reduce the number of scaling actions, but they could also delay responses and allow more visible service degradation before additional replicas are activated. Similarly, shorter metric collection intervals could improve detection speed but may also make the system more sensitive to short-term fluctuations and telemetry noise. Longer collection intervals would provide smoother measurements but could delay the first scaling action. The cooldown period has a similar stabilizing role: shorter cooldown values may improve responsiveness, while longer cooldown values may reduce oscillations but slow down adaptation during sudden load spikes. Finally, longer simulated pod activation delays would likely increase the time between the scaling decision and the actual availability of additional processing capacity. Therefore, systematic sensitivity analysis across these parameters remains an important direction for future work.
5. Conclusions
This paper presents a simulation-based approach to automatic scaling of an LMS based on a microservice architecture. The research focused on examining the limitations of traditional scaling mechanisms that rely solely on CPU utilization, which may be an inadequate indicator during sudden traffic spikes typical of LMS usage during knowledge assessments. The proposed model conceptually integrates Kubernetes HPA, Prometheus Adapter, and NGINX Ingress Controller, using network latency as the primary signal to trigger the automatic scaling mechanism. This principle enables the transition from a reactive resource management model to one that responds earlier to workload changes. The simulation results indicate that the proposed model activated the scaling mechanism earlier in the selected simulation configuration by reducing the time to the first scaling action from approximately 90 s in the CPU-based baseline to approximately 12–15 s in the latency-aware model. This improvement refers to earlier autoscaling activation in the simulation and should not be interpreted as a measured reduction in end-user response time or full system recovery time. Under the defined simulation assumptions, this approach indicates earlier autoscaling activation during sudden load spikes. The study did not directly measure service availability, end-user experience, error rate, throughput, or full recovery time. These aspects remain targets for future real-cluster validation. Within the selected simulation configuration, the latency-aware policy maintained simulated latency closer to the defined threshold than the CPU-based baseline. The practical relevance of this work lies in its potential direction for future implementation in real cloud-native LMS environments, where availability, stability, throughput, error rate, and user experience would need empirical evaluation. The application of a network-based latency mechanism should therefore be interpreted as a simulated indication of earlier scaling activation, while its effect on user experience requires empirical validation in a real LMS deployment. However, claims about error reduction, throughput improvement, and full-service stability require additional validation in a real Kubernetes cluster. In addition to the advantages it offers, the proposed model also has certain limitations. The research was conducted in a controlled simulation environment, which may limit the variability observed in real-world conditions. Accordingly, the findings should be interpreted within the boundaries of the simulation assumptions and not as conclusive proof of performance in an actual Kubernetes cluster. The outcomes of this study should therefore be understood as simulation-based observations. They illustrate how the proposed latency-aware control logic behaves under a defined set of assumptions related to LMS workload, latency threshold, metric collection interval, cooldown period, replica limits, and simulated pod activation delay. These observations do not constitute direct evidence of performance improvement in a real Kubernetes deployment. Instead, the main contribution of the study is the definition of a simplified threshold-based feedback controller and its use in a controlled Python simulation to compare CPU-based and ingress-latency-based scaling triggers under identical LMS burst-load assumptions. The effectiveness of the model depends largely on proper parameter and infrastructure configuration, such as latency thresholds, metrics collection intervals, and cooldown periods. In more complex environments, additional challenges may include variations in network latency, delays in launching new instances, and an increased volume of collected data, all of which can directly affect the stability of the control mechanism. As a guideline and suggestion for future research, it is recommended to further validate the proposed model in a real Kubernetes cluster using load-generation tools such as Locust, JMeter, or k6. Future development may also include the integration of predictive mechanisms based on artificial intelligence, as well as the enhancement of the introduction of hierarchical and distributed control loops to improve system performance. In addition, future research may also focus on expanding the proposed model to edge or hybrid cloud environments, where latency has an even more pronounced impact on system operation.