4.2. Baseline Models
To evaluate X-GATE within the constraints of resource-limited Industrial IoT environments, we established a representative seven-model benchmark matrix. This matrix contrasts X-GATE against strong classical tabular baselines, standard deep learning architectures, the full-precision Teacher model, and recent lightweight and Transformer-hybrid configurations.
All baselines use the same cleaned Edge-IIoTset feature schema and the same stratified train/validation/test partitions described in
Section 4.1. The training fold is the only fold exposed to the hybrid SMOTE/undersampling procedure; validation and test folds remain unresampled for all models. This benchmark is intended to compare representative model families under a shared preprocessing protocol, not to claim exhaustive coverage of every published Edge-IIoTset result or a state-of-the-art leaderboard. We did not perform equal-budget, architecture-specific exhaustive tuning for every baseline; the baseline results should therefore be read as representative implementations under a common pipeline rather than as best-case reproductions of each model family.
To avoid overstating the comparison,
Table 2 summarizes the model-selection budget used in this study. The goal was a common-pipeline comparison across representative model families, not an exhaustive architecture-specific leaderboard search. Consequently, the Random Forest and LightGBM results should be interpreted as fixed-configuration tabular references, while the neural baselines and X-GATE share the same training fold, preprocessing, optimizer family, and validation protocol.
4.3. Experimental Results: Classification
Performance
All deep learning models, including the baselines and X-GATE, were trained using an NVIDIA RTX 3090 GPU and the AdamW optimizer [
38] with a CosineAnnealing learning rate scheduler initialized at
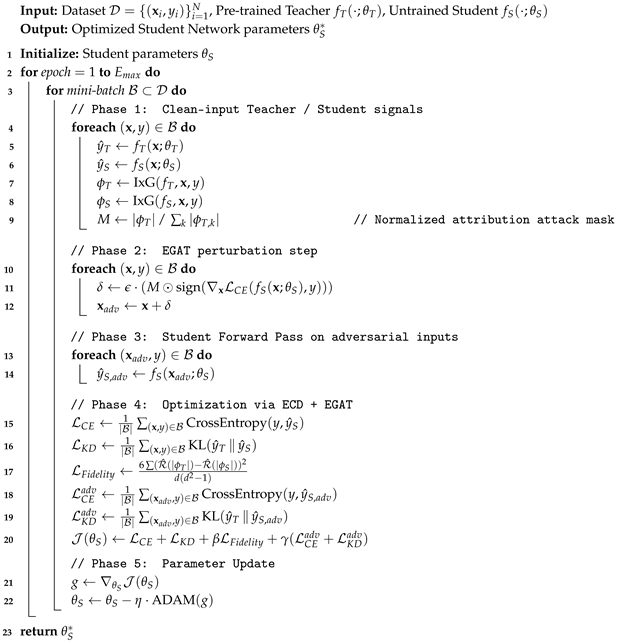
. The X-GATE training objective (Equation (3)) was configured with the following hyperparameters: clean-input CE and KD weights fixed at 1.0, with
and
; perturbation bound
; and NeuralSort temperature
. The penalty coefficients
and
were selected from a small validation grid rather than an exhaustive hyperparameter search; they should therefore be interpreted as reasonable operating-point choices, not globally optimal values. The attack magnitude
was chosen to align with established adversarial perturbation limits for tabular network traffic benchmarks. The Standard KD baseline used for the Logical Drift and ablation analyses was trained under an identical protocol—same TinySecurityBERT architecture, same AdamW optimizer, CosineAnnealing learning rate schedule, and gradient clipping (max-norm = 1.0)—differing only in the loss function, i.e.,
with temperature
, omitting both the ECD fidelity penalty and the EGAT adversarial protocol.
This paper reports related but non-identical evaluation views, and each view should be read as answering a different primary question rather than as one combined leaderboard.
Table 3 summarizes the mapping between these evaluation views, their scope, and their primary artifacts.
Table 4 presents the primary evidence for full-benchmark clean classification.
Table 5 presents the primary evidence for the deployment-oriented compactness, quantization, and CPU latency claim.
Table 6 and
Table 7 present the primary evidence for component attribution and adversarial ablation.
Table 8 presents the primary evidence for protocol-bounded adversarial behavior under the white-box explanation-evasion stress test; its clean-F1-Macro column is a reference column with explicitly mixed provenance, as noted below the table. The absolute F1-Macro values from the deployment-subset rerun should therefore not be directly interchanged with the full-benchmark F1 values in
Table 4; they answer a narrower deployment stress question.
The adversarial results reported below should be read as a controlled white-box stress test rather than as a complete production attack evaluation. The attacker is assumed to know the Student model and to perturb normalized tabular features within the fixed
budget
, using the explanation-evasion protocol to concentrate changes on high-attribution features. We do not evaluate adaptive gray-box or black-box attackers, multi-step optimization beyond the reported single-step masked-FGSM setting, poisoning, replay, protocol-aware packet constraints, or concept drift; these boundaries are revisited in
Section 6.
As presented in
Table 4, we prioritize the F1-Macro score as the primary diagnostic metric. Given the multi-class structure and extreme imbalance of Edge-IIoTset (15 classes, with Normal traffic far outnumbering rare attacks such as MITM), accuracy alone can be misleading. F1-Macro gives each class equal weight in the aggregate score, reducing the tendency of dominant classes to obscure failures on underrepresented attacks. For transparency, the reported deep learning results summarize repeated runs with different random seeds (three seeds for the principal X-GATE ablation and deployment-subset reruns; epoch counts range from 8 to 20 depending on the model and experiment). These values are descriptive means and standard deviations rather than formal hypothesis-test estimates.
The Random Forest classical reference point achieved an F1-Macro score of 97.02 ± 0.06%. This provides a strong empirical reference point and makes clear that X-GATE should not be interpreted as the clean-F1 optimum on tabular Edge-IIoTset features. Among the deep learning models, the full-precision Vanilla SecurityBERT (Teacher) reached an F1-Macro score of 89.85 ± 3.32% under the proposed feature-wise tokenization scheme.
As shown in
Table 4, the 8-bit quantized X-GATE TinyStudent maintains stable full-benchmark performance across initializations (89.30 ± 3.89% on average). The average
between the 32-bit Teacher and the 8-bit Student is therefore approximately 0.55 percentage points in the full benchmark setting, which is consistent with the intended compact-Student operating point. Isolating the specific contribution of ECD requires the component ablation reported in
Section 4.6. The separate deployment-subset rerun reported later uses a deployment-subset validation protocol and therefore yields lower absolute F1 values; we report it separately to avoid conflating full-dataset classification accuracy with deployment stress testing. Under standard top-down quantization, truncating float32 weights can distort the nonlinear boundaries that support minority-class discrimination. By explicitly encouraging attribution-rank agreement through the soft-rank penalty, the Student remains closer to the Teacher under the IxG attribution proxy than a purely logit-matching baseline.
The tested temporal baselines produced lower F1-Macro values under this implementation and preprocessing pipeline. The CNN1D-BiLSTM [
17] architecture reached an F1-Macro of 78.84 ± 0.15%. This may reflect a weaker match between the implemented architecture and the tabular Edge-IIoTset feature geometry, the fixed tuning budget, or both; it should not be read as a general limit of temporal IDS models. The Vision–Transformer hybrid, MBConv-ViT [
16], provided a stronger middle ground (85.42 ± 2.14%) but still trailed X-GATE by approximately 3.9 percentage points. This pattern is consistent with a narrower claim: within this benchmark and model set, attribution-aware distillation is a competitive neural design for structured IIoT anomaly detection under edge constraints. Under the same shared preprocessing and training recipe, LightGBM, despite being a competitive gradient boosting framework, reached 20.25 ± 6.00% F1-Macro on this specific multi-class distribution. We do not treat this value as LightGBM’s tuned upper bound on Edge-IIoTset; rather, it is reported as a representative outcome under the common pipeline used for this comparison.
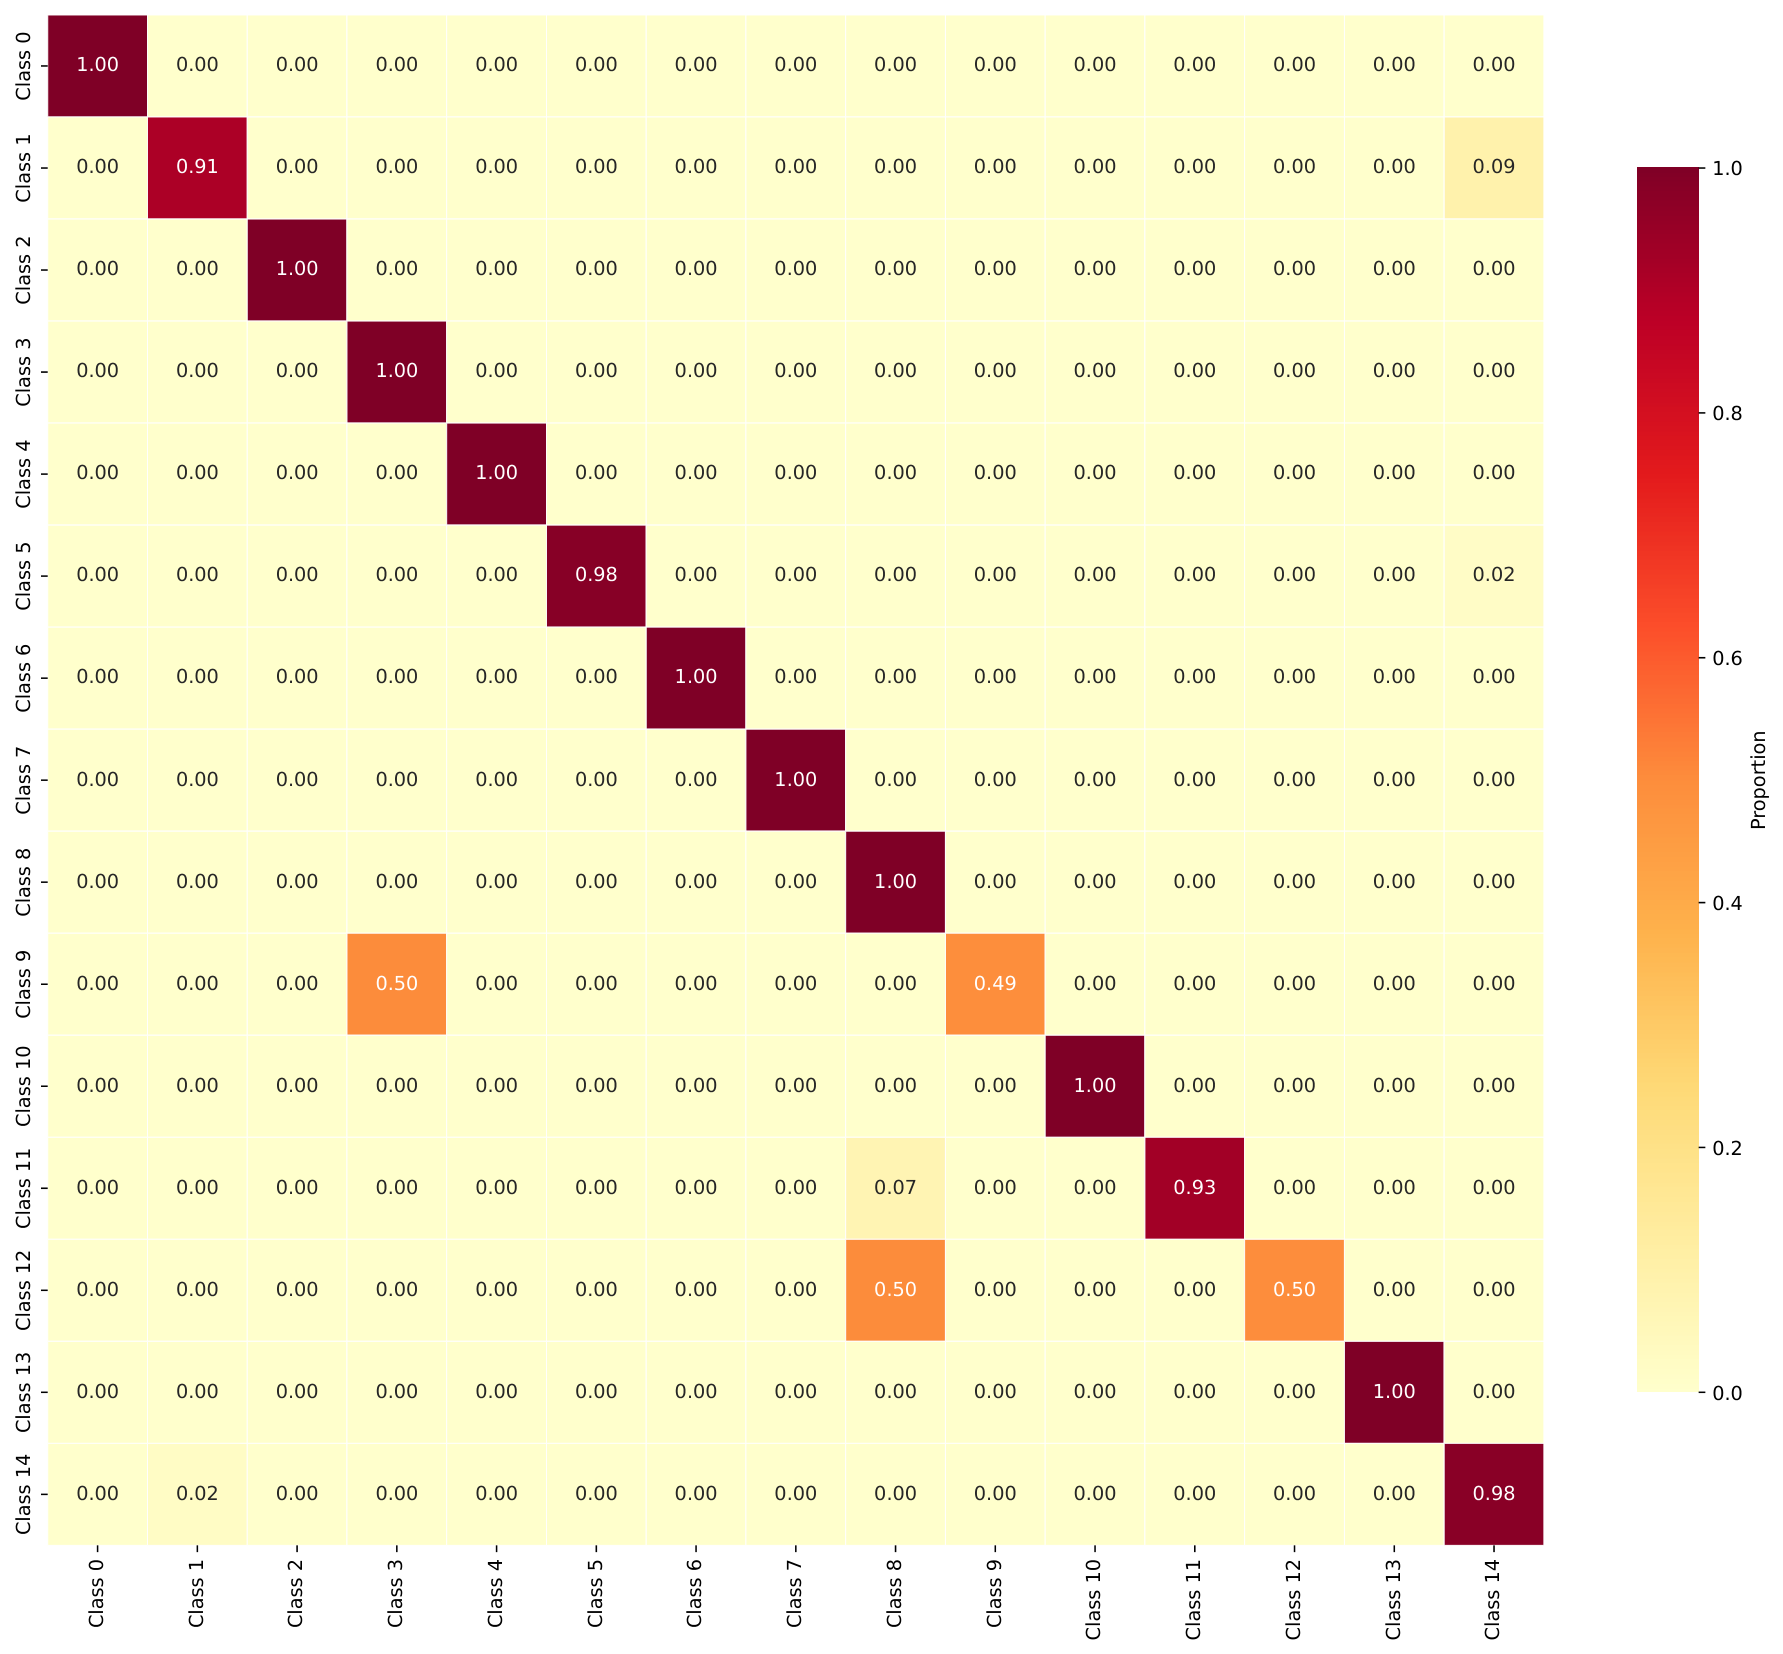
To examine class-level error structure,
Figure 2 presents the confusion matrix for X-GATE TinyStudent. Rather than repeating matrices for every baseline, we focus on X-GATE to highlight where errors remain concentrated. The matrix indicates strong separation for distinct volumetric flows (e.g., DDoS_UDP and DDoS_ICMP). The remaining misclassifications occur mainly within closely related attack families—such as SQL injection variants and Cross-Site Scripting (XSS)—where the continuous payload indicators overlap statistically.
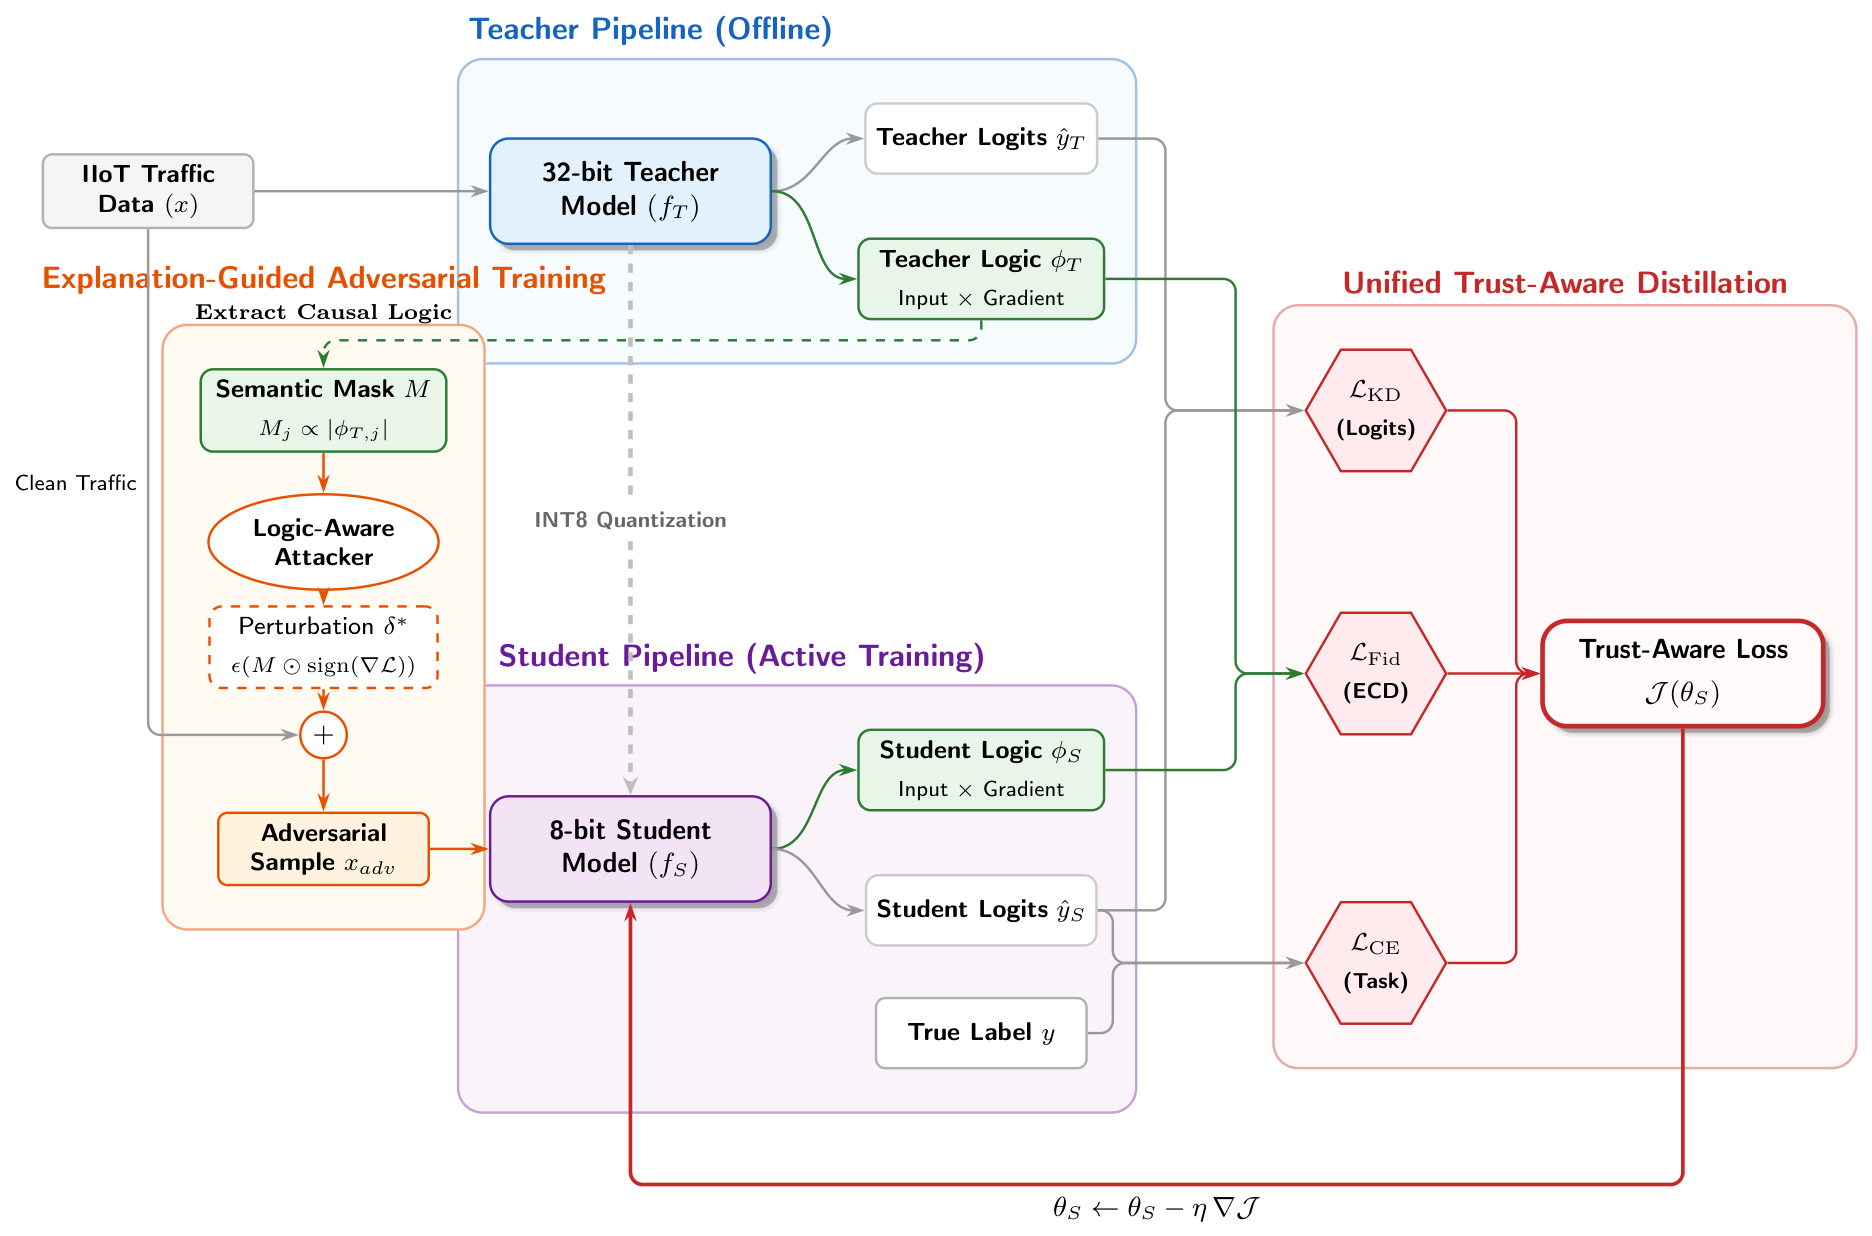
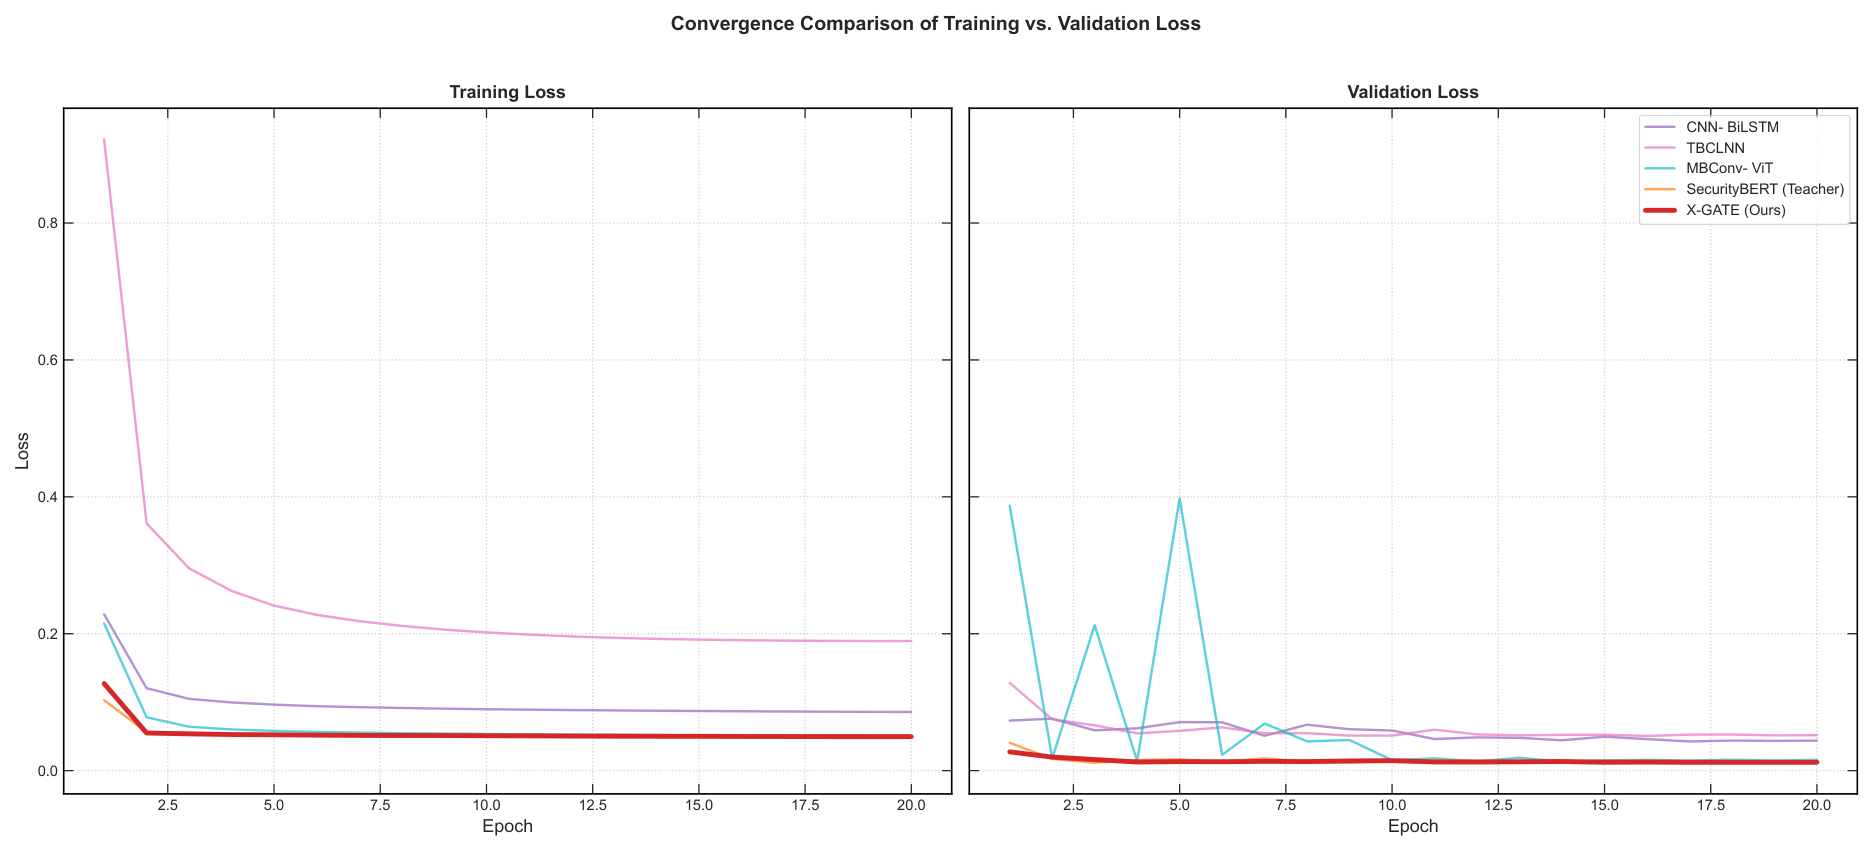
Beyond raw classification accuracy, deployment also depends on training stability and diagnostic consistency. EGAT shapes perturbations toward Teacher-salient features. As shown in
Figure 3, the highlighted X-GATE training and validation loss curves decline smoothly without erratic spikes. This behavior is consistent with stable optimization under the selected objective.
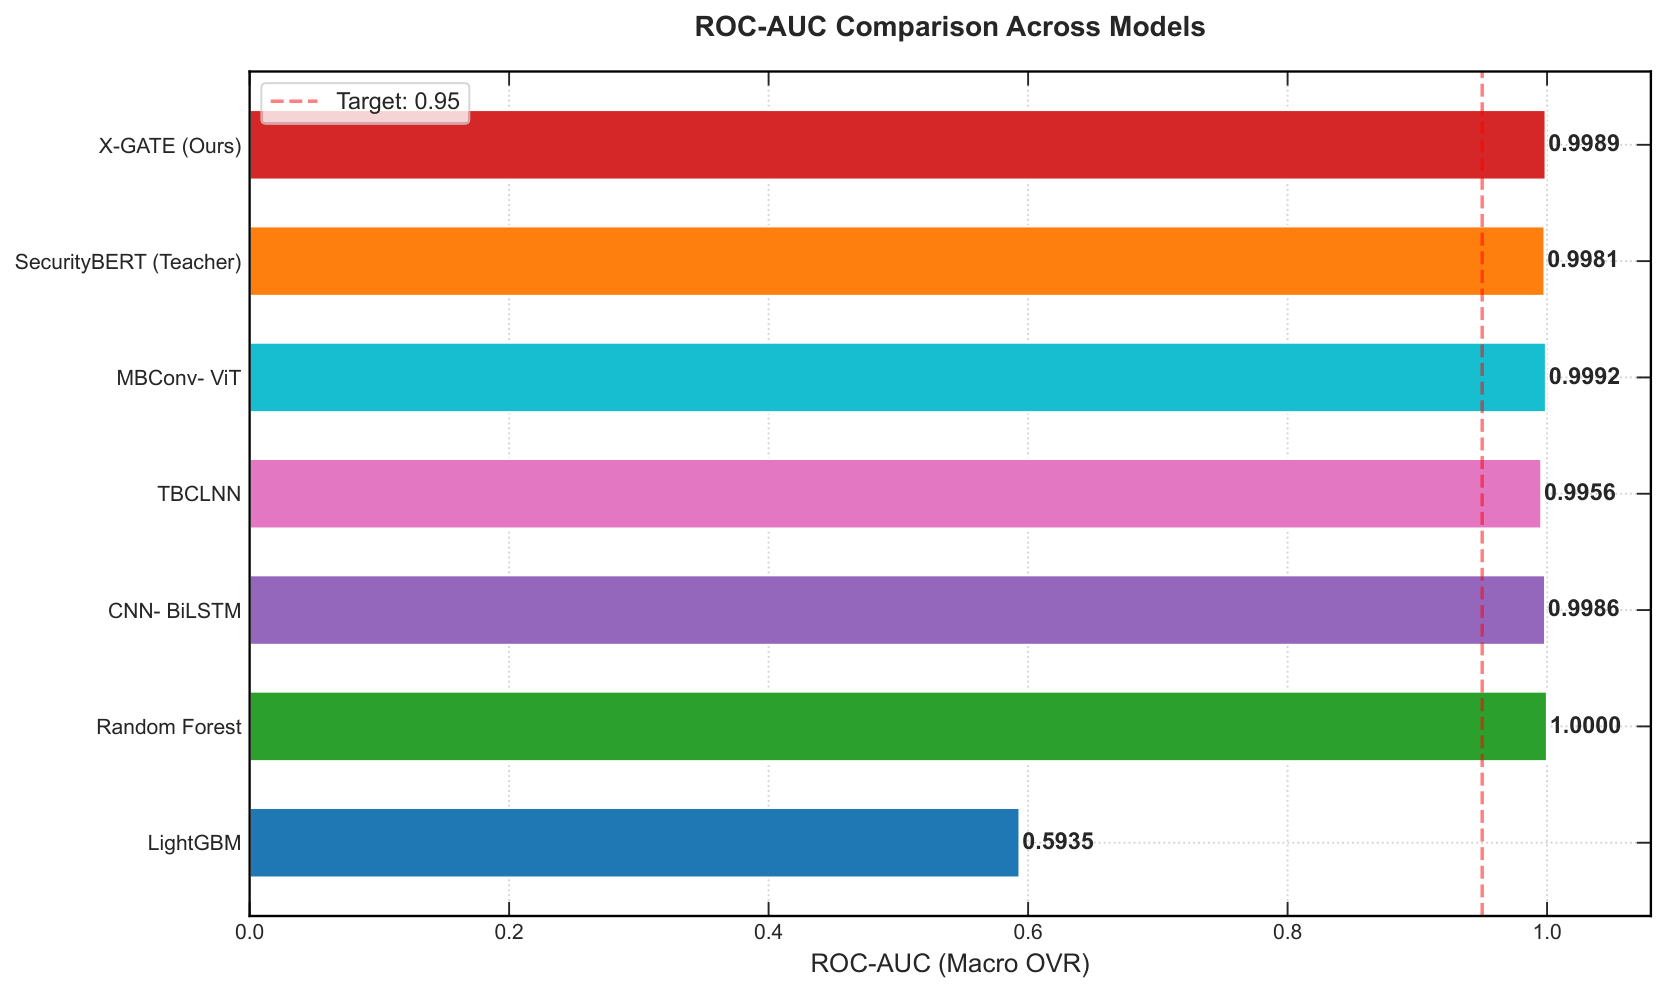
This stability is accompanied by useful class-separation behavior in this benchmark, as reflected by the macro ROC-AUC comparison in
Figure 4. X-GATE remains close to the better-performing neural baselines and above the lower-performing traditional reference, suggesting a favorable class-separation profile among the evaluated neural and traditional implementations. To place this behavior in context,
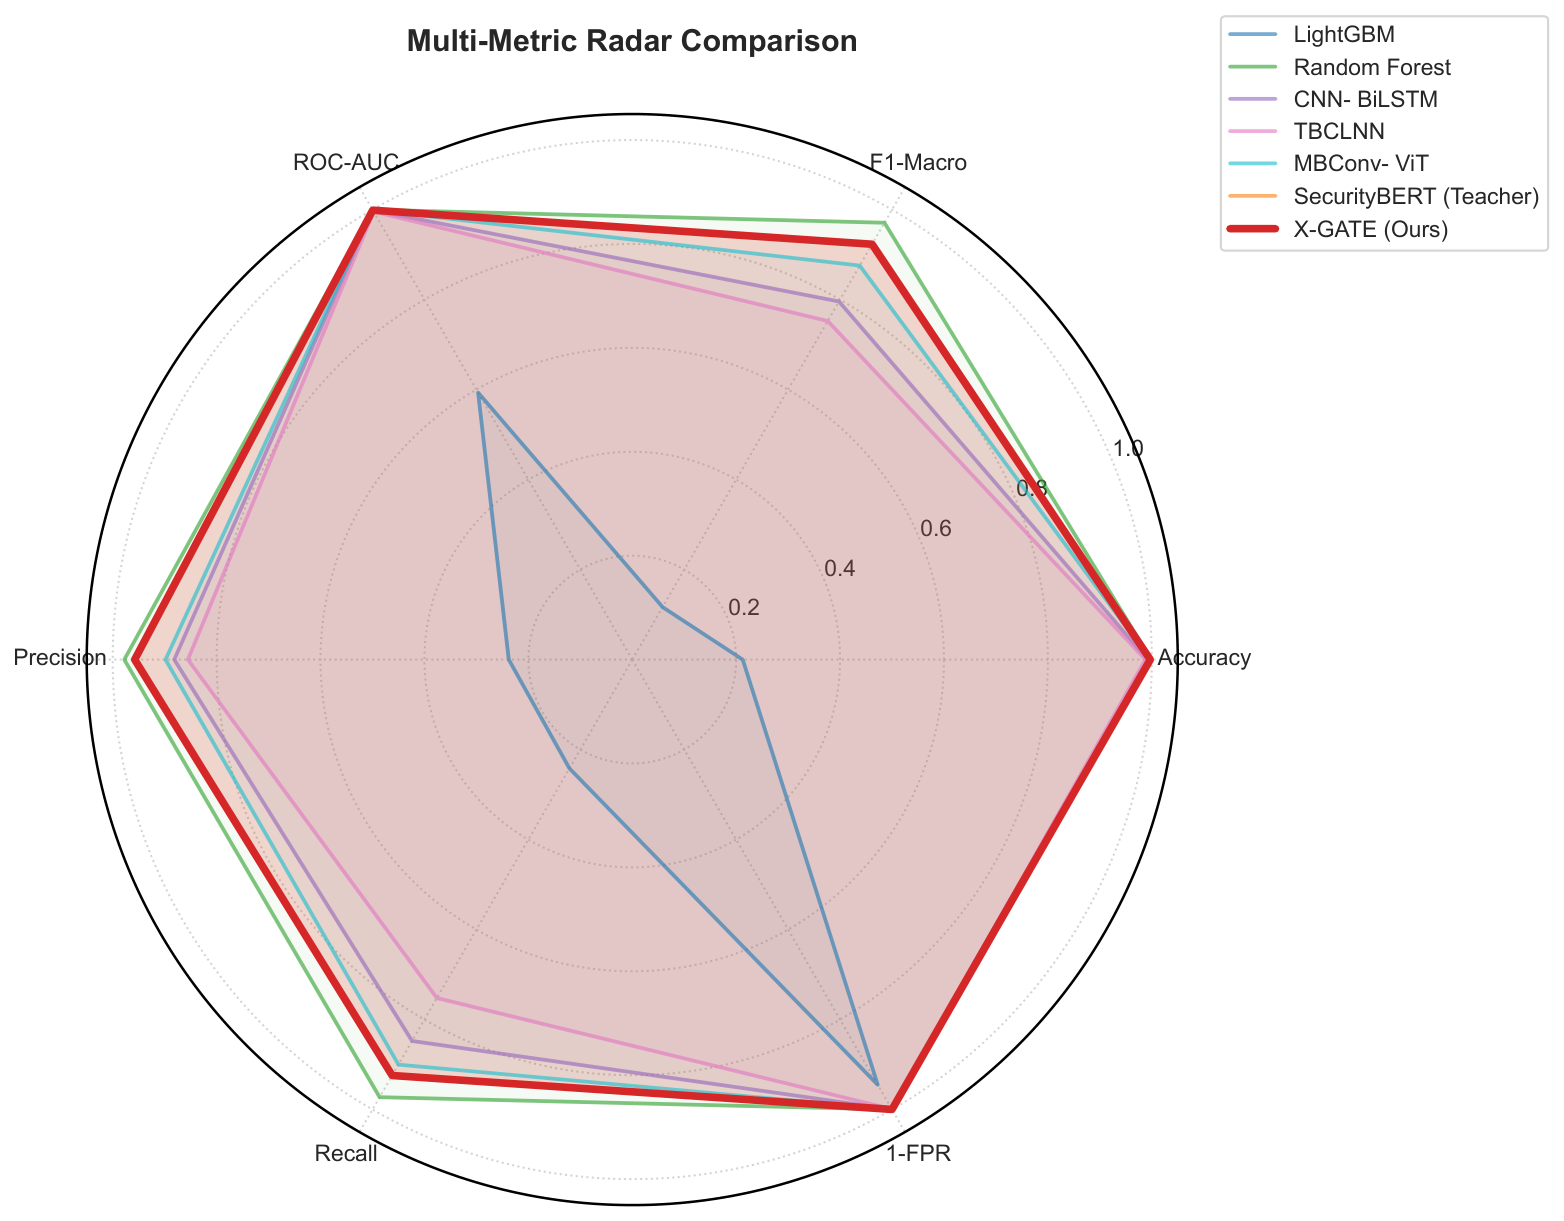
Figure 5 compares X-GATE with traditional, Teacher, and lightweight neural baselines as a qualitative cross-regime summary. Whereas some lighter sequential architectures (e.g., CNN1D-BiLSTM [
17] and TBCLNN) trade recall for precision, or vice versa, X-GATE maintains a comparatively balanced profile across precision, recall, and the robustness-oriented 1-FPR axis, without implying that all axes come from one identical evaluation regime.
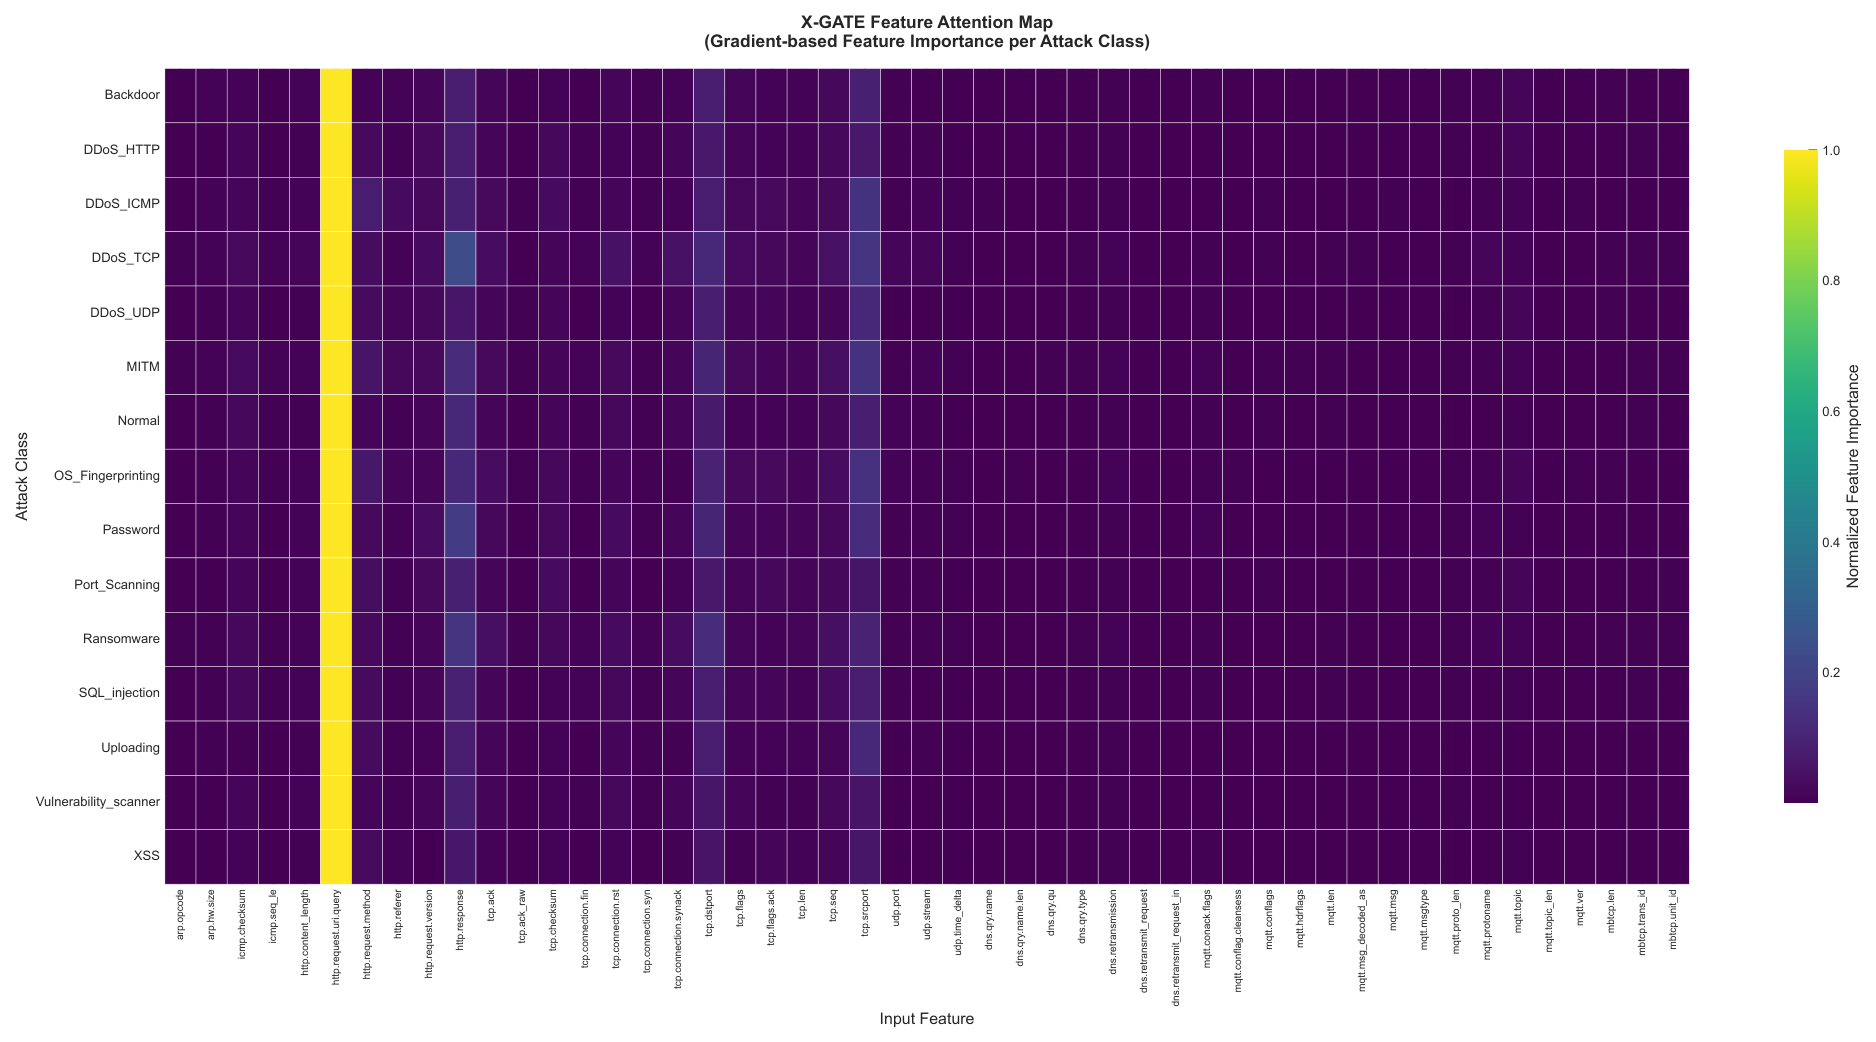
Figure 6 provides a qualitative view of explanation preservation. The feature-importance heatmap extracted from TinyStudent indicates that X-GATE distributes attribution across several secondary and tertiary payload features rather than overemphasizing a single manipulable indicator (e.g.,
TCP_Window_Size). The ECD penalty encourages the model to evaluate a broader packet context. This distributed attribution pattern may help explain the observed lower sensitivity to isolated feature manipulation under the evaluated threat model, but it should be treated as a qualitative attribution-based interpretation rather than a standalone causal proof.
4.4. Efficiency vs. Accuracy
Trade-Off
While precision is important, the deployment objective of this study is to evaluate lighter operation on resource-constrained edge-class CPU settings. We therefore report empirical efficiency proxies using total parameter count (Millions) and CPU-side single-sample inference latency (ms per sample), rather than claiming hardware-specific microcontroller deployment. All measurements were conducted on a machine equipped with an AMD Ryzen 7 5800X CPU, 128 GB of RAM, and an NVIDIA RTX 3090 24GB GPU, using a batch size of 128, with the PyTorch dynamic INT8 quantization backend as the inference framework. The reported latency values were taken from the same CPU-side single-sample measurement harness used across Teacher and Student checkpoints, so the comparison reflects consistent deployment-side timing rather than ad hoc runtime sampling.
As detailed in
Table 5, the deployment-subset rerun separates the edge Student models from the Teacher reference under the same CPU-side single-sample measurement harness. Vanilla SecurityBERT requires 4.799M parameters and 4.16 ms/sample, while the TinyStudent family requires only 0.617M parameters, corresponding to an 87.1% parameter reduction. Full X-GATE further records low CPU-side latency (1.25 ms/sample), a 3.3 × CPU speedup relative to the Teacher and a modest improvement over the KD-only Student (1.29 ms/sample).
Regarding parameter sensitivity, the local checks run around the deployment-subset operating point indicate that the chosen values for
,
, and
do not trigger abrupt collapse; nearby settings change performance smoothly rather than sharply. This is a reproducibility note, not a claim of exhaustive hyperparameter optimality. The efficiency comparison should therefore be interpreted as a deployment-subset validation rather than as a replacement for the full-benchmark classification results in
Table 4. Under this validation protocol, Full X-GATE achieves 78.83 ± 5.83% float F1-Macro and 79.11 ± 5.47% INT8 F1-Macro, slightly above the KD-only Student while preserving the same compact parameter budget. The INT8 deployment evaluation used a quantization-compatible Transformer loading path to keep the saved-checkpoint rerun consistent across Teacher and Student models.
The Teacher in this rerun is used as the full-precision attribution reference for compression, not as a claim that the Teacher is always the strongest predictor on every deployment subset. ECD therefore evaluates whether a compact Student can preserve part of the Teacher’s attribution hierarchy while improving the deployment-oriented latency and compactness profile measured in this rerun.
4.5. Empirical Measurement of Logical Drift
()
To test the attribution-alignment rationale introduced in
Section 3, we quantified the internal attribution topology of the models natively via PyTorch IxG attributions. We define Logical Drift (
) using the Spearman rank correlation coefficient (
) computed across the
absolute feature attributions of the full-precision Teacher and the quantized Student models, using the Teacher-predicted class as the common attribution target on each validation sample. Logical Drift should be interpreted as an attribution-rank divergence metric, not as a direct causal measure of model reasoning. The comparative baseline for this metric is explicitly the standard KD Student (a model distilled using only output logits without our proposed explainability constraints).
As shown in
Table 6, the standard KD baseline obtains
, indicating that logit matching alone does not fully preserve the Teacher’s attribution ranking. This pattern is consistent with a shortcut learning interpretation, but it does not prove that the Student has learned spurious feature-dependence rules. The narrower claim is that a compressed model can match labels while relying on attribution rankings that differ materially from the Teacher’s.
The isolation of the ECD component ( = 0.5, = 0) in the ablation study clarifies its intended mechanism: by encouraging the Student’s attribution hierarchy to match the Teacher’s, ECD alone reduces Logical Drift from to —a 17.24% reduction—while also showing a higher mean F1-Macro than the KD-only baseline (91.17% vs. 89.98%). This is consistent with the view that attribution-constrained distillation can transfer behavioral knowledge (logits) together with part of the Teacher’s attribution structure. The EGAT component ( = 0, = 0.3) instead primarily raises adversarial F1 under the evaluated explanation-evasion protocol, with Logical Drift remaining close to the KD-only baseline (). This separation supports the interpretation that ECD is the component most closely associated with attribution-rank preservation, whereas EGAT mainly changes the adversarial failure mode.
The Full X-GATE configuration ( = 0.5, = 0.3) exhibits an intermediate Drift value (): it does not match the ECD-only model’s lowest Drift, but it remains lower than KD-only while adding the adversarial-F1 gain associated with EGAT. This may reflect the multi-objective optimization tension inherent in simultaneously minimizing three loss terms—the Student must balance classification accuracy, attribution fidelity, and adversarial robustness, occasionally trading the ECD-only optimum for stronger observed adversarial performance under the evaluated protocol. In return, Full X-GATE obtains the highest mean adversarial F1 among the tested configurations (Adv-F1 = 86.09%) while maintaining competitive F1-Macro (89.30%).
4.6. Ablation Study: Quantifying Individual Component
Contributions
To examine the contribution of each algorithmic component of X-GATE, we conducted a systematic four-configuration component ablation study. The ablation isolates the effects of: (1) Standard KD—standard KD without ECD or EGAT (); (2) Standard KD + ECD—KD augmented with ECD (); (3) Standard KD + EGAT—KD augmented with EGAT (); and (4) Full X-GATE—the complete framework with both components active (). All configurations utilized the identical TinySecurityBERT Student architecture, identical AdamW optimizer with identical learning rate () and gradient clipping (max-norm = 1.0) and were trained for 20 epochs across three independent random seed initializations (seeds: 42, 7, 13). The results are reported as means ± standard deviations.
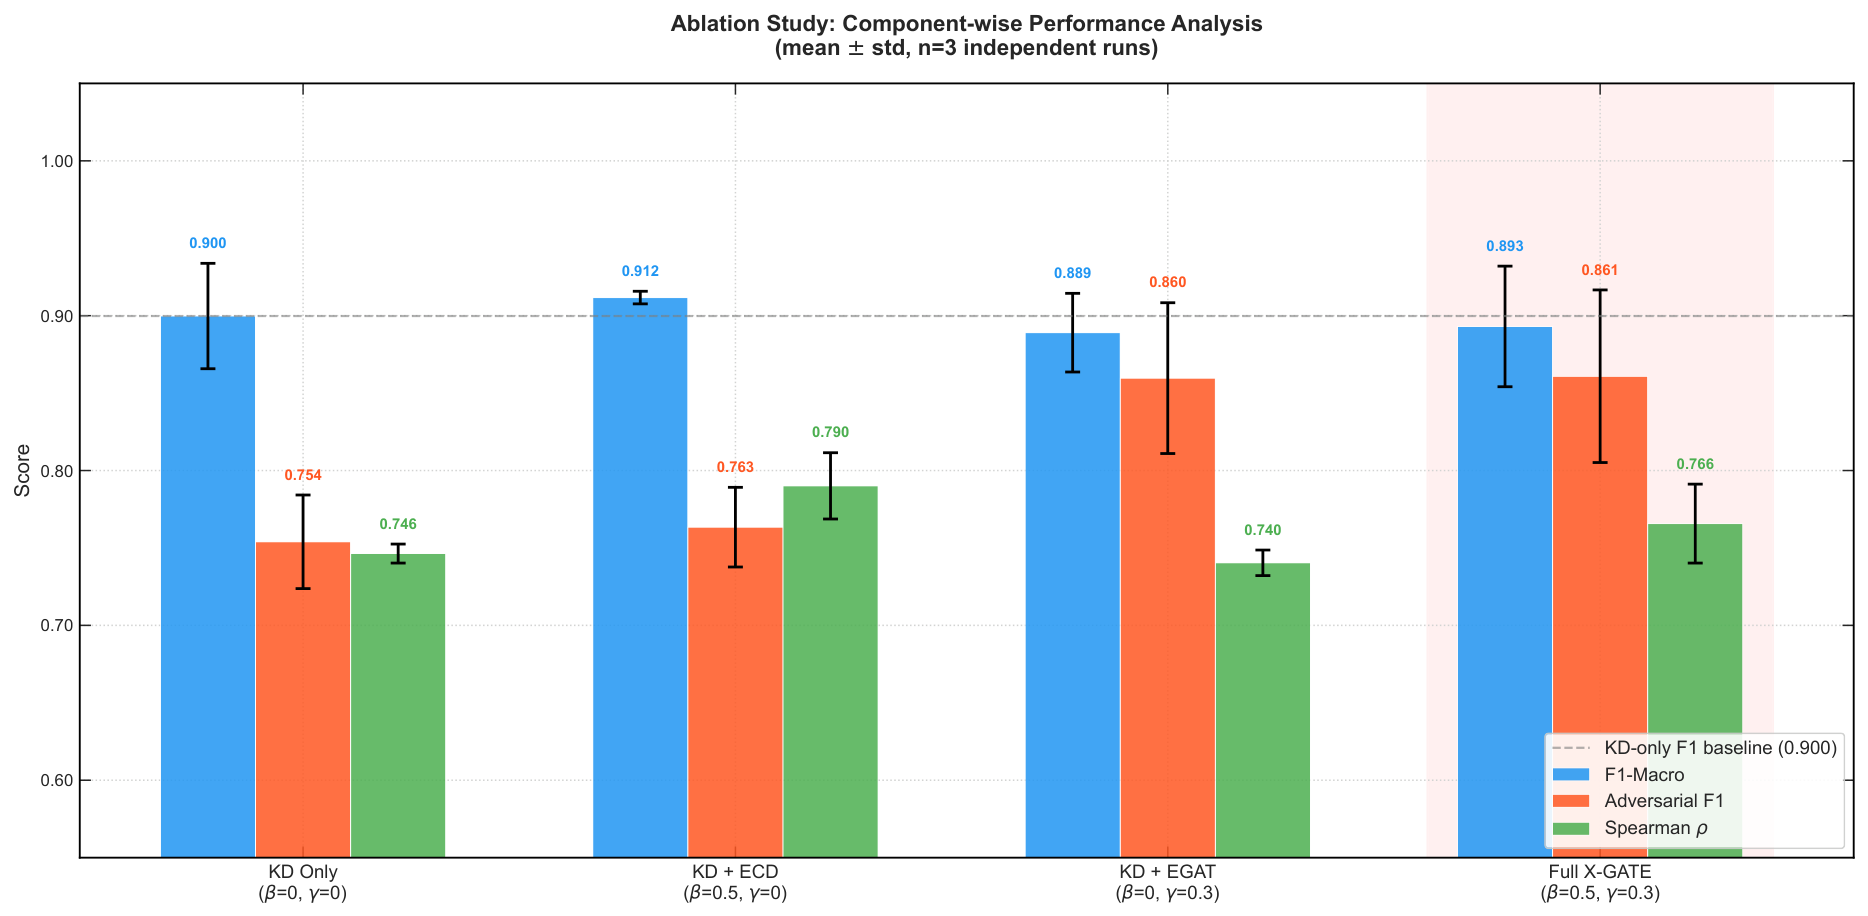
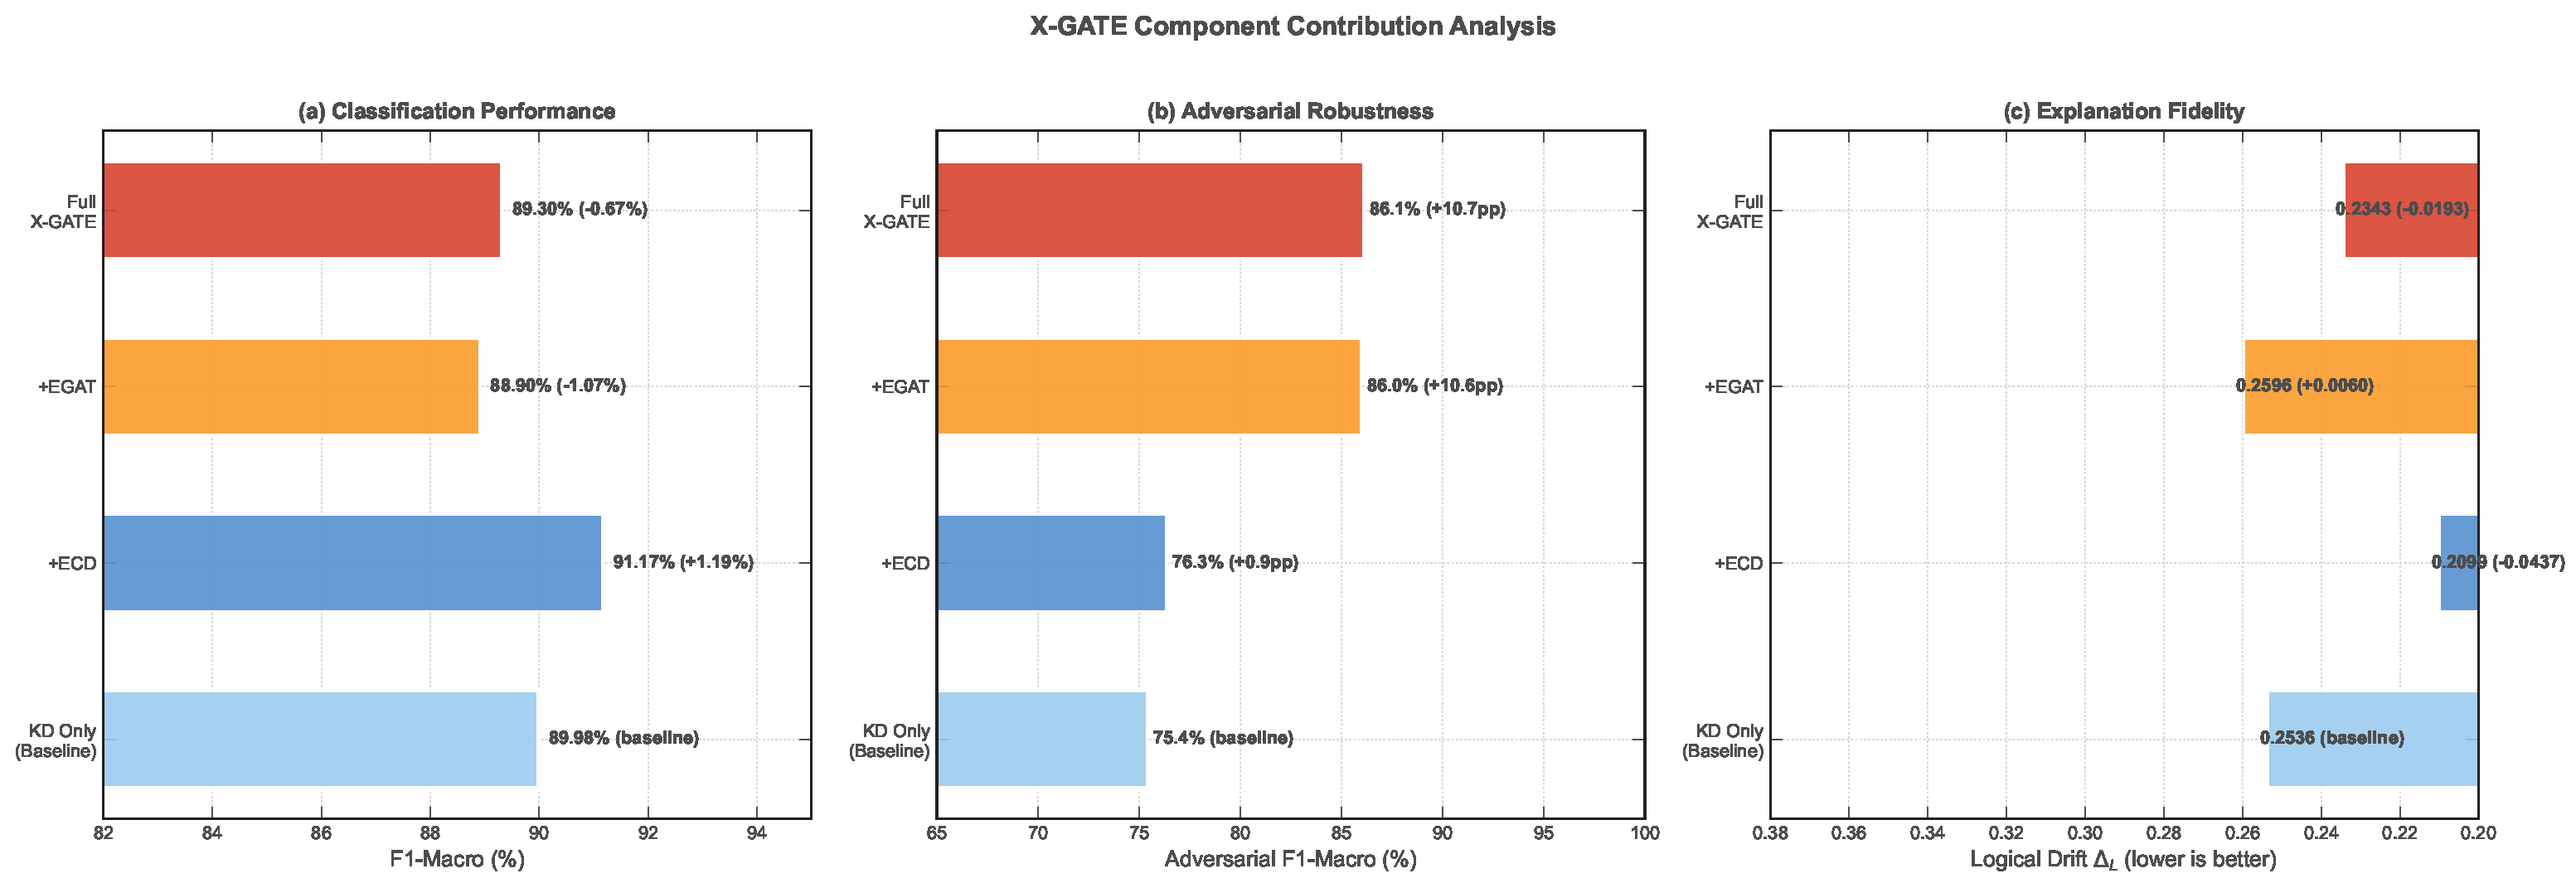
The ablation results presented in
Table 7 and visualized in
Figure 7 and
Figure 8 clarify the role of each X-GATE component.
Finding 1: ECD Is Associated with Higher Mean Accuracy and Lower Logical Drift in the Ablation. Adding ECD alone (Standard KD + ECD) raises F1-Macro from 89.98% to 91.17%, a gain of +1.19 percentage points (pp), and reduces Logical Drift from 0.2536 to 0.2099, a 17.24% reduction. This pattern is consistent with the soft-rank Spearman penalty encouraging the Student to learn attribution rankings that are more closely aligned with the Teacher’s attribution hierarchy, thereby reducing one measurable proxy for shortcut-like compression behavior. ECD does not materially change adversarial F1 under the evaluated protocol (Adv-F1 remains at 76.34%, comparable to Standard KD’s 75.40%), suggesting that attribution alignment alone did not improve performance under the evaluated perturbation protocol.
Finding 2: EGAT Is Associated With Higher Targeted Adversarial F1 Under the Evaluated Protocol. The largest ablation effect appears in EGAT. Adding EGAT alone (Standard KD + EGAT) raises adversarial F1 from 75.40% to 85.97%, a +10.57 pp gain. This result is consistent with the mechanism described in
Section 3.3: by concentrating adversarial perturbation energy on the Teacher’s highest-attribution features through the attribution mask
M, EGAT exposes the Student during training to the same feature subset targeted by the explanation-evasion protocol. Standard KD + EGAT does not reduce Logical Drift under this protocol (
, slightly higher than KD-only), indicating that protocol-specific hardening alone does not guarantee improved Teacher–Student attribution alignment.
Finding 3: Full X-GATE Provides an Observed Balance Between Accuracy and Protocol-Bounded Adversarial Performance. The complete framework (Full X-GATE, = 0.5, = 0.3) achieves the highest mean adversarial F1 in the ablation set (86.09 ± 5.57%) while maintaining competitive F1-Macro (89.30 ± 3.89%). Although the ECD-only configuration achieves the highest clean F1-Macro and lowest Logical Drift, the Full X-GATE configuration preserves part of this attributional benefit () while adding the targeted adversarial-F1 improvement associated with EGAT. The resulting profile is therefore not a single-metric optimum; it offers a favorable balance observed among the tested configurations when clean classification, attribution-rank preservation, and protocol-bounded explanation-evasion performance are considered jointly.
Collectively, the ablation study suggests that ECD and EGAT address partly orthogonal failure modes—ECD targets the attribution-preservation gap, while EGAT targets the evaluated adversarial-defense gap—and that their combination in Full X-GATE provides a balanced observed operating point among the tested configurations.