Article

DPCI-GPSR: A Directional Propagation Capacity Index for Enhanced GPSR Routing in VANETs

1
Department of Electrical and Electronic Engineering, Auckland University of Technology, Auckland 1142, New Zealand
2
Department of Computer and Information Sciences, Auckland University of Technology, Auckland 1142, New Zealand
*
Author to whom correspondence should be addressed.
Electronics 2026, 15(10), 2172; https://doi.org/10.3390/electronics15102172
Submission received: 13 April 2026 / Revised: 11 May 2026 / Accepted: 15 May 2026 / Published: 18 May 2026
(This article belongs to the Special Issue Advanced Technologies for Intelligent Vehicular Networks)

Abstract

Vehicular ad hoc networks (VANETs) enable direct wireless communication between moving vehicles for safety and cooperative driving. Routing in VANETs is challenging due to high mobility, frequent topology changes, and variable node density. The Greedy Perimeter Stateless Routing (GPSR) protocol maintains only a one-hop neighbor position table through periodic beacon exchanges, making it highly scalable. Each node forwards packets to the neighbor geographically closest to the destination. However, this distance-only criterion leads to a low packet delivery ratio (PDR). Existing improvements, such as Weight-Based Path-Aware GPSR (W-PAGPSR) combining distance progress, velocity direction, neighbor density, and link duration, incorporate multiple factors but complicate parameter tuning and lack a unified neighbor quality metric. This paper proposes Directional Propagation Capacity Index–GPSR (DPCI-GPSR), integrating neighbor information into a single directional metric capturing propagation capacity. Two enhancements are introduced: (1) an eight-direction DPCI computing a composite propagation capacity index per sector, exchanged via Hello packets, and (2) a trapezoidal link quality function treating 30–200 m as optimal while penalizing edge-zone neighbors. Implemented in NS-3 with SUMO-generated mobility, results across four node densities (30–120 vehicles), five concurrent sender–receiver pairs, and 15 random seeds show DPCI-GPSR achieves 63.08–98.39% PDR, outperforming both W-PAGPSR (52.38–80.14%) and standard GPSR (50.23–66.31%).

1. Introduction

Vehicular ad hoc networks (VANETs) enable direct vehicle-to-vehicle (V2V) communication for safety-critical applications such as road safety warnings and traffic information dissemination [1,2,3,4]. However, high node mobility, rapidly changing topology, and variable node density pose significant challenges for routing protocol design [5,6]. Geographic routing protocols, which forward packets based on node positions obtained via the Global Positioning System (GPS) and shared through periodic beacons (also known as Hello packets) [7], have emerged as a scalable solution. Among them, the Greedy Perimeter Stateless Routing (GPSR) protocol [7] is the most widely studied in the literature: it selects the neighbor geographically closest to the destination in greedy mode, and falls back to perimeter forwarding via the right-hand rule when greedy forwarding reaches a local maximum.
However, GPSR’s distance-only forwarding criterion introduces two fundamental problems. First, it frequently selects neighbors near the communication-range edge, since minimizing the remaining distance to the destination often corresponds to choosing the farthest reachable neighbor, where link quality degrades due to path loss and Medium Access Control (MAC)-layer contention. Second, it lacks awareness of a neighbor’s onward forwarding capability, potentially routing packets into dead-ends. These limitations cause frequent packet drops and unnecessary perimeter mode transitions, resulting in a low packet delivery ratio (PDR), particularly in sparse networks. Existing improvements incorporate metrics such as velocity, direction, density, or link lifetime into composite scores [1,3,8], but introduce scenario-dependent tuning parameters and lack a unified neighbor quality metric. Cross-layer approaches model link quality through physical-layer measurements [2], but increase protocol complexity.
This paper proposes Directional Propagation Capacity Index–GPSR (DPCI-GPSR), a novel enhancement to GPSR that operates entirely at the network layer without requiring cross-layer information. The main contributions are as follows:
1.
We propose a DPCI that integrates neighbor forwarding capability into a unified metric, providing two-hop propagation awareness through standard Hello packet exchange without requiring cross-layer information.
2.
We design a trapezoidal link quality (LQ) function that explicitly models the non-linear relationship between sender-to-neighbor distance and link reliability at the network layer, penalizing both edge-zone and excessively close neighbors.
3.
We design a controlled evaluation with five concurrent sender–receiver pairs whose separation is maintained above 600 m, preventing artificially high PDR caused by direct one-hop or two-hop delivery between nearby nodes.
4.
We implement and evaluate DPCI-GPSR in Network Simulator 3 (NS-3) with Simulation of Urban Mobility (SUMO)-generated vehicular traces, demonstrating significant PDR improvements over both standard GPSR and the state-of-the-art Weight-Based Path-Aware GPSR (W-PAGPSR) across four node densities (30–120 vehicles).
The remainder of this paper is organized as follows: Section 2 reviews related work on GPSR improvements and identifies the protocol limitations that motivate this study. Section 3 presents the design of DPCI-GPSR, beginning with a motivating scenario that illustrates the shortcomings of standard GPSR, followed by the proposed mechanisms. Section 4 describes the simulation environment, including the controlled sender–receiver nodes distance methodology. Section 5 presents the experimental results across four node densities. Finally, Section 6 and Section 7 discuss the findings, identify current limitations, and outline future research directions.

2. Related Work

The inherent limitations of GPSR [7]—link breakage under high mobility, stale neighbor information, and routing voids—have motivated a wide range of improvements, spanning multi-parameter weighted forwarding, cross-layer LQ modeling, position prediction, deep reinforcement learning (DRL), security enhancement, energy-aware routing, and others. Section 2.1, Section 2.2 and Section 2.3 review the three categories most relevant to this work; Section 2.4 briefly summarizes the remaining directions; and Section 2.5 consolidates the identified limitations that motivate the proposed design.

2.1. Multi-Parameter Weighted Forwarding Optimization

The largest group of GPSR improvements replaces the single distance metric with composite weight functions.
(1) Link stability and duration-based methods prefer stable neighbors by restricting the candidate area using a predefined parameter λ and selecting nodes with maximum cumulative communication duration, while also replacing the right-hand rule with minimum-angle selection in perimeter mode [5]. Another approach computes link lifetime from relative velocity, distance, and transmission range across six movement scenarios [9]. These methods reduce link breakage but consider only one or two indicators, and the predefined λ in [5] is static (fixed at 0.3).
(2) Multi-criteria weight methods combine various subsets of distance progress, relative speed, movement direction, neighbor density, link quality, and communication duration into composite formulas, though the specific factor combinations vary significantly across papers [1,3,4,8]. For example, W-PAGPSR [1] combines distance progress, movement direction (via cosine similarity), reliable neighbor density, and cumulative communication duration; WA-GPSR [3] integrates link lifetime, communication time, density, and relative speed but excludes explicit direction; GPSR-M [4] uses current and predicted distance combined with SNR; and DVA-GPSR [8] combines distance, density, relative speed, and direction angle. Some use manually tuned constant coefficients [3,8], while W-PAGPSR employs the CRITIC method for objective weight determination, achieving a 24.47% reduction in packet loss rate and a 48.34% reduction in delay compared to GPSR [1]. Despite their comprehensiveness, static weight coefficients cannot adapt to dynamically changing network conditions, and even data-driven approaches compute fixed weights from a static dataset rather than adapting in real time.
(3) Density and filtering-based methods use traffic density as a filtering criterion: a speed–density relationship model discards candidates on congested road segments [10]; priority-based Hello packets with direction, speed, and density fields enable two-stage candidate screening [11]; and an adaptive Coefficient of Dependence (CoD) dynamically adjusts beacon intervals based on multiple factors, including neighbor count, message frequency, driving direction, and distance [12].
(4) Sequential packet distribution across multiple neighbors is a distinct approach that spreads successive packets (within a short time window destined to the same receiver) across up to k different next-hop neighbors in order of proximity—the first packet goes to the nearest neighbor, the second to the second-nearest, and so on [13]. This temporal spreading aims to balance load across neighbors for multimedia streaming, but it is not simultaneous multi-path transmission of the same packet.
Notably, none of these methods model the relationship between sender-to-neighbor distance and LQ within the communication range.

2.2. Cross-Layer Link Quality-Aware Methods

Cross-layer approaches integrate physical-layer and MAC-layer measurements into routing. CLWPR [2] employs a piecewise Signal-to-Noise-and-Interference Ratio (SNIR) weighting function derived from a Two-Ray Ground propagation model to penalize communication-edge neighbors where SNIR degrades below a threshold, combined with road distance, the MAC Frame Error Rate (FER), and node queue utilization—the only existing work that explicitly models the non-linear degradation of link quality as a function of distance within the communication range. Other approaches compute the Packet Error Rate (PER) from the Signal-to-Noise Ratio (SNR) for FANETs [14] or use an empirically measured FER and queue occupancy [15]. The fundamental limitation of all cross-layer methods is dependence on PHY/MAC-layer information, which increases protocol complexity, inter-layer coupling, and implementation difficulty.

2.3. Position-Prediction-Based GPSR Improvements

Position prediction addresses stale neighbor information by estimating future node locations. The simplest approach uses linear extrapolation from two consecutive beacon timestamps [16]. For FANETs, velocity vector prediction combined with an uncertainty regression variable improved PDR by up to 15% in UAV experiments [17]. An adaptive Kalman filter based on a Gaussian motion model supports 3D routing with realistic omnidirectional antenna modeling [18]. A combined approach integrates failed node screening with a weighted metric considering distance, link lifetime, and two-hop neighbor count, achieving a 57.54% delay reduction and a 22.16% packet loss reduction [19]. While effective at mitigating stale information, these methods generally assume simplified motion models that degrade under complex maneuvers.

2.4. Other Improvement Directions

Other GPSR improvement directions include DRL [20,21,22,23,24], security and trust enhancement [25,26,27,28], energy-aware routing [29,30,31], path-aware forwarding [6,32], urban topology awareness [33,34,35], adaptive beaconing [36], and hybrid topology–position routing [37]. These directions address different aspects of GPSR and are not directly related to the LQ and propagation awareness problems targeted in this work.

2.5. Summary and Protocol Limitations

Table 1 summarizes all reviewed protocols by category. The “Perim.” column indicates whether the protocol improves the perimeter forwarding mode of GPSR: “✓” denotes an explicit improvement, “Replaced” means the original perimeter mode is entirely substituted by a new mechanism, “Modified” indicates partial modification, and “–” means no change. In the “Key Results” column, the symbols ↑ and ↓ denote an increase and a decrease, respectively.
Three key limitations emerge: (1) most weighted methods [1,3,5,8,9,10,11,12,13] do not model distance-dependent LQ degradation at the network layer; (2) forwarding decisions generally lack directional propagation awareness—although [19] introduces a two-hop neighbor count, it does not provide a unified directional metric of onward propagation capacity; and (3) within the weighted-sum forwarding paradigm, existing methods [3,5,8] rely on static coefficients that are manually tuned or empirically selected and cannot adapt to varying network conditions. While DRL-based approaches [20,21,22,23,24] bypass this problem entirely by replacing the weighted-sum formulation with learned policies, they require offline training and incur high computational overhead, limiting their deployment on resource-constrained vehicular nodes. DPCI-GPSR directly addresses the first two limitations through a network-layer trapezoidal LQ function and a DPCI exchanged via Hello packets. The third limitation—lightweight adaptive parameter tuning within a weighted-sum framework—remains an open challenge and is discussed as future work in Section 7. The following section details the proposed design.

3. Design of DPCI-GPSR

This section first illustrates the routing limitations of standard GPSR through a case study, then presents the design of DPCI-GPSR, which modifies the greedy forwarding mechanism through an eight-direction DPCI, a trapezoidal LQ function, and a two-pass next-hop selection algorithm.

3.1. Case Study: Routing Limitations of Standard GPSR

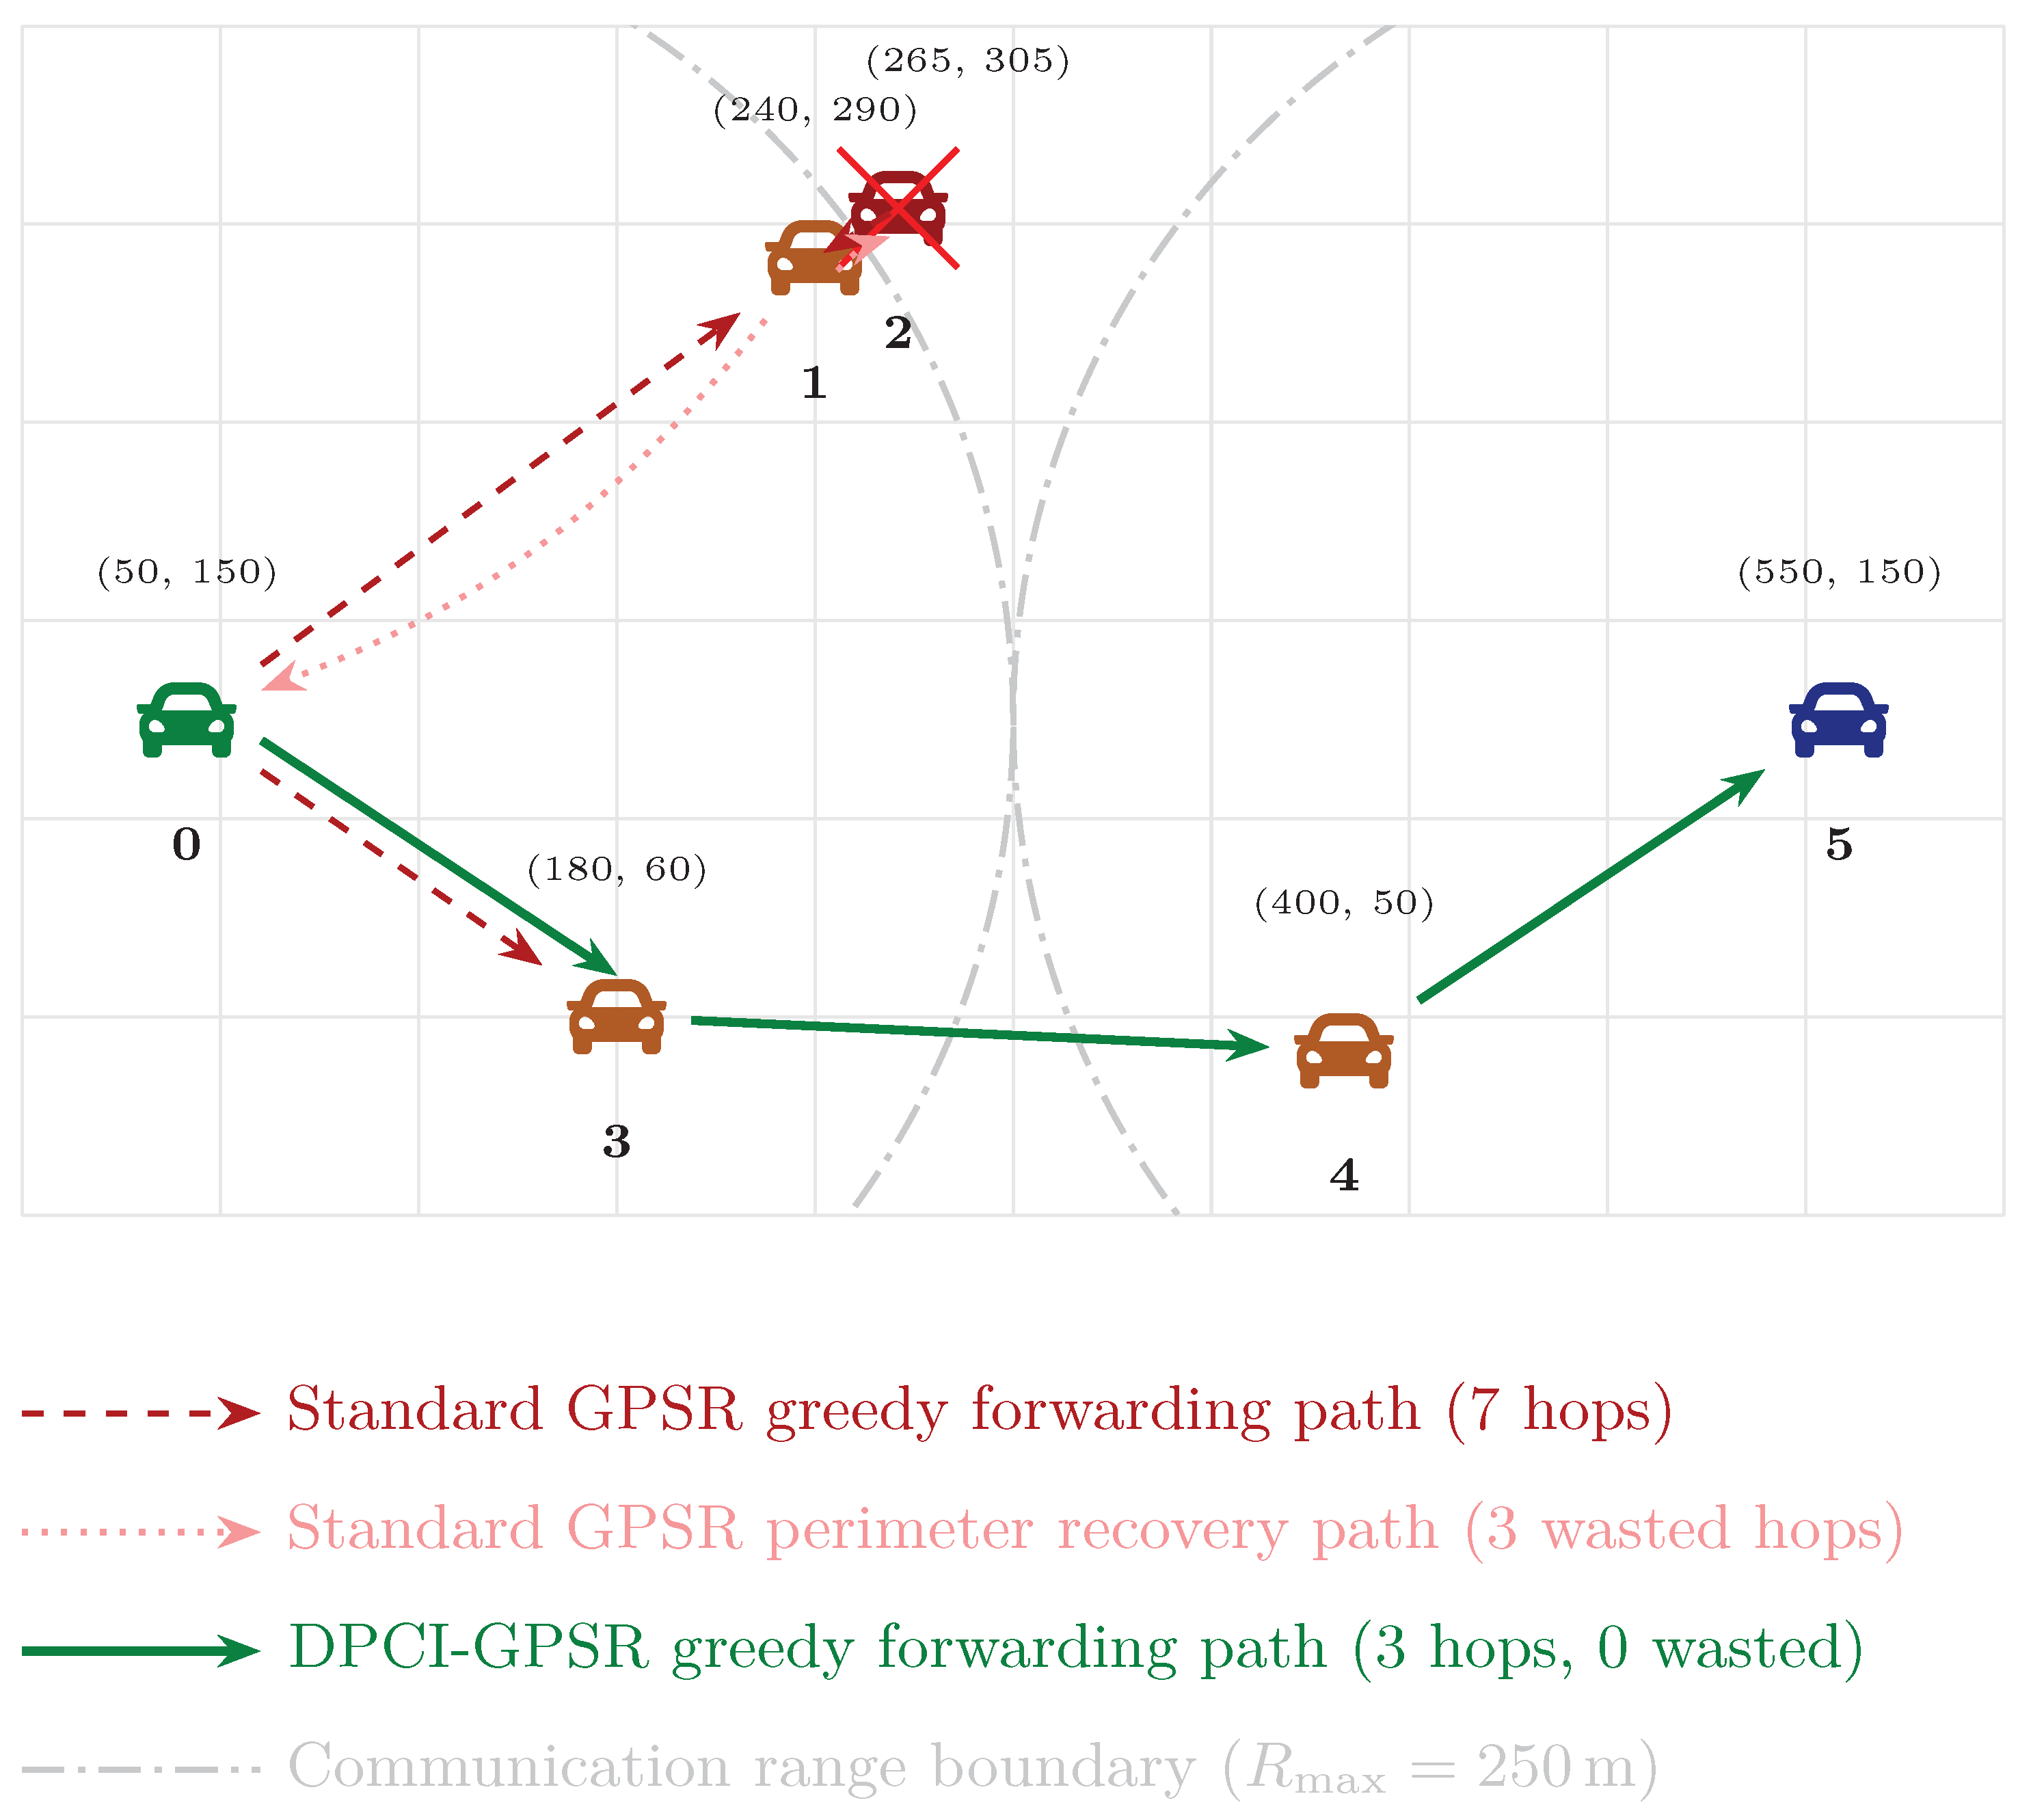
To illustrate the limitations of standard GPSR, consider the six-node scenario depicted in Figure 1, in which the vehicle labels 0–5 denote Node 0 through Node 5, respectively. Node 0 (sender) transmits packets to Node 5 (receiver), separated by 500 m. The communication range is R max = 250  m. Table 2 summarizes the inter-node distances relevant to the forwarding decisions.
In standard GPSR, greedy forwarding selects the neighbor N * that minimizes the remaining distance to the destination D:
N * = arg min N i N d ( N i , D ) ,
where N is the set of one-hop neighbors and d ( · , · ) denotes Euclidean distance.
Applying this rule to the scenario in Figure 1 reveals two fundamental problems.
Problem 1: Distance-only criterion and communication-edge bias. At Node 0, the candidate neighbors are Node 1 ( d ( 1 , 5 ) = 340  m) and Node 3 ( d ( 3 , 5 ) = 380  m). Standard GPSR selects Node 1 because it is closer to the destination. However, Node 1 is located at 236 m from Node 0, which is 94.4% of R max —deep in the communication-edge zone where IEEE 802.11p links suffer from elevated packet error rates due to path loss and fading. The distance-only criterion systematically biases next-hop selection toward these unreliable edge-zone neighbors.
Problem 2: No forward propagation awareness. After reaching Node 1, the only forward neighbor (satisfying d ( N i , D ) < d ( 1 , D ) ) is Node 2, located merely 29 m away. Node 2 is a dead-end: it has no reachable neighbors toward the destination ( d ( 2 , 5 ) = 324  m, d ( 2 , 3 ) = 259  m, d ( 2 , 4 ) = 289  m—all exceeding R max ). In a low-density environment, a 29 m step forward provides negligible geographic progress, and the probability of finding a viable next hop from such a position is extremely low. Standard GPSR has no mechanism to anticipate this dead-end before committing to the path. Consequently, the packet enters perimeter recovery mode at Node 2 and backtracks through Node 1 to Node 0, resulting in a total path of:
0 1 2 1 ( recovery ) 0 ( recovery ) 3 4 5
requiring seven hops, of which three are entirely wasted on the dead-end detour. In contrast, the goal of DPCI-GPSR is to enable Node 0 to directly select Node 3 at the first hop, completing delivery in only three hops ( 0 3 4 5 ), as shown by the solid arrows in Figure 1.
These two problems remain largely unaddressed in the existing literature. Multi-parameter weighted methods [1,3,5,8,9] incorporate various combinations of link stability indicators such as relative velocity, communication duration, and neighbor density, but these parameters characterize only the immediate one-hop link between the current node and its candidate neighbor; they provide no information about whether that neighbor can continue to propagate the packet toward the destination. Cross-layer approaches such as CLWPR [2] model link quality degradation through physical-layer SNIR measurements, but again only for the next hop, without directional awareness of the forwarding landscape beyond it. Position prediction methods [16,17,18,19] estimate future neighbor locations to mitigate stale information, and [19] further counts the effective neighbors of each candidate as a scalar proxy for onward connectivity—yet this metric is direction-agnostic and does not distinguish whether those neighbors lie toward or away from the destination. Consequently, none of the above approaches exploits the angular structure of the forwarding landscape to identify which direction still offers viable multi-hop paths. The following subsections present the mechanisms that enable this improvement.

3.2. Directional Sector Foundation of DPCI

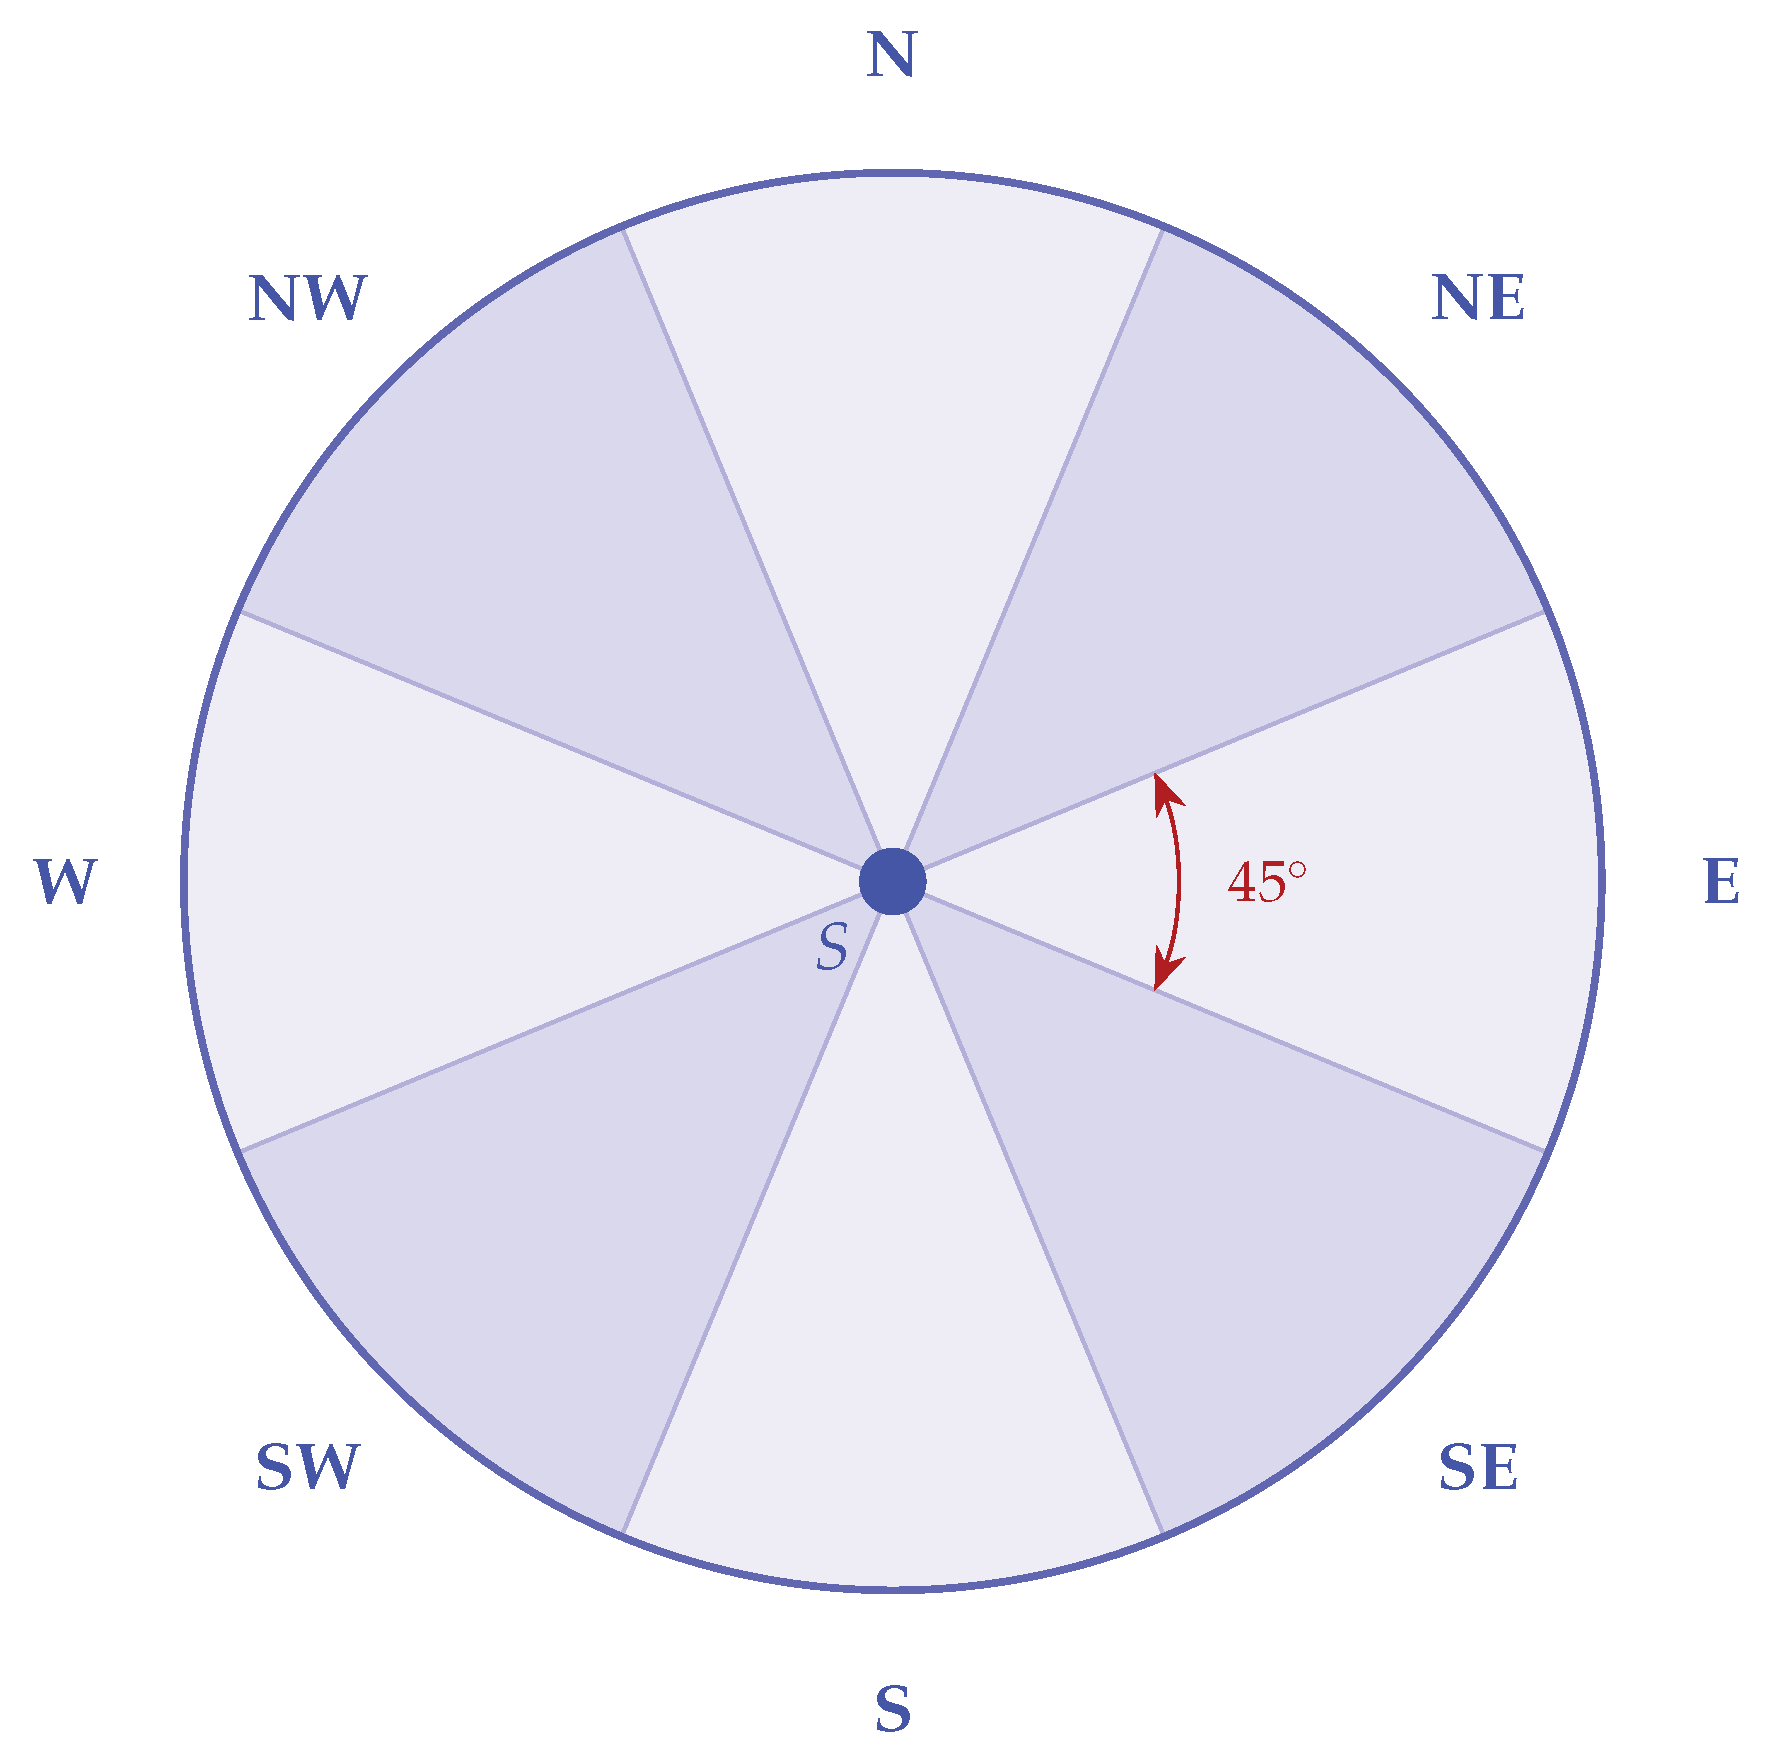
DPCI-GPSR divides the 360° plane around the current node into eight directional sectors of 45° each, as illustrated in Figure 2. The direction of a neighbor N i relative to the current node S is determined by
θ = atan 2 ( y N i y S , x N i x S ) × 180 π ,
and mapped to one of eight sectors: EAST, NORTHEAST, NORTH, NORTHWEST, WEST, SOUTHWEST, SOUTH, SOUTHEAST.
Given the main direction d main from S to D, the directional weight for each sector d is computed using cosine decay, a standard projection of forward progress onto the destination direction with rear-facing sectors clipped to zero:
w raw ( d ) = max 0 , cos Δ ( d , d main ) × π 4 ,
where Δ ( d , d main ) is the shortest circular distance (0–4) between two sectors. The weights are normalized as:
w ( d ) = w raw ( d ) k = 0 7 w raw ( k ) .
Referring to Figure 1, the main direction from Node 0 to Node 5 is approximately EAST. Node 1 lies in the NORTHEAST sector and Node 3 in the SOUTHEAST sector; both are adjacent to the main direction and receive comparable directional weights. The eight-direction model does not itself determine the next hop, but provides the directional framework for the DPCI computation described next.

3.3. DPCI Computation Process

With the directional framework established, the next step is to quantify the forwarding potential of each sector. For each direction d, the DPCI value at node S is computed as follows. Let { N 1 , N 2 , , N k } be the neighbors in direction d. The normalized distance weight for each neighbor is:
w i = min d ( S , N i ) R max , 1.0 ,
where R max is the maximum communication radius (250 m). The maximum weight and redundancy effect are:
w max = max i ( w i ) , R sum = w i w max w i ,
R effect = 1 e γ · R sum ,
where γ is the redundancy decay parameter. The DPCI value for direction d is:
DPCI ( d ) = w max + ( 1 w max ) · R effect .
DPCI [ 0 , 1 ] reflects the coverage quality of direction d: w max captures the farthest reachable distance, and R effect captures the redundancy provided by additional neighbors.
Each node computes its eight DPCI values and broadcasts them in periodic Hello packets. The weighted DPCI of a neighbor N i toward the destination direction is:
WeightedDPCI ( N i ) = d = 0 7 DPCI N i ( d ) · w ( d ) ,
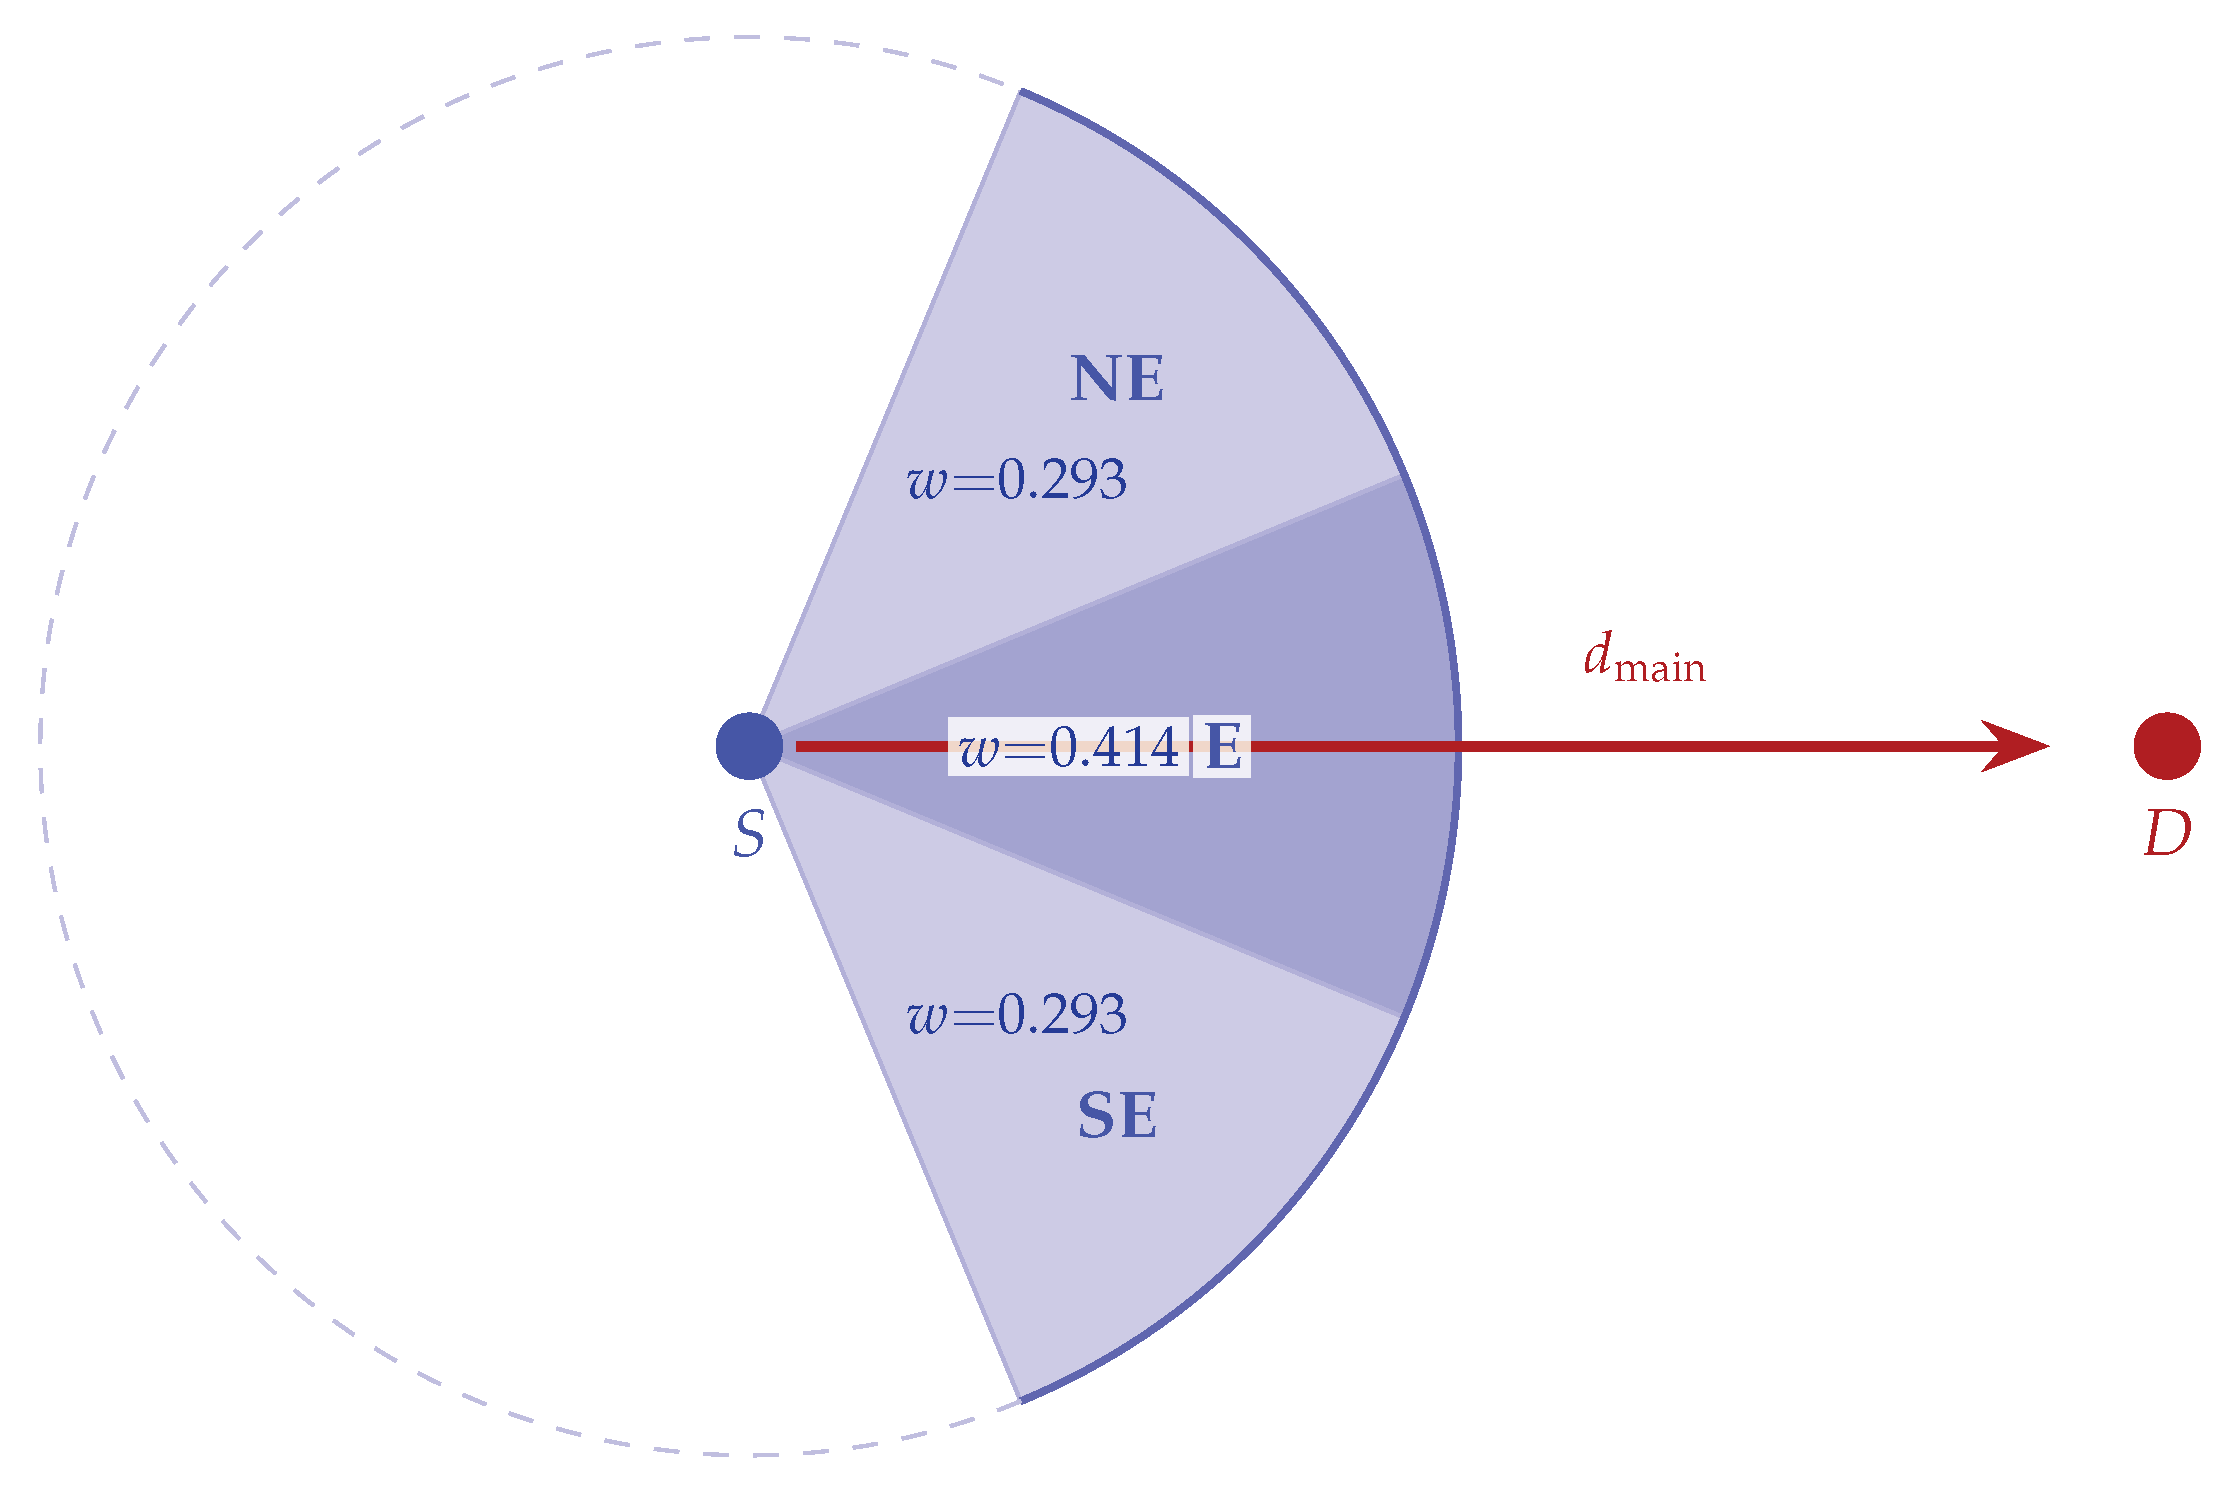
where DPCI N i ( d ) is the DPCI value reported by neighbor N i for direction d. Figure 3 illustrates the directional weights when the main direction d main is EAST: the cosine decay assigns the highest weight to the EAST sector ( w = 0.414 ), equal weights to the two adjacent sectors NE and SE ( w = 0.293 each), and zero weight to all other sectors beyond ±45° from the main direction.
The eight-sector granularity is chosen because, as Figure 3 shows, the cosine decay weighting concentrates on exactly three forward sectors—the main destination sector and its two immediate neighbors—with normalized weights { 0.414 , 0.293 , 0.293 } , while the remaining five rear-and-perpendicular sectors receive zero weight. By design, a coarser six-sector partition would merge narrowly forward and forward-lateral relays into a single 60 sector and lose this distinction, whereas a finer twelve-sector partition would reduce the expected number of neighbors per sector. The 45 granularity is chosen as a design compromise between directional resolution and per-sector population.
Algorithm 1 summarizes the periodic DPCI computation procedure executed by each node at every Hello interval.
In the scenario of Figure 1, Node 1 has only Node 2 in its forward direction at 29 m, and Node 2 has no reachable neighbors beyond it. This yields a very low WeightedDPCI for Node 1 (≈0.048), reflecting its inability to propagate packets further toward the destination. In contrast, Node 3 has Node 4 at 220 m in the EAST sector, and Node 4 in turn has Node 5 at 180 m, producing a substantially higher WeightedDPCI (≈0.543). Through the DPCI values exchanged in Hello packets, Node 0 gains two-hop forwarding awareness and identifies that the path via Node 1 leads to a dead-end (addressing Problem 2).
Algorithm 1: Periodic DPCI computation and Hello broadcast
Electronics 15 02172 i001

3.4. Distance-Aware Trapezoidal Link Quality Function

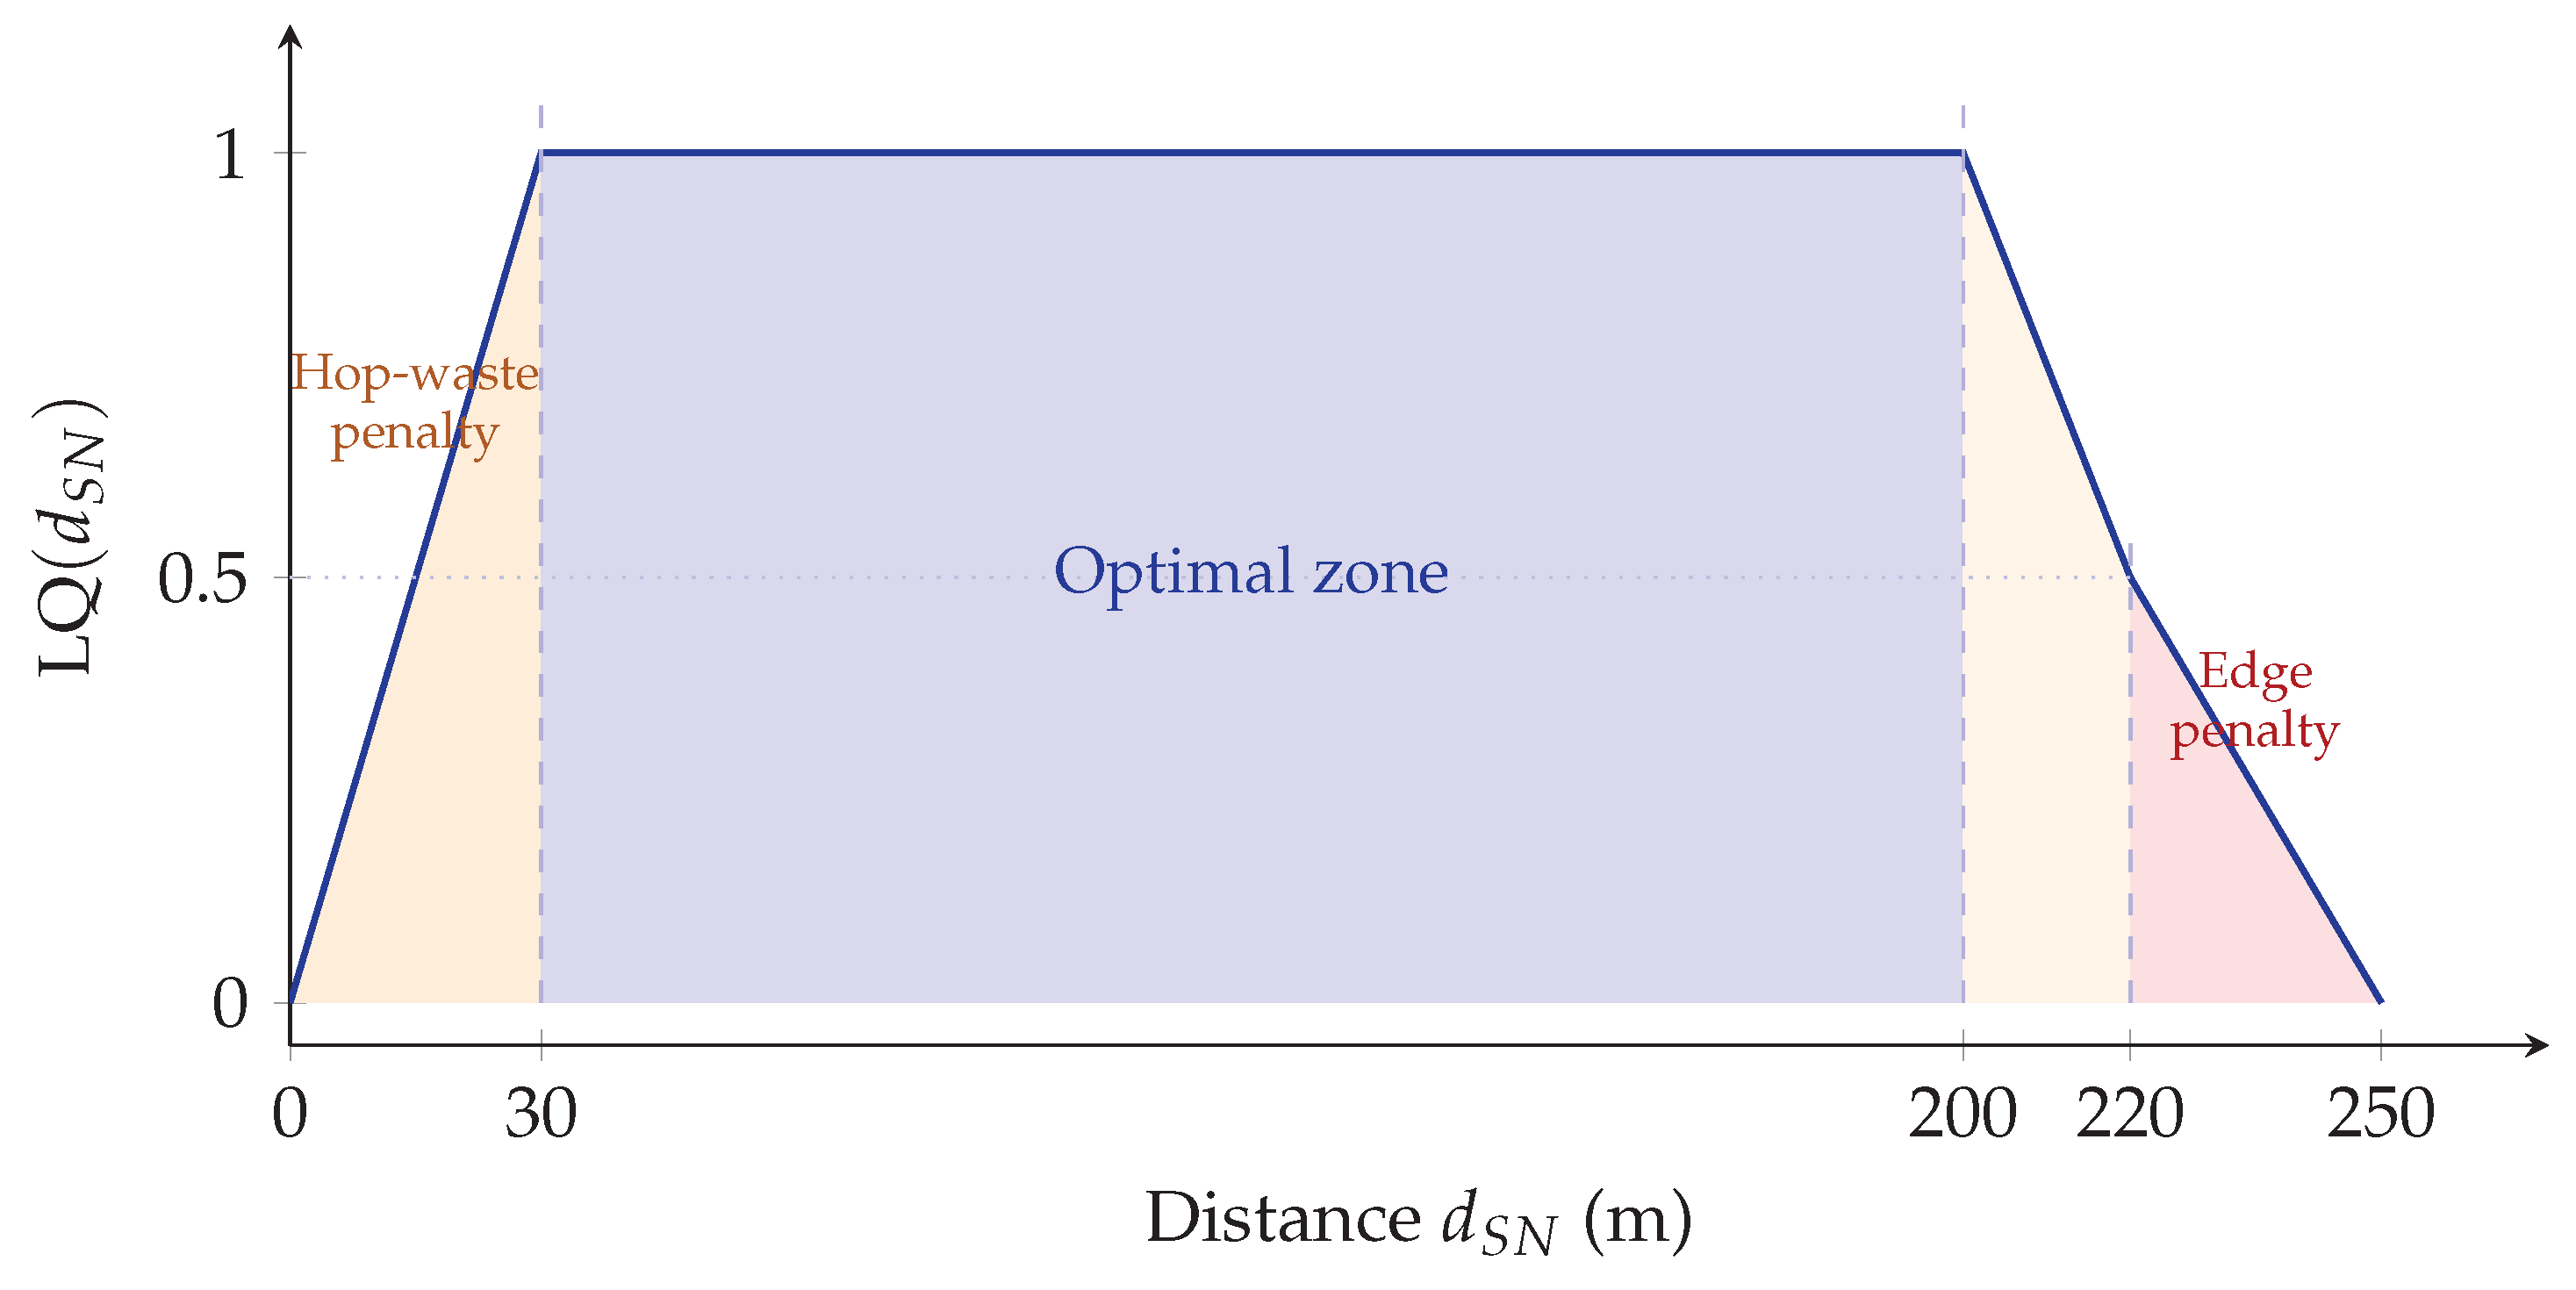
The DPCI provides two-hop forwarding awareness, but the selection process also requires a mechanism to model distance-dependent link reliability. It should be noted that the proposed LQ function is not intended as a strict physical-layer link quality metric; rather, it is a routing-oriented link quality that jointly captures two network-layer concerns: (i) link reliability, reflected by the penalty applied to communication-edge neighbors beyond 200 m, where the IEEE 802.11p link is known to degrade due to path loss and fading; (ii) forwarding efficiency, reflected by the penalty applied to neighbors closer than 30 m, where the physical link is actually the most reliable, but the geographic progress is too small to justify a hop. In other words, the sub-30 m penalty does not represent poor link quality in the traditional sense—it represents inefficient use of a hop. Combining both concerns into a single piecewise function allows DPCI-GPSR to evaluate candidates with one unified metric at the network layer, without consulting any physical-layer information. Based on this design intent, we define a trapezoidal LQ function LQ ( d S N ) based on the distance d S N = d ( S , N i ) between the current node and the candidate neighbor:
LQ ( d S N ) = d S N 30 d S N < 30 m 1.0 30 m d S N 200 m 1.0 0.5 · d S N 200 20 200 m < d S N 220 m 0.5 · 1 d S N 220 R max 220 220 m < d S N R max 0 d S N > R max
Figure 4 visualizes the shape of this function. The 30–200 m range is treated as the optimal transmission zone with LQ = 1.0 . Neighbors closer than 30 m are penalized for wasting hops. Neighbors beyond 200 m receive increasing penalties, and those beyond 220 m are aggressively penalized to prevent selection of communication-edge nodes. The 200/220 m breakpoints are sized to the worst-case V2V relative velocity in our SUMO mobility (two vehicles at the 15 m/s per-vehicle speed cap moving head-on, giving an upper bound of ∼30 m/s): under the 1 s Hello interval, a neighbor at 220 m can therefore drift up to 30 m within one beacon period and remains marginally inside the 250 m communication range; neighbors beyond this threshold may exit the range before the next forwarding decision. The 30 m lower bound reflects an efficiency rather than reliability concern, intended to avoid frequent re-selection among nearby relays that yield negligible geographic progress.
Applying this function to Figure 1: d ( 0 , 1 ) = 236  m falls in the 220–250 m penalty zone, yielding LQ 0.23 , which substantially reduces Node 1’s effective progress (addressing Problem 1). Meanwhile, d ( 0 , 3 ) = 158  m lies in the optimal zone with LQ = 1.0 . For the secondary hop, d ( 1 , 2 ) = 29  m falls below the 30 m threshold ( LQ = 29 / 30 0.97 ); combined with Node 2’s near-zero DPCI, this 29 m step is identified as a dead-end path that wastes hop count without meaningful progress (addressing Problem 2).

3.5. Two-PassNext-Hop Selection with DPCI Integration

With both the DPCI (forwarding awareness) and LQ function (link reliability) defined, this section presents the unified selection algorithm that combines them. DPCI-GPSR employs a two-pass selection algorithm to determine the next-hop node.
Pass 1: Determine maximum effective progress. For each forward neighbor N i (satisfying d ( N i , D ) < d ( S , D ) and N i lastHop ), the effective progress is:
effProgress i = d ( S , D ) d ( N i , D ) × LQ ( d S N i ) .
The best effective progress is:
bestEffProgress = max i ( effProgress i ) .
Pass 2: Compute composite utility. The normalized distance factor for each neighbor is:
DF i = d ( S , D ) d ( N i , D ) R max .
Let LQ i = LQ ( d S N i ) , WDPCI ( N i ) = WeightedDPCI ( N i ) , e i = effProgress i , and e max = bestEffProgress . The distance factor similarity threshold θ df controls whether a candidate receives the DPCI bonus: only neighbors whose effective progress is within a factor θ df of the best are eligible, preventing low-progress neighbors from being selected solely due to high DPCI values. The composite utility takes a multiplicative-plus-additive form so that LQ acts as a reliability gate (collapsing the utility to zero for unreliable links), while the WDPCI provides an additive bonus reflecting downstream propagation among the surviving candidates:
U ( N i ) = DF i · LQ i + WDPCI ( N i ) if e i e max · θ df DF i · LQ i otherwise
The next-hop node is selected as:
N * = arg max N i U ( N i ) .
Algorithm 2 summarizes the two-pass next-hop selection procedure, integrating the trapezoidal LQ function and the DPCI-weighted utility computation into a unified forwarding decision.
Algorithm 2: Pseudocode of two-pass next-hop selection in DPCI-GPSR
Electronics 15 02172 i002
As introduced in Figure 1, at Node 0 the two-pass algorithm proceeds as follows. In Pass 1, Node 1’s effective progress is heavily penalized by LQ ( 236 ) 0.23 , while Node 3 retains full progress with LQ ( 158 ) = 1.0 . In Pass 2, Node 3 receives an additional DPCI bonus ( WDPCI 0.543 ) because its effective progress is competitive, whereas Node 1’s low DPCI (≈0.048) reflects the dead-end ahead. The resulting utility of Node 3 far exceeds that of Node 1, and the packet follows the path 0 3 4 5 in only three hops. Through this combined mechanism, DPCI-GPSR is expected to exhibit density-adaptive behavior: in sparse networks, the DPCI lookahead steers packets toward directions that still have viable relays, enabling more aggressive long-range propagation; in dense networks, the DPCI bonus differentiates among numerous competitive candidates to select neighbors with the strongest onward forwarding capacity, thereby reducing redundant hops.
Section 4 describes the simulation setup used to evaluate DPCI-GPSR across multiple node densities.

4. Simulation Setup

4.1. Road Network and Mobility Generation

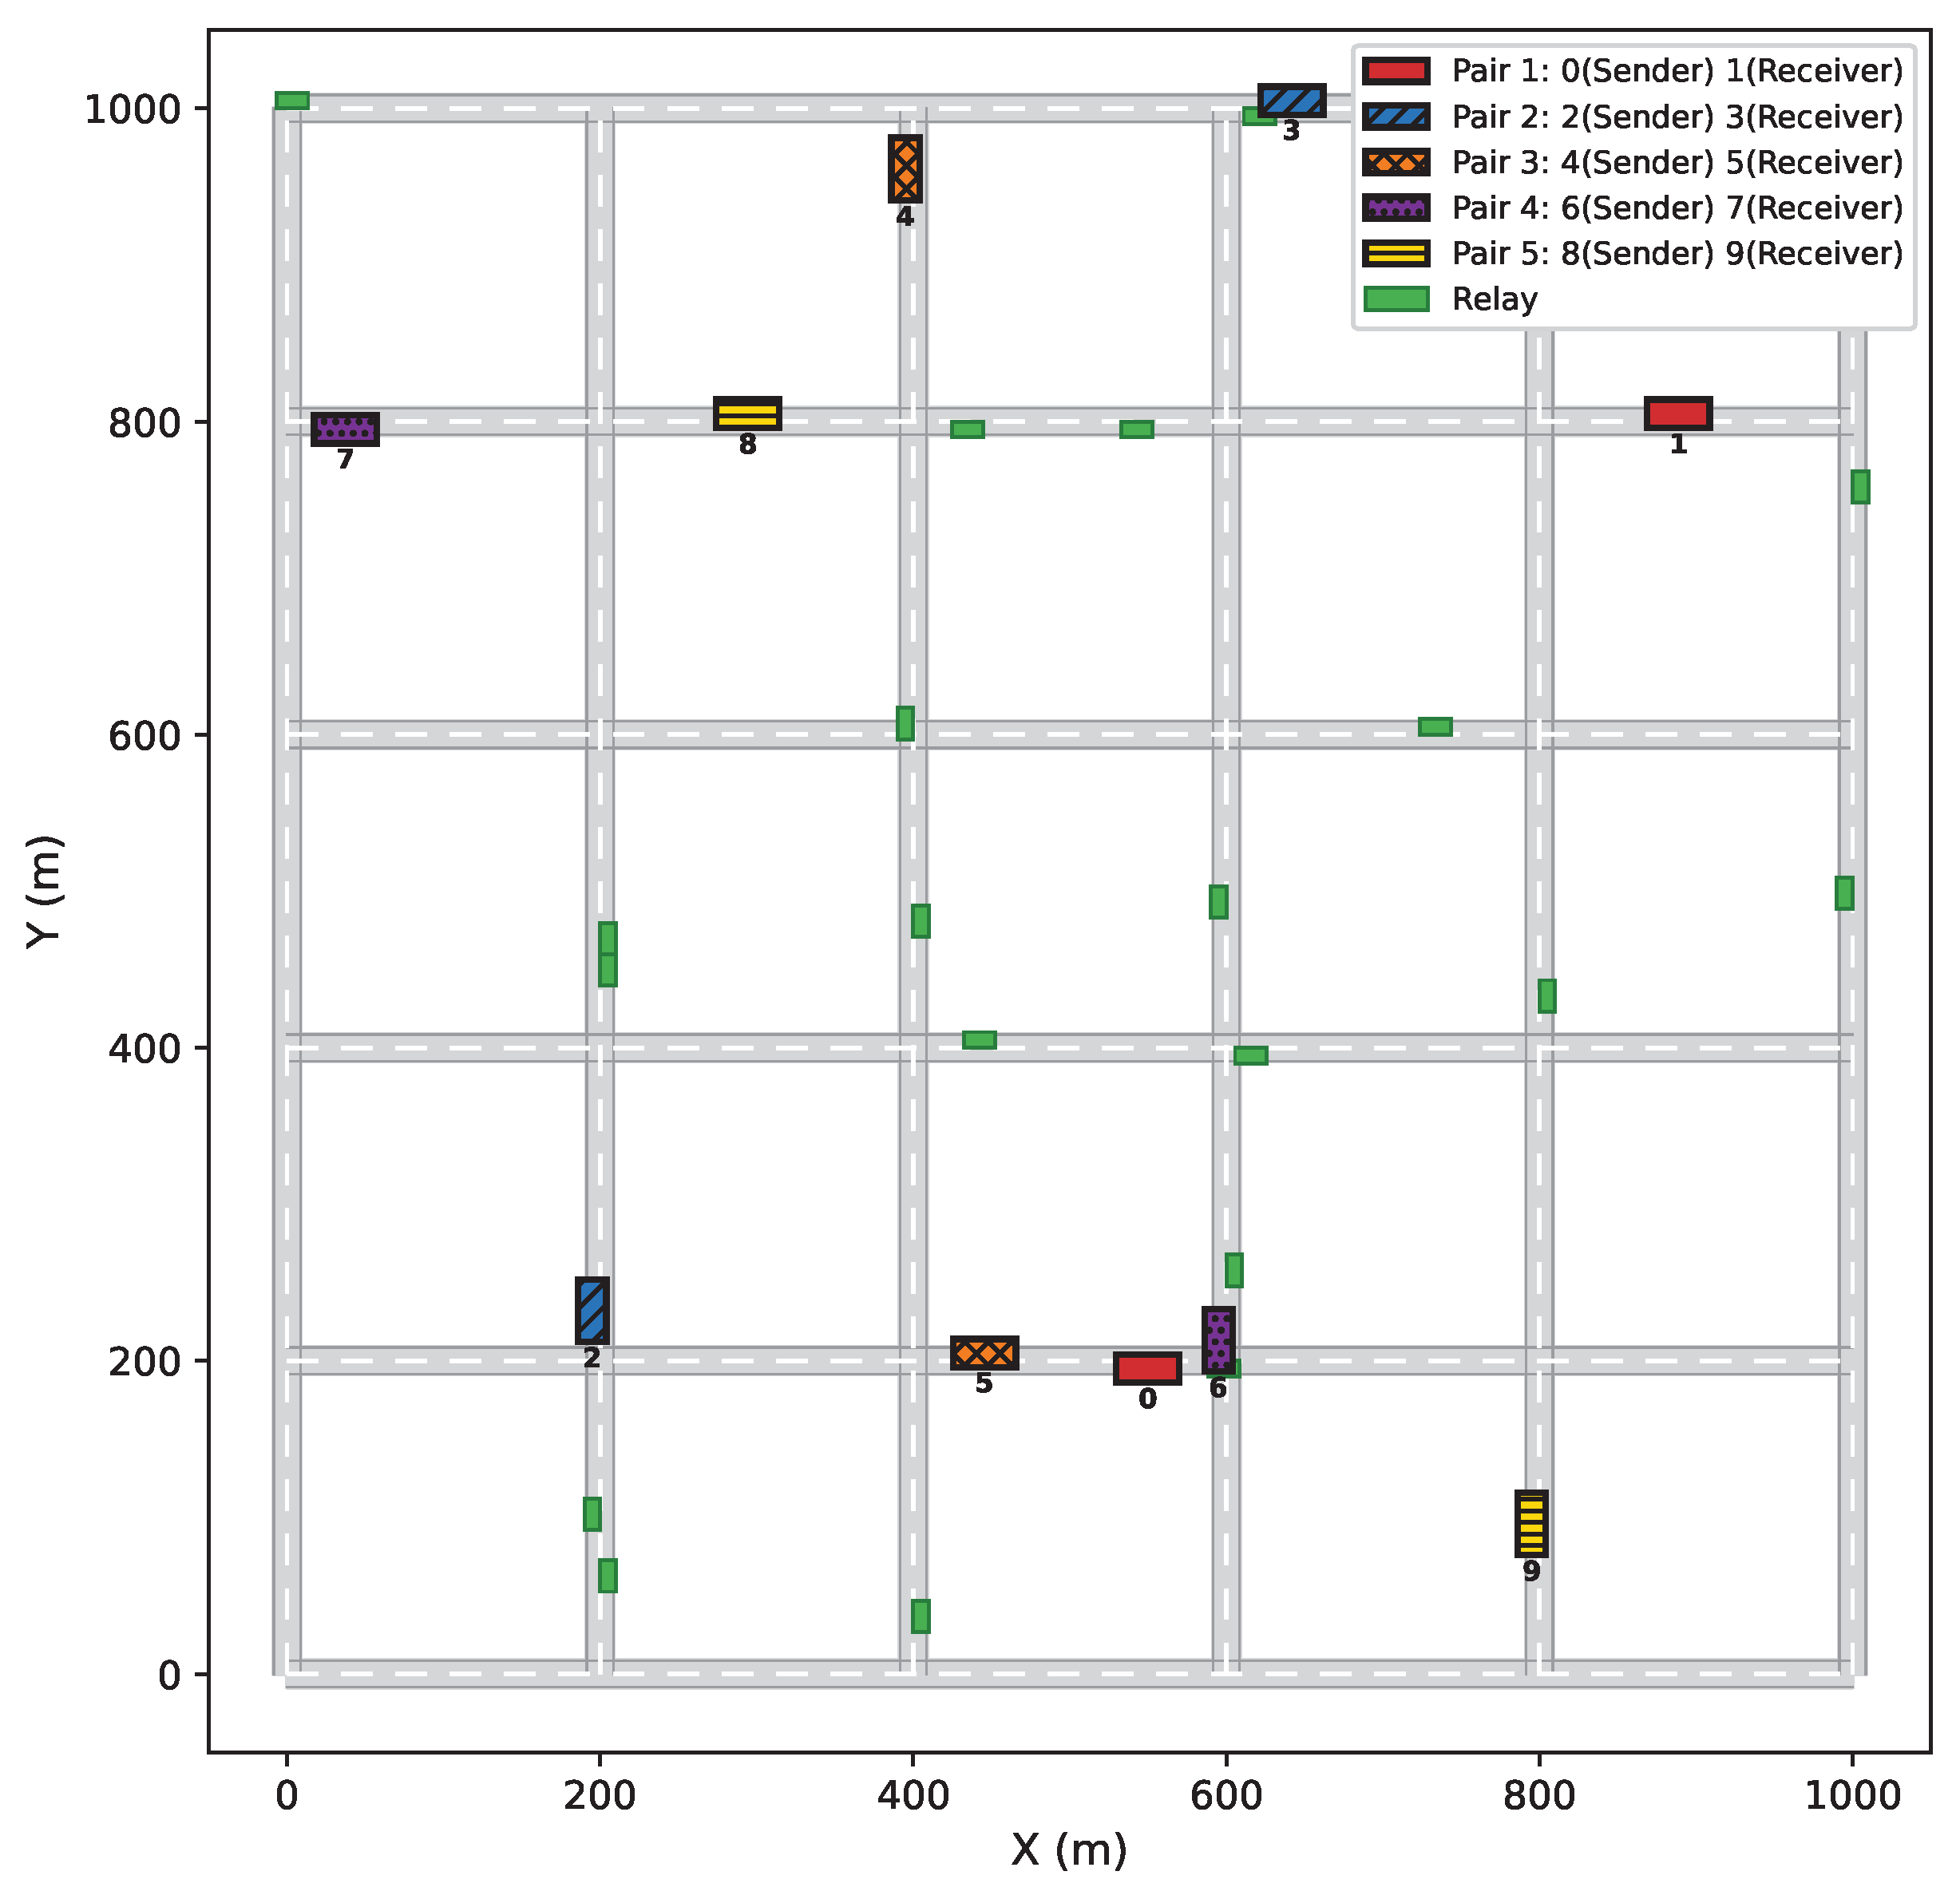
The road network is a 1000 m × 1000 m grid with 6 × 6 intersections at 200 m spacing. Each road segment consists of one lane per direction, and all intersections use priority-based traffic control without traffic lights. Figure 5 illustrates the 30-node scenario.
Vehicular mobility traces were generated by a Python (version 3.11.15) script interfacing with SUMO via TraCI. The script uses Python’s random.seed() to determine all stochastic decisions—initial node placement on road edges, destination selection, and relay speed assignment—while SUMO computes the deterministic shortest path (Dijkstra) between each assigned origin–destination pair. For each of the four node densities (30, 60, 90, 120), 15 different seeds were used ( seed = N nodes × 1000 + i , i = 1 , , 15 ), with each seed producing a distinct scenario (different initial node positions, destinations, and relay speeds), yielding 60 independent mobility trace files in total. A fixed seed reproduces an identical trace, ensuring full experimental reproducibility. DPCI-GPSR was implemented in NS-3 (version 3.29) by extending the open-source GPSR module; all 60 traces are consumed by NS-3 under identical protocol configurations.

4.2. NS-3 and Protocol Parameters

Table 3 summarizes the simulation parameters. Five sender–receiver pairs are configured: nodes (0, 1), (2, 3), (4, 5), (6, 7), and (8, 9). The remaining nodes serve as relay vehicles, initially distributed evenly across all road edges with random destinations at least 400 m away and speeds uniformly sampled from [5.0, 15.0] m/s. All randomness is controlled by a deterministic seed formula: seed = N nodes × 1000 + i , where i is the sequence number (1–15), ensuring bit-identical reproducibility.

4.3. Sender–Receiver Nodes Distance Control

A distinctive aspect of this evaluation is the controlled separation between sender–receiver pairs. Since R max = 250 m, a pair distance below 500 m would allow delivery in one or two hops, bypassing the multi-hop forwarding decisions that differentiate the protocols under comparison. The 600 m lower bound ensures that each packet must traverse at least three intermediate hops, making the routing protocol’s next-hop selection strategy the decisive factor in delivery success.
A three-layer distance control mechanism operates at each simulation time step:
1.
Proactive route extension. When a node’s remaining route is two edges or fewer, a new destination is assigned at least 600 m from its paired node, ensuring continuous movement away from the partner.
2.
Route safety check. The upcoming five edges of each node’s route are inspected. If any edge passes within 500 m of the paired node, the route is replaced with a new destination at least 700 m away.
3.
Reactive speed correction. When pair distance falls below 600 m, the sender is slowed to 4.0 m/s and the receiver is accelerated to 12.0 m/s. When the distance is restored, both revert to the normal speed of 8.0 m/s.
The constraint is one-sided: pairs are only forced apart when the distance falls below 600 m and are free to drift further apart without intervention.

4.4. Sender–Receiver Node Distance Validation: Controlled vs. No-Control

To validate the necessity of the distance control mechanism, we compare the controlled configuration against a no-control variant where sender–receiver pairs move freely with random route extensions, identical to relay nodes. Table 4 presents the results.
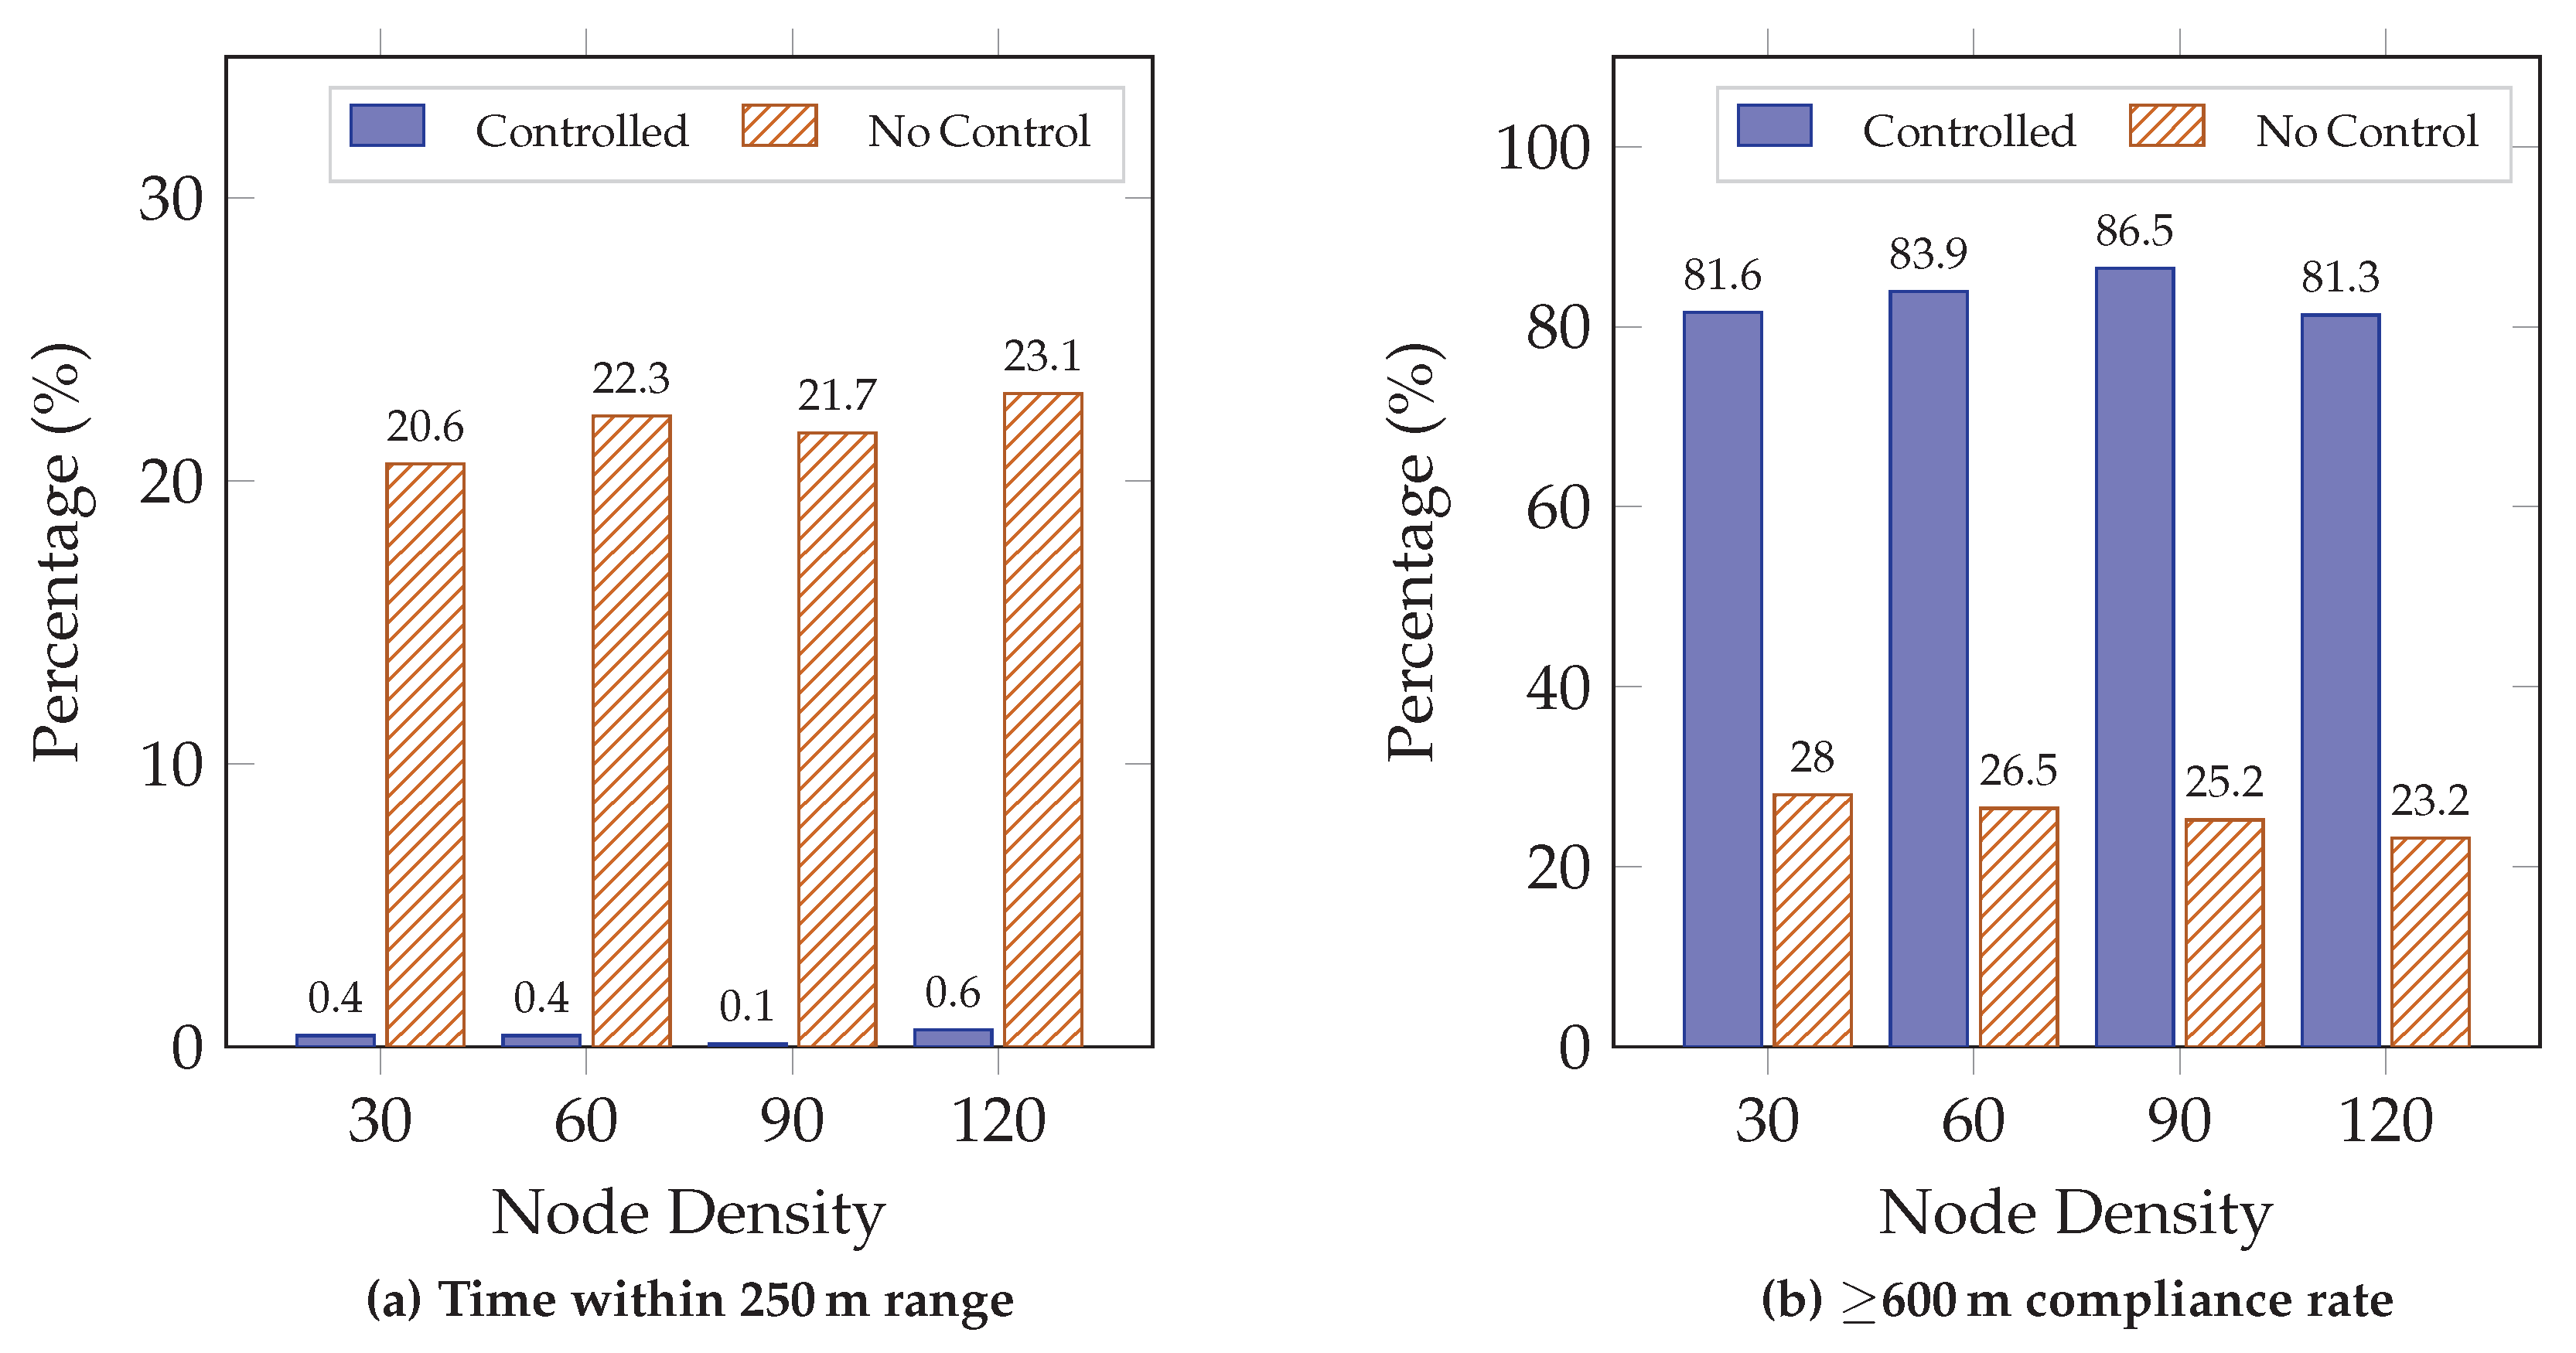
The controlled configuration achieves an average sender–receiver separation of 752–776 m, while the no-control variant averages only 433–459 m. More critically, the no-control configuration exposes a fundamental limitation in simulation fairness. As shown in Figure 6, over the 500 s simulation, sender–receiver pairs in the no-control setting spend approximately 21% of the time within each other’s direct communication range (<250 m). During these periods, packets are delivered directly without traversing any relay node, meaning that no routing optimization plays a meaningful role, yet these trivial deliveries inflate the measured PDR. Furthermore, only about 25% of the simulation time maintains a separation of ≥600 m, indicating that pairs predominantly operate within one-hop or two-hop range—substantially reducing the difficulty of packet delivery, as reflected by the average distance of only 433–459 m.
In contrast, the controlled configuration limits direct-range encounters to approximately 0.5% of simulation time, maintains an average separation of around 750 m, and keeps pairs above 600 m for over 80% of the duration. This testing environment avoids the confounding effect of trivial direct deliveries and provides a fair basis for comparative evaluation against other routing protocols.

4.5. Baseline Protocols and Evaluation Metrics

Three protocols were compared under identical conditions. All three share the same perimeter forwarding implementation; the comparison focuses exclusively on the greedy forwarding mode:
  • GPSR [7]: Standard greedy perimeter stateless routing, serving as the baseline.
  • W-PAGPSR [1]: Weighted perimeter-assisted GPSR, using a composite score of distance progress, velocity direction, neighbor density, and communication duration for greedy next-hop selection.
  • DPCI-GPSR: The proposed protocol with trapezoidal LQ function and eight-direction coverage index.
Performance is evaluated using three metrics: (1) packet delivery ratio (PDR), the ratio of received to sent packets; (2) average end-to-end delay, the mean delivery latency; and (3) throughput, the effective data rate (kbps). All results are averaged over 15 independent seeds, and each metric is reported under both the controlled and the uncontrolled mobility settings introduced above.

5. Results

5.1. PDR Across Node Densities

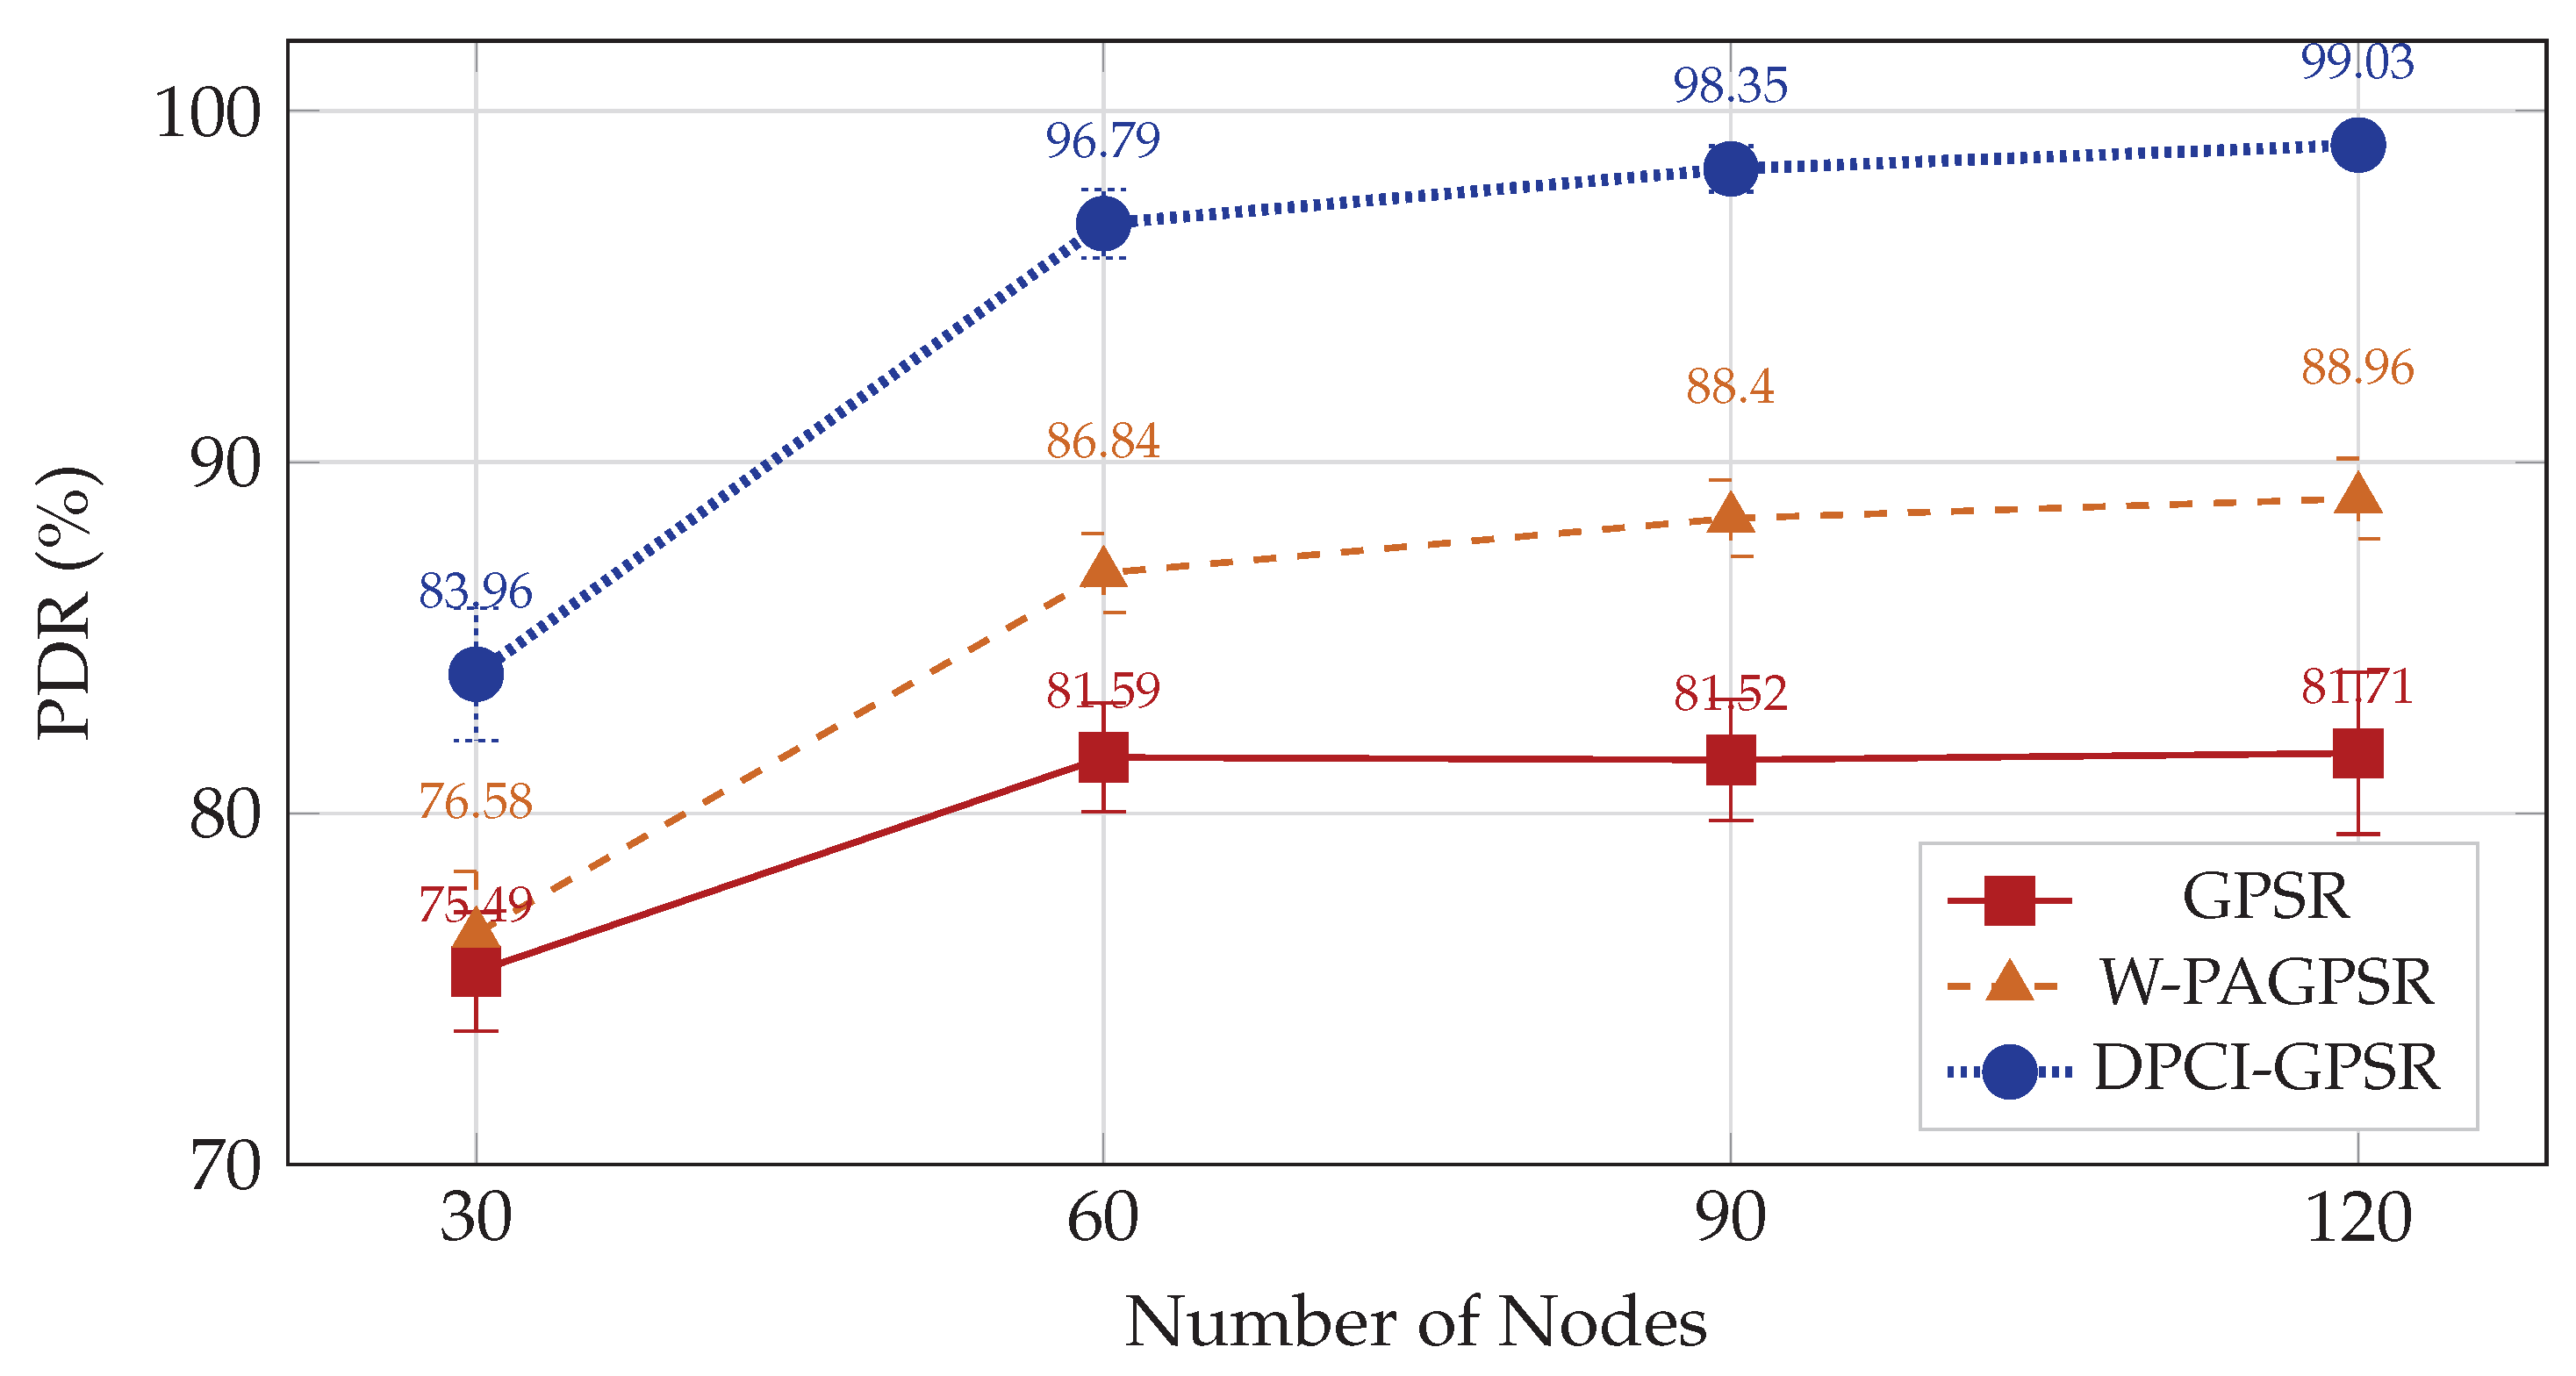
Figure 7 and Figure 8 present the average PDR across the four node densities under controlled and uncontrolled mobility, respectively.
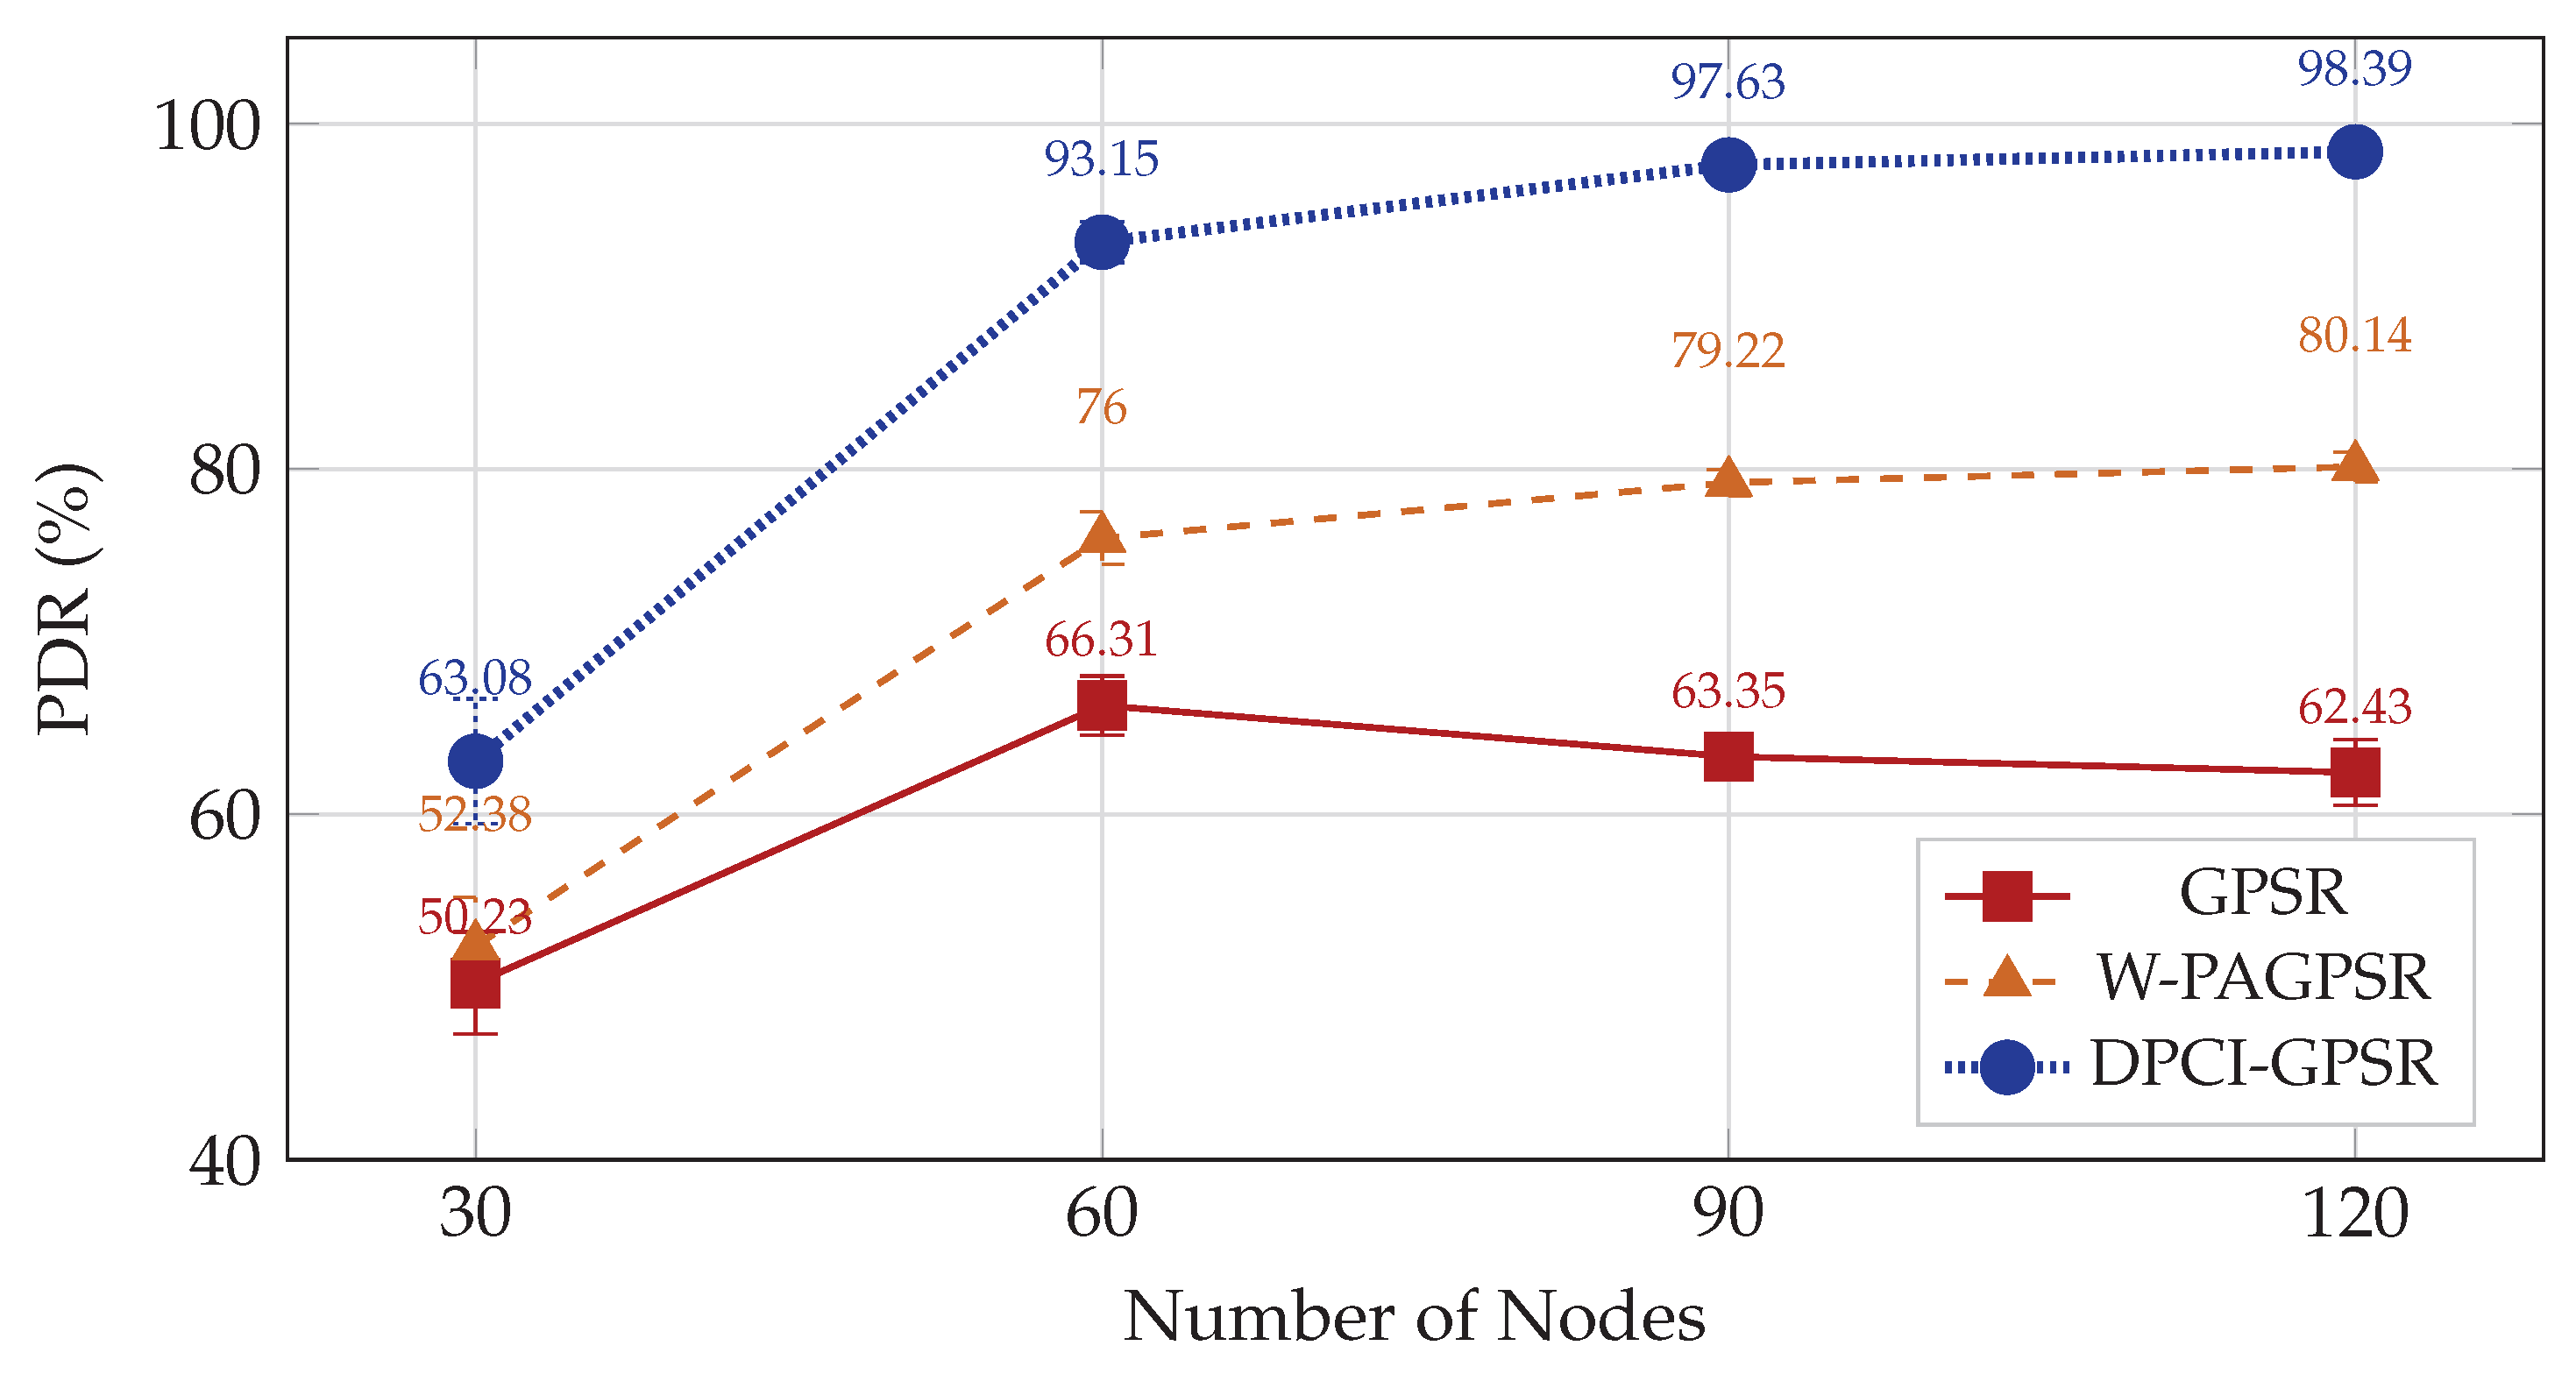
Under controlled mobility, DPCI-GPSR achieves the highest PDR at all four densities, recording 63.08%, 93.15%, 97.63%, and 98.39% at 30, 60, 90, and 120 nodes; W-PAGPSR records 52.38%, 76.00%, 79.22%, and 80.14%; and GPSR records 50.23%, 66.31%, 63.35%, and 62.43%. The 95% CI half-widths for DPCI-GPSR are 3.61, 1.18, 0.61, and 0.47 pp, narrowing as density increases. Paired t-tests on the per-seed values yield p < 0.001 at all four densities for both DPCI-GPSR vs. GPSR and DPCI-GPSR vs. W-PAGPSR.
Under uncontrolled mobility, the absolute PDR levels are higher for all three protocols. DPCI-GPSR records 83.96%, 96.79%, 98.35%, and 99.03%; W-PAGPSR records 76.58%, 86.84%, 88.40%, and 88.96%; and GPSR records 75.49%, 81.59%, 81.52%, and 81.71%. DPCI-GPSR remains the highest at every density, with 95% CI half-widths of 1.89, 0.97, 0.65, and 0.22 pp. Paired t-tests yield p < 0.001 at all four densities.

5.2. End-to-End Delay and Its Relationship with PDR

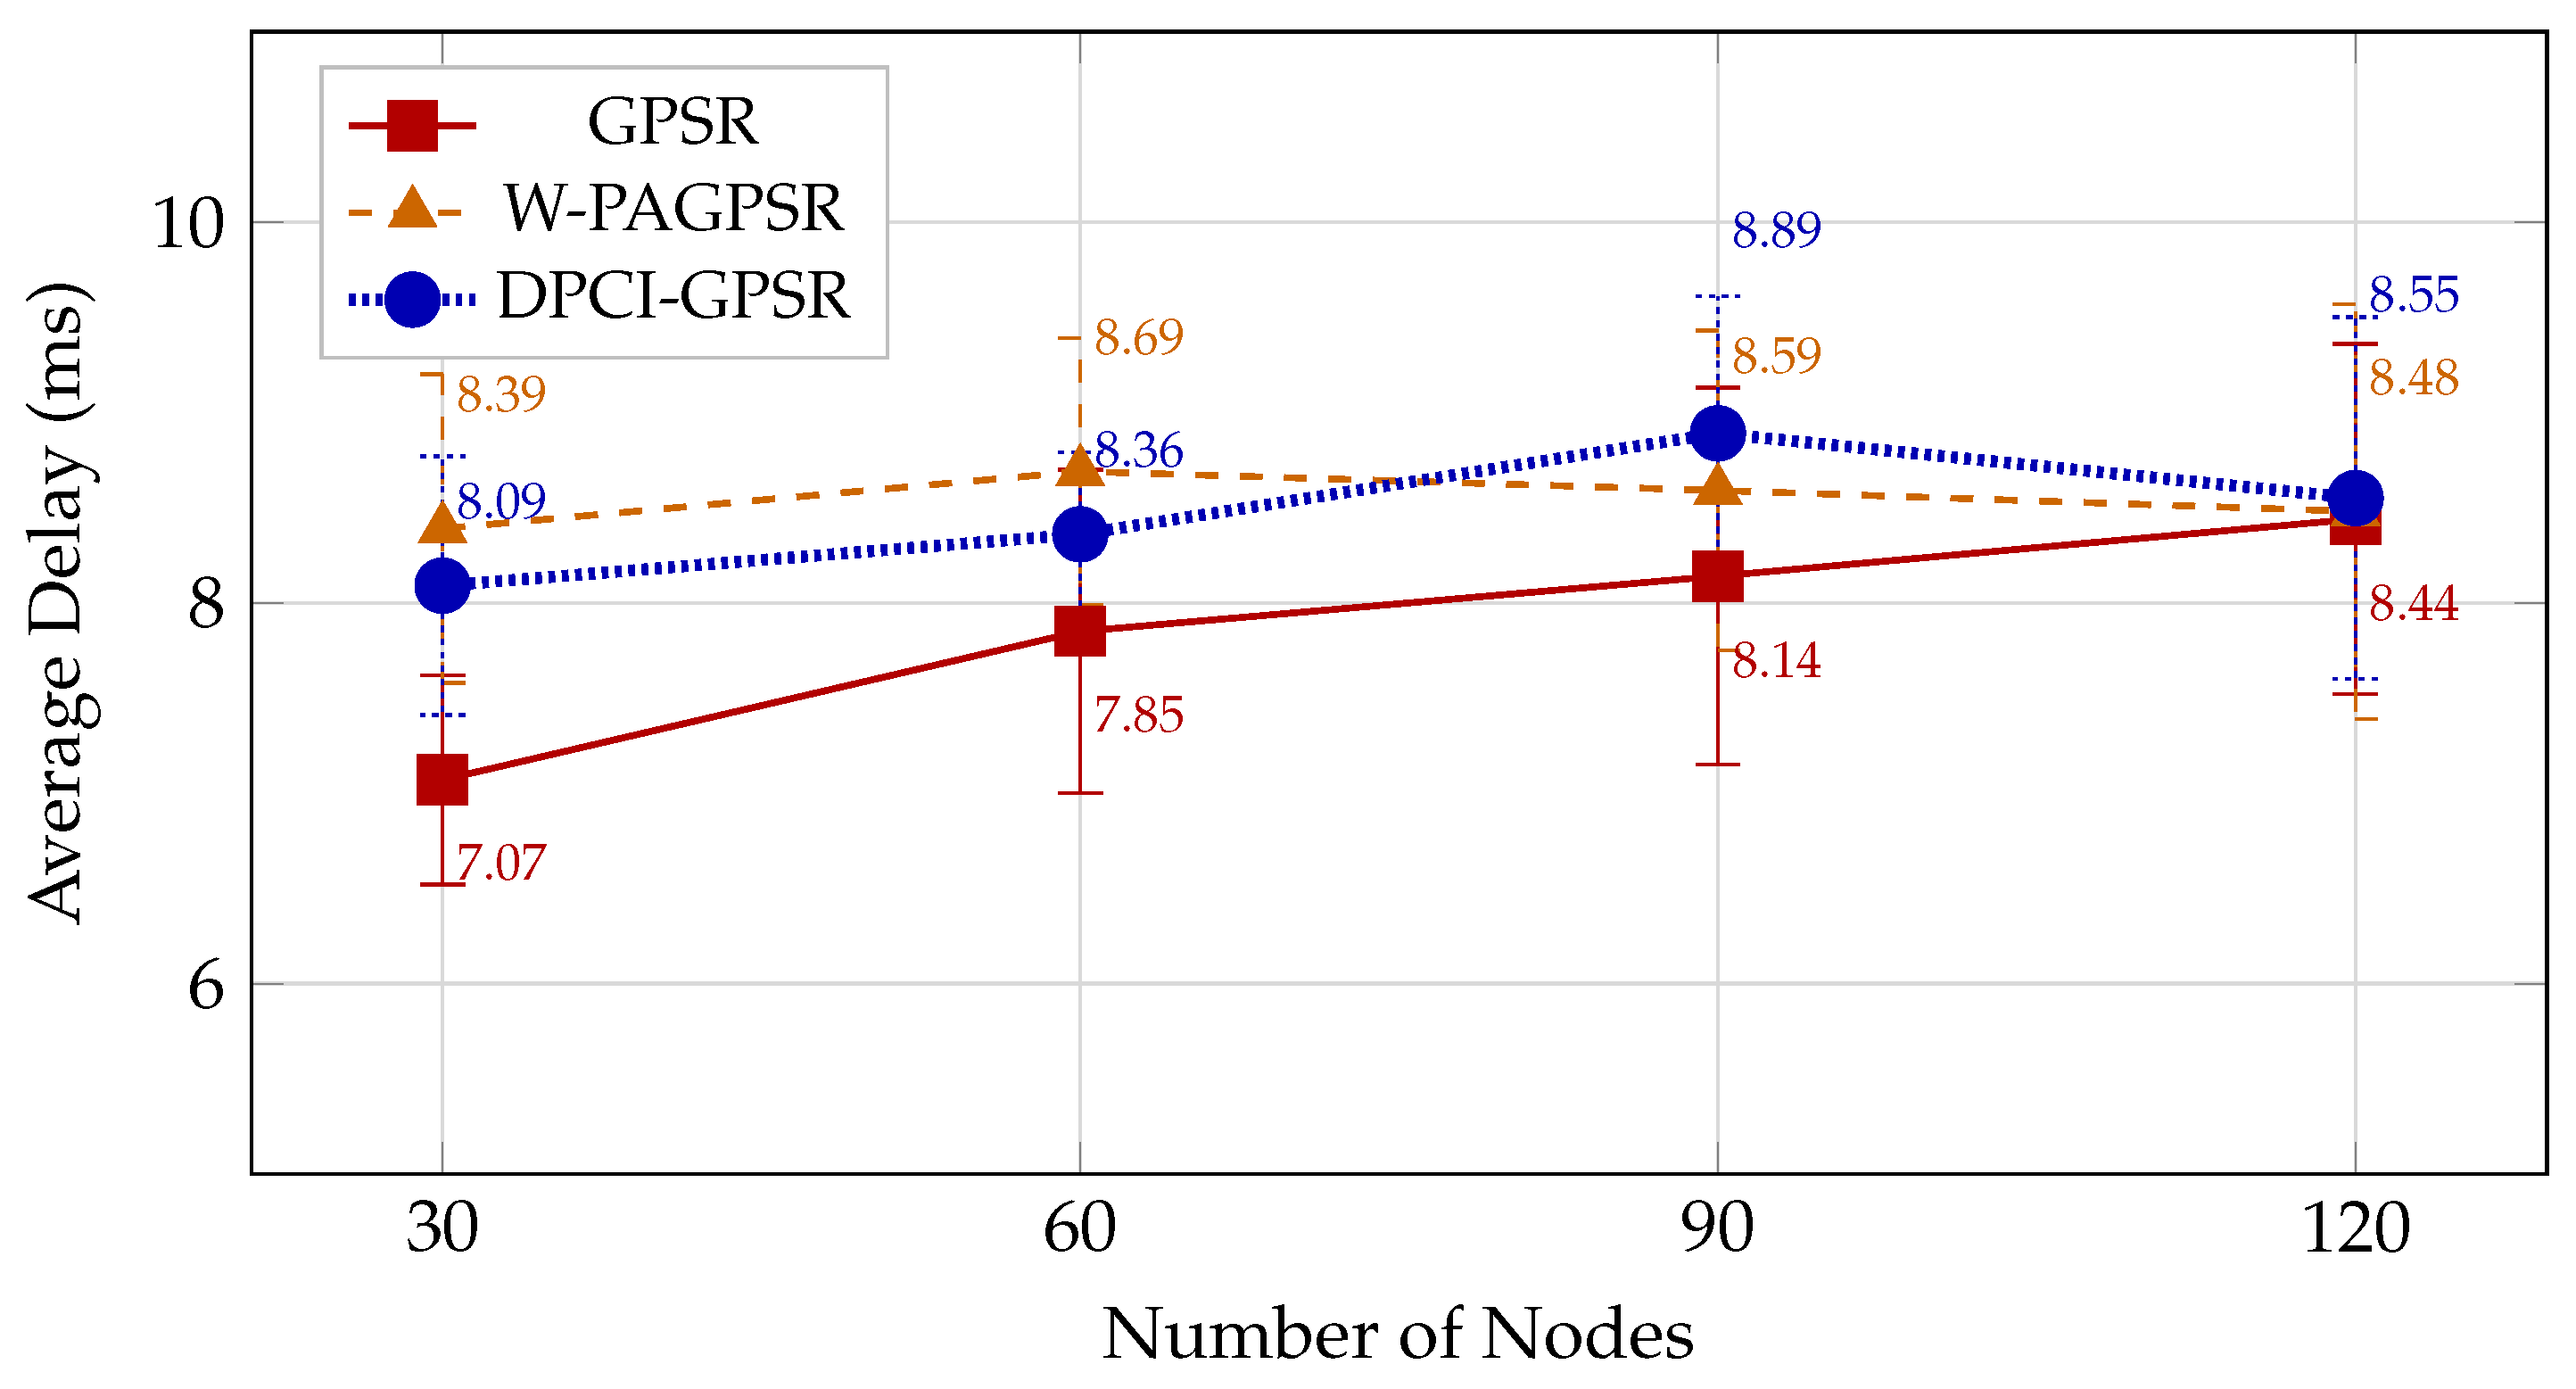
Figure 9 and Figure 10 present the average end-to-end delay for delivered packets under the two mobility settings.
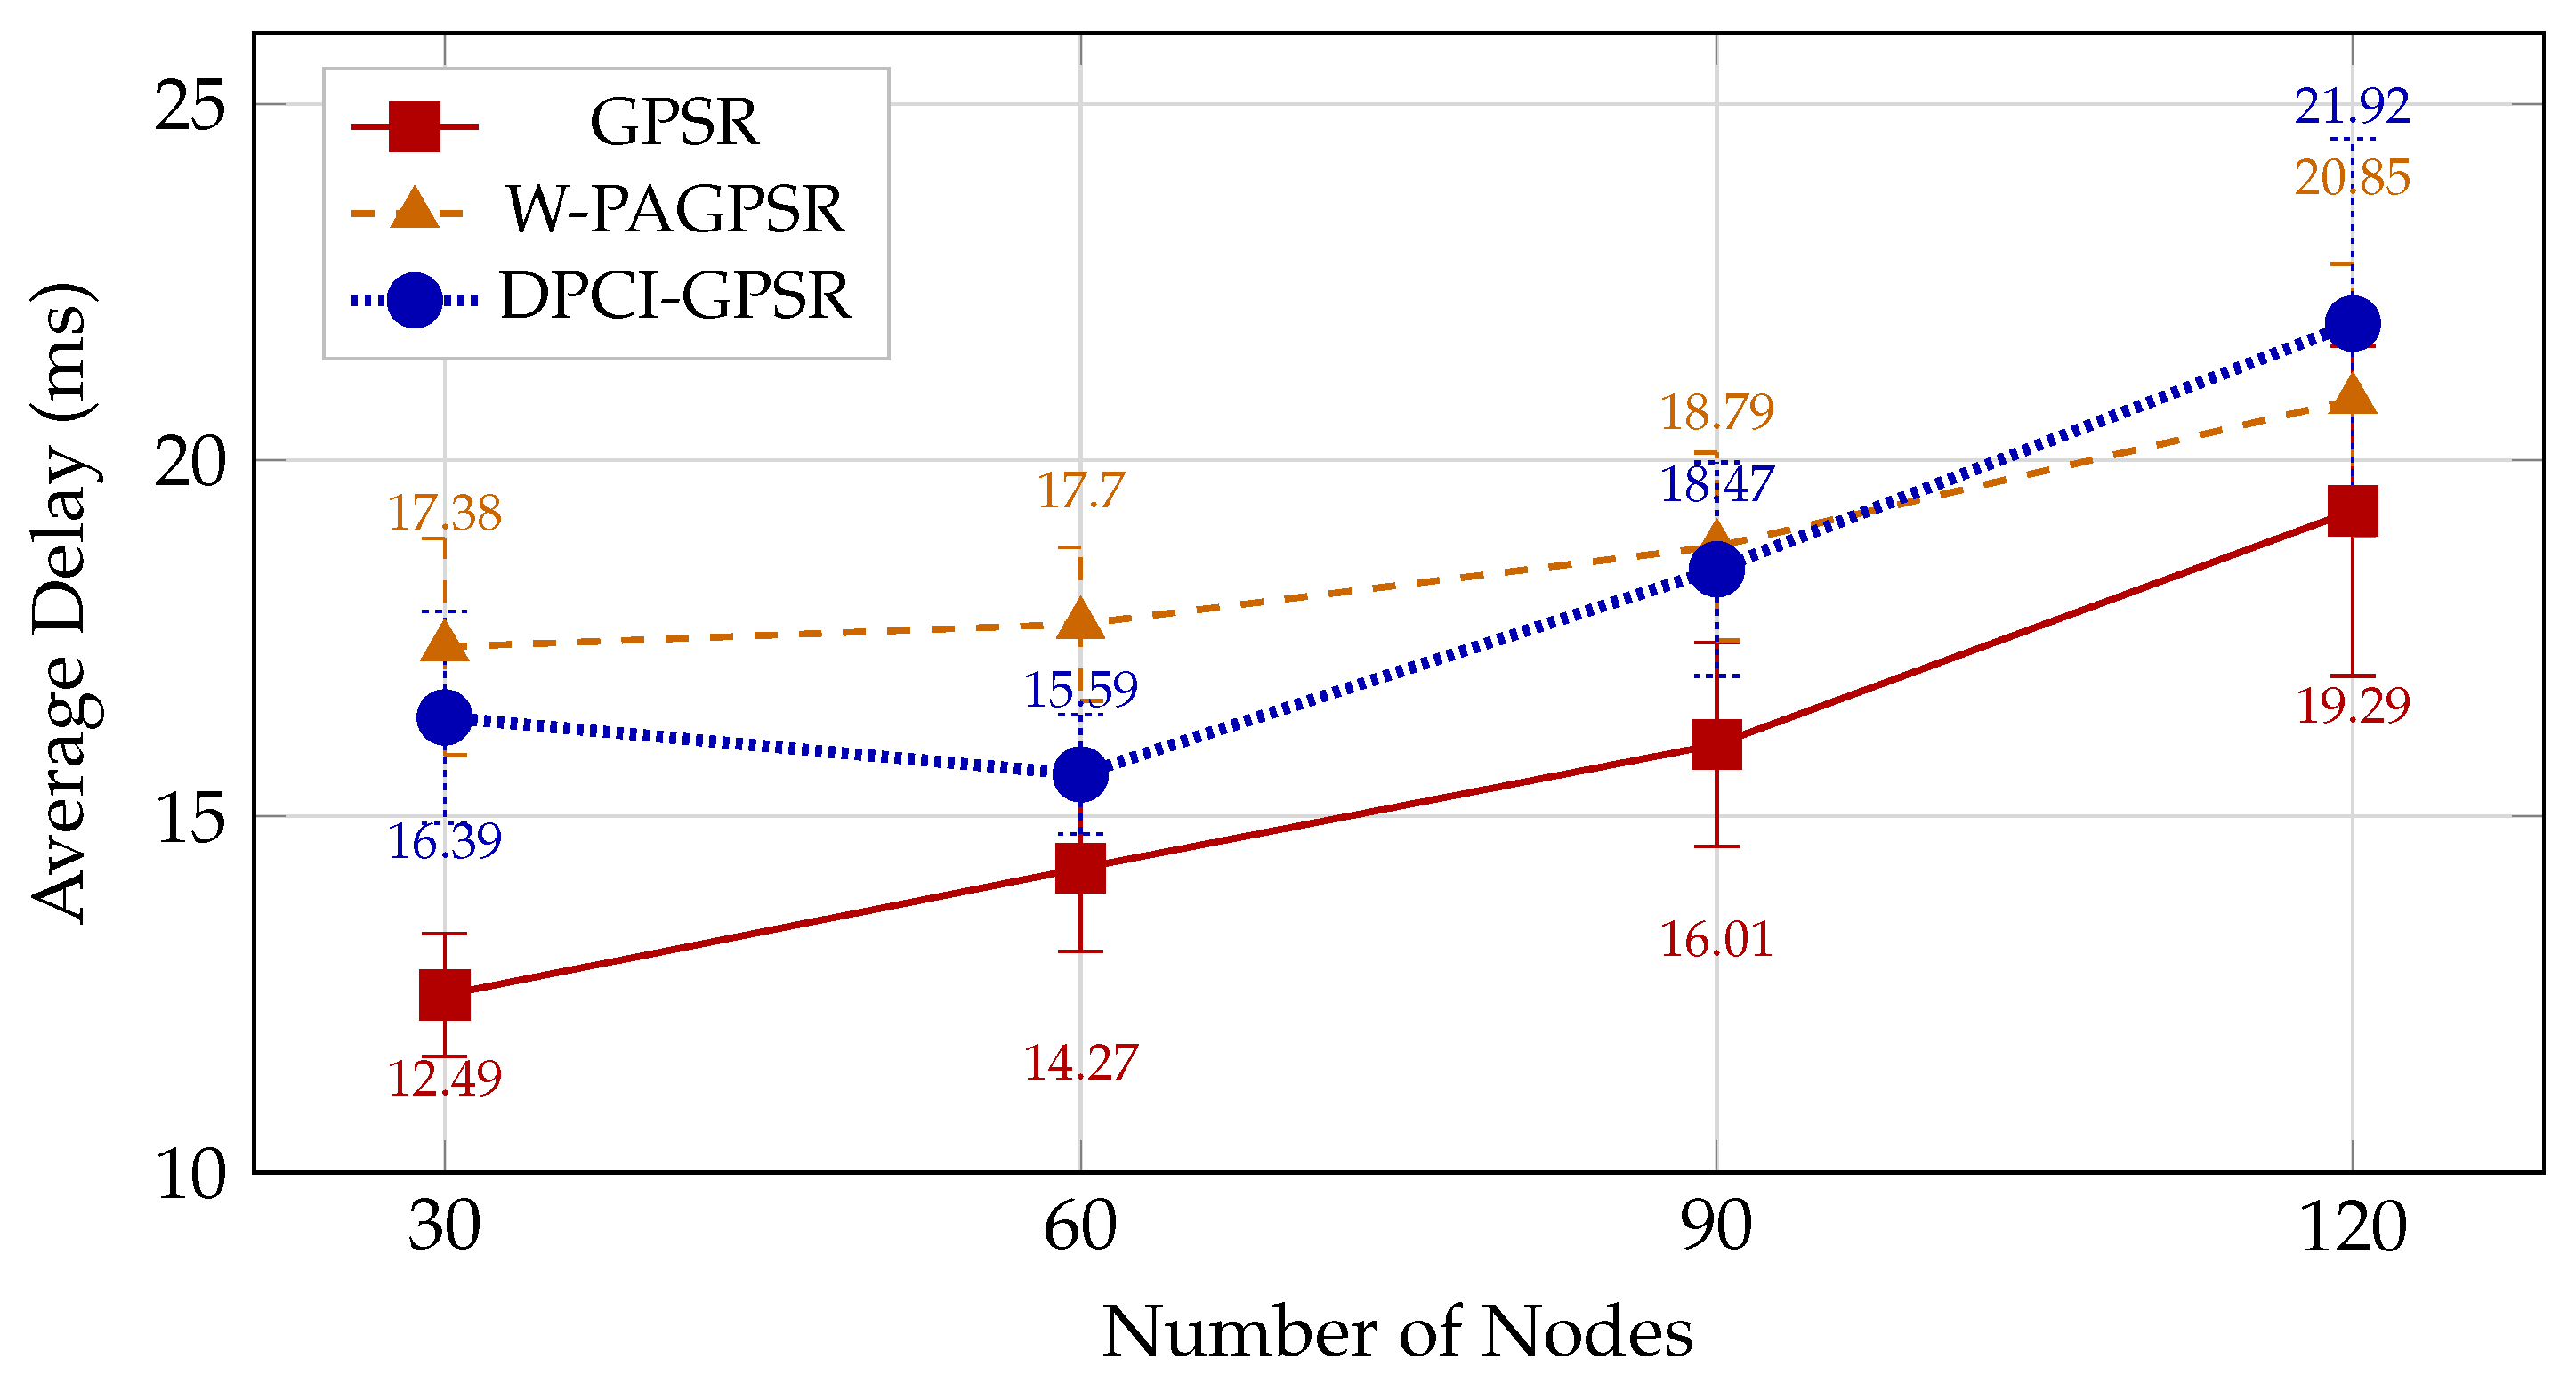
Under controlled mobility, average end-to-end delay ranges from 12.49 ms (GPSR at 30 nodes) to 21.92 ms (DPCI-GPSR at 120 nodes), increasing monotonically with density for all three protocols; GPSR records the lowest delay at every density. Under uncontrolled mobility, delay falls to 7.07–8.89 ms across all configurations. The relative ordering and statistical significance of inter-protocol differences are analyzed in Section 6.

5.3. Aggregate Throughput

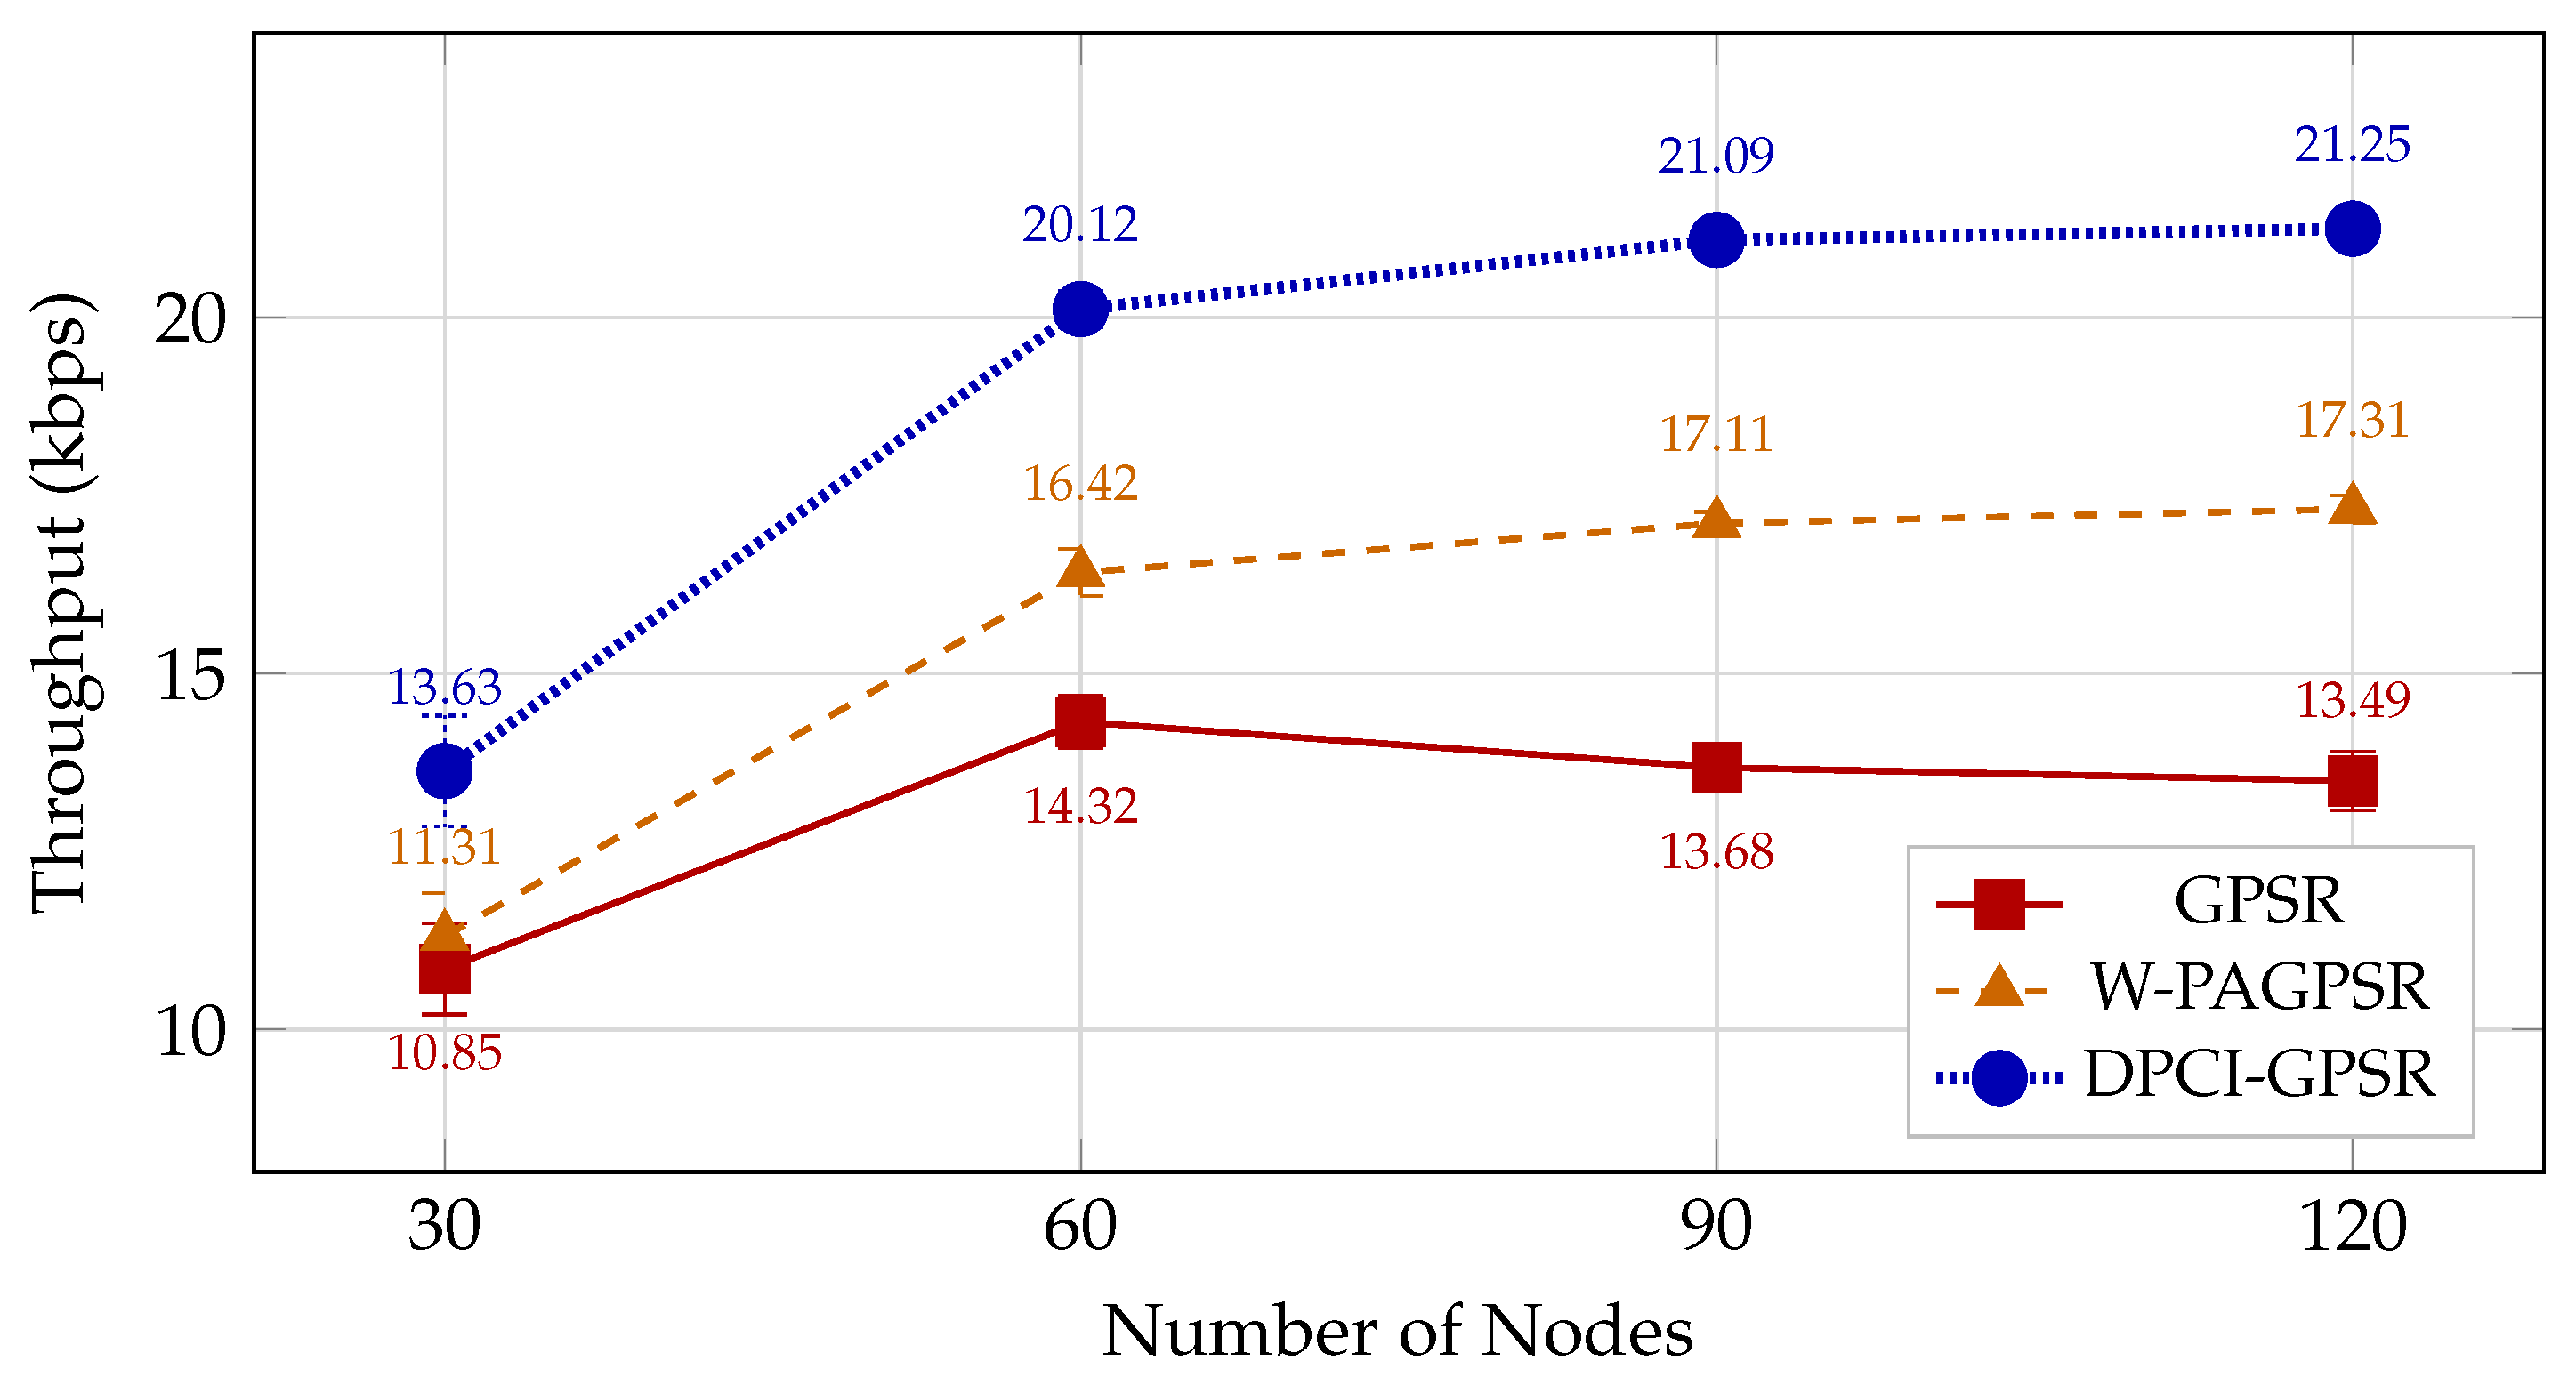
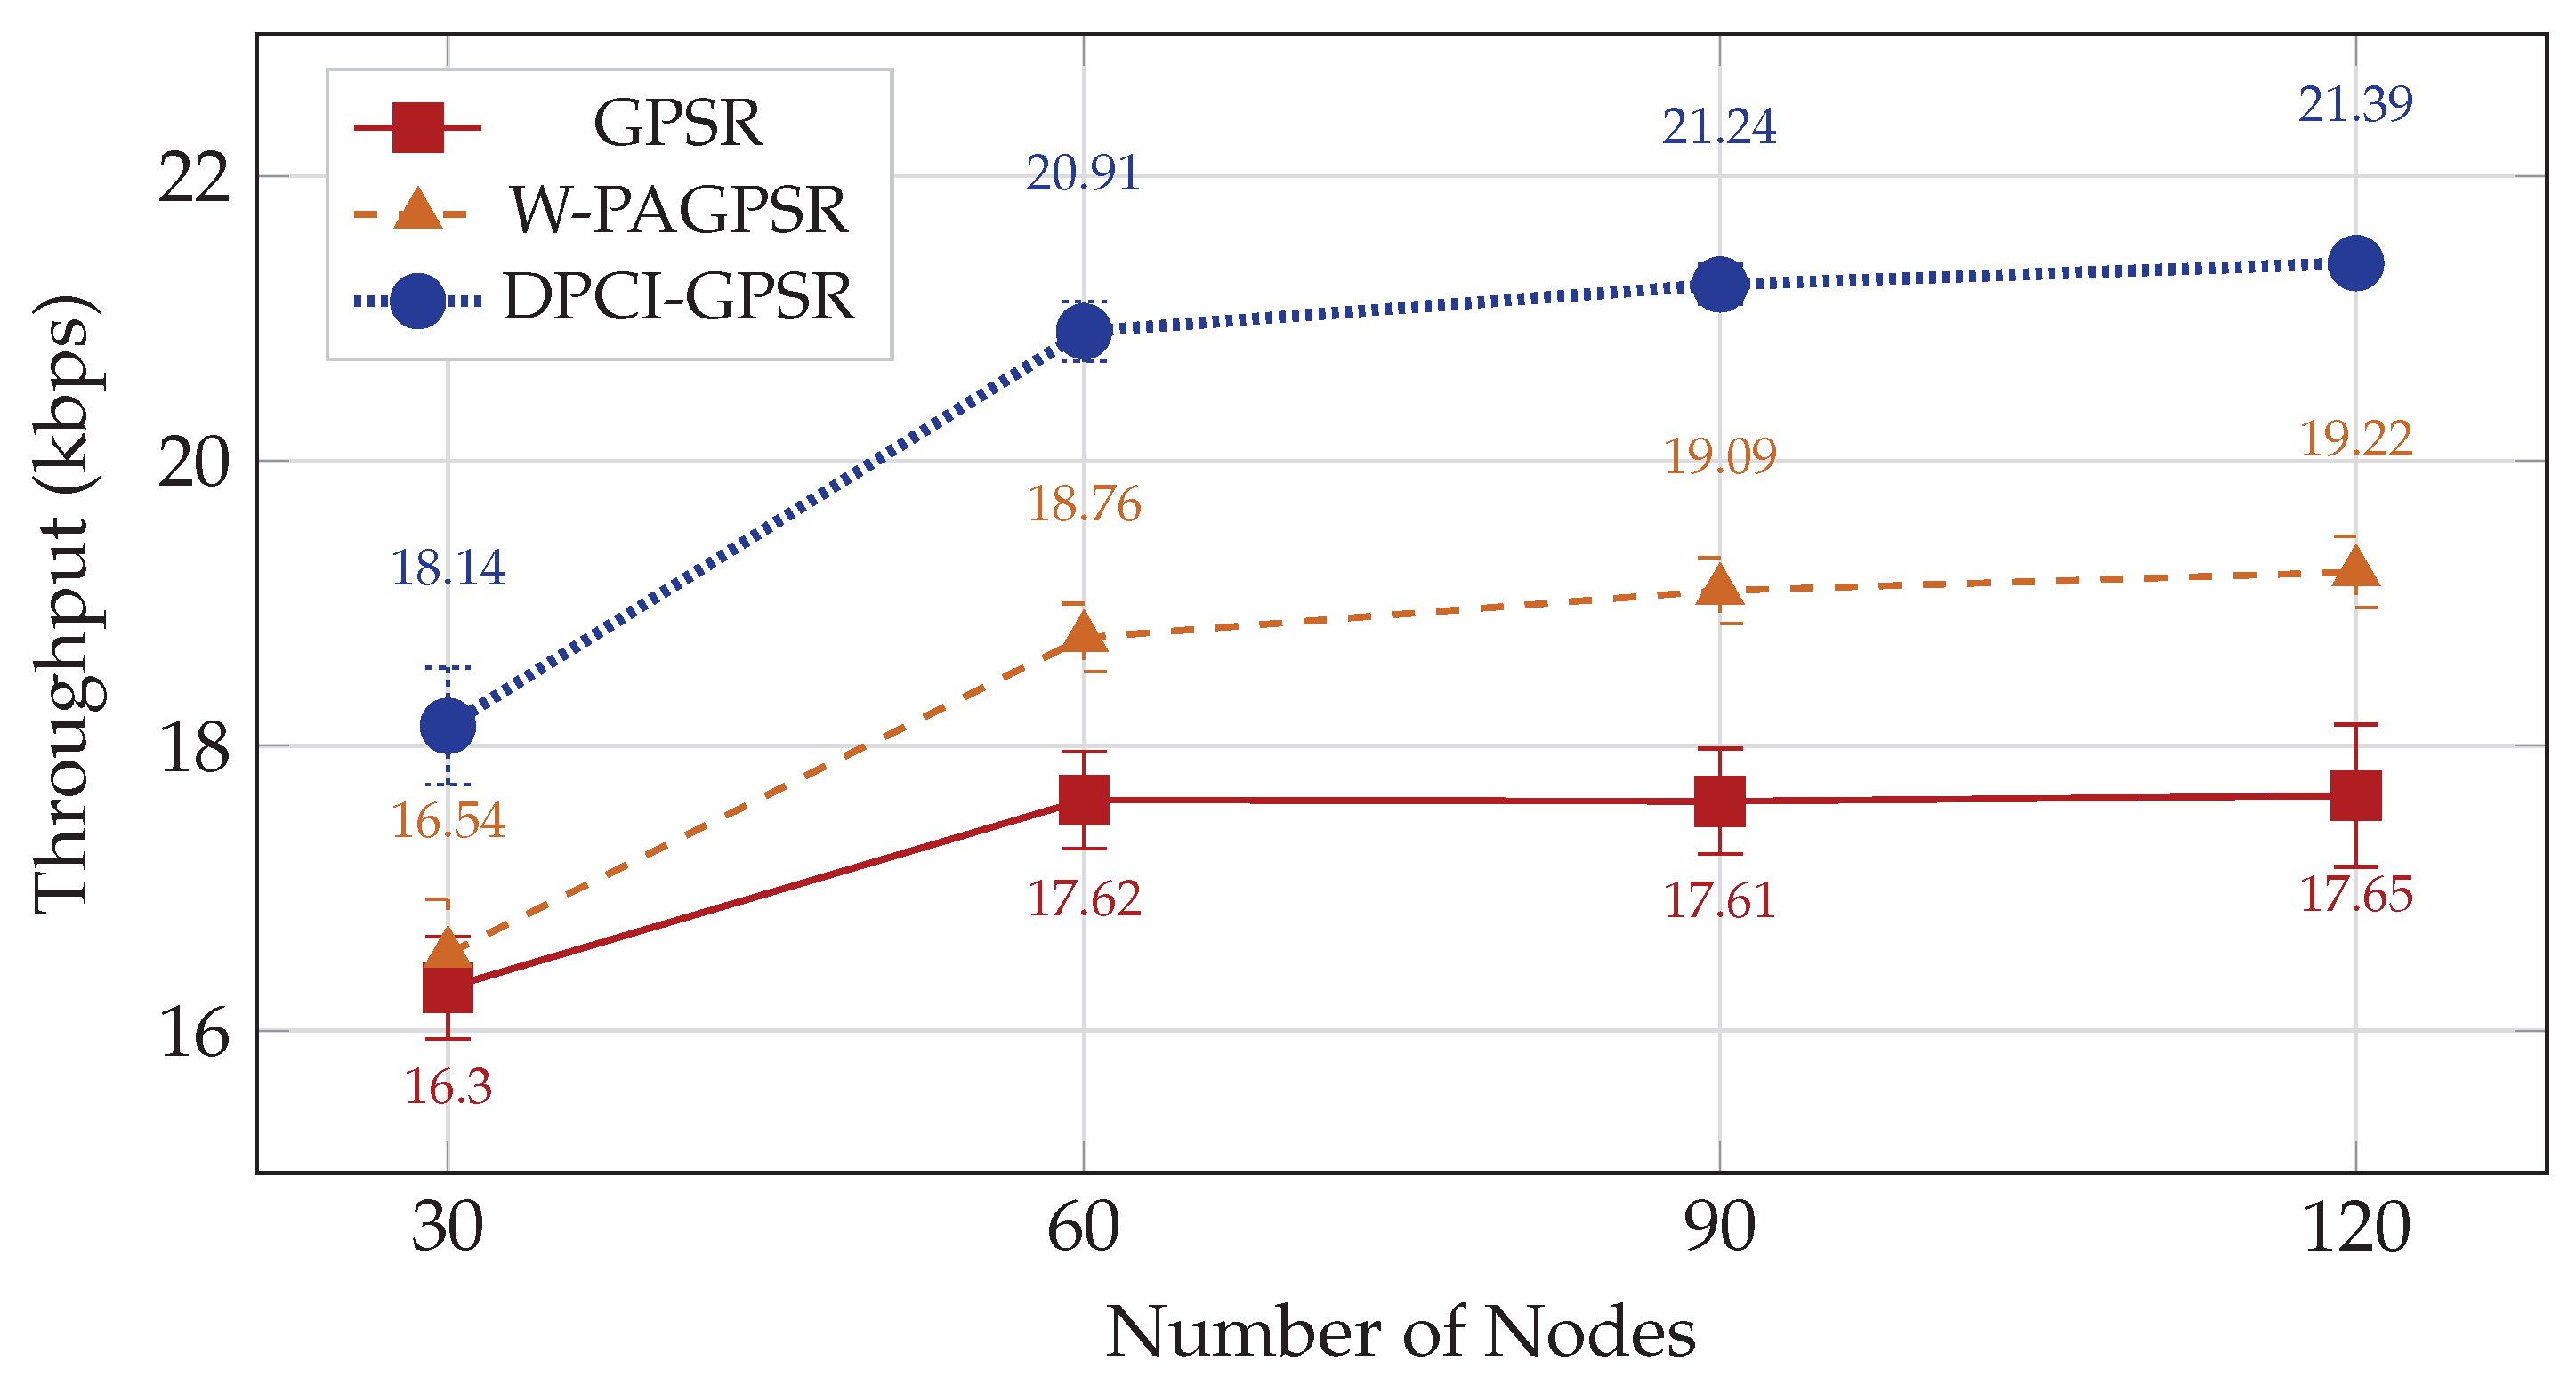
Figure 11 and Figure 12 present the aggregate throughput summed over the five sender–receiver pairs.
Under controlled mobility, DPCI-GPSR achieves the highest aggregate throughput at every density, recording 13.63, 20.12, 21.09, and 21.25 kbps at 30, 60, 90, and 120 nodes; W-PAGPSR records 11.31, 16.42, 17.11, and 17.31 kbps; and GPSR records 10.85, 14.32, 13.68, and 13.49 kbps. Under uncontrolled mobility, the throughput floor at 30 nodes is higher for all three protocols (16–18 kbps); DPCI-GPSR reaches 18.14, 20.91, 21.24, and 21.39 kbps; W-PAGPSR records 16.54, 18.76, 19.09, and 19.22 kbps; and GPSR records 16.30, 17.62, 17.61, and 17.65 kbps.

5.4. Computational and Communication Overhead

This subsection compares DPCI-GPSR with GPSR and W-PAGPSR on four overhead dimensions: per-Hello packet size, aggregate control channel throughput, per-decision computation, and per-node memory.
The Hello packet sizes are 18, 38, and 34 bytes for GPSR, W-PAGPSR, and DPCI-GPSR. At a 1 Hz beacon rate and 60 nodes, this yields control channel throughputs of 1.08, 2.28, and 2.04 KB/s, each below 0.5% of the 6 Mbps minimum IEEE 802.11p WAVE rate. Both the periodic DPCI computation and the two-pass next-hop selection are O ( N ) in the number of one-hop neighbors, the same order as W-PAGPSR’s weighted-sum decision, and the per-node memory footprint remains within a few kilobytes for typical neighbor-table sizes.
In summary, the overhead of DPCI-GPSR is of the same order of magnitude as both GPSR and W-PAGPSR across all four metrics, with the communication overhead (per-Hello payload and aggregate beacon throughput) being slightly lower than that of W-PAGPSR.

6. Discussion

6.1. PDR Behaviour Across Density and Mobility

Under controlled mobility, W-PAGPSR’s PDR rises from 76.00% at 60 nodes to 80.14% at 120 nodes and then plateaus, while DPCI-GPSR continues to scale (93.15%, 97.63%, 98.39% across the same range); the gap widens from 17.15 pp at 60 nodes to 18.25 pp at 120 nodes.
At 30 nodes, GPSR (50.23%) and W-PAGPSR (52.38%) have heavily overlapping 95% CIs, whereas DPCI-GPSR (63.08%) separates clearly from both baselines (gap of 4.28 pp from the upper bound of W-PAGPSR’s CI).
The same ordering holds under uncontrolled mobility, where DPCI-GPSR maintains a +9.95 to +10.07 pp advantage over W-PAGPSR at 60–120 nodes despite the higher absolute baseline.

6.2. Delay–PDR Trade-Off

GPSR shows the lowest mean delay at all densities, but with PDR only 50–66%, this average is computed over the delivered-only subset and is therefore subject to survivorship bias rather than being directly comparable to higher-PDR protocols. The fairer comparison is therefore between W-PAGPSR and DPCI-GPSR, both of which maintain above 75% PDR; their 95% CIs overlap at every density under uncontrolled mobility and at three of the four densities under controlled mobility.
The only statistically distinguishable difference is at 60 nodes under controlled mobility, where DPCI-GPSR achieves 15.59 ms versus 17.70 ms for W-PAGPSR with non-overlapping CIs. At 120 nodes, the mean ordering reverses—DPCI-GPSR’s 21.92 ms exceeds W-PAGPSR’s 20.85 ms by 1.07 ms—but the 95% CIs overlap, so this difference is not statistically significant; the modest mean gap is acceptable given the 18.25 pp PDR gain at the same density.
The 2–3-fold absolute-delay gap between the controlled (12.49–21.92 ms) and uncontrolled (7.07–8.89 ms) settings is structural: the enforced > 600 m sender–receiver separation requires 2–3 hops under the 250 m communication range, while uncontrolled mobility frequently allows direct one-hop delivery.

6.3. Throughput

Aggregate throughput tracks PDR closely under the constant 5-pair offered load (each pair sending one 512-byte packet per second). DPCI-GPSR records the highest throughput at every density in both mobility settings, reaching 21.25 kbps at 120 nodes under controlled mobility and 21.39 kbps at 120 nodes under uncontrolled mobility.

7. Conclusions

7.1. Summary

This paper presented DPCI-GPSR, which enhances GPSR’s greedy forwarding through (i) a trapezoidal LQ function that penalizes unreliable edge-zone neighbors and (ii) an eight-direction DPCI exchanged via Hello packets that provides two-hop forwarding awareness.
Across 30–120 nodes under both controlled and uncontrolled SUMO mobility, DPCI-GPSR consistently achieves the highest PDR. In the more demanding controlled setting (>600 m enforced sender–receiver separation), DPCI-GPSR reaches 98.39% PDR at 120 nodes versus 80.14% for W-PAGPSR and 62.43% for GPSR, with 21.25 kbps aggregate throughput; the corresponding end-to-end delay is within 1.07 ms of W-PAGPSR. Under uncontrolled mobility, the absolute margins are smaller, but DPCI-GPSR remains the highest in PDR and throughput at every density.
All conclusions are drawn from a single 1000 m by 1000 m grid topology under fixed weighting parameters; the two-mobility design (controlled and uncontrolled) is the principal stress test of the present work.

7.2. Future Work

Two complementary directions are identified for future work. First, future work will extend the evaluation of DPCI-GPSR to real city road networks, with systematic fusion and ablation studies that jointly consider DPCI scores, inter-node distance, and the LQ function to clarify the optimal combination of the directional propagation metric, the original GPSR greedy criterion, and the edge-zone reliability constraint.
Second, the eight-direction DPCI vector, which jointly encodes maximum reach and neighbor redundancy per sector (Equations (5)–(8)), is well suited as a state representation for deep reinforcement learning forwarding policies. Following the Dueling Deep Q-Network (DQN) formulation of DLGR-2DQ [24], a learning agent can dynamically re-weight the eight DPCI directions to replace the trapezoidal LQ function and the fixed composite utility, aiming to substantially improve delivery performance in low-density scenarios while preserving the strong PDR achieved at higher densities.

Author Contributions

Conceptualization, Y.L.; methodology, Y.L.; software, Y.L.; validation, Y.L., D.Z.A.-H. and X.J.L.; formal analysis, Y.L.; investigation, Y.L.; resources, X.J.L.; data curation, Y.L.; writing—original draft preparation, Y.L.; writing—review and editing, D.Z.A.-H. and X.J.L.; visualization, Y.L.; supervision, D.Z.A.-H. and X.J.L.; project administration, X.J.L. All authors have read and agreed to the published version of the manuscript.

Funding

This research received no external funding.

Institutional Review Board Statement

Not applicable.

Informed Consent Statement

Not applicable.

Data Availability Statement

The simulation data presented in this study are available on request from the corresponding author.

Acknowledgments

The authors would like to thank the Auckland University of Technology for providing the research facilities used in this study.

Conflicts of Interest

The authors declare no conflicts of interest.

References

  1. Zhang, W.; Jiang, L.; Song, X.; Shao, Z. Weight-Based PA-GPSR Protocol Improvement Method in VANET. Sensors 2023, 23, 5991. [Google Scholar] [CrossRef]
  2. Katsaros, K.; Dianati, M.; Tafazolli, R.; Kernchen, R. CLWPR—A Novel Cross-Layer Optimized Position Based Routing Protocol for VANETs. In Proceedings of the IEEE Vehicular Networking Conference (VNC), Amsterdam, The Netherlands, 14–16 November 2011; pp. 139–146. [Google Scholar]
  3. Smiri, S.; Ben Abbou, A.; Boushaba, A.; Zahi, A.; Ben Abbou, R. WA-GPSR: Weight-Aware GPSR-Based Routing Protocol for VANET. Int. J. Interact. Mob. Technol. 2021, 15, 69–83. [Google Scholar] [CrossRef]
  4. Bouras, C.; Kapoulas, V.; Tsanai, E. A GPSR Enhancement Mechanism for Routing in VANETs. In Proceedings of the 13th International Conference on Wired/Wireless Internet Communication (WWIC), Malaga, Spain, 25–27 May 2015; pp. 94–107. [Google Scholar]
  5. Yang, X.; Li, M.; Qian, Z.; Di, T. Improvement of GPSR Protocol in Vehicular Ad Hoc Network. IEEE Access 2018, 6, 39515–39524. [Google Scholar] [CrossRef]
  6. Silva, A.; Niaz Reza, K.M.; Oliveira, A. An Adaptive GPSR Routing Protocol for VANETs. In Proceedings of the 15th International Symposium on Wireless Communication Systems (ISWCS), Lisbon, Portugal, 28–31 August 2018; pp. 1–6. [Google Scholar]
  7. Karp, B.; Kung, H.T. GPSR: Greedy Perimeter Stateless Routing for Wireless Networks. In Proceedings of the ACM MobiCom, Boston, MA, USA, 6–11 August 2000; pp. 243–254. [Google Scholar]
  8. Bengag, A.; Bengag, A.; El Boukhari, M. Enhancing GPSR Routing Protocol Based on Velocity and Density for Real-Time Urban Scenario. In Proceedings of the International Conference on Intelligent Systems and Computer Vision (ISCV), Fez, Morocco, 9–11 June 2020; pp. 1–5. [Google Scholar]
  9. Rao, S.A.; Pai, M.M.; Boussedjra, M.; Mouzna, J. GPSR-L: Greedy Perimeter Stateless Routing with Lifetime for VANETs. In Proceedings of the IEEE International Conference on ITS Telecommunications (ITST), Phuket, Thailand, 22–24 October 2008; pp. 299–304. [Google Scholar]
  10. Zhang, X.; Zhao, Q.; Zhang, T. Improved GPSR-SD Routing Protocol for VANET. J. Highw. Transp. Res. Dev. (Engl. Ed.) 2017, 11, 98–103. [Google Scholar] [CrossRef]
  11. Hu, L.; Ding, Z.; Shi, H. An Improved GPSR Routing Strategy in VANET. In Proceedings of the IEEE International Conference on Wireless Communications, Networking and Mobile Computing (WiCOM), Shanghai, China, 21–23 September 2012; pp. 1–4. [Google Scholar]
  12. Li, J.; Wang, P.; Wang, C. Comprehensive GPSR Routing in VANET Communications with Adaptive Beacon Interval. In Proceedings of the IEEE International Conference on Internet of Things (iThings), Chengdu, China, 15–18 December 2016; pp. 1–6. [Google Scholar]
  13. Zaimi, I.; Houssaini, Z.S.; Boushaba, A.; Oumsis, M. A New Improved GPSR (GPSR-kP) Routing Protocol for Multimedia Communication over Vehicular Ad Hoc Network. In Proceedings of the International Conference on Big Data and Advanced Wireless Technologies (BDAW), Blagoevgrad, Bulgaria, 10–11 November 2016; pp. 1–7. [Google Scholar]
  14. Tho, M.C.; Binh, L.H.; Vo, T.T. GPSR-CB: A Novel Routing Algorithm for FANET Using Cross-Layer Models in Combination with Multi-Level Backbone UAV. Ad Hoc Netw. 2025, 173, 103828. [Google Scholar] [CrossRef]
  15. Moreira, R.T.D.; Medeiros, D.S.V. A Location-Aware and Greedy Cross-Layer Routing Protocol for Flying Ad-hoc Networks. J. Braz. Comput. Soc. 2024, 30, 688–701. [Google Scholar] [CrossRef]
  16. Cherifi, I.; Mekkakia Maaza, Z. Link Failure Tolerant GPSR Protocol. Int. J. Netw. Distrib. Comput. 2021, 9, 94–104. [Google Scholar] [CrossRef]
  17. Rodrigues, A.; Reis, A.B.; Sargento, S. GPSR-PPU: Greedy Perimeter Stateless Routing with Position Prediction and Uncertainty for FANETs. In Proceedings of the IEEE International Conference on Pervasive Computing and Communications Workshops (PerCom Workshops), Austin, TX, USA, 23–27 March 2020; pp. 1–6. [Google Scholar]
  18. Wang, Z.; Ruan, Y.; Li, Y.; Li, T.; Zhang, R.; Liang, J. KOGPSR: A 3D GPSR Algorithm Using Adaptive Kalman Prediction for FANETs with Omnidirectional Antenna. J. Inf. Intell. 2024, 2, 191–208. [Google Scholar] [CrossRef]
  19. Yang, Z.; Xiong, Y.; Shangguan, Y.; Wang, Z.; Yin, Y. A GPSR Protocol Based on Mobile Prediction and Node Stability. In Proceedings of the International Conference on Power Electronics and Artificial Intelligence (PEAI), Xiamen, China, 19–21 January 2024; pp. 449–456. [Google Scholar]
  20. Lyu, N.; Song, G.; Yang, B.; Cheng, Y. QNGPSR: A Q-Network Enhanced Geographic Ad-Hoc Routing Protocol Based on GPSR. In Proceedings of the IEEE 88th Vehicular Technology Conference (VTC-Fall), Chicago, IL, USA, 27–30 August 2018; pp. 1–6. [Google Scholar]
  21. Chen, Y.; Lyu, N.; Song, G.; Yang, B.; Jiang, X. A Traffic-Aware Q-Network Enhanced Routing Protocol Based on GPSR for Unmanned Aerial Vehicle Ad-Hoc Networks. Front. Inform. Technol. Electron. Eng. 2020, 21, 1308–1320. [Google Scholar] [CrossRef]
  22. Wu, M.; Jiang, B.; Chen, S.; Xu, H.; Pang, T.; Gao, M.; Xia, F. Traj-Q-GPSR: A Trajectory-Informed and Q-Learning Enhanced GPSR Protocol for Mission-Oriented FANETs. Drones 2025, 9, 489. [Google Scholar] [CrossRef]
  23. Chen, H.; Luo, F.; Zhou, J.; Dong, Y. Multi-Objective Optimized GPSR Intelligent Routing Protocol for UAV Clusters. Mathematics 2024, 12, 2672. [Google Scholar] [CrossRef]
  24. Zhang, Y.; Qiu, H. Delay-Aware and Link-Quality-Aware Geographical Routing Protocol for UANET via Dueling Deep Q-Network. Sensors 2023, 23, 3024. [Google Scholar] [CrossRef] [PubMed]
  25. Pavan Kumar, M.V.N.R.; Hariharan, R. Improved Trustworthy, Speed, and Energy-Efficient GPSR Routing Algorithm in Large-Scale WSN. Meas. Sens. 2022, 24, 100576. [Google Scholar] [CrossRef]
  26. Shrivastava, K.; Jain, S.K. Enhanced Greedy Perimeter Stateless Routing Protocol (E-GPSR). Int. J. Eng. Res. Technol. 2012, 1, 1–8. [Google Scholar]
  27. Samundiswary, P.; Sathian, D.; Dananjayan, P. Secured Greedy Perimeter Stateless Routing for Wireless Sensor Networks. Int. J. Ad. Hoc Sens. Ubiquitous Comput. 2010, 1, 9–20. [Google Scholar]
  28. Houmer, M.; Ouaissa, M.; Ouaissa, M.; Hasnaoui, M.L. SE-GPSR: Secured and Enhanced Greedy Perimeter Stateless Routing Protocol for Vehicular Ad Hoc Networks. Int. J. Interact. Mob. Technol. 2020, 14, 48–64. [Google Scholar] [CrossRef]
  29. Yang, D.; Xia, H.; Xu, E.; Jing, D.; Zhang, H. An Energy-Balanced Geographic Routing Algorithm for Mobile Ad Hoc Networks. Energies 2018, 11, 2219. [Google Scholar] [CrossRef]
  30. Sun, Y.; Guo, J.; Yao, Y. Speed Up-Greedy Perimeter Stateless Routing Protocol for Wireless Sensor Networks (SU-GPSR). In Proceedings of the IEEE 18th International Conference on High Performance Switching and Routing (HPSR), Campinas, Brazil, 18–21 June 2017; pp. 1–6. [Google Scholar]
  31. Hosseinzadeh, M.; Husari, F.M.; Yousefpoor, M.S.; Lansky, J.; Min, H. A Local Filtering-Based Energy-Aware Routing Scheme in Flying Ad Hoc Networks. Sci. Rep. 2024, 14, 17733. [Google Scholar] [CrossRef]
  32. Silva, A.; Niaz Reza, K.M.; Oliveira, A. Improvement and Performance Evaluation of GPSR-Based Routing Techniques for Vehicular Ad Hoc Networks. IEEE Access 2019, 7, 21722–21733. [Google Scholar] [CrossRef]
  33. Lee, K.C.; Haerri, J.; Lee, U.; Gerla, M. Enhanced Perimeter Routing for Geographic Forwarding Protocols in Urban Vehicular Scenarios. In Proceedings of the IEEE Globecom Workshops, Washington, DC, USA, 26–30 November 2007; pp. 1–10. [Google Scholar]
  34. Cheng, P.-C.; Lee, K.C.; Gerla, M.; Härri, J. GeoDTN+Nav: Geographic DTN Routing with Navigator Prediction for Urban Vehicular Environments. Mob. Netw. Appl. 2010, 15, 61–82. [Google Scholar] [CrossRef]
  35. Lochert, C.; Mauve, M.; Fussler, H.; Hartenstein, H. Geographic Routing in City Scenarios. ACM SIGMOBILE Mob. Comput. Commun. Rev. 2005, 9, 69–72. [Google Scholar] [CrossRef]
  36. Al-Essa, R.I.; Al-Suhail, G.A. AFB-GPSR: Adaptive Beaconing Strategy Based on Fuzzy Logic Scheme for Geographical Routing in a Mobile Ad Hoc Network (MANET). Computation 2023, 11, 174. [Google Scholar] [CrossRef]
  37. Alsalami, O.M.; Yousefpoor, E.; Hosseinzadeh, M.; Lansky, J. A Novel Optimized Link-State Routing Scheme with Greedy and Perimeter Forwarding Capability in Flying Ad Hoc Networks. Mathematics 2024, 12, 1016. [Google Scholar] [CrossRef]
Figure 1. Motivating scenario: routing path comparison between standard GPSR and DPCI-GPSR in a six-node VANET topology.
Electronics 15 02172 g001
Figure 2. Eight-direction sector model. The 360° plane around the current node S is partitioned into eight equal sectors of 45° each, centered at the cardinal and intercardinal directions.
Electronics 15 02172 g002
Figure 3. Directional weight example between nodes S and D. Only three sectors toward the destination receive non-zero cosine decay weights (E: w = 0.414 , NE/SE: w = 0.293 ). Sectors beyond ±67.5° from d main are clamped to zero and omitted.
Electronics 15 02172 g003
Figure 4. Trapezoidal LQ function LQ ( d S N ) . Four zones: hop waste penalty (0–30 m), optimal transmission zone (30–200 m, LQ = 1.0 ), rapid decay (200–220 m), and edge penalty (220–250 m, LQ 0 ).
Electronics 15 02172 g004
Figure 5. Network topology of the 30-node scenario (seed 1), showing the five sender–receiver communication pairs (colored) and relay vehicles.
Electronics 15 02172 g005
Figure 6. Controlled vs. no-control sender–receiver distance validation. (a) Percentage of time within 250 m direct communication range. (b) ≥600 m compliance rate.
Electronics 15 02172 g006
Figure 7. Average PDR (%) under controlled mobility (15-seed average, 95% CI).
Electronics 15 02172 g007
Figure 8. Average PDR (%) under uncontrolled mobility (15-seed average, 95% CI).
Electronics 15 02172 g008
Figure 9. Average end-to-end delay (ms) under controlled mobility (15-seed average, 95% CI).
Electronics 15 02172 g009
Figure 10. Average end-to-end delay (ms) under uncontrolled mobility (15-seed average, 95% CI).
Electronics 15 02172 g010
Figure 11. Aggregate throughput (kbps) under controlled mobility (15-seed average, 95% CI).
Electronics 15 02172 g011
Figure 12. Aggregate throughput (kbps) under uncontrolled mobility (15-seed average, 95% CI).
Electronics 15 02172 g012
Table 1. Summary of reviewed GPSR-based routing protocols.
ProtocolRef.Sub-CategoryKey MethodDomainPerim.Key Results
GPSR[7]OriginalGreedy + right-hand ruleMANETBaseline
Weighted: Link Stability & Duration
MM-GPSR[5]DurationCumul. duration + min angleVANETPDR ↑, Delay ↓
GPSR-L[9]LifetimeLifetime from 6 velocity casesVANETPDR ↑ 20–40%
Weighted: Multi-Criteria Formula
WA-GPSR[3]Multi-weightLLT + duration + density + mobilityVANETPDR ↑, Delay ↓
W-PAGPSR[1]CRITIC weightDist. + dir. + density + durationVANETPLR ↓ 24%, Delay ↓ 48%
GPSR-M[4]EnhancedUrban + highway adaptationVANETPDR ↑
DVA-GPSR[8]Multi-weightDist. + speed + density + angleVANETPDR ↑, Tput ↑
Weighted: Density & Traffic Filtering
GPSR-SD[10]Density filterSpeed–density modelVANETPDR ↑, Delay ↓
Hu-GPSR[11]PriorityPriority flag + speed/dist. prob.VANETReplacedPDR ↑, Ovhd ↓
CoD-GPSR[12]AdaptiveCoD beacon + OinO selectionVANETOvhd ↓, Collision ↓
Weighted: Sequential Distribution
GPSR-kP[13]Sequentialk-neighbor sequential distributionVANETQoS ↑ (video)
Cross-Layer Link Quality
CLWPR[2]Cross-layerSNIR + MAC FER + queueVANETPDR ↑, Delay ↓
GPSR-CB[14]Cross-layerSNR + PER + ACK + backboneFANETPDR ↑, Tput ↑
GWPRP[15]Cross-layer3D + FER + queue + stabilityFANETPDR ↑, Ovhd ↓
Position Prediction
PP-GPSR[16]LinearLinear extrapolation + thresholdVANETPDR ↑, Delay ↓
GPSR-PPU[17]UncertaintyVelocity pred. + uncertainty var.FANETPDR ↑ 15%, Jitter ↓ 42%
KOGPSR[18]Kalman3D Kalman + antenna modelFANETReplacedPDR ↑, Delay ↓
GPSR-MPNS[19]ScreeningNode screening + LLT + 2-hopFANETDelay ↓ 57%, PLR ↓ 22%
Other Categories
QNGPSR[20]RLDeep Q-networkMANETModifiedPDR ↑
DDQN-MTGPSR[23]RLDDQN multi-objective opt.FANETPDR ↑, Delay ↓
EM-GPSR[29]EnergyEnergy balance + remaining lifetimeMANETEnergy ↑, PDR ↑
SU-GPSR[30]EnergySpeed-up mode + energy harvestingWSNReplacedEnergy ↑, PDR ↑
S-GPSR[27]SecurityTrust-based defenseWSNSecurity ↑
SE-GPSR[28]SecurityDH + HMAC auth.VANETSecurity ↑
AGPSR[6]Path-awareTrust status + cont. greedyVANETReplacedPDR ↑, Delay ↓
PA-GPSR[32]Path-awareDeny + Recently Sent TableVANETModifiedPDR ↑, Delay ↓
GpsrJ+[33]UrbanJunction prediction + bypassVANETHops ↓
GPCR[35]UrbanJunction coordinatorVANETModifiedPDR ↑
GeoDTN + Nav[34]Urban + DTNNav prediction + DTN hybridVANETPDR ↑ (sparse)
AFB-GPSR[36]BeaconFuzzy adaptive beaconingMANETOvhd ↓ 35%
OLSR + GPSR[37]HybridOLSR + GPSR + fuzzy helloFANETPDR ↑, Ovhd ↓
Table 2. Key inter-node distances in the motivating scenario.
FromToDistance (m)Within R max ?
Node 0Node 1236Yes (94.4%)
Node 0Node 3158Yes (63.2%)
Node 1Node 229Yes (11.6%)
Node 1Node 5340No
Node 3Node 5380No
Node 2Node 5324No
Node 3Node 4220Yes (88.0%)
Node 4Node 5180Yes (72.0%)
Node 0Node 5500No
Table 3. Simulation parameters.
ParameterValue
Map size1000 m × 1000 m
Grid layout6 × 6 intersections, 200 m spacing
Lanes1 per direction
Communication pairs5 (nodes 0–1, 2–3, 4–5, 6–7, 8–9)
Number of nodes30, 60, 90, 120
Pair node speed8.0 m/s (normal); 4.0/12.0 m/s (correction)
Relay node speedUniform [5.0, 15.0] m/s
Communication range ( R max )250 m
TX power28.5 dBm
Data rateOfdmRate3MbpsBW10MHz (Wireless Access in Vehicular Environments, WAVE)
Propagation modelTwoRayGround
MAC protocolIEEE 802.11p
Packet size512 bytes
Send interval1 s
Simulation duration500 s
Random seeds15 per configuration
θ df 0.55
γ (redundancy decay)2.0
Hello interval1 s
Table 4. Controlled vs. no-control sender–receiver distance comparison (15-seed average).
NodesAvg. Distance (m)Time < 250 m≥600 m Rate
ControlledNo ControlControlledNo ControlControlledNo Control
307574590.4%20.6%81.6%28.0%
607614460.4%22.3%83.9%26.5%
907764430.1%21.7%86.5%25.2%
1207524330.6%23.1%81.3%23.2%
Disclaimer/Publisher’s Note: The statements, opinions and data contained in all publications are solely those of the individual author(s) and contributor(s) and not of MDPI and/or the editor(s). MDPI and/or the editor(s) disclaim responsibility for any injury to people or property resulting from any ideas, methods, instructions or products referred to in the content.