Article

Impact Assessment of a Dynamic Green Certificate and Green Hydrogen Certificate Joint Mechanism on Integrated Energy Systems Based on an Asymmetric Cloud Matter-Element Model


School of Electrical Engineering, Xinjiang University, Urumqi 830047, China
*
Author to whom correspondence should be addressed.
Electronics 2026, 15(10), 2171; https://doi.org/10.3390/electronics15102171
Submission received: 1 April 2026 / Revised: 10 May 2026 / Accepted: 14 May 2026 / Published: 18 May 2026

Abstract

With the increasing penetration of wind power, enhancing the renewable energy accommodation rate and reducing the carbon footprint of the IES, this study proposes a comprehensive evaluation method to assess the impact of a novel dynamic Green Certificate Trading (GCT) and Green Hydrogen Certificate Trading (GHCT) joint mechanism. First, considering the integration of the IES into the carbon trading market, a coupled dynamic GCT-GHCT framework is established. This framework links dynamic green electricity certificate revenues with green hydrogen certificate revenues, leveraging cross-subsidization to incentivize renewable energy consumption. Subsequently, an optimal operation model for the IES is formulated with the objective of minimizing comprehensive costs, which encompass energy procurement, green certificates, carbon trading, and wind curtailment penalties. A piecewise linearization approach is applied to transform the optimization model into a Mixed-Integer Linear Programming problem for efficient solving. Furthermore, based on the dispatch results, a multidimensional evaluation index system is constructed, extracting key indicators from economic, technical, and environmental perspectives. To ensure the rationality of the evaluation, a dynamic reward–penalty asymmetric cloud matter-element (ACME) comprehensive evaluation method based on game theory combinatorial weighting is introduced to calculate the index weights and the final comprehensive evaluation value. Finally, multi-scenario simulations are conducted to verify the superiority of the integrated GCT-GHCT trading framework. The results reveal that the proposed approach not only maximizes renewable energy integration but also provides a robust decision-making tool for the low-carbon transition of multi-energy systems.

1. Introduction

Under the guidance of the “Dual Carbon” goals, the grid integration of renewable energy generation is expanding rapidly. The Carbon Trading Mechanism (CTM), Green Certificate Trading (GCT), and Green Hydrogen Certificate Trading (GHCT) are recognized as effective instruments to balance power economics with low-carbon environmental benefits. The integration of these mechanisms can effectively translate the internal value of green hydrogen and green electricity into realizable economic incentives, thereby enhancing market returns and promoting hydrogen energy development alongside carbon emission reductions. As a critical participant in the GC and GHC markets, a hydrogen-integrated IES can facilitate the clean transition and emission reduction of the power system through multi-energy complementarity and Power-to-Gas (P2G) technologies [1,2,3,4,5].
To facilitate the transition toward low-carbon energy systems, achieving high-fidelity integration of renewable energy sources (RESs) remains a primary objective. Recent advancements have underscored the dual importance of technical precision and broader systemic impacts. For instance, the synergistic impact of emerging factors—including electric vehicle (EV) charging patterns and the social costs of emissions—has been integrated into economic dispatch models to align system operations with net-zero targets [6]. Furthermore, the pivotal role of EV energy storage as a flexible resource in accelerating the transition to renewable-dominated grids has been meticulously explored [7]. However, while these studies focus on forecasting and physical flexibility, there is a relative lack of research on how coupled market-based certificate mechanisms can dynamically drive IES optimization.
Currently, numerous scholars have investigated IES dispatch considering the impacts of GCT and GHCT. Reference [8] developed a synergistic dispatch model for integrated energy systems, integrating GCT and stepped CET alongside flexible load optimization. Reference [9] proposes a low-carbon economic dispatch strategy for IES, which jointly considers the synergistic interaction between GCT and stepwise CET, along with the lifetime degradation of electric–thermal–hydrogen hybrid energy storage. Reference [10] introduced a coupled carbon–GHC mechanism, facilitating the synergistic participation of carbon and GHCT to promote hydrogen development and reduce rural carbon emissions via voluntary carbon offset certification. Although these studies incorporate GCT and GHCT into IES optimal dispatch, most treat them as isolated or parallel mechanisms, leaving the interactive effects between the two markets underexplored.
Consequently, several studies have begun to consider the joint effects of GCT and GHCT in IES dispatch. Reference [11] proposes that by introducing a tradable green certificate market, the carbon emission reduction potential of virtual power plants aggregating waste gasification and renewable energy sources can be converted into economic benefits, thereby establishing a market coupling linkage between green certificates and hydrogen energy. Reference [12] developed a joint carbon–green certificate trading framework, the equivalence between green certificates and carbon quotas enables an optimal scheduling strategy for an integrated energy system with a dynamic hydrogen blending ratio. While the aforementioned research incorporates the mutual influence between GCT and GHCT under traditional or tiered trading frameworks, it fails to provide dynamic supply–demand price signals in the joint market to flexibly guide enterprises or users in adjusting their electricity consumption behaviors, which is essential for reducing supply-side carbon emissions. Furthermore, existing studies on coupled green electricity-GHC markets rarely account for the uncertainty risks of renewable energy output or clarify the carbon emission responsibility deduction capabilities of green electricity and green hydrogen certificates across different time periods.
Conversely, research on IES primarily focuses on optimal dispatch or economic operation, with relatively few studies comprehensively evaluating system performance under varying policy mechanisms. Given the diverse energy forms and complex operational characteristics of an IES, a single metric is inadequate to holistically reflect its economic, technical, and environmental performance. Therefore, from a systems theory perspective, many experts have introduced rough set theory and fuzzy set theory into the evaluation of such complex systems. Extensive research has been conducted in this area: Reference [13] proposed evaluating the level of a Regional Integrated Energy System (RIES) based on the Wasserstein distance between a comprehensive reliability evaluation index cloud model and a standard cloud model; Reference [14] introduced a cloud model improved by game theory combinatorial weighting to assess the stability of novel power systems; Reference [15] incorporated a finite interval cloud generator for precise risk level assessment. While these studies address the objectivity of cloud model evaluation and precise grading, they are limited to depicting a single evaluation gradient and fail to distinguish risk resilience under different operational conditions.
In summary, current research on hydrogen-integrated IES lacks precise modeling of the carbon emission responsibility deduction capabilities of green electricity and green hydrogen certificates across varying time periods. The proposed dynamic green electricity-green hydrogen certificate joint mechanism offers a novel approach to address this gap, yet a systematic and comprehensive evaluation of its impact on the IES remains insufficient and requires further in-depth investigation.
To address these limitations, this research presents an impact assessment of a joint dynamic green certificate–green hydrogen certificate mechanism on IES. The core contributions are threefold:
  • A novel incentive mechanism is proposed by coupling dynamic GCT with GHCT. This approach effectively addresses the limitations of traditional static certificate schemes, specifically the underutilization of renewable energy during volatile generation periods.
  • An optimization scheduling model for IES is constructed, explicitly accounting for the interactive effects between GCT and GHCT. The model achieves a holistic, multi-energy synergy across power, thermal, and hydrogen carriers, enhancing the overall operational flexibility of the system.
  • A Game Theory-based Asymmetric Cloud-Matter Element evaluation model is developed. By utilizing a combination weighting method that integrates the AHP with RFR, the model achieves a scientific fusion of subjective and objective weights. This framework precisely maps the “reward–penalty asymmetry” inherent in policy boundaries, providing a robust tool for assessing the efficacy of the proposed mechanism.
The remainder of this paper is structured as follows: Section 2 delineates the integrated energy system (IES) architecture and formulates the dynamic mathematical models for the GCT and GHCT mechanisms. Section 3 constructs the multi-objective optimization scheduling framework, targeting the minimization of total operational costs while ensuring system reliability. Section 4 develops the Game Theory-based Asymmetric Cloud-Matter Element (GT-ACME) evaluation model, detailing the fusion of improved AHP and Random Forest Regression for weight determination. Section 5 validates the proposed strategy through comprehensive case studies, providing a numerical analysis of the synergistic effects and environmental benefits. Section 6 concludes this paper and outlines potential avenues for future research.

2. IES Operation Framework Under the Dynamic GCT-GHCT Joint Trading Mechanism

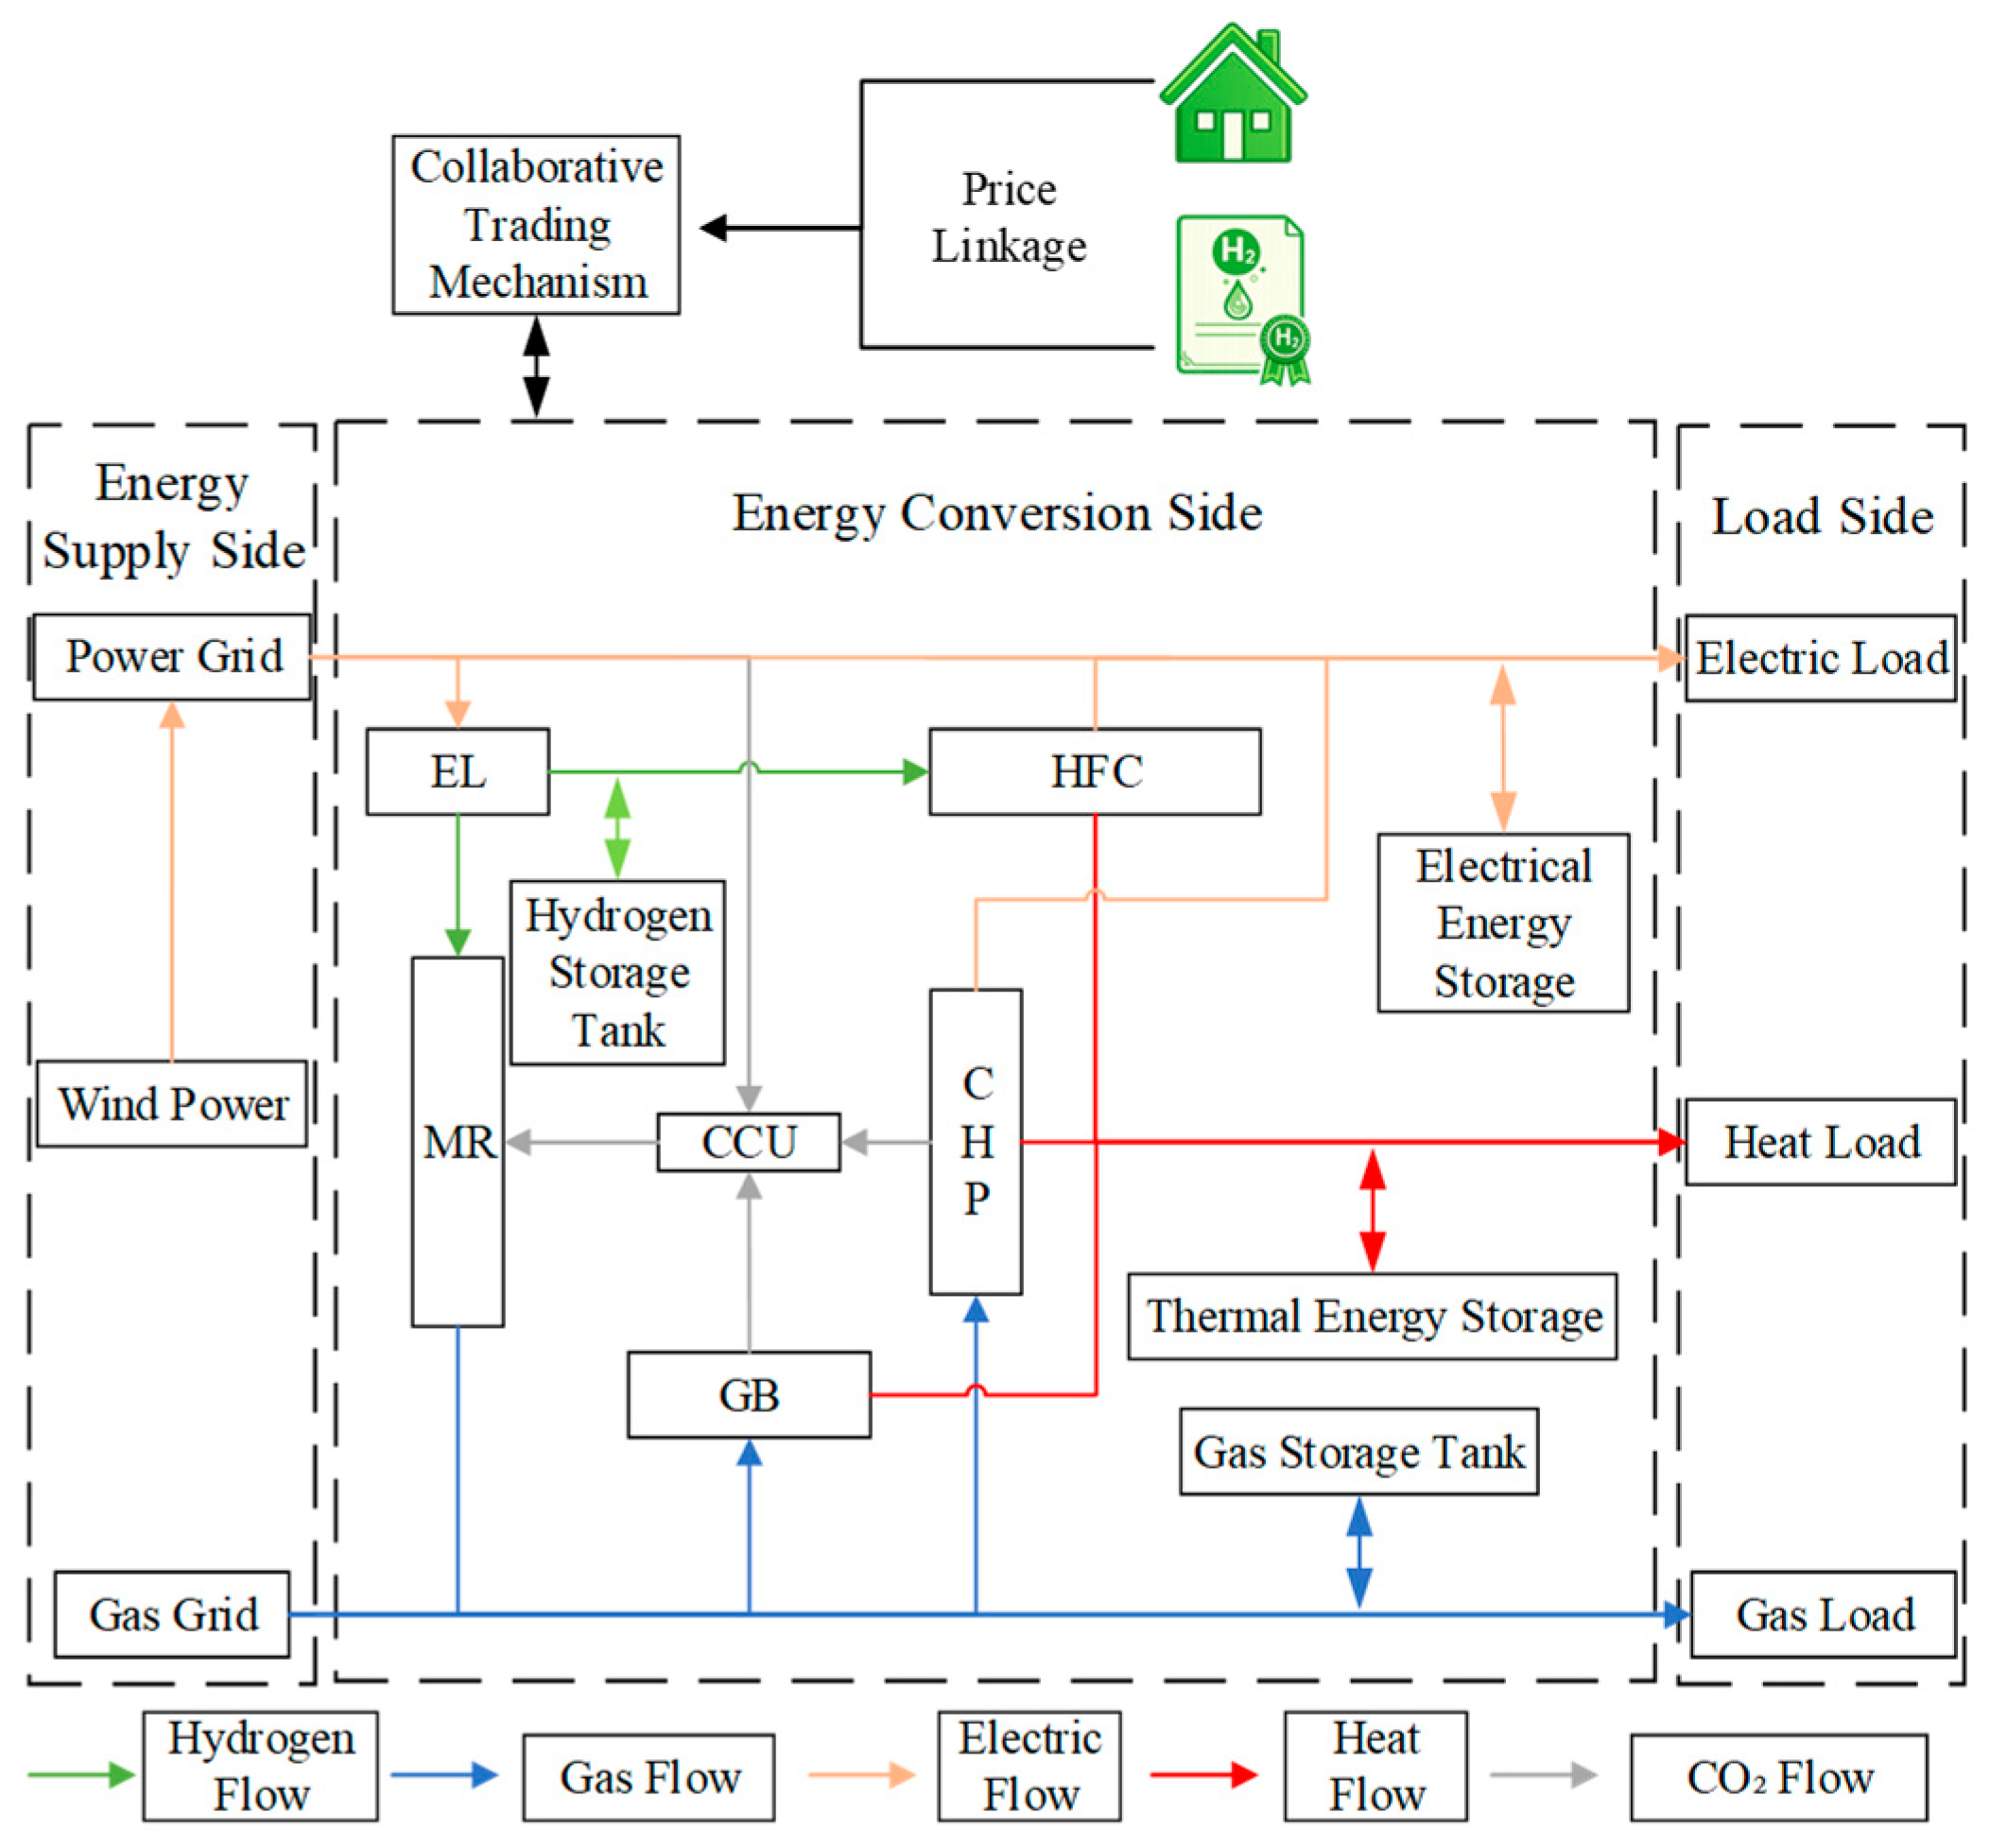
Relying on its diversified energy inputs and energy supply equipment, the IES efficiently satisfies the overall energy demand of the system through the optimal scheduling of multi-energy flows, including electricity, gas, and heat. Building upon the traditional model, this paper introduces a dynamic green certificate–green hydrogen certificate joint mechanism. Simultaneously, it considers the efficient utilization of hydrogen energy during the processes of Power-to-Gas (P2G) units and Proton Exchange Membrane Electrolyzer (EL) devices, along with the adjustable heat-to-power ratio characteristics of combined heat and power (CHP) equipment [16]. The specific framework is illustrated in Figure 1.
The system constructs a comprehensive energy architecture predicated on multi-energy inputs. For power supply, it connects to the upstream power grid and integrates renewable energy sources such as wind power; the natural gas supply features dual assurances, relying not only on upstream pipeline transportation but also on internal system generation as a supplement. Hydrogen gas can be converted into natural gas via a Methane Reactor (MR) or directly supplied to a hydrogen fuel cell (HFC) for power and heat generation. Gas Boilers (GBs) and CHP units collaboratively meet the baseline heat and power loads; gas load demands are jointly supplied by the upstream natural gas grid and the MR. The system is equipped with four types of energy storage devices—electricity, gas, heat, and hydrogen—effectively smoothing supply and demand fluctuations through an “energy time-shifting” strategy to enhance energy utilization efficiency. Net carbon emissions generated during system operation are ultimately accounted for via the green certificate and green hydrogen certificate markets [17].

2.1. Adjustable Heat-to-Power Ratio Model

2.1.1. CHP Equipment

The CHP generates electricity by combusting natural gas and utilizes the waste heat generated during the power generation process to supply the thermal load. The CHP unit possesses an adjustable heat-to-power ratio, allowing it to dynamically adjust the proportion of its electrical and thermal outputs based on real-time electricity and heat load demands, thereby achieving flexible and efficient energy supply [18]. Its operational model is:
P t , e CHP = η CHP e P t , g CHP P t , h CHP = η CHP h P t , g CHP P g , min CHP P t , g CHP P g , max CHP κ CHP min P t , h CHP / P t , e CHP κ CHP max
where: P t , g CHP represents the natural gas input power of CHP in period t . P g , max CHP and P g , min CHP represent the lower and upper limits of the CHP input power, respectively. P t , e CHP and P t , h CHP represent the electrical and thermal energy output by CHP in period t , respectively. η CHP e and η CHP h represent the electrical and thermal energy efficiencies of CHP, respectively. κ CHP max and κ CHP min represent the lower and upper limits of the CHP heat-to-power ratio, respectively.

2.1.2. GB Equipment

P t , h G B = η GB h P t , g GB P g , min G B P t , g GB P g , max G B
where P t , h G B represents the gas consumption of the GB (MR output) in period t . P t , h GB represents the heat generation power of the GB in period t . η GB h represents the heat generation conversion efficiency of the GB. P g , min G B and P g , max G B represent the lower and upper limits of GB gas consumption, respectively.

2.2. Two-Stage Operation Process of P2G

2.2.1. EL Equipment

The electrolyzer uses electrical energy to produce green hydrogen, and the electrolyzer model can be expressed as [19]:
P t , H 2 EL = η EL P t , e EL P e , min EL P t , H 2 EL P e , max EL
where P t , e EL represents the operating power of the EL in period t . P t , H 2 EL represents the hydrogen energy production of the EL in period t . η EL represents the power-to-hydrogen conversion efficiency of the EL. P e , min EL and P e , max EL represent the lower and upper limits of the EL operating power, respectively.

2.2.2. MR Equipment

P t , g MR = η MR P t , H 2 MR P H 2 , min MR P t , H 2 MR P H 2 , max MR
where P t , H 2 MR represents the hydrogen consumption of the MR in period t . P t , g MR represents the natural gas production power of the MR in period t . η MR represents the hydrogen-to-gas conversion efficiency of the MR. P H 2 , min MR and P H 2 , max MR represent the lower and upper limits of the MR hydrogen consumption, respectively [20].

2.2.3. HFC Equipment

The HFC model satisfies the dual constraints of constant total output power and an adjustable heat-to-power ratio [21]. Its mathematical expression is as follows:
P t , h HFC = η HFC h P t , H 2 HFC P t , e HFC = η HFC e P t , H 2 HFC P min , H 2 HFC P t , H 2 HFC P max , H 2 HFC κ HFC min P t , h HFC / P t , e HFC κ HFC max
where: P t , H 2 HFC represents the hydrogen consumption of the HFC in period t ; P t , e HFC and P t , h HFC represent the power generation and heat generation power of the HFC in period t , respectively. η HFC e and η HFC h represent the conversion efficiencies of HFC power and heat generation, respectively. κ HFC min and κ HFC max represent the lower and upper limits of the HFC heat-to-power ratio, respectively.

2.3. Energy Storage Equipment

Reference [22] considers that the models for electricity, heat, and gas energy storage devices are similar; therefore, this paper unifies the modeling for electricity, heat, gas, and hydrogen storage devices.
S t , n ES = S t 1 , n ES + η c h a , n ES P t , n ES , in P t , n ES , out / η d i s , n ES P max , n ES
where P t , n ES , in and P t , n ES , out represent the charging and discharging power of the n-th energy storage device in period t . P max , n ES represents the maximum single charge and discharge power of the n-th energy storage device; η c h a , n ES and η d i s , n ES represent the charging and discharging efficiencies of the n-th energy storage device, respectively.

3. IES Optimal Scheduling Model Under the Dynamic Green Certificate–Green Hydrogen Certificate Joint Trading Mechanism

3.1. Dynamic Green Certificate–Green Hydrogen Certificate Joint Trading Mechanism

3.1.1. Dynamic Green Certificate Mechanism

This study mandates that regional renewable energy enterprises must bear a government-approved compulsory green certificate quota. The Dynamic Green Certificate Trading Mechanism is an innovative policy instrument that adjusts green certificate trading prices in real-time based on market supply and demand. Unlike traditional fixed-price mechanisms, this mechanism introduces a piecewise linear pricing function, enabling green certificate prices to endogenously respond to real-time system supply and demand states. This forms effective price signals that guide the IES to optimize its operational strategies [23].
  • Dynamic Balance of Green Certificate Supply and Demand
Within the scheduling period T (in this paper T = 24 h), the green certificate supply and demand relationship at each period t is described by the following equation:
N t , a d q = α g r e e n P t , e wind / 1000 N t , r e q = β green P t , e load / 1000 N t , G C T = N t , r e q N t , a d q
where N t , a d q represents the green certificate acquisition amount of the system in period t . N t , r e q represents the system’s green certificate demand in period t . α g r e e n and β green represent the issuance coefficient for converting wind power on-grid energy to green certificates and the system green certificate quota weight coefficient, respectively. N t , G C T represents the net green certificate acquisition amount of the system in period t . P t , e wind represents the wind power on-grid energy in period t .
2.
Piecewise Linear Dynamic Pricing Function
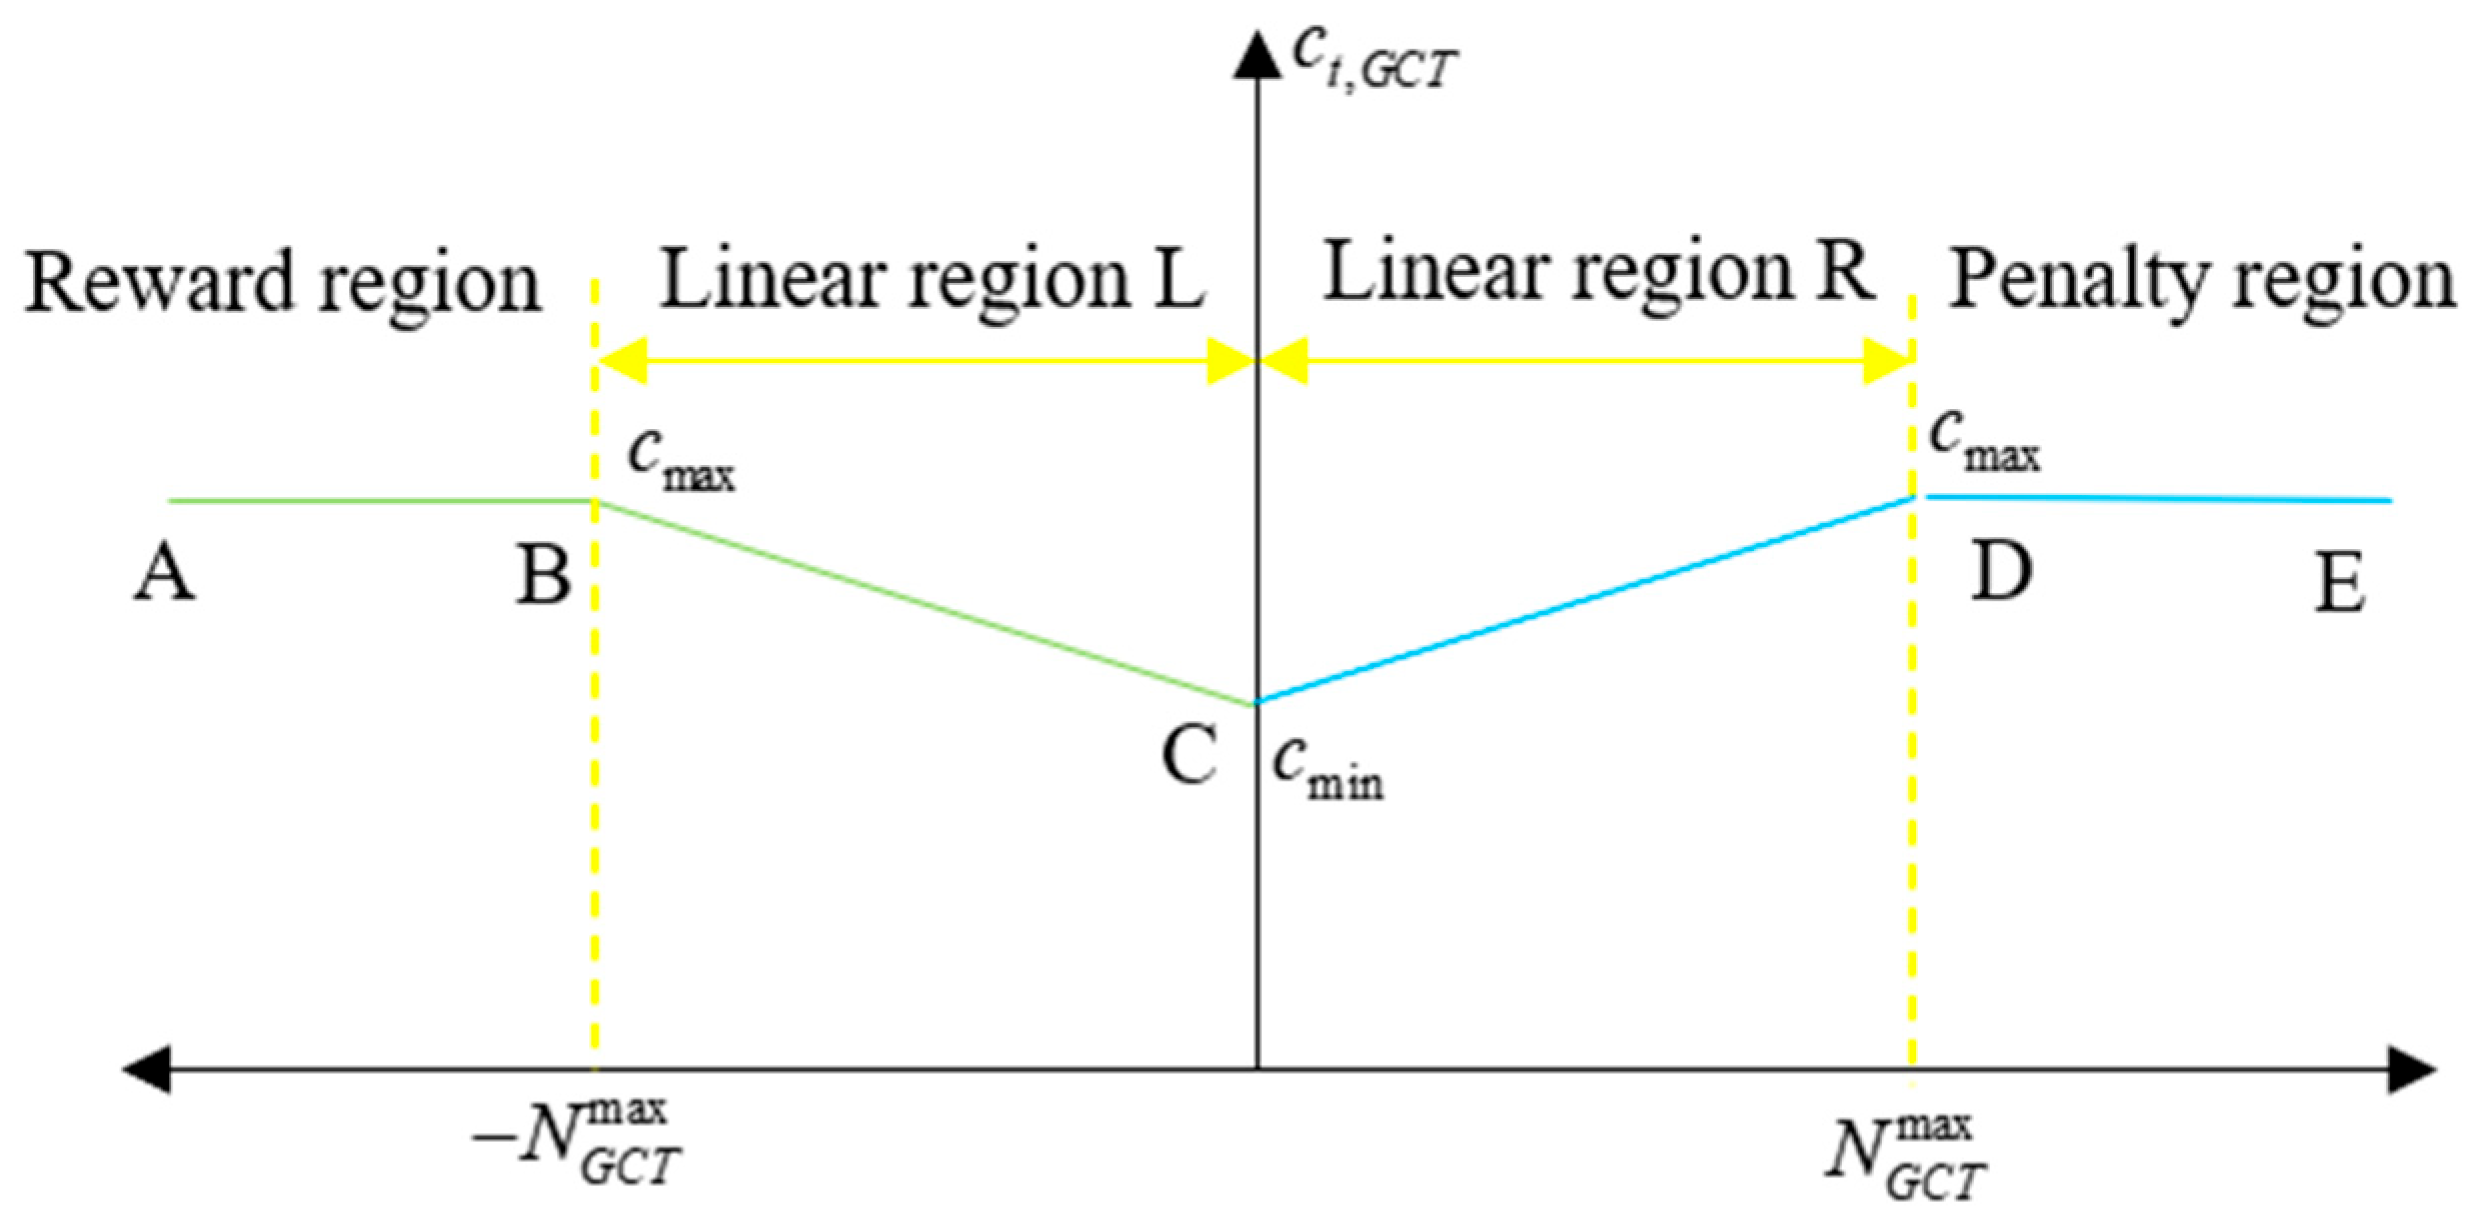
The core of this mechanism is to construct a four-segment linear price function, and the supply and demand curve of dynamic green certificate trading considering reward and punishment characteristics is shown in Figure 2. The number of green certificate transactions is mapped to a time-varying price:
c t , G C T = c max , N t , G C T N G C T max c min + k 1 N t , G C T , N G C T max N t , G C T 0 c min + k 2 N t , G C T , 0 N t , G C T N G C T max c max , N G C T max N t , G C T
where c t , G C T represents the dynamic trading price of green certificates in period t . c min c max and c max represent the floor price and penalty price of green certificate trading, respectively. k 1 and k 2 represent the linear price slopes of the BC and CD segments of the green certificate trading linearization function, respectively. N G C T max represents the green certificate trading threshold.
Equation (8) represents a continuous nonlinear expression with piecewise-coupled functions, which cannot be directly resolved by linear solvers. To address this, this study introduces Q + 1 continuous auxiliary variables [ w 1 , t , w 2 , t , , w Q + 1 , t ] and Q binary auxiliary variables [ z 1 , t , z 2 , t , , z Q + 1 , t ] thereby transforming it into the linear formulation presented in Equation (9).
c t , G C T = w 1 c t , G C T ( b 1 ) + w 2 c t , G C T ( b 2 ) + + w Q + 1 c t , G C T ( b Q + 1 )
w 1 , t + w 2 , t + + w Q + 1 , t = 1 z 1 , t + z 2 , t + + z Q + 1 , t = 1 N G C T , t = w 1 , t b 1 + w 2 , t b 2 + + w Q + 1 , t b Q + 1 w 1 , t 0 , w 2 , t 0 , , w Q + 1 , t 0 w 1 , t z 1 , t , w 2 , t z 2 , t , , w Q + 1 , t z Q + 1 , t
In Equation (10), the first line facilitates the linearization of the function, while the second line defines the constraints for the first, ensuring it remains within the feasible range of NGCT. Meanwhile, [ b 1 , b 2 , , b Q + 1 ] represents the Q + 1 breakpoints.

3.1.2. Green Hydrogen Certificate Mechanism

GHCT mechanism follows the principle of “green attribute separation”, decoupling the physical delivery of hydrogen energy from its environmental benefits. The core idea of this mechanism is to conduct independent certification and trading of the green attributes of wind power-to-hydrogen through certificates, forming a market-oriented pricing system for the green attributes of hydrogen energy. The generation of certificates strictly follows the definition of “green hydrogen”, meaning that only hydrogen produced by electrolyzing water with renewable electricity can obtain corresponding certification.
  • Dynamic Balance of Green Hydrogen Certificate Supply and Demand
The generation of GHCT is based on the accurate measurement of the amount of hydrogen produced by wind power.
V t , a d q = ω H 2 P t , w i n d H 2 / 1000 V t . r e q = α H 2 ( P t , H 2 MR + P t , H 2 HFC ) / 1000
f G H C T , a = δ ( V t . r e q V t , a d q ) c g r e b + ( 1 δ ) C p ( V t . r e q V t , a d q ) , V t , a d q < V t . r e q ( V t . r e q V t , a d q ) c g r e s , V t , a d q V t . r e q
where V t , a d q represents the number of green hydrogen certificates obtained from wind power-to-hydrogen in period t . V t . r e q represents the demand for green hydrogen certificates of the system in period t . P t , w i n d H 2 represents the amount of wind power-to-hydrogen in period t . f G H C T , a is the trading price of green hydrogen certificates. ω H 2 is the conversion factor for converting the wind power-to-hydrogen amount into the number of green hydrogen certificates. α H 2 is the green hydrogen certificate quota coefficient. c g r e b and c g r e s are the unit trading prices for purchasing and selling green hydrogen certificates, respectively. δ is a 0–1 variable, which is 1 when purchasing certificates and 0 otherwise. C p is the trading penalty coefficient.
2.
Double Counting Correction
To avoid double counting of wind power-to-hydrogen in both green certificates and green hydrogen certificates, the cost of green hydrogen certificates needs to be corrected:
f e p = α green c t , G C T P t , w i n d H 2 / 1000 f G H C T = f G H C T , a f e p
where f e p represents the cost of double counting, that is, the green electricity certificate cost corresponding to the wind power consumed by wind power-to-hydrogen. f G H C T represents the corrected green hydrogen certificate cost.

3.1.3. Principle of the Dynamic Green Certificate–Green Hydrogen Certificate Joint Trading Mechanism

The dynamic green electricity–green hydrogen certificate joint trading (DGCT-GHCT) mechanism is an innovative market-oriented institutional design that aims to systematically improve the accommodation level and economic value of renewable energy by coupling the renewable energy power market and the hydrogen energy market through certificate tools. When renewable energy power generation exceeds real-time power load demand, the surplus green electricity is directed to the water electrolysis hydrogen production system and converted into green hydrogen. This process generates green hydrogen certificates based on the green hydrogen production, which can be traded in the corresponding market to realize the initial monetization of its environmental value; during peak power load periods or when electricity prices are high, the stored green hydrogen can be fed back to generate electricity through technologies such as hydrogen fuel cells. The electricity generated in this way is considered green electricity, and green power certificates can be applied for accordingly to achieve a secondary market realization of environmental value. Thus, a two-tier value realization and circulation closed loop based on green power certificates and green hydrogen certificates is constructed.

3.2. Objective Function

This paper takes the minimum total economic cost F as the objective function:
F = min ( f buy + f CO 2 + f wind + F GCT + F G H C T )
where f buy represents the energy purchase cost. f wind represents the wind energy operation and wind curtailment penalty cost.

3.2.1. Energy Purchase Cost

f buy = t = 1 T c t e P t , e buy + c g t = 1 T P t , g buy
where c t e represents the time-of-use electricity price. c g represents the natural gas price. P t , e buy represents the electric energy amount in period t . P t , g buy represents the gas purchase amount in period t .

3.2.2. Carbon Trading Cost

f CO 2 = λ M I E S M I E S = M t o t a l + M b u y + M M R M total = t = 1 T ( a 1 + b 1 P t total + c 1 ( P t total ) 2 ) P t total = P t , e CHP + P t , h CHP + P t , h GB M buy = t = 1 T ( a 2 + b 2 P t , e buy + c 2 ( P t , e buy ) 2 ) M MR = ϖ t = 1 T P t , g E
where λ is the base price for carbon trading. M IES is the IES carbon emission trading volume. M t o t a l is the total actual carbon emissions of CHP and GB. P t total is the equivalent output power of CHP and GB in period t . a 1 , b 1 , c 1 and a 2 , b 2 , c 2 are the carbon emission calculation parameters for gas-fired and coal-fired energy supply equipment, respectively. ϖ is the parameter of CO2 absorption during the hydrogen-to-natural gas process of the MR device.

3.2.3. Wind Energy Operation and Penalty Cost

f wind = c wind t = 1 T P t , e wind + μ wind t = 1 T ( P t . e wind , MAX P t , e wind )
where c wind represents the wind power operation cost coefficient. μ wind represents the wind curtailment penalty coefficient. P t . e wind , MAX represents the forecasted wind power output in period t . P t , e wind represents the actual wind power output in period t .

3.3. Constraints

The system operation must satisfy the constraints determined by actual conditions such as load demand and unit capacity, specifically as follows.

3.3.1. Wind Power Output Constraint

0 P t , e wind P t , e wind , MAX

3.3.2. Energy Supply Balance Constraint

  • Electricity Balance Constraint
P in = P t , e buy + P t , e CHP + P t , e HFC + P t , e w i n d P out = P t , e load + P t , e EL + P t , e ES , in P t , e ES , out P in = P out
where P in and P out represent the input and output amounts of system electrical power, respectively. P t , e load represents the electrical load power of the system in period t . P t , e ES , in and P t , e ES , out represent the charging and discharging power of the electrical energy storage device in period t , respectively.
2.
Heat Balance Constraint
P t , h CHP + P t , h HFC + P t , h GB = P t , h load + P t , h ES , in P t , h ES , out
where P t , h load represents the thermal load power of the system in period t . P t , h ES , in and P t , h ES , out represent the input and output amounts of the thermal power of the thermal energy storage device in period t , respectively.
3.
Hydrogen Energy Balance Constraint
P t , H 2 EL + P t , H 2 PSA = P t , H 2 MR + P t , H 2 HFC + P t , H 2 ES , in P t , H 2 ES , out
where P t , H 2 ES , in and P t , H 2 ES , out represent the input and output amounts of the hydrogen power of the hydrogen energy storage device in period t , respectively.
4.
Natural Gas Balance Constraint
P t , g buy + P t , g MR = P t , g load + P t , g gb + P t , g CHP + P t , g ES , in P t , g ES , out
where P t , g load represents the natural gas load power of the system in period t . P t , g ES , in and P t , g ES , out represent the input and output amounts of the natural gas power of the natural gas storage device in period t , respectively.

3.4. Model Transformation and Solution

The IES low-carbon economic scheduling model constructed in this paper integrates key elements such as power-to-hydrogen and an adjustable heat-to-power ratio, making it an integer nonlinear model. To this end, the above model is reconstructed into a mixed-integer linear model. The entire modeling and solution process is based on the MATLAB (Version [R2023b], MathWorks, Natick, MA, USA)software platform, using the YALMIP toolbox (Version [R20210331]) for efficient model construction and expression, and invoking the commercial solver CPLEX (Version [12.0], IBM, Armonk, NY, USA)for final solving.

4. Impact Evaluation of the Dynamic GCT-GHCT Joint Mechanism on IES Operation

4.1. Multidimensional Comprehensive Evaluation Index System for IES Under the Joint Mechanism

Constructing a scientific and rational evaluation index system is fundamental for quantifying the operational efficacy of the IES. Considering the profound impact of the joint mechanism on system operational strategies, to ensure the comprehensiveness and representativeness of the evaluation results, this paper closely integrates the low-carbon, economic, and efficient operational characteristics of the IES. Key evaluation indicators are extracted from three dimensions: economic, technical, and environmental, to build a multidimensional comprehensive evaluation index system oriented toward this joint mechanism, as shown in Table 1.

4.1.1. Economic Benefits

The calculations of the total operating cost and energy purchase cost are shown in Equations (12) and (13), and the calculations of green certificate revenue and green hydrogen certificate revenue are shown in Equations (1), (2) and (5).

4.1.2. Technical Benefits

  • Wind Power Accommodation Rate
The wind power accommodation rate reflects the system’s ability to accommodate wind power, and its value is expressed as:
B 1 = t = 1 T ( P t . e wind , MAX P t , e wind ) / t = 1 T P t , e wind
2.
Green Hydrogen Conversion Efficiency
The green hydrogen conversion efficiency reflects the energy conversion efficiency of the P2G system, and its value is expressed as:
B 2 = t = 1 T P t , H 2 EL / t = 1 T P t , e wind

4.1.3. Environmental Benefits

  • Carbon Emissions
Carbon emissions refer to the total amount of carbon released by the system over a complete dispatch cycle. Specifically, this includes the indirect carbon emissions associated with purchased electricity from the external power grid and the direct carbon emissions resulting from natural gas combustion, while subtracting the amount of carbon dioxide absorbed by MR. The calculation can be expressed as follows:
C 1 = t = 1 T ( ϖ P t , e buy + β C H P P t , g CHP ϖ M R P t , g MR )
where ϖ represents the power grid carbon emission factor. β C H P represents the carbon emission coefficient of natural gas combustion. ϖ M R represents the CO2 absorption coefficient of the MR equipment.
2.
Renewable Energy Penetration Rate
This indicator reflects the alternative level of fossil energy on the energy supply side of the system, and its formula is:
C 2 = t = 1 T ( P t , e wind + P t , e HFC ) / t = 1 T P t , e load

4.2. IES Dynamic Reward–Punishment Asymmetric Cloud Matter-Element Comprehensive Evaluation Model Based on Game Theory Combined Weighting

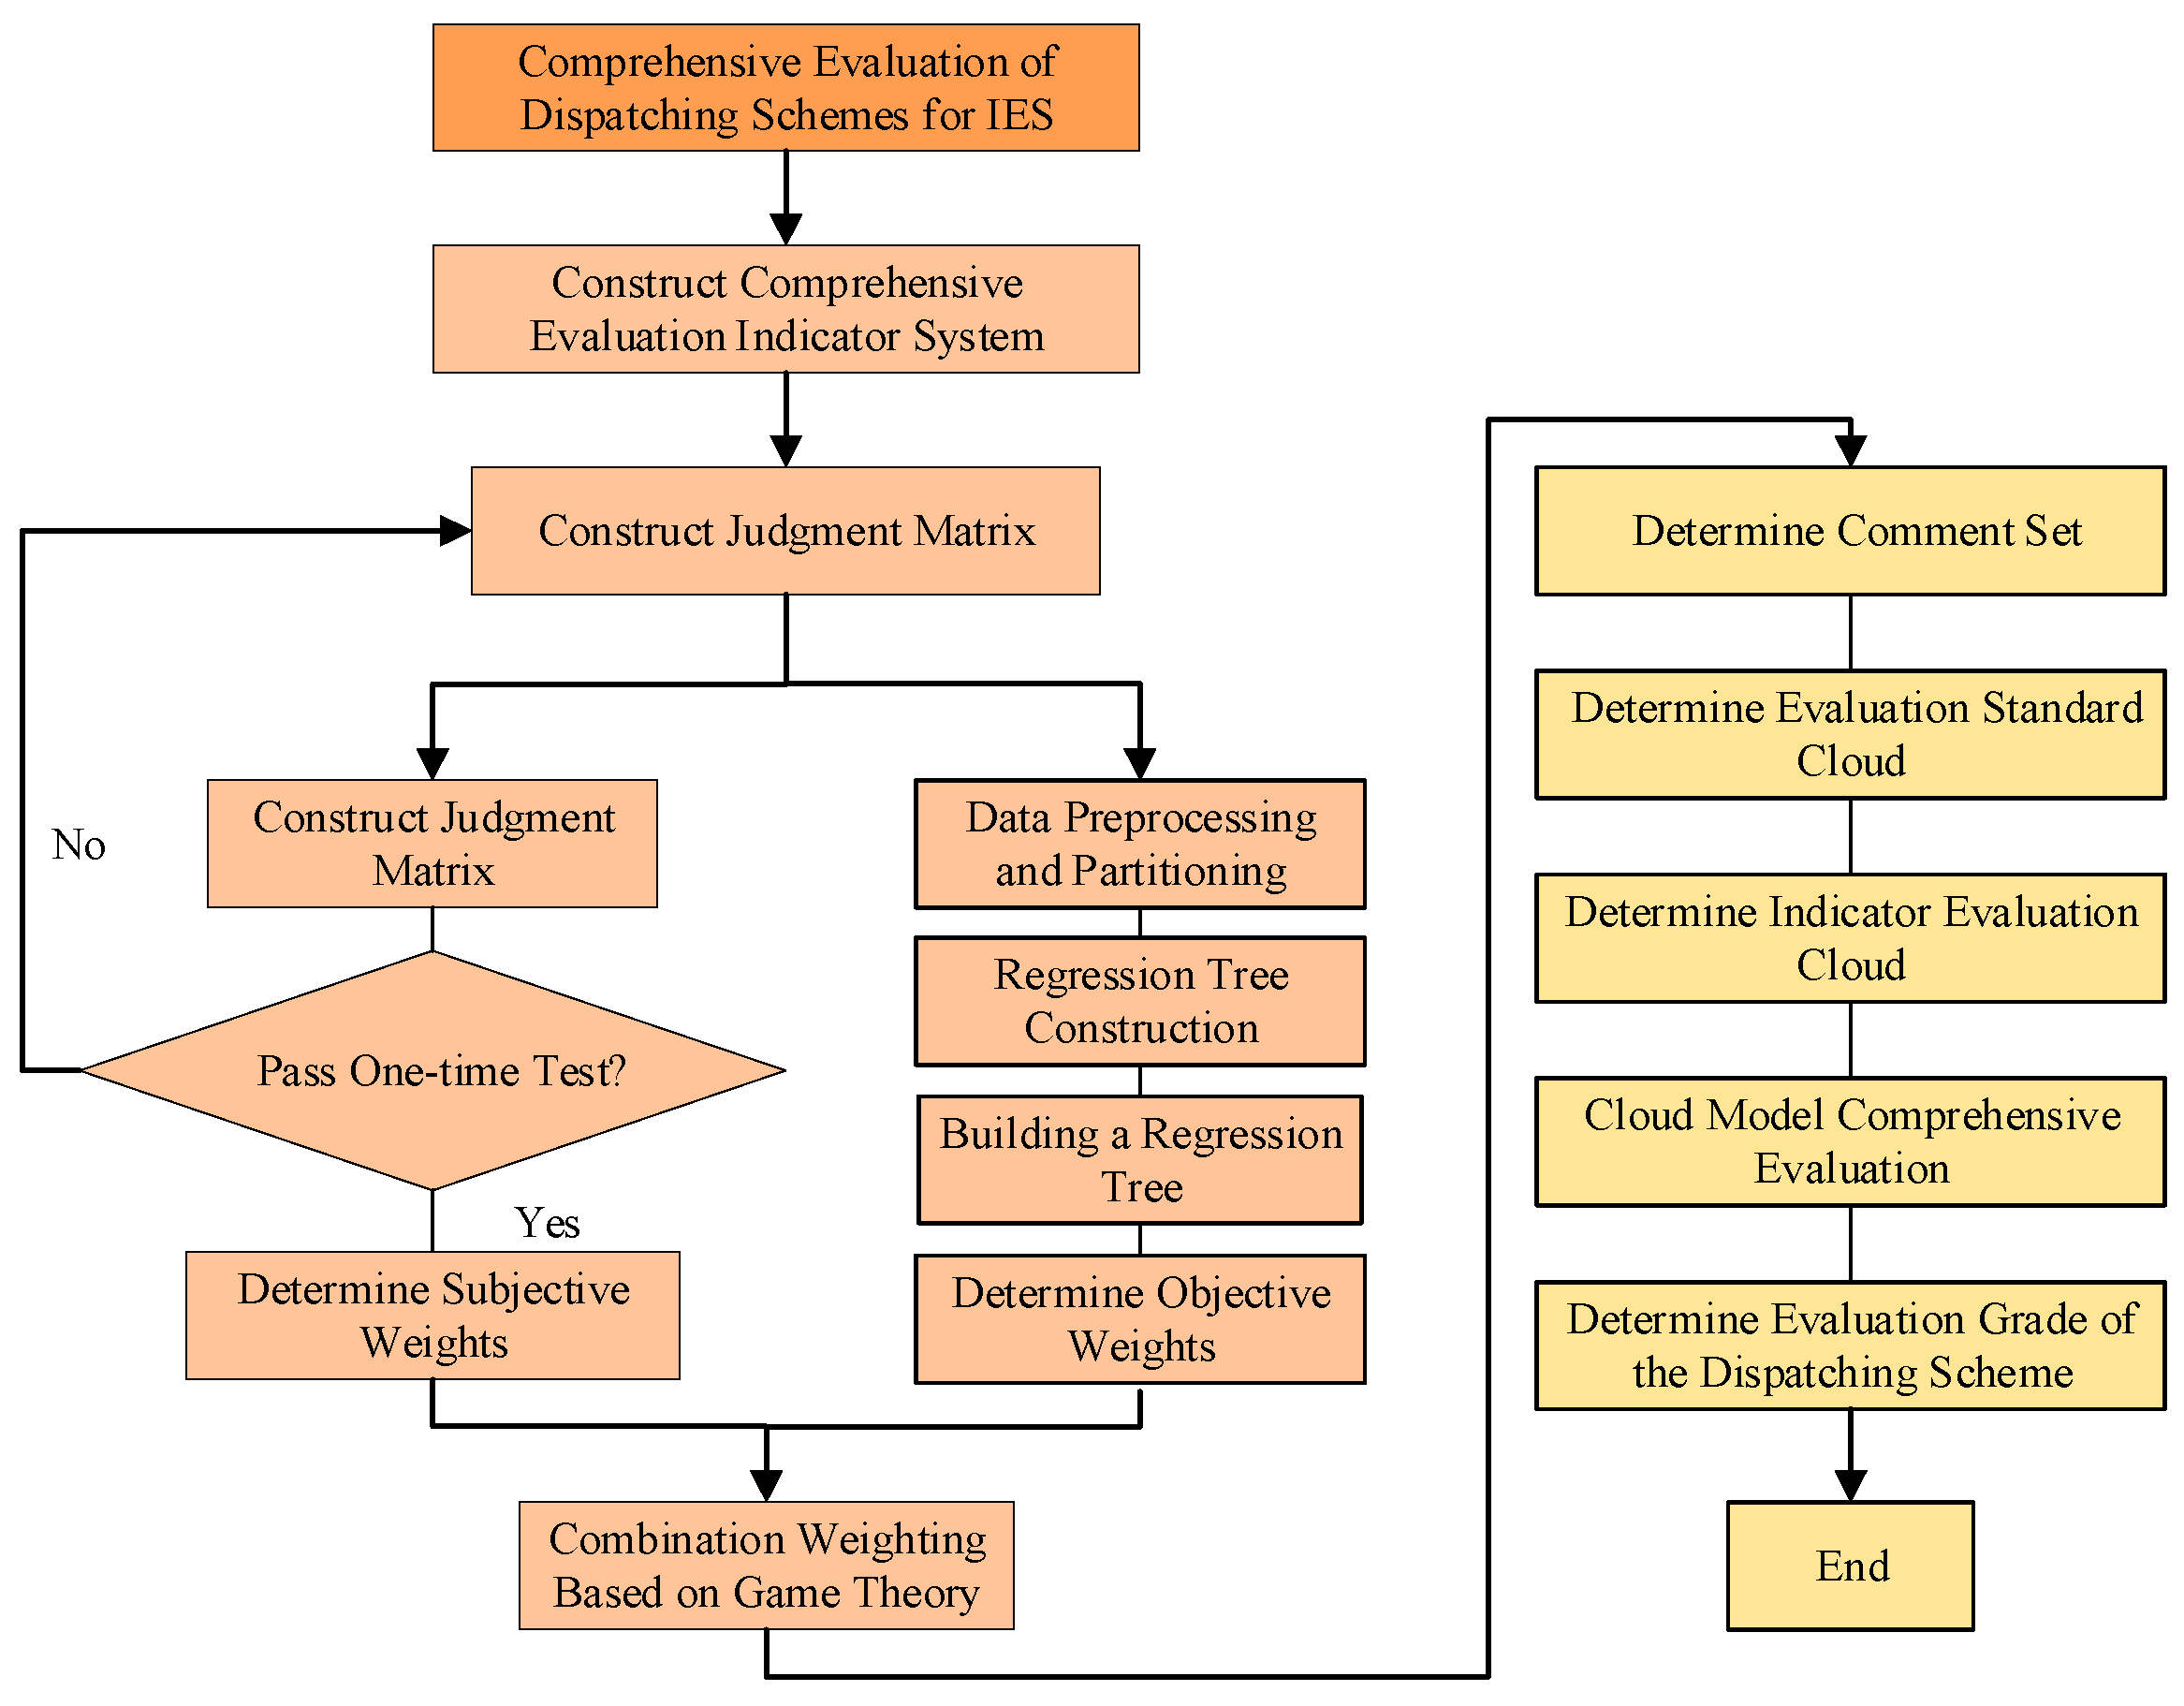
Based on game theory, this paper proposes a comprehensive evaluation model to assess the impact of the dynamic GCT-GHCT mechanism on the IES. After standardizing the indicator data, the weighting process must capture both subjectivity and objectivity; a single weighting method is insufficient to fully reflect the true weights of the indicators. To enhance the scientific rigor and accuracy of the weight allocation, the AHP and RFR are employed to obtain the subjective and objective weights of the indicators, respectively. A combinatorial weighting method based on game theory principles is then utilized to organically integrate both, yielding the final indicator weights. Ultimately, an asymmetric cloud matter-element comprehensive evaluation method is adopted to assess the comprehensive benefits generated by the GCT-GHCT joint mechanism on the IES. The flowchart of this evaluation process is illustrated in Figure 3.

4.2.1. Indicator Data Standardization

The objective of standardizing indicator data is to eliminate dimensional differences among various indicators while accurately describing the impacts of benefit-type (maximizing) and cost-type (minimizing) indicators on the comprehensive evaluation. Let the evaluation indicator set be X = {X1,X2,…,X8}. If the i evaluation indicator of the j evaluated object is denoted as xij, the standardized indicator yij, is processed as follows:
For benefit-type (maximizing) indicators:
y ij = ( x ij min ( X j ) ) / ( max ( X j ) min ( X j ) ) + ε
where ε is a marginal offset value, typically 1 × 10⁻⁴, introduced to prevent zero values from disrupting entropy weight calculations. For cost-type (minimizing) indicators:
y ij = ( max ( X j ) x ij ) / ( max ( X j ) min ( X j ) ) + ε

4.2.2. Determination of Indicator Weights

Unlike traditional entropy or CRITIC methods that only capture linear correlations, RFR is utilized to derive objective weights through Mean Decrease Impurity. This approach is superior in capturing the nonlinear interactions between policy incentives and system performance, offering greater robustness against data outliers in complex IES evaluation.
  • Subjective Weight Analysis Based on AHP
When applying AHP weighting, the relative importance of each indicator is first compared to construct a judgment matrix A:
A = a 11 a 18 a 81 a 88
where aij represents the score obtained by comparing indicator i with indicator j. To quantify the relative importance of the evaluation indicators, the Saaty 1–9 scale is employed to construct the pairwise comparison matrix. In this framework, the integer 1 signifies equal importance between two elements, while the odd values 3, 5, 7, and 9 represent moderate, strong, very strong, and extreme importance, respectively. The even numbers (2, 4, 6, 8) are utilized as intermediate values to capture subtle nuances between adjacent judgment levels. Furthermore, the reciprocal property is strictly followed: if the comparison of element i to j yields a value aij, the relative importance of j to i is defined as 1/aij. This systematic scaling ensures the mathematical consistency of the reciprocal judgment matrix required for weight derivation [24].
Subsequently, column normalization is performed, followed by the calculation of the indicator weights:
a i j ¯ = a i j / i = 1 n a i j w j A H P = i = 1 n a i j ¯ / n
where the variables denote the elements of the column-normalized judgment matrix, the weight calculated by AHP, and n represents the number of indicators.
To ensure the logical consistency of the subjective judgment matrix, a consistency check is performed through the following three steps:
The C I is derived to quantify the deviation of the judgment matrix from perfect consistency:
C I = λ max n n 1
where λ max is the maximum eigenvalue of the pairwise comparison matrix and n is the matrix order (number of indicators).
The average random consistency index R I is obtained from the standard reference table based on the value of n . For a system with n = 8 indicators, the R I is defined as 1.41.
The C R is formulated as the ratio of C I to R I :
C R = C I R I
Following Saaty’s criterion, the judgment matrix is considered consistent and acceptable if C R < 0.1 . Conversely, if C R 0.1 , the pairwise comparisons must be recalibrated to eliminate logical contradictions.
2.
Objective Weight Analysis Based on RFR
To overcome the limitations of traditional objective weighting methods (e.g., entropy or CRITIC) that primarily rely on linear correlations and data dispersion, this study employs RFR to determine the objective weights. RFR, as an advanced ensemble learning technique, evaluates the contribution of each indicator to the target variable (e.g., comprehensive system benefit) by measuring the Mean Decrease Impurity (MDI). This method inherently captures the complex, nonlinear interactions among multidimensional indicators, thereby providing a more scientifically rigorous data-driven weighting mechanism [25].
Dataset Construction and Impurity Definition: Let X = {x1, x2, …, xn} denote the set of n evaluation indicators (features), and Y represent the predictive target (e.g., total operational cost or system performance). The RFR model consists of K decision trees. For a continuous target variable, the node impurity I ( m ) at node m is typically defined by the Mean Squared Error (MSE) or variance:
I ( m ) = 1 N m i N m ( y j y m ¯ ) 2
where N m is the number of samples reaching node m , and y m ¯ is the mean value of the target variable in node m .
Calculation of Impurity Decrease: When a decision tree splits node m into a left child node m L and a right child node m R using indicator xj, the reduction in impurity Δ I ( m ) is calculated as:
Δ I ( m ) = I ( m ) N m L N m I ( m L ) N m R N m I ( m R )
This value represents the information gain or error reduction achieved by utilizing indicator xj at that specific node.
Derivation of Feature Importance via MDI: The Variable Importance Measure (VIM) of indicator xj in a single tree t is the sum of the impurity reductions across all nodes split by xj. The overall objective importance of xj is then averaged over all K trees in the random forest:
V I M j = 1 K t = 1 K m M j , t Δ I ( m )
where M j , t denotes the set of all nodes in tree t that are split using the indicator xj.
Normalization for Objective Weights: to ensure the objective weights mathematically sum to 1, the calculated VIM scores are normalized. The objective weight w j R F R for the j -th indicator is defined as:
w j R F R = V I M j i = 1 n V I M j
3.
Determination of Comprehensive Weights Based on Game Theory.
Compared to a simple linear combination, a combinatorial weighting method grounded in game theory thoroughly considers the mutual relationships between different weights, balancing the outputs of each method. Utilizing the subjective weights from AHP and objective weights from RFR, the Nash equilibrium is set as the coordination objective. This approach seeks consensus by minimizing the deviation between the combinatorial weights and the subjective/objective weights, ensuring the sum of deviations is minimized. The steps are as follows.
Construct the combinatorial weight vector using a linear combination form:
W = α 1 w 1 + α 2 w 2
where w 1 and w 2 are the subjective and objective weight vectors, respectively; α 1 and α 2 are their respective linear combination coefficients.
To minimize the deviation between the calculated combinatorial weight vector and the participating weight vectors, the optimization coefficients are determined by establishing the following objective function:
min W w 1 2 min W w 2 2
Based on the principle of differentiation, the linear system of equations is solved:
w 1 w 1 T w 1 w 2 T w 2 w 1 T w 2 w 2 T α 1 α 2 = w 1 w 1 T w 2 w 2 T
Finally, a normalization process is performed:
α 1 * = α 1 / ( α 1 + α 2 ) α 2 * = α 2 / ( α 1 + α 2 )
where α 1 * and α 2 * are the optimized combination coefficients.
The final optimized combinatorial weight vector is thus obtained as:
W = α 1 * w 1 + α 2 * w 2

4.2.3. ACME Comprehensive Evaluation Method

  • Cloud Matter-Element Model
The cloud matter-element model comprises cloud drops and matter-elements. Cloud drops signify the qualitative concepts of the indicators, while the matter-element serves as an integrated entity connecting the evaluated object, its characteristics, and its quantitative values. The matter-element is represented as a matrix [26]:
R = N c 1 v 1 c 2 v 2 c n v n
where N denotes the evaluated object (here, the IES); c denotes the characteristics of the object (the selected indicators); and v represents the corresponding values.
By replacing the exact value v in the traditional matter-element R = (N,c,v) with a normal cloud (Ex,En,He), the cloud matter-element model is established. Expected value Ex represents the expectation of the qualitative concept, serving as the central point that best reflects the actual data. Entropy En measures the uncertainty, representing the central point within the cloud drops that satisfies a normal distribution. Hyper entropy He gauges the dispersion degree of the data. Together, Ex, En, and He encapsulate the uncertainty and fuzziness of the assessment.
R = N c 1 ( E x 1 , E n 1 , H e 1 ) c 2 ( E x 2 , E n 2 , H e 2 ) c n ( E x n , E n n , H e n )
In this study, the object N denotes IES, cn represents the selected comprehensive evaluation indicators, and the parameters (Ex,En,He) are employed to characterize the performance level of cn.
2.
Calculation Method for the Asymmetric Cloud Matter-Element Model.
Solving this model primarily requires determining Ex, En, and He:
E x = ( c max + c min ) / 2 H e = η E n
where η is a predefined constant.
Among these parameters, entropy En is the most critical during calculation, as it characterizes the fuzziness of the evaluator’s acceptance level of the indicators. In the improved asymmetric half-cloud model, defining the left entropy Enl and right entropy Enr is essential for capturing the system’s differential sensitivity across the “reward zone” and “penalty zone.”
For En, there are currently two main calculation methods [27]: (i) the cloud entropy calculation method based on the “3En” principle; (ii) the cloud entropy calculation method based on the “50% correlation degree” principle. The corresponding calculation formulas are as follows:
E n 1 = ( c max c min ) / 6 E n 2 = ( c max c min ) / 2.355
The left side corresponds to the low-cost/high-accommodation zone. Because the dynamic mechanism changes gradually here, a larger Enl reflects the system’s stability within the reward zone. Conversely, the right side corresponds to the high-cost/penalty zone. To capture the acute sensitivity induced by the “penalty price,” a reduction coefficient is applied to compress Enr, forcing the membership degree to decay rapidly on this side. Their respective calculation formulas are:
E n l = ( c max c min ) / 2.355 E n r = ( c max c min ) / 6

5. Case Study Analysis

5.1. Analysis of IES Optimal Operation Methods Under the Joint Mechanism

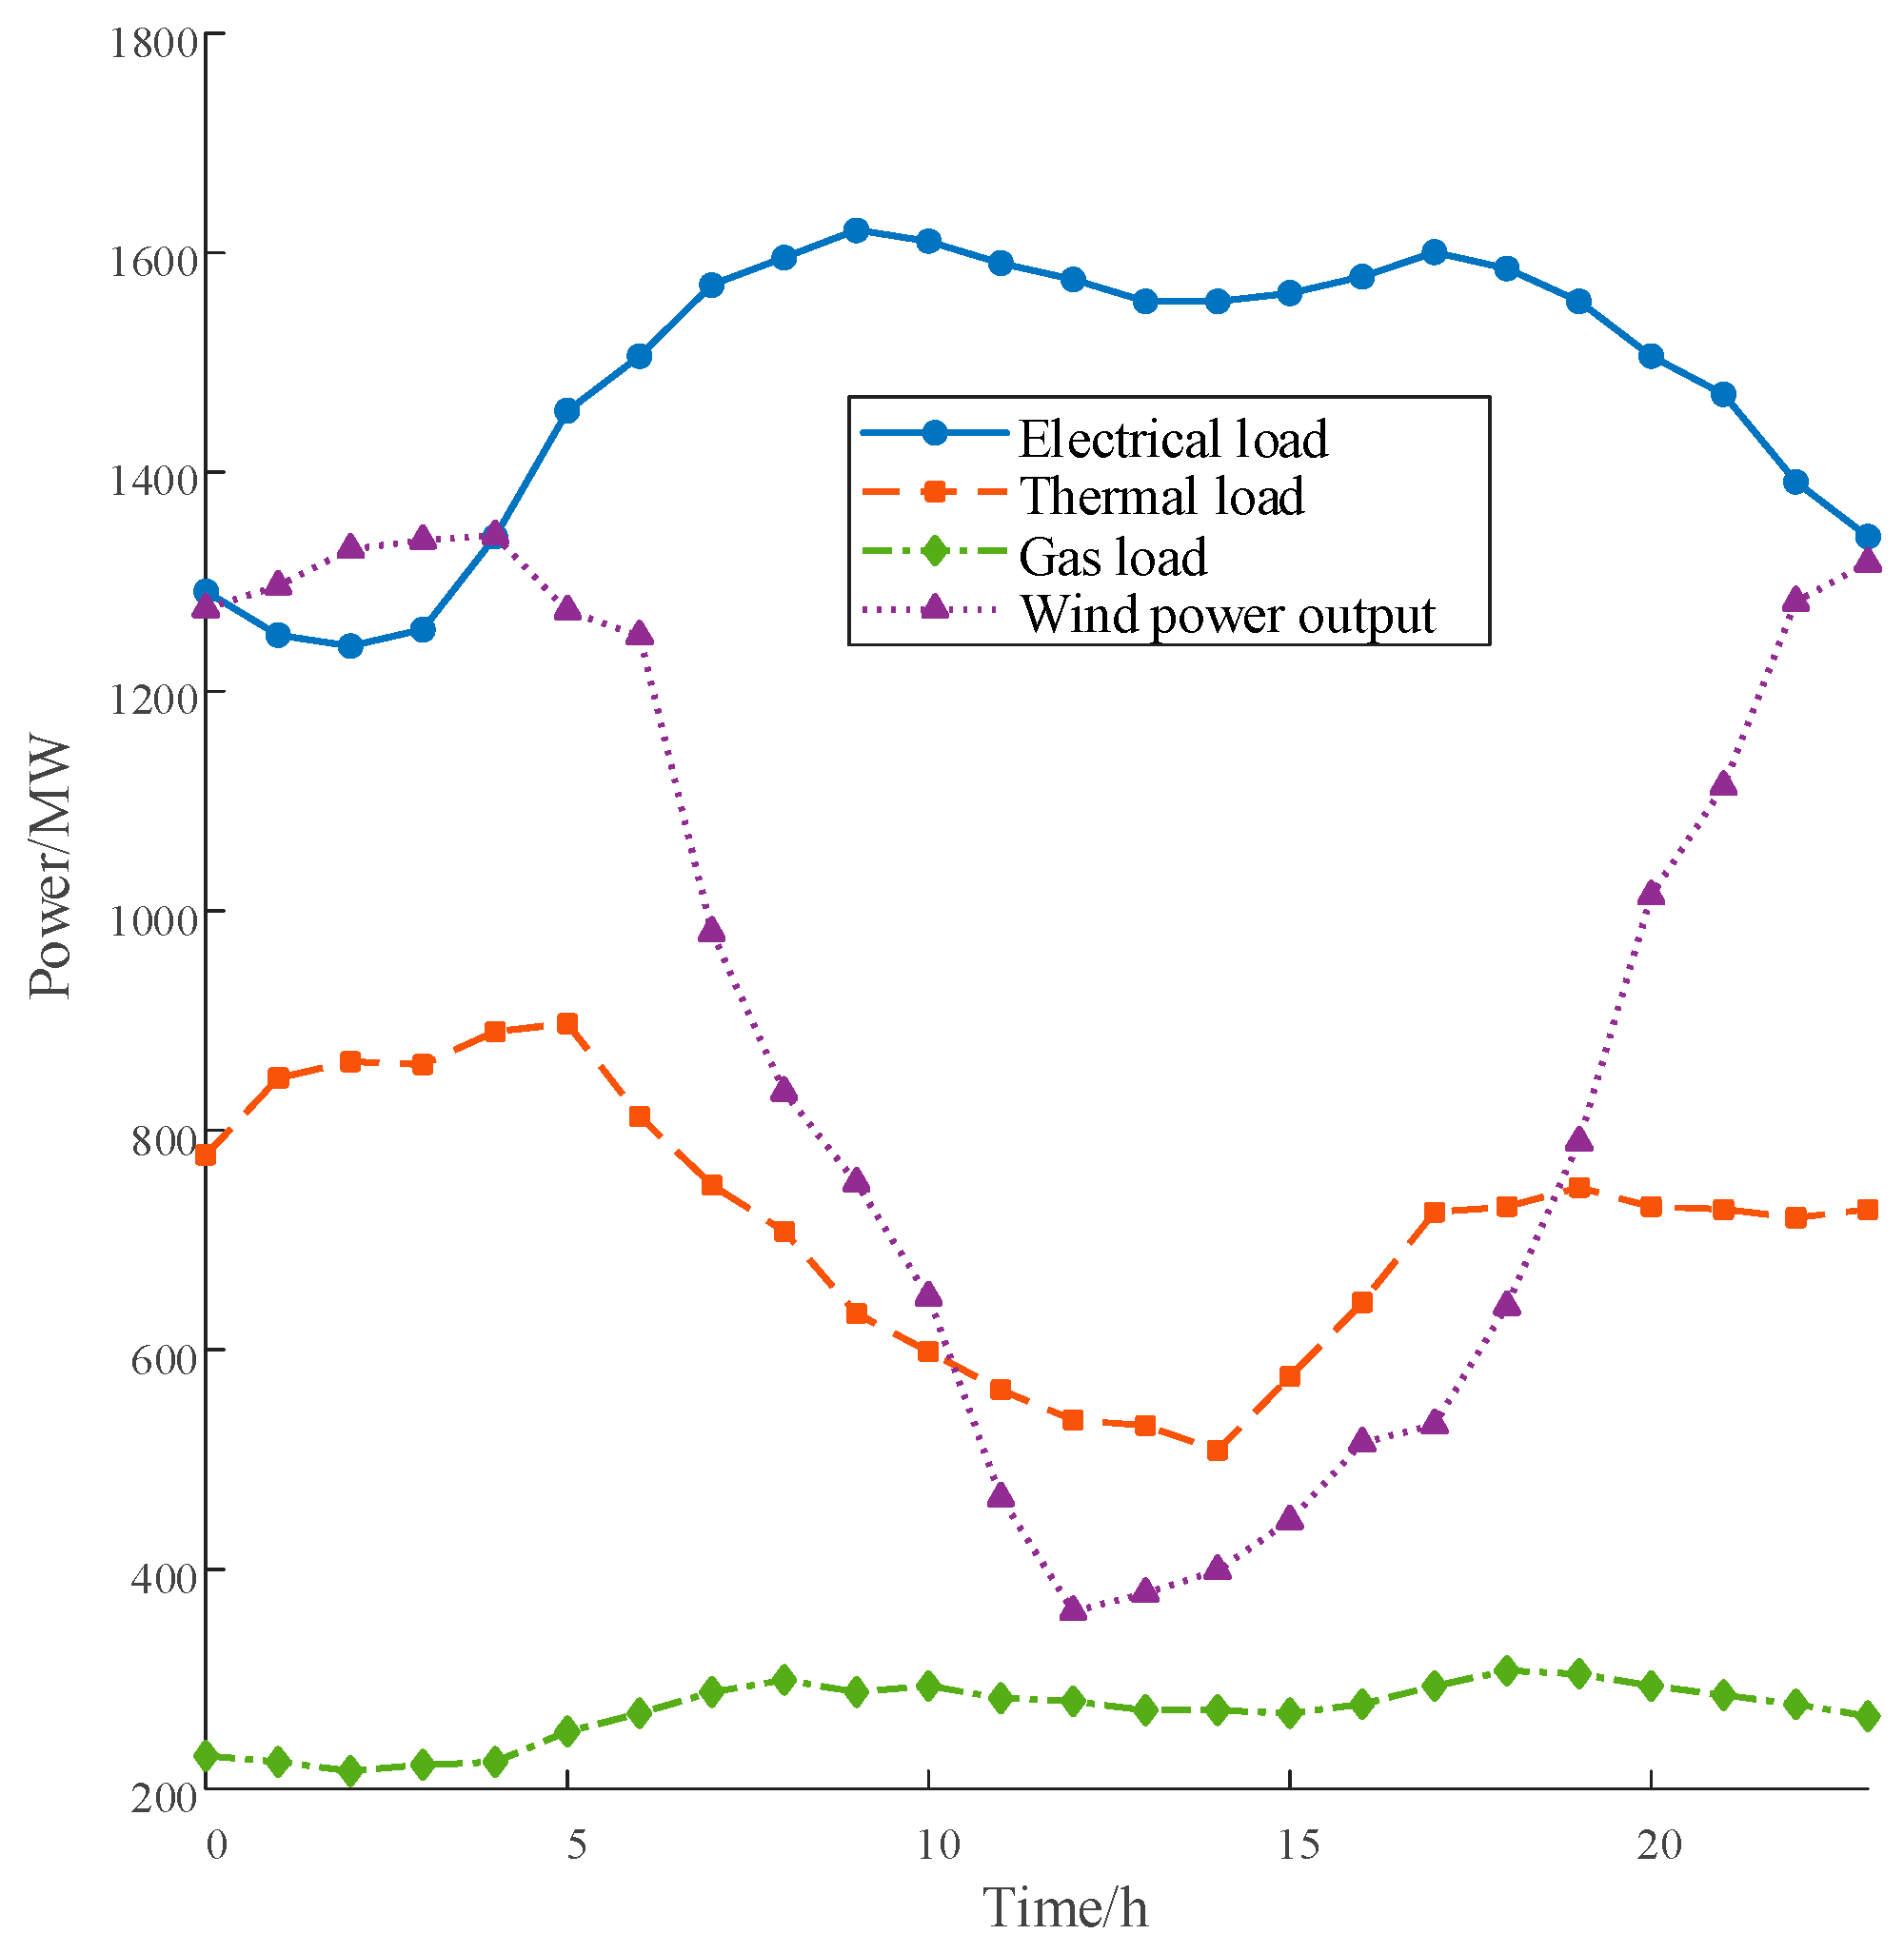
The proposed dispatch model employs a 24 h scheduling horizon for optimal operation, discretized into 1 h time steps. For a standard 24 h dispatch cycle (using Case 4 as the benchmark), the optimization problem involves 4120 continuous variables and 1440 binary variables, subject to 8950 total constraints. The model was solved using the CPLEX (Version [12.0], IBM, Armonk, NY, USA) solver via the YALMIP toolbox (Version [R20210331]) in MATLAB (Version [R2023b], MathWorks, Natick, MA, USA) on an Intel Core i7 CPU (2.90 GHz) with 16 GB RAM, achieving an average solve time of 14.2 s with the relative MIP gap strictly set to 0.01% (1 × 10⁻⁴). The forecasted curves for the diverse internal load demands and wind power output are illustrated in Figure 4. The maximum allowable power purchased from the external grid is capped at 500 kW. The natural gas price is set at 3.23 CNY/m3, and the time-of-use electricity prices are detailed in Table 2. Furthermore, the detailed parameters of the energy storage and energy conversion equipment are summarized in Table 3 and Table 4, respectively. The key technical parameters, including electrolyzer efficiency and the fuel cell heat-to-power ratio, are determined based on prevalent commercial technical standards and empirical data reported in the literature [28].
To analyze the impact of the coupled dynamic green certificate trading and green hydrogen certificate trading mechanism on IES optimal operation, based on the aforementioned wind power forecasting results, four operational scenarios are established for analysis:
  • Case 1: IES optimal operation method not considering the dynamic GCT-GHCT mechanism;
  • Case 2: IES optimal operation method considering the dynamic GCT mechanism;
  • Case 3: IES optimal operation method considering GHCT mechanism;
  • Case 4: IES optimal operation method considering the dynamic GCT-GHCT mechanism.

5.1.1. Analysis of Dispatch Results Under Different Scenarios

Table 5 presents the dispatch results under the four operational scenarios. The simulation results demonstrate that introducing the dynamic green certificate trading mechanism effectively increases carbon emission costs, thereby forming a strong constraint on system carbon emissions; compared to Scenario 1, its carbon emissions are significantly reduced by 91.56%. The synergistic interaction of multiple physical energy-flow mechanisms drives this remarkable decarbonization. First, the joint mechanism elevates the wind power accommodation rate from 87.9% to 97.5%, drastically reducing reliance on the carbon-intensive external grid by directly substituting high-penetration zero-carbon electricity. Second, surplus zero-carbon electricity powers the electrolyzer to produce green hydrogen, which is subsequently fed into the MR. This P2G process physically absorbs carbon dioxide, functioning as a critical carbon sink that directly offsets the emissions from gas-fired equipment. Finally, the system optimizes its combined heat and power supply through the highly efficient cascading utilization of HFC, thereby reducing overall natural gas consumption. Consequently, through the dual mechanism of source-side zero-carbon substitution and terminal-side carbon capture, the system achieves deep decarbonization. Building upon this, the constructed carbon–green certificate linked trading mechanism further achieves collaborative optimization of environmental and economic efficiency. Under this scenario, the system reduces total operating costs by 5.15% while slashing carbon emissions by 36.46%. Therefore, through rational mechanism design coordinating dynamic green certificates and green hydrogen certificate trading, this mechanism can effectively optimize system resource allocation, significantly reducing carbon emissions while lowering operational costs, demonstrating substantial comprehensive carbon reduction benefits.

5.1.2. Impact of a Dynamic GCT and GHCT Joint Mechanism on the Operational Characteristics of IES

Utilizing the Monte Carlo stochastic framework, we generated 1000 randomized operational days (varying wind output, load demands, and base pricing). The RFR model and subsequent game-theory weighting were trained on this robust 1000-sample dataset, completely eliminating the overfitting concern. As demonstrated in Table 6, the profound disparities in total operating costs, carbon emissions, and wind power accommodation rates across different trading frameworks indicate that the dynamic dual-certificate trading mechanism significantly alters the optimal dispatch of the hydrogen-coupled IES. However, while these results highlight macro-level performance enhancements, they are insufficient to fully elucidate the underlying internal operational dynamics. Therefore, the subsequent section delves into the granular operational characteristics of the IES, analyzing the temporal interplay between green power certificate pricing, hydrogen certificate trading volumes, and the dynamic supply–demand matching of wind-to-hydrogen generation against the hydrogen load.
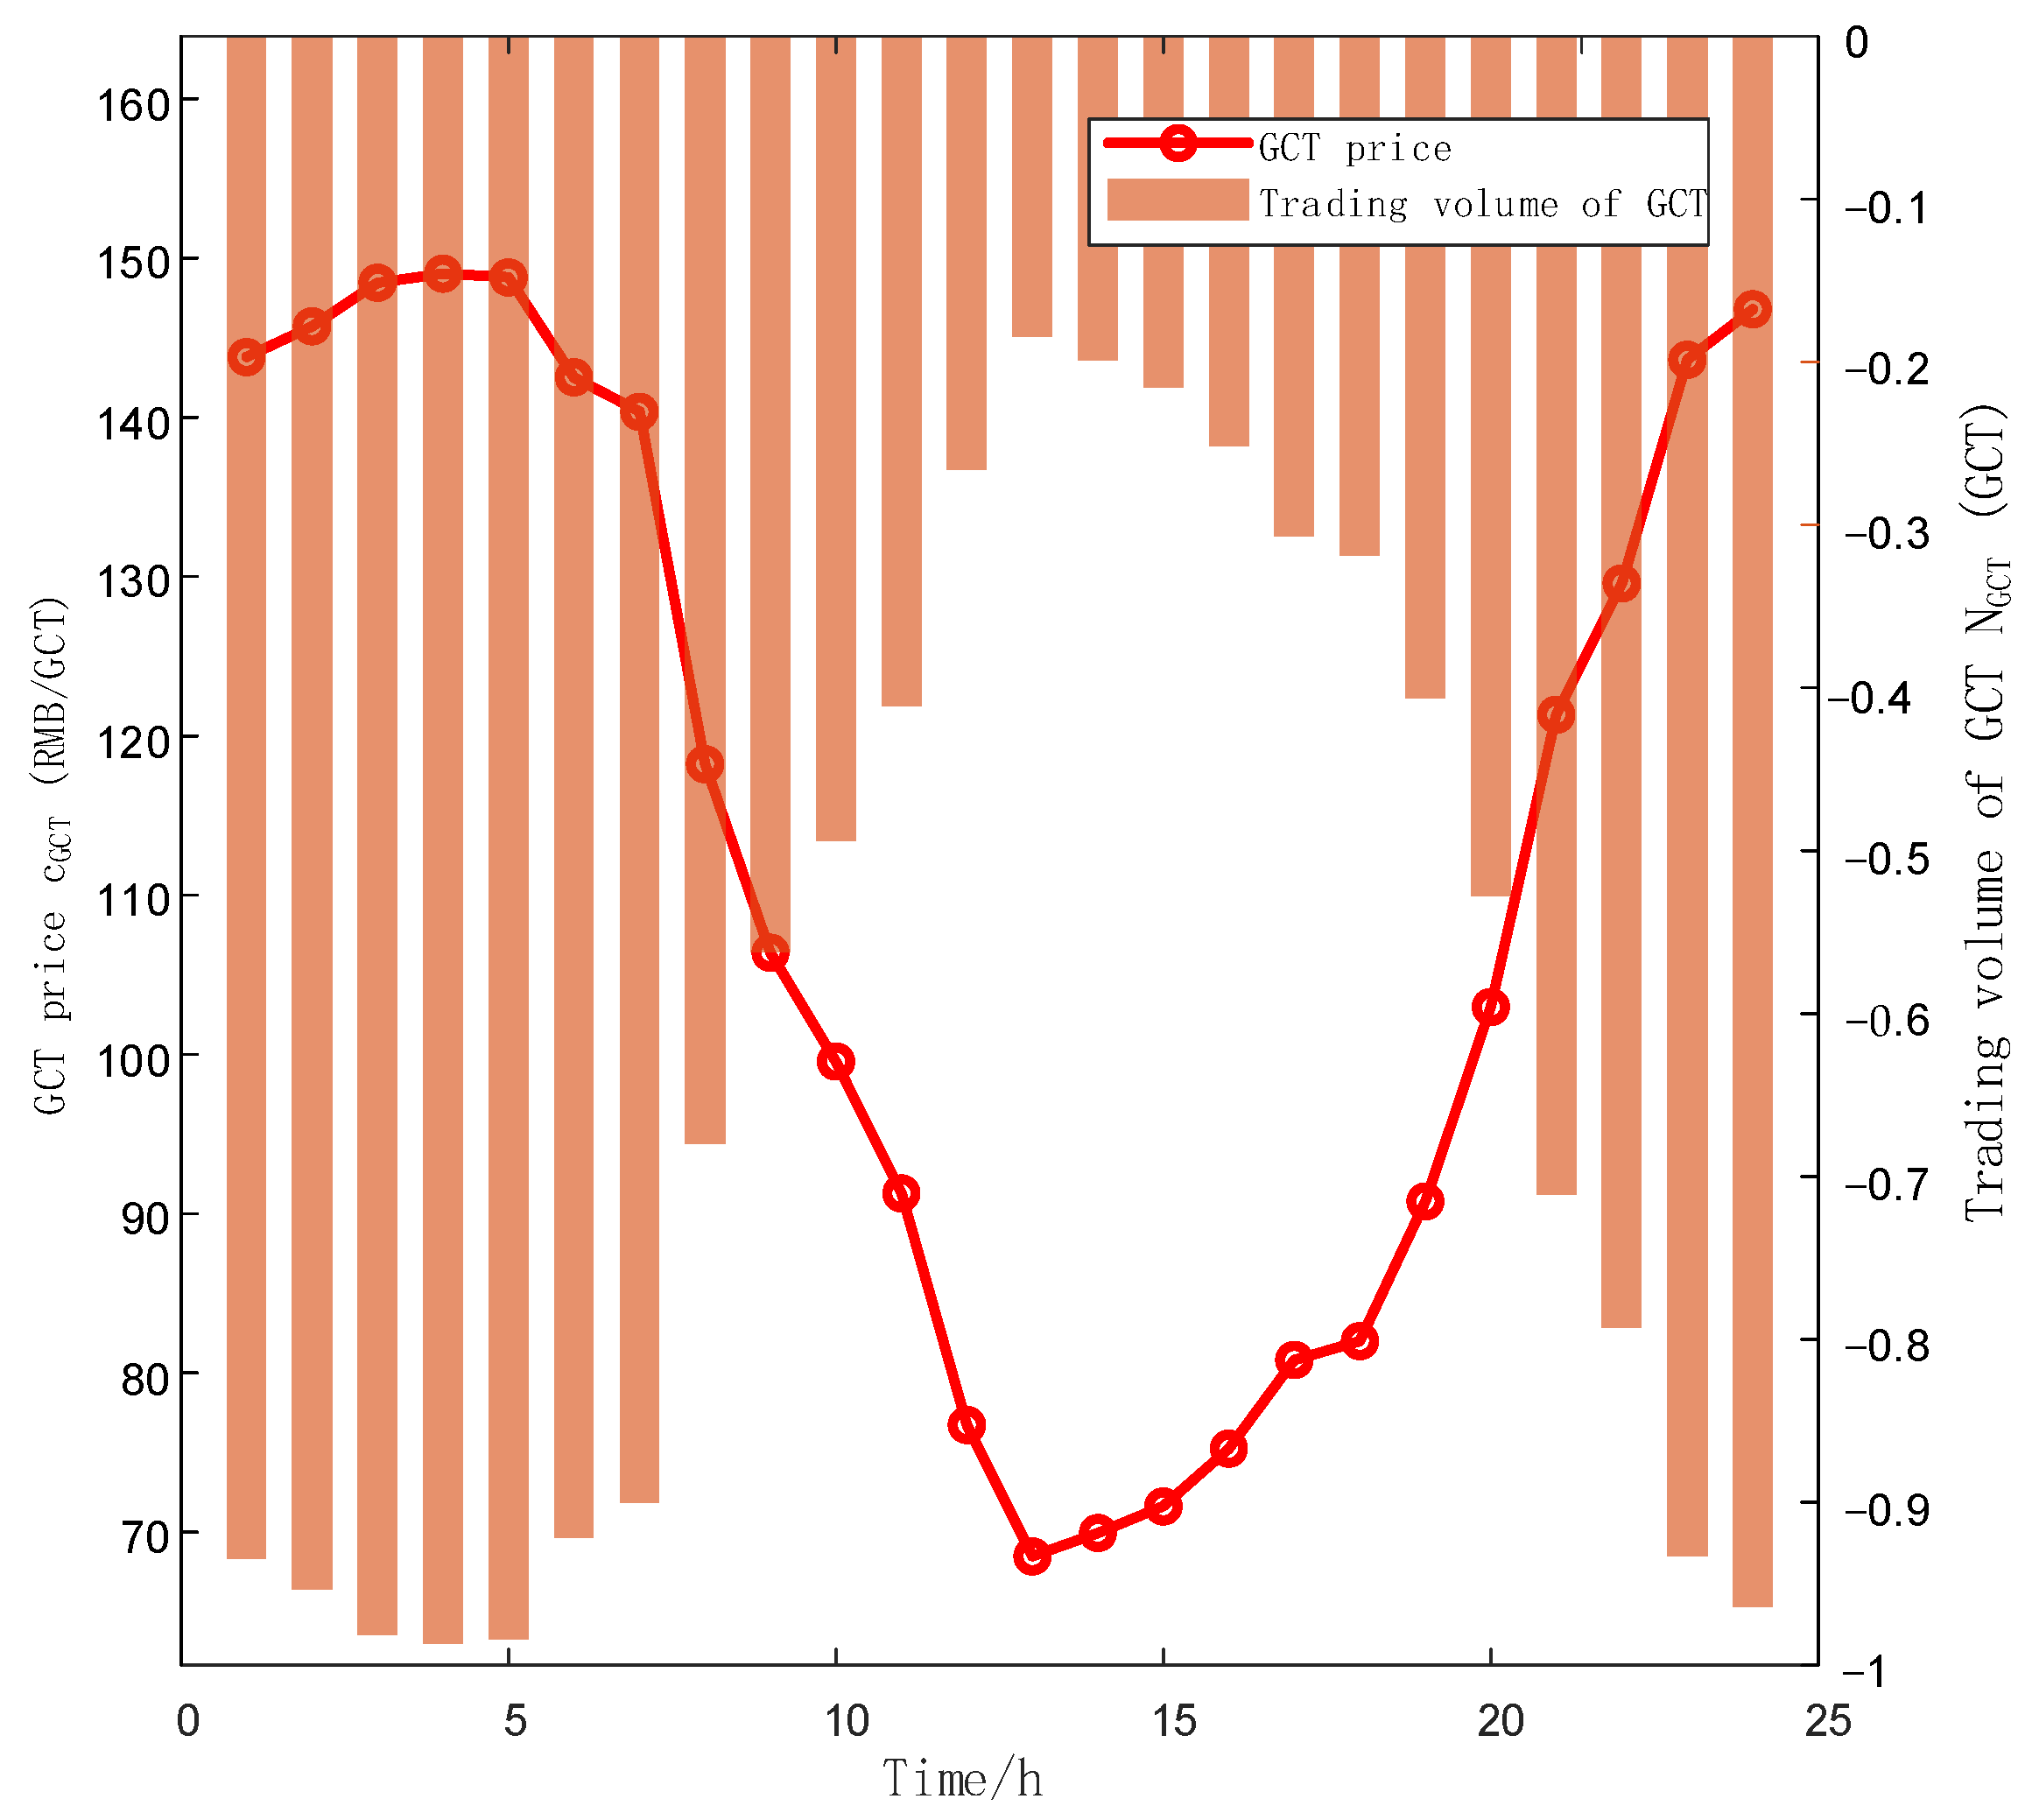
The relationship between the trading price and quantity of green power certificates across different time periods is illustrated in Figure 5. Combined with Figure 4, during the periods in the ranges of 00:00–06:00 and 22:00–24:00, wind power output is abundant while the electrical load demand is low, resulting in a large number of issued green certificates. Consequently, the volume of green certificates sold after meeting the quota is relatively high during these periods, pushing the selling price toward the reward zone and keeping the price elevated. Between 07:00 and 21:00, wind power output decreases while electrical demand surges, leading to fewer issued green certificates and fewer certificates available for sale after meeting the quota. Thus, the green certificate price leans lower. At 13:00, the demand for green certificates peaks, driving the price toward the floor limit, resulting in the lowest selling price.
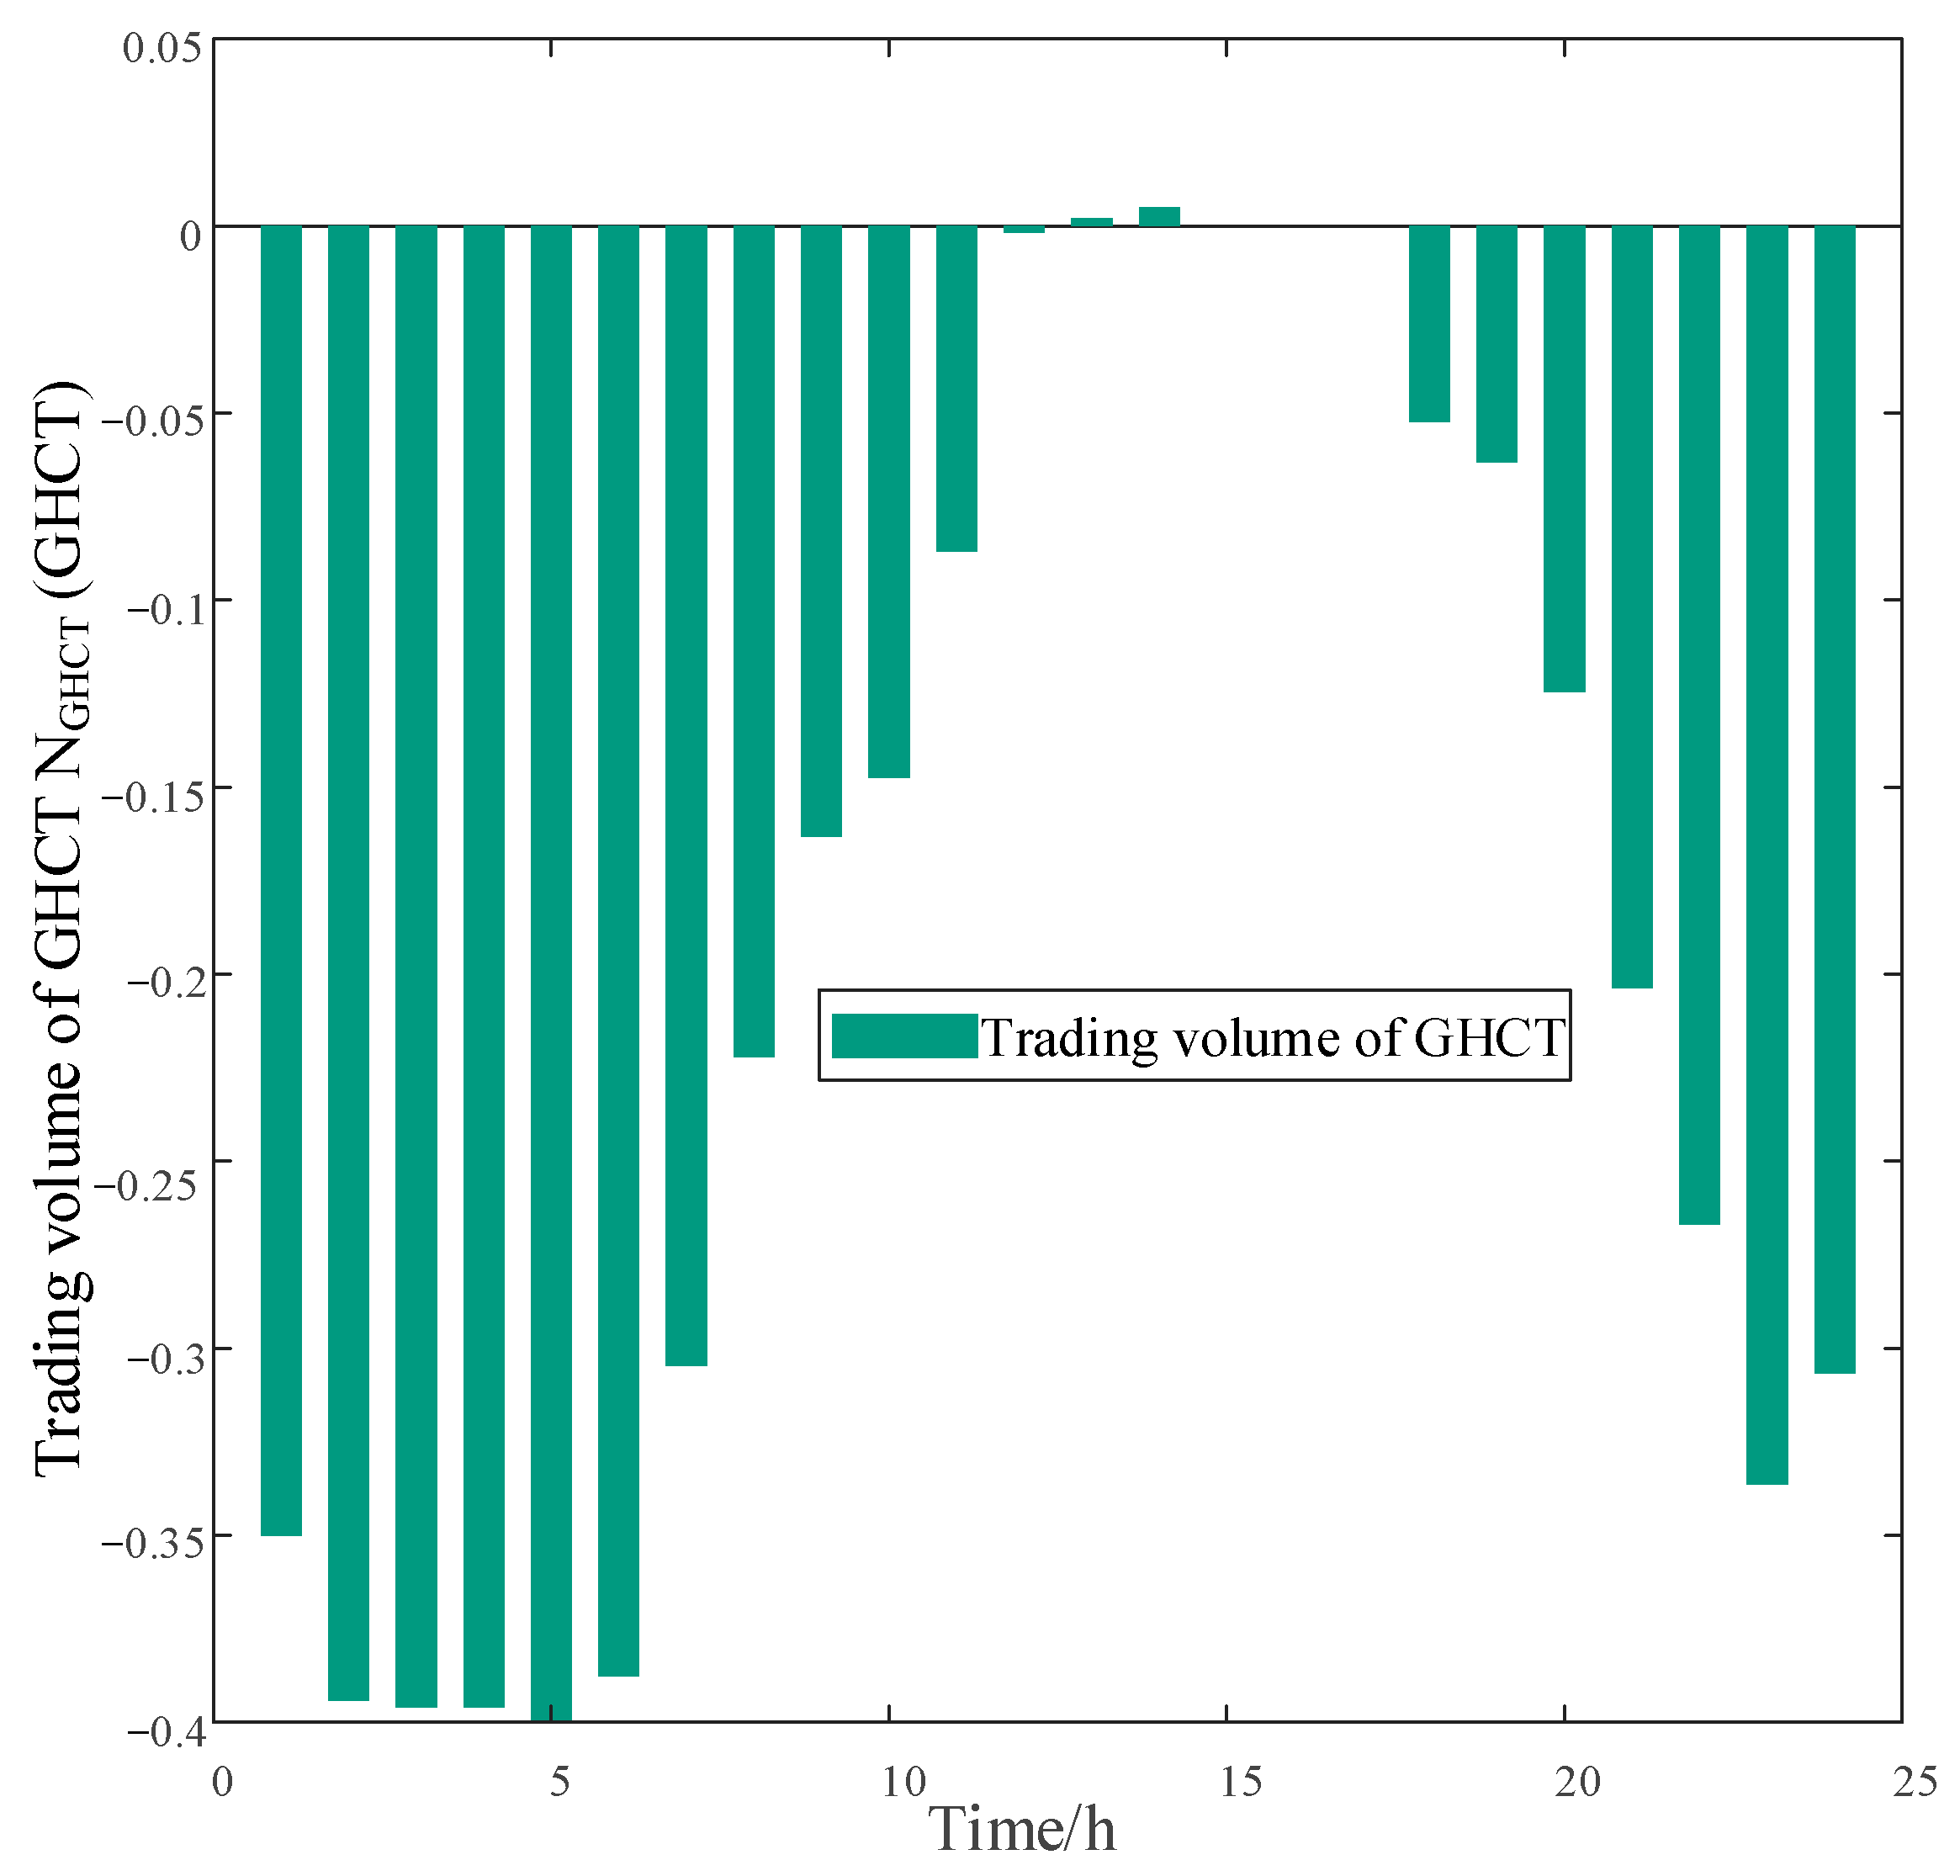
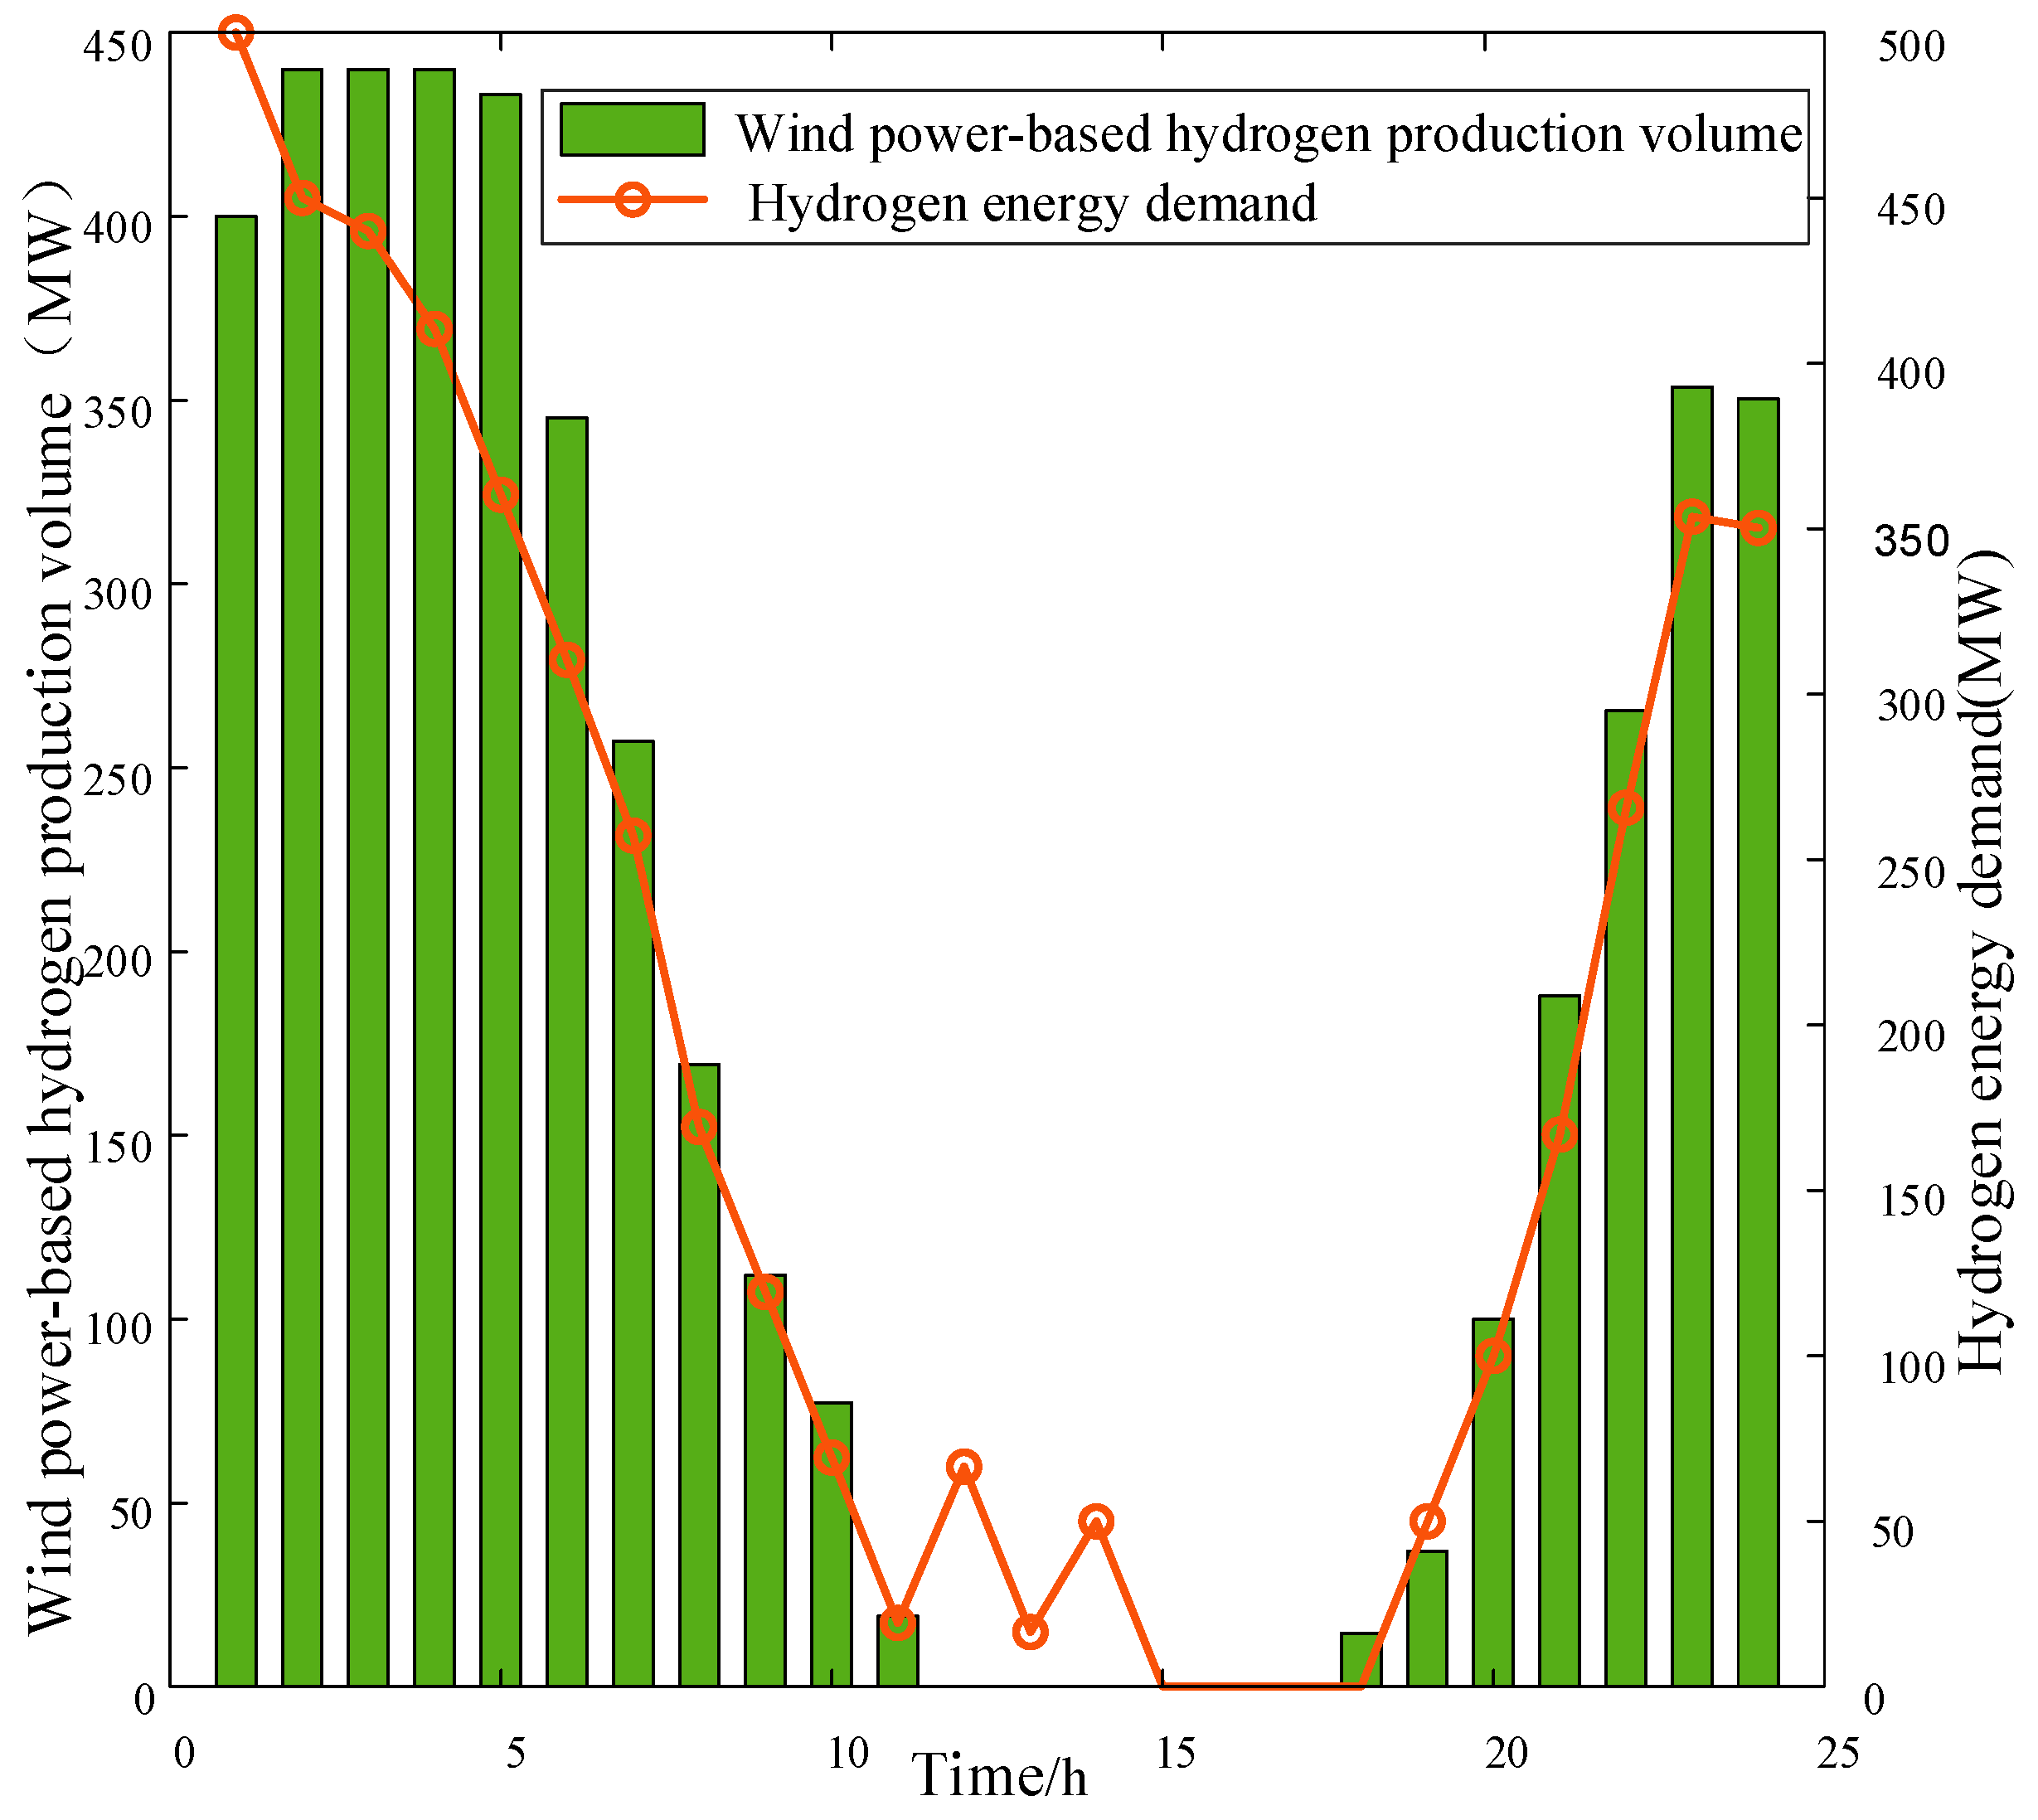
The relationship between the trading volume and time periods for green hydrogen certificates is shown in Figure 6. Correlating with the wind power and hydrogen demand dynamics in Figure 7, during the time ranges of 00:00–06:00 and 22:00–24:00, wind power is ample, and the volume of green hydrogen produced from wind power significantly exceeds the hydrogen demand, leading to a high volume of green hydrogen certificates sold. During the rime ranges of 07:00–12:00 and 17:00–22:00, wind power output drops, reducing wind-to-hydrogen production, but it still meets the hydrogen demand, resulting in fewer certificates sold. Between 12:00 and 17:00, wind power output hits its trough, wind-to-hydrogen production is at its minimum and falls short of the hydrogen demand, necessitating the purchase of green hydrogen certificates.

5.2. Impact Evaluation of the Dynamic GCT-GHCT Mechanism on IES Optimal Operation

The coordinated optimal operation scheme of the IES under the dynamic GC-GHC trading mechanism is directly influenced by the green certificate quota coefficient and the green hydrogen certificate quota coefficient. To comprehensively evaluate the impact of this joint optimal dispatch, simulation runs were conducted for each scenario under varying quota coefficients, yielding multiple sets of evaluation indicator data. The results are detailed in Table 6.

5.2.1. Calculation Results of Indicator Weights

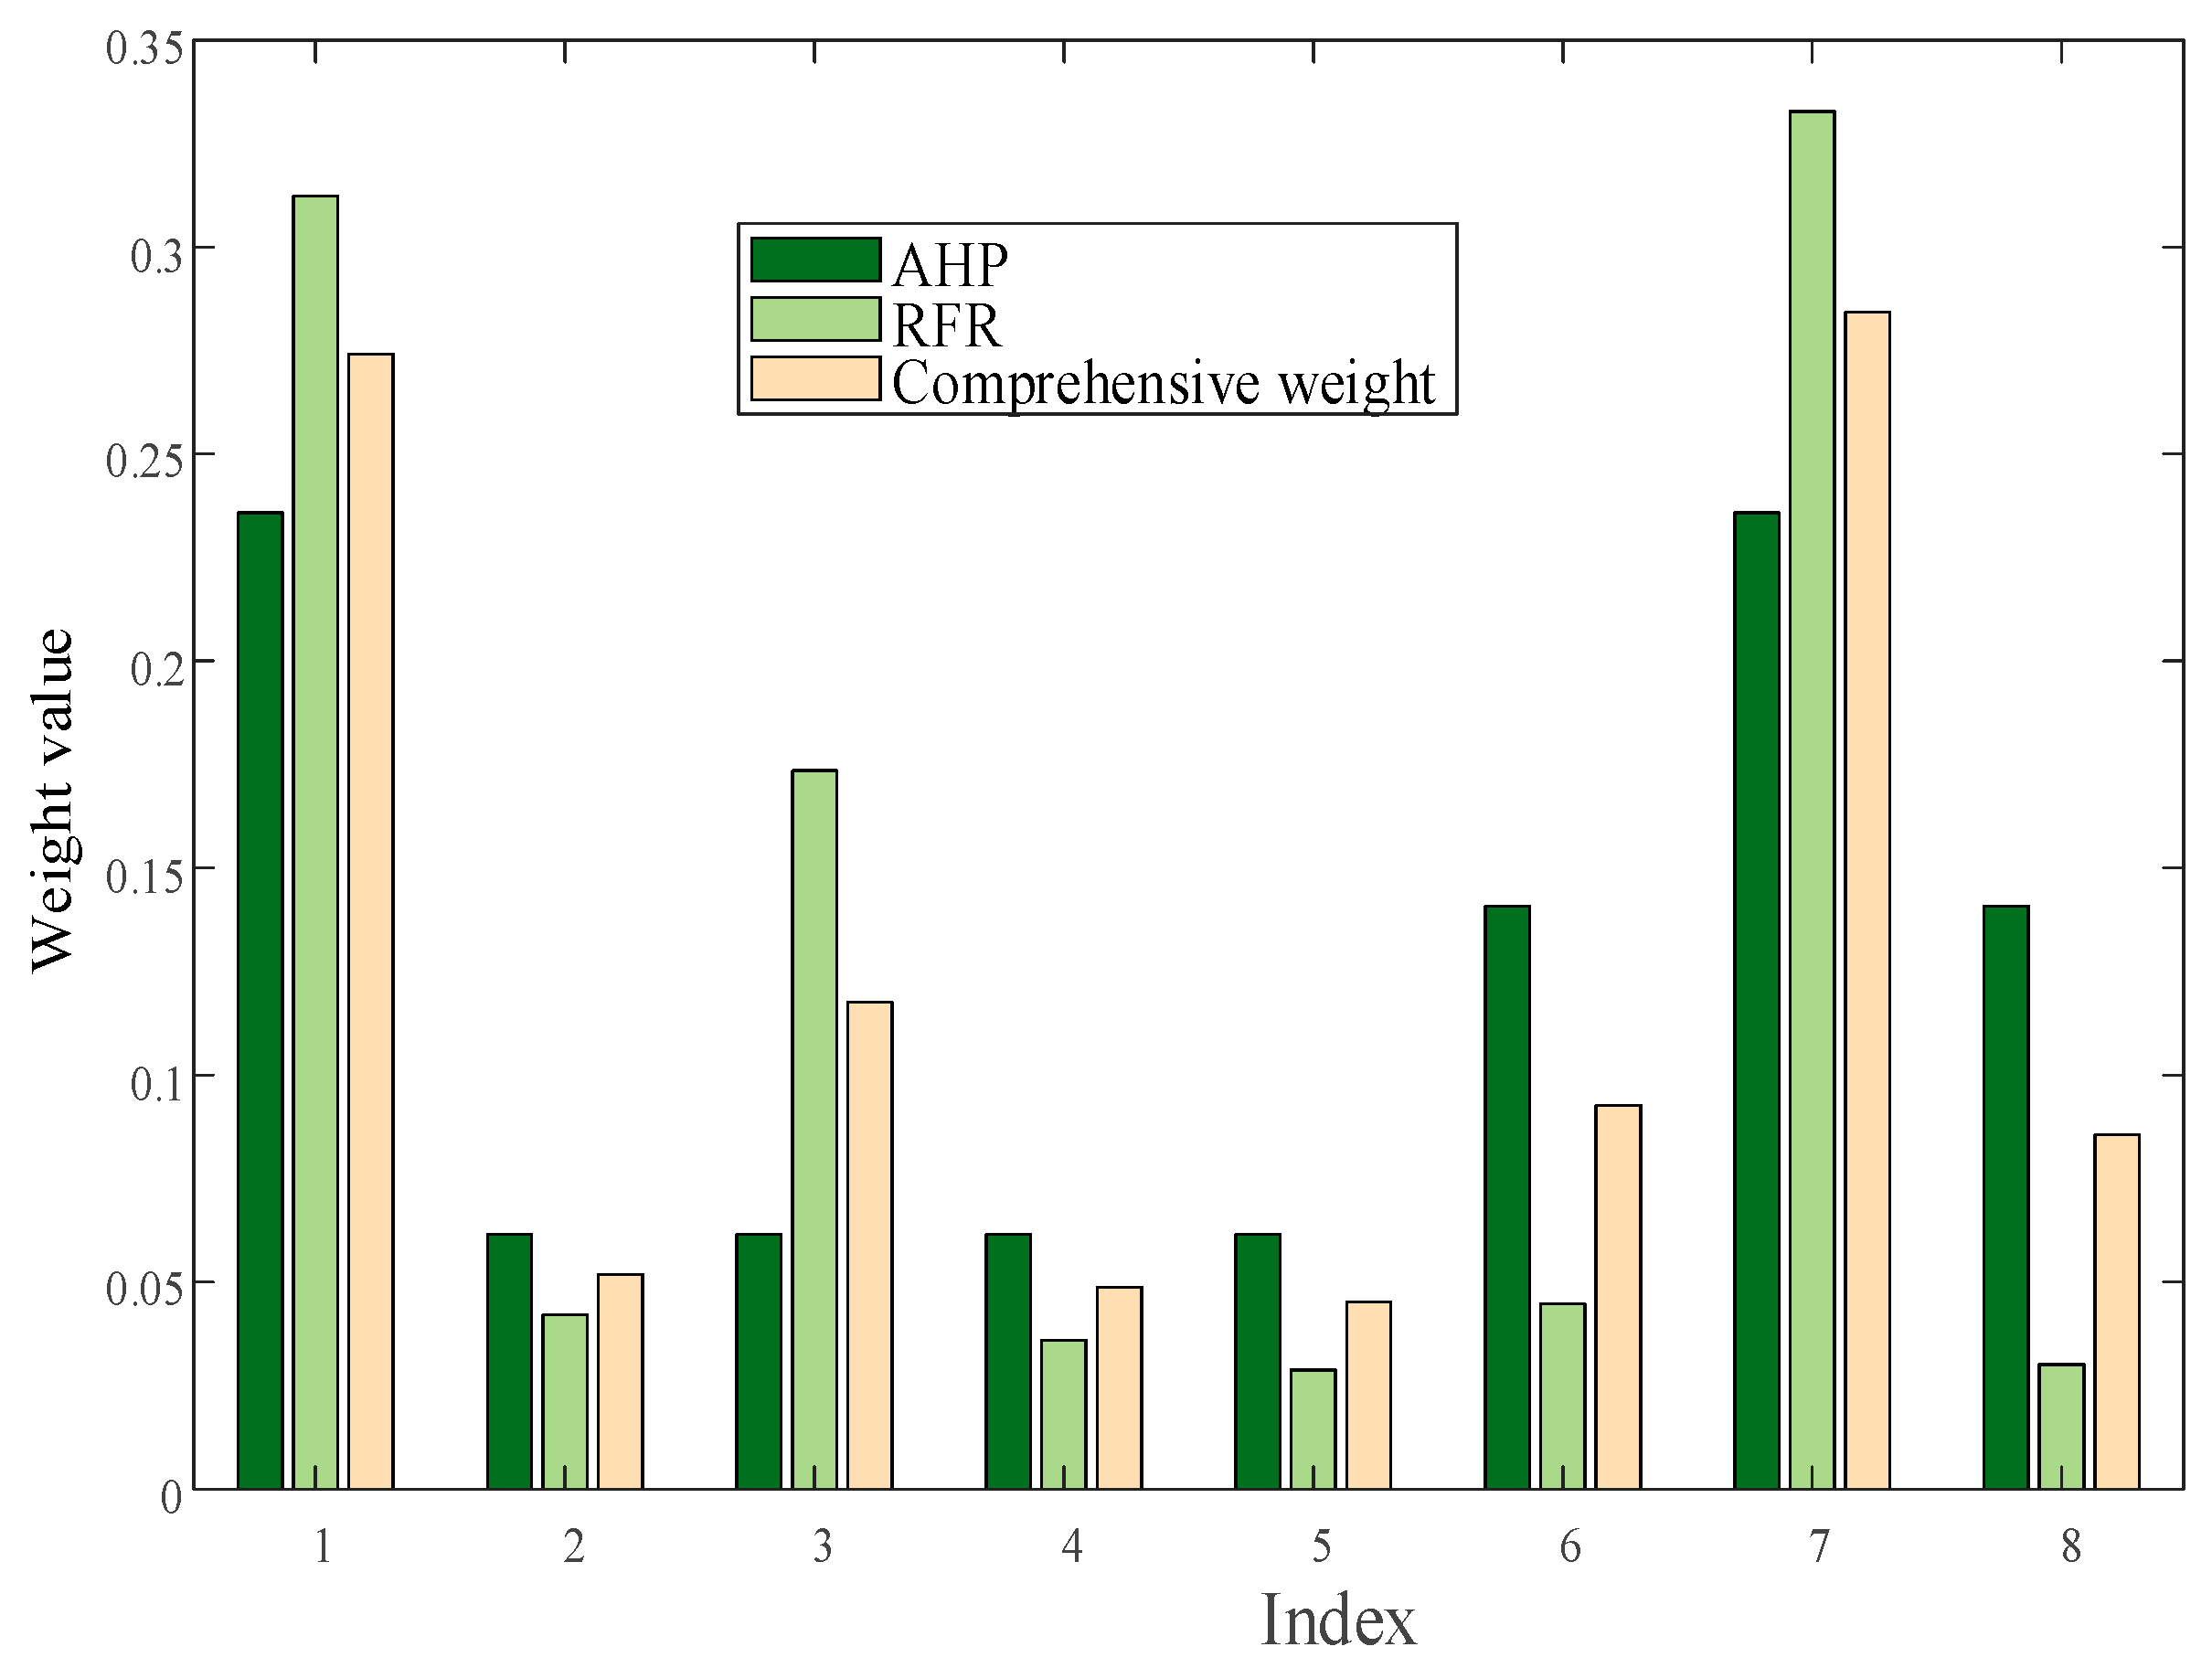
After standardizing the raw data from Table 6, the indicator weights were calculated using AHP and the objective weighting method RFR, followed by the determination of the comprehensive weights. The calculated weights are depicted in Figure 8. It is observable that significant differences exist between the weights calculated by AHP and RFR. The comprehensive weighting method fuses both, yielding a more balanced result. In the RFR results, the weights for indicators 6 and 8 (green hydrogen conversion efficiency and renewable energy penetration rate) are relatively small, whereas subjectively these indicators are of high importance. This indicates that RFR solely focuses on the impact degree of each indicator on the target variable, neglecting their subjective importance, which leads to unreasonable weight allocation. Conversely, the comprehensive weighting based on game theory integrates both subjective and objective aspects. The resulting weights present moderate deviations from the individual methods while clearly reflecting the distinct differences among the indicators, thereby compensating for RFR’s limitations without being overly subjective, demonstrating clear superiority.

5.2.2. Comprehensive Evaluation Results of the Asymmetric Cloud Matter-Element Model

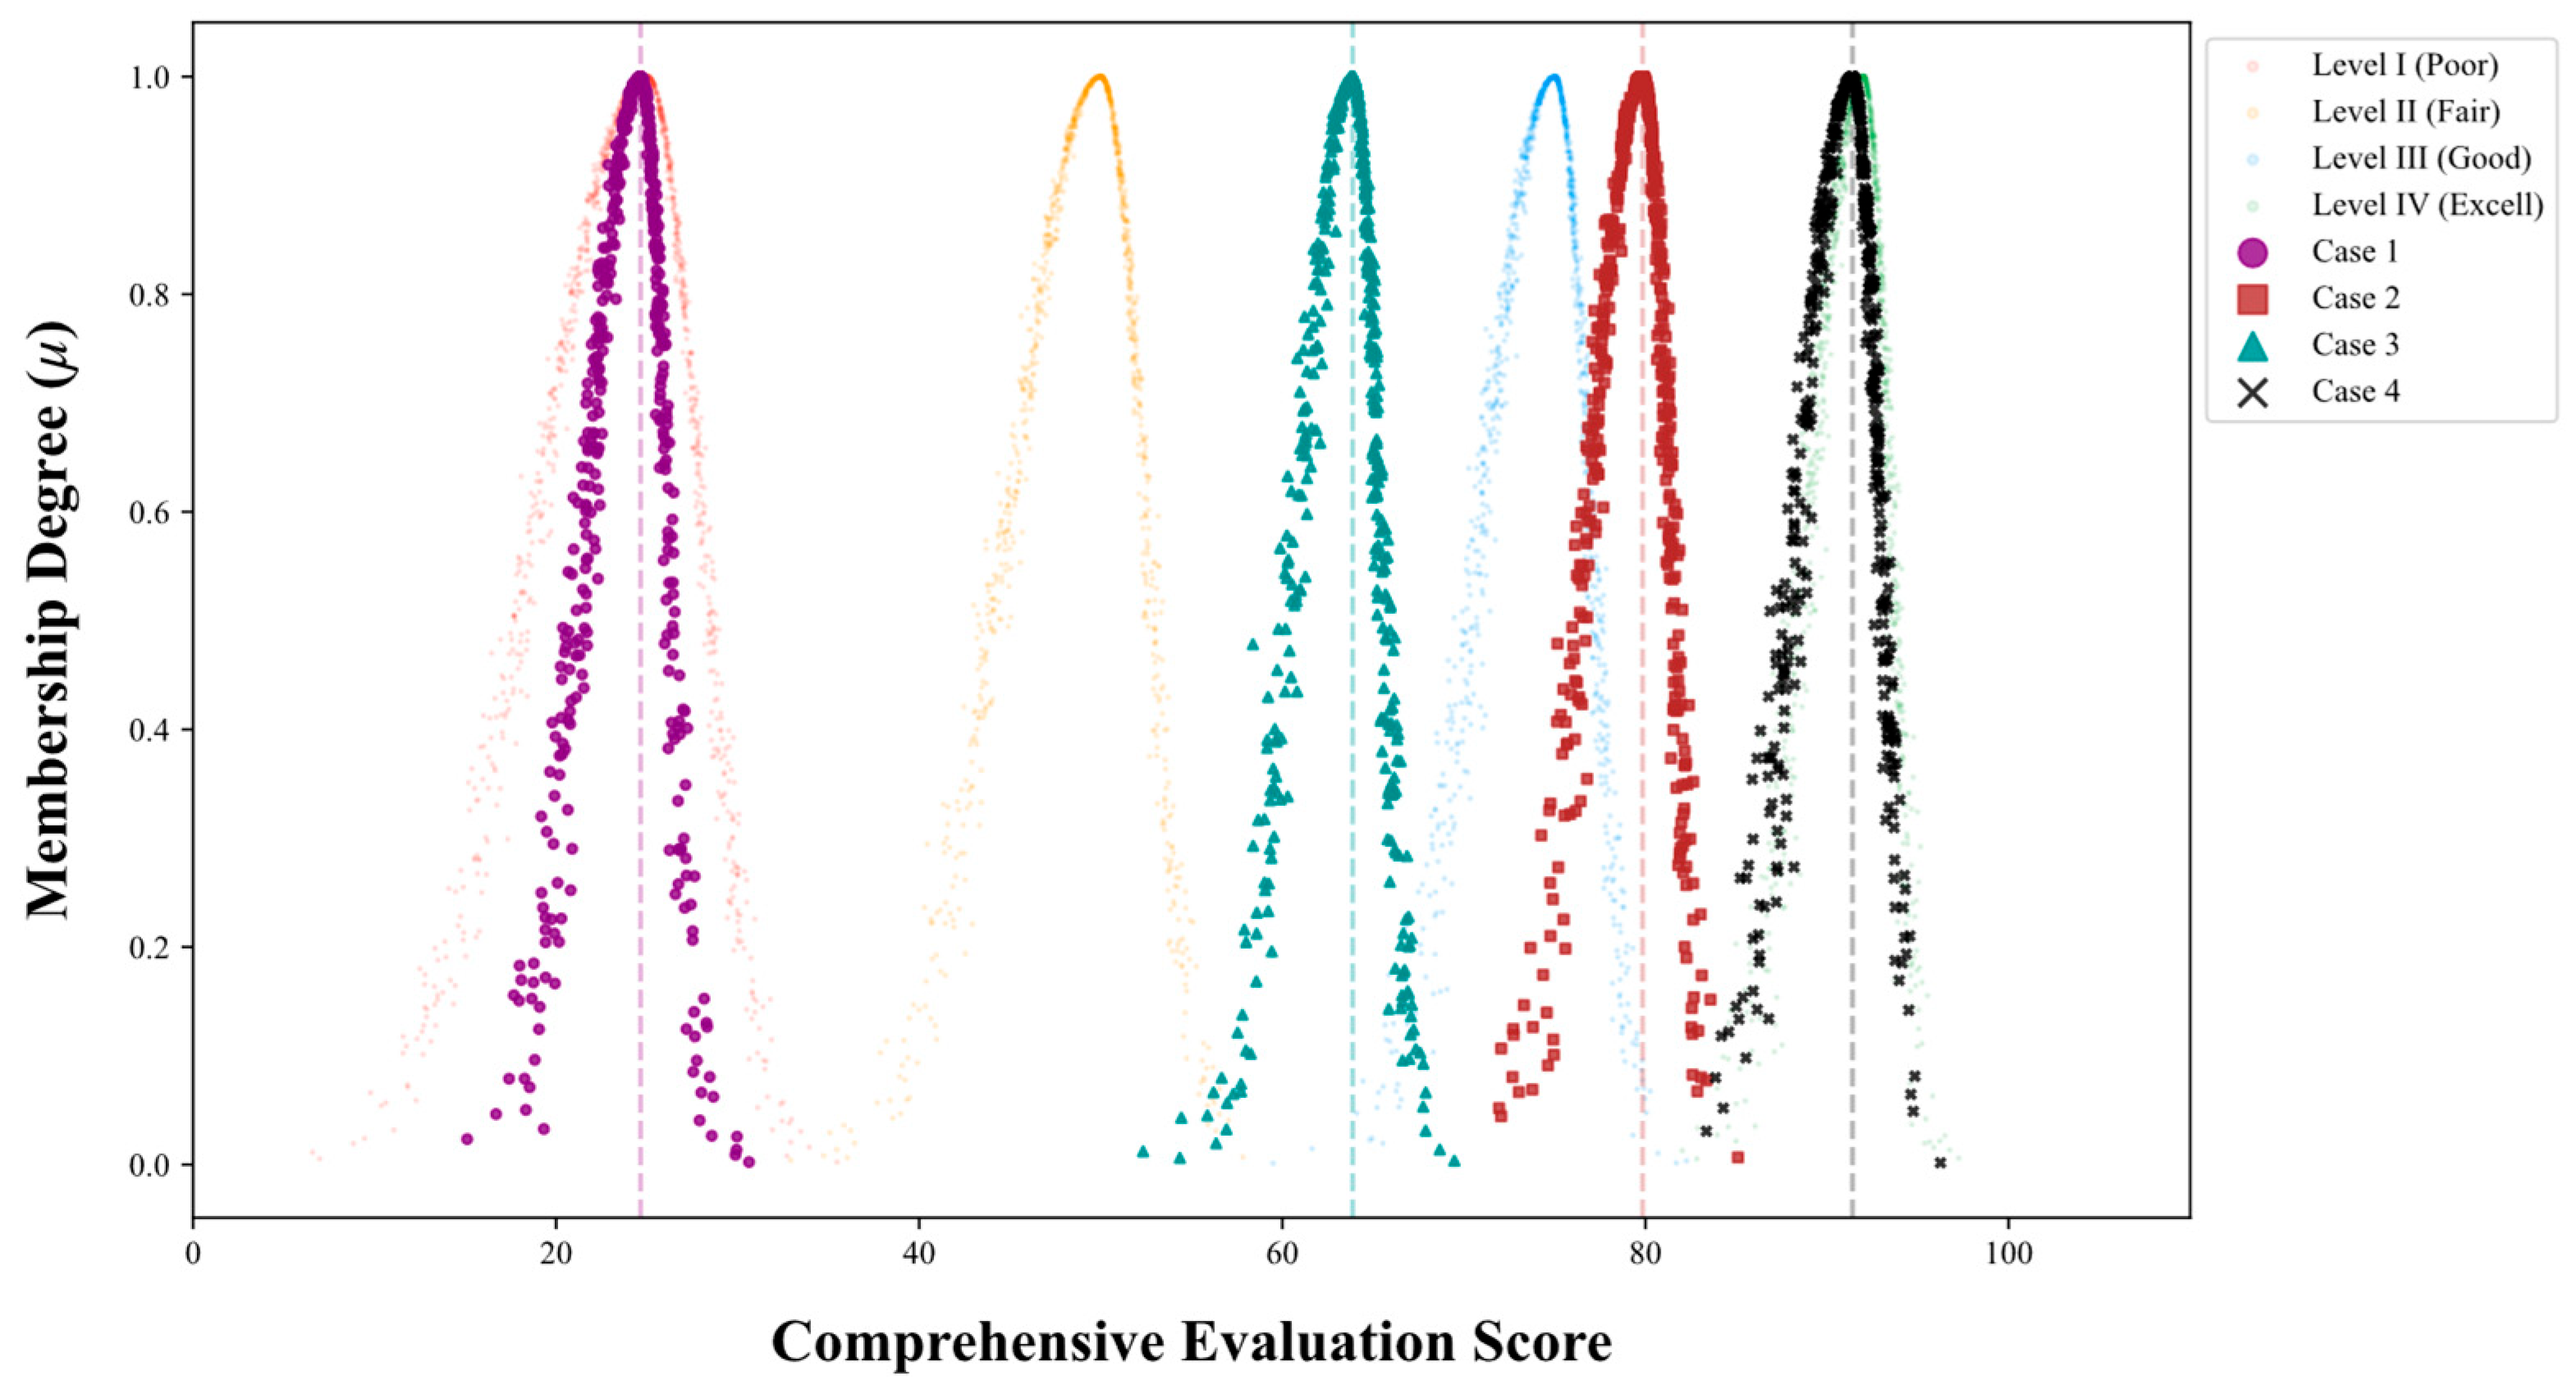
As depicted in Figure 9, Scenario 1 exhibits the poorest evaluation results. Its expected score is merely 24.66, with cloud drops densely distributed in the Level I (Poor) region. This indicates that in the absence of any certificate incentive mechanisms, the system tends to sacrifice carbon reduction performance and renewable energy accommodation to pursue short-term operational economy, resulting in extremely low comprehensive benefits that misalign with long-term low-carbon transition goals. Secondly, the comparative analysis between Scenarios 2 and 3 reveals the limitations of a single incentive mechanism. After incorporating the dynamic green certificate mechanism, the expected score of Scenario 2 significantly improves to 79.84, falling into Level IV (Excellent). This demonstrates that the green premium on the power side can substantially offset energy procurement costs and effectively drive wind power accommodation. Although Scenario 3 (incorporating only the green hydrogen certificate mechanism) sees its score rise to 63.87, the improvement is marginal compared to Scenario 2. This reflects that, under the current energy structure, relying solely on value compensation on the hydrogen side is insufficient to fully unleash the multi-energy complementary potential of the IES, thereby limiting system flexibility. Finally, Scenario 4 demonstrates the optimal system performance. Its expected score reaches a robust 91.40, making it the only configuration firmly anchored in the core region of Level IV. From the characteristics of the cloud diagram, the cloud drop distribution in Scenario 4 exhibits a high degree of high aggregation and low dispersion.
This phenomenon physically explains the positive coupling effect between dynamic green certificates and green hydrogen certificates: the green certificate mechanism incentivizes renewable energy integration at the front end, while the green hydrogen certificate mechanism further converts volatile power via the power-to-hydrogen process at the back end, achieving a dual superimposition of economic and environmental benefits for the “electricity–hydrogen” energy flow.

5.2.3. Evaluation Results Under Different Green Certificate Quota Coefficients

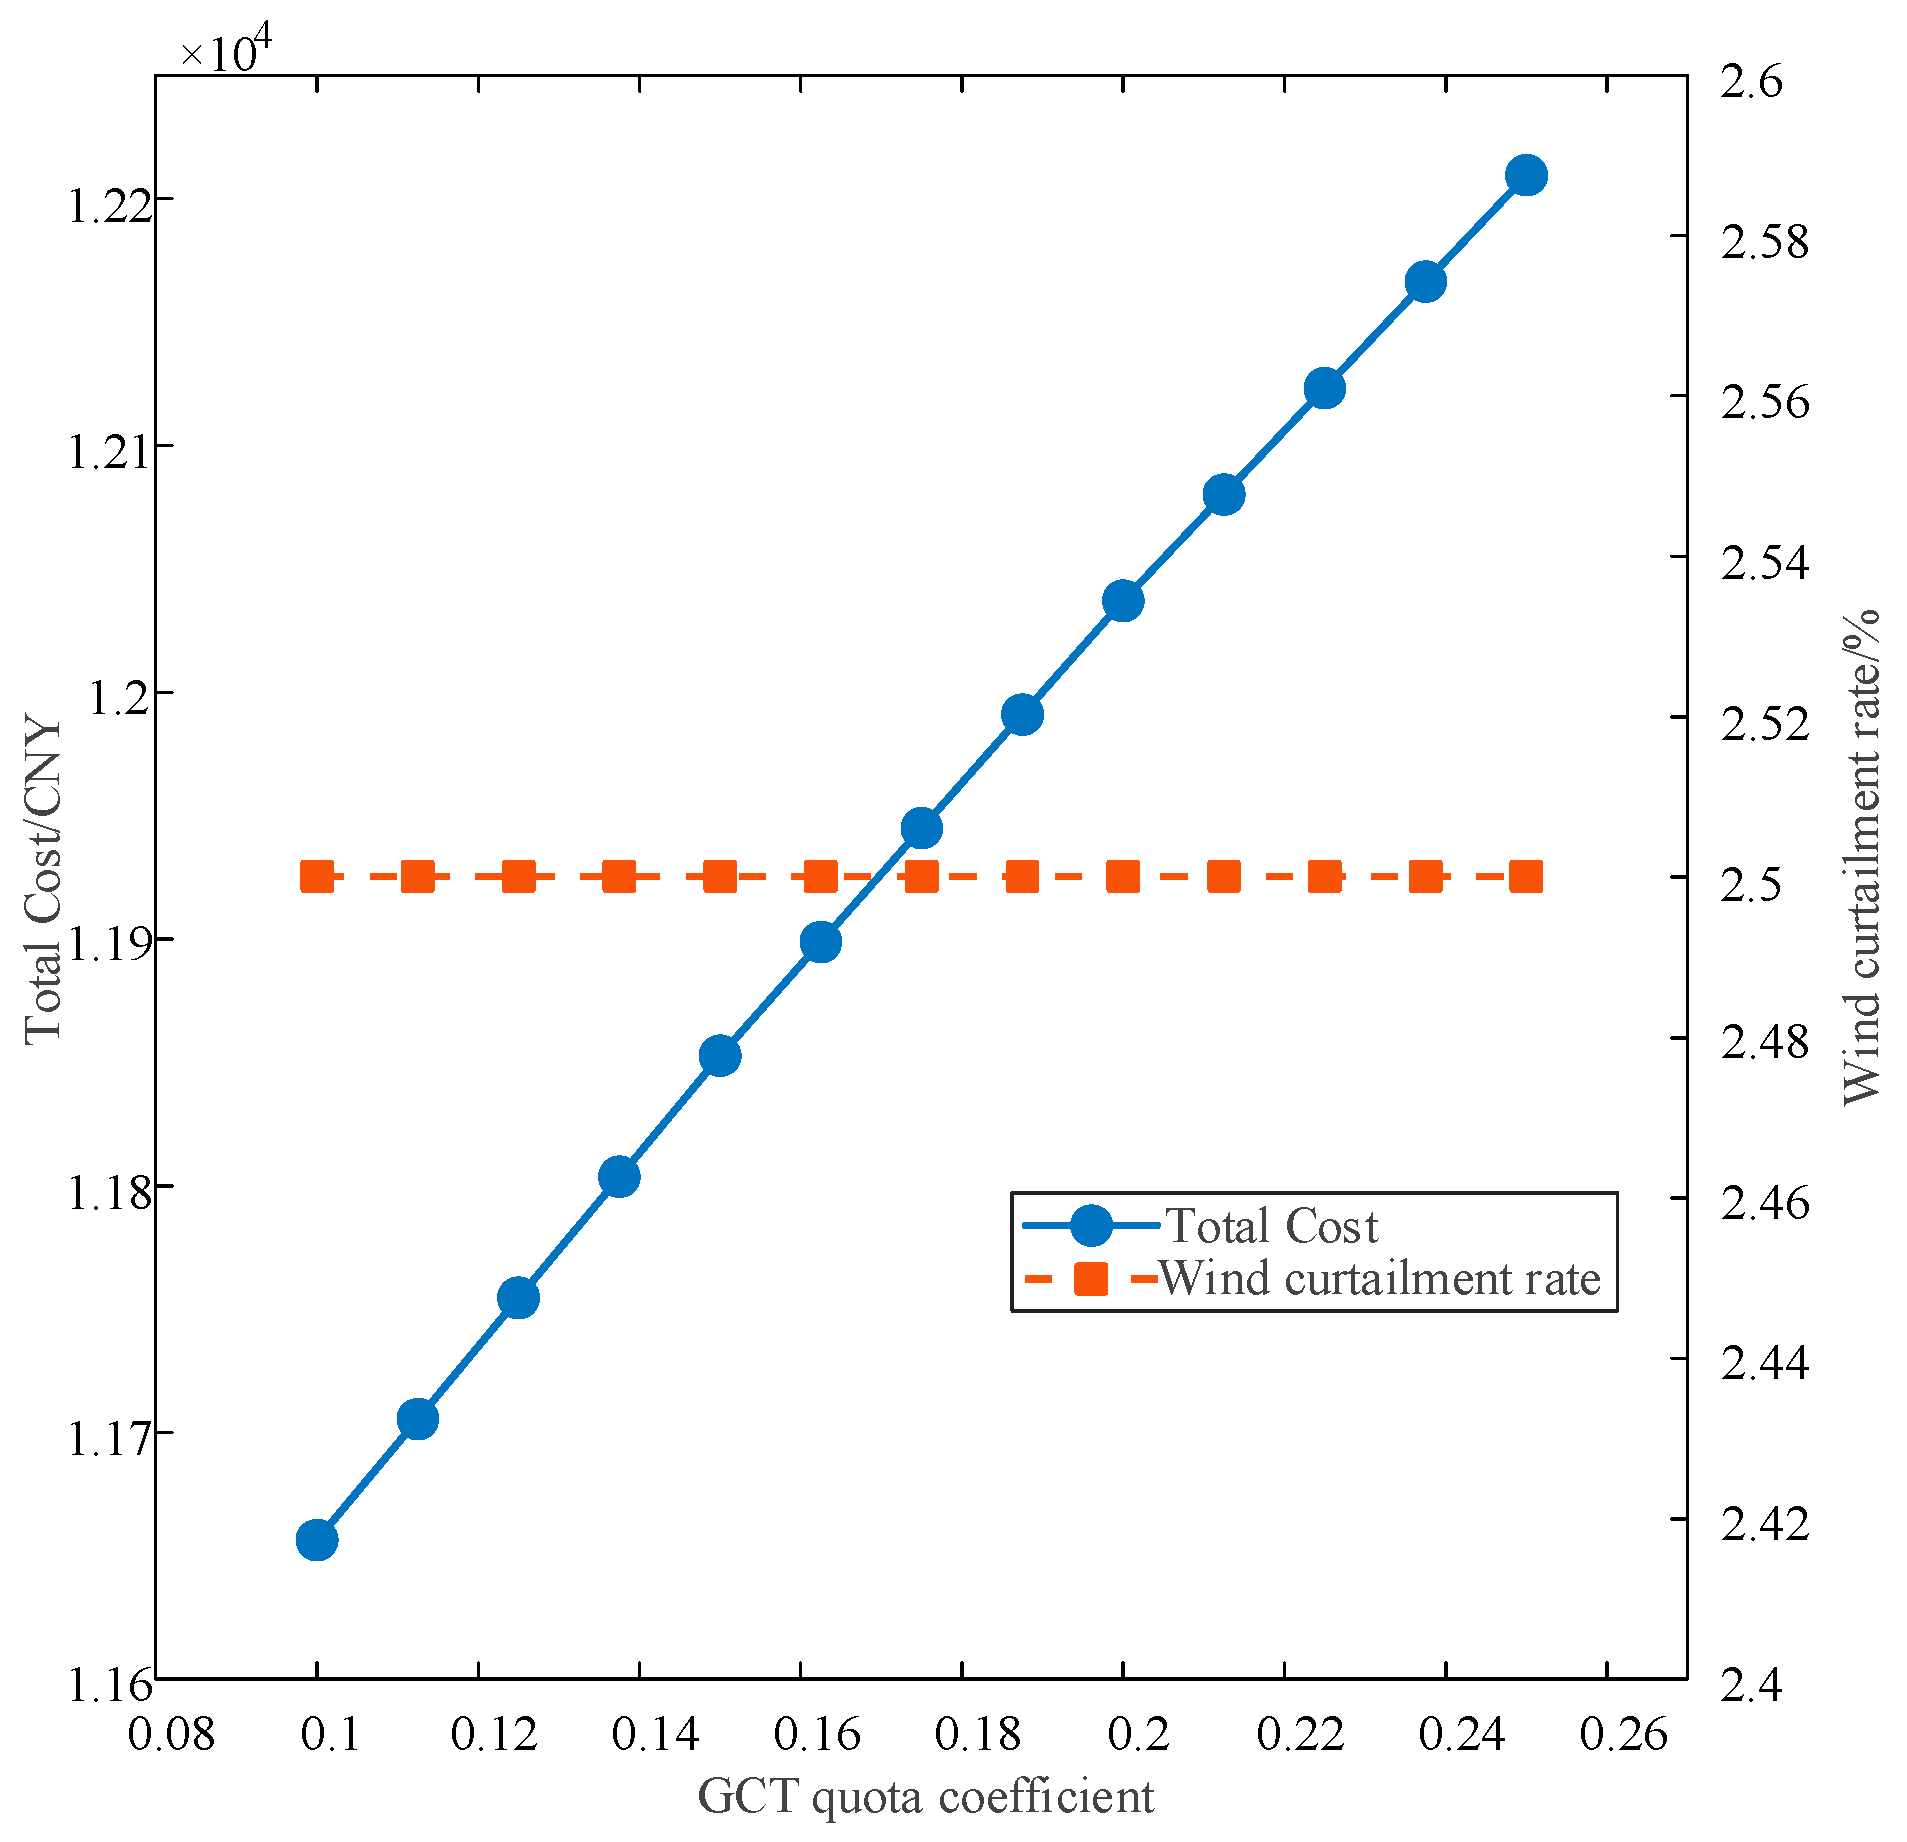
As illustrated in Figure 10, the trajectories of the system operating cost and wind curtailment rate in response to variations in the GCT quota coefficient exhibit distinct convergence and optimality. When the coefficient is set to 0.10, the wind curtailment rate drops to its physical accommodation limit, signifying a saturation state of environmental benefits where the marginal emission reduction gain diminishes to zero. Any further increment in the coefficient fails to enhance the integration level of renewable energy; instead, it triggers a linear surge in operating costs due to an excessive compensation mechanism. In summary, the value of 0.10 minimizes the economic burden while safeguarding environmental technical indicators, serving as a globally recommended coefficient with Pareto-optimal characteristics.
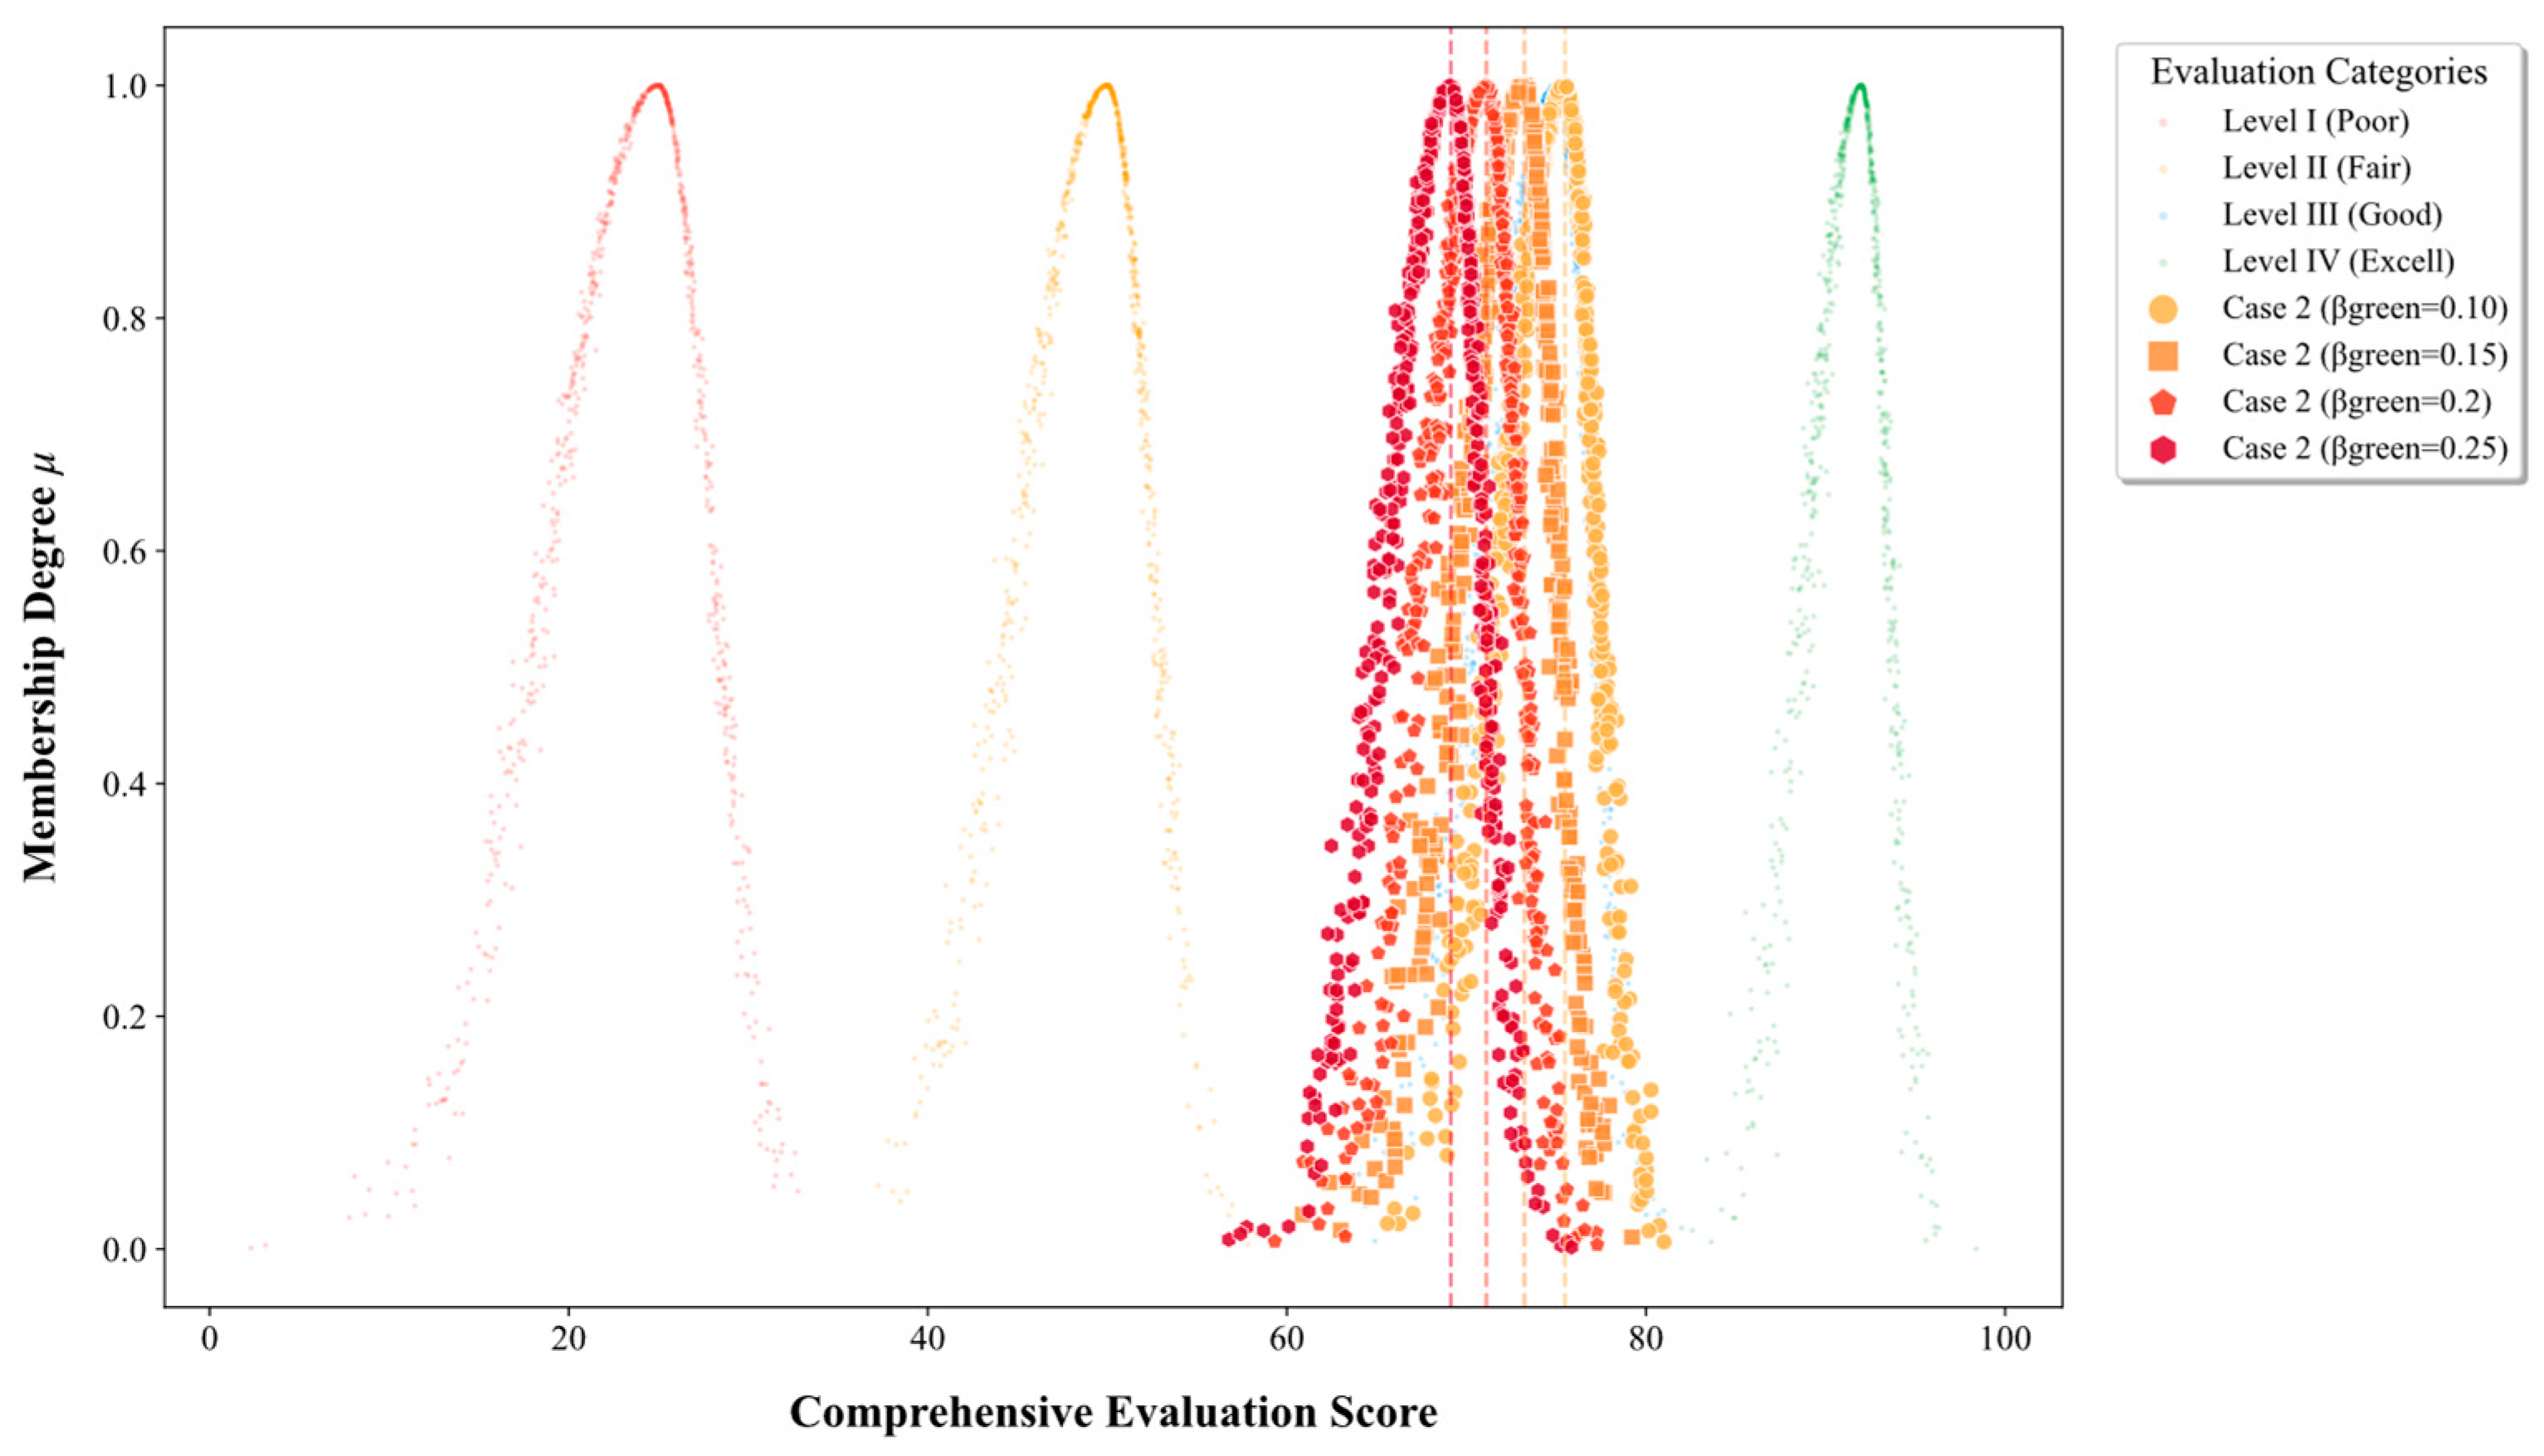
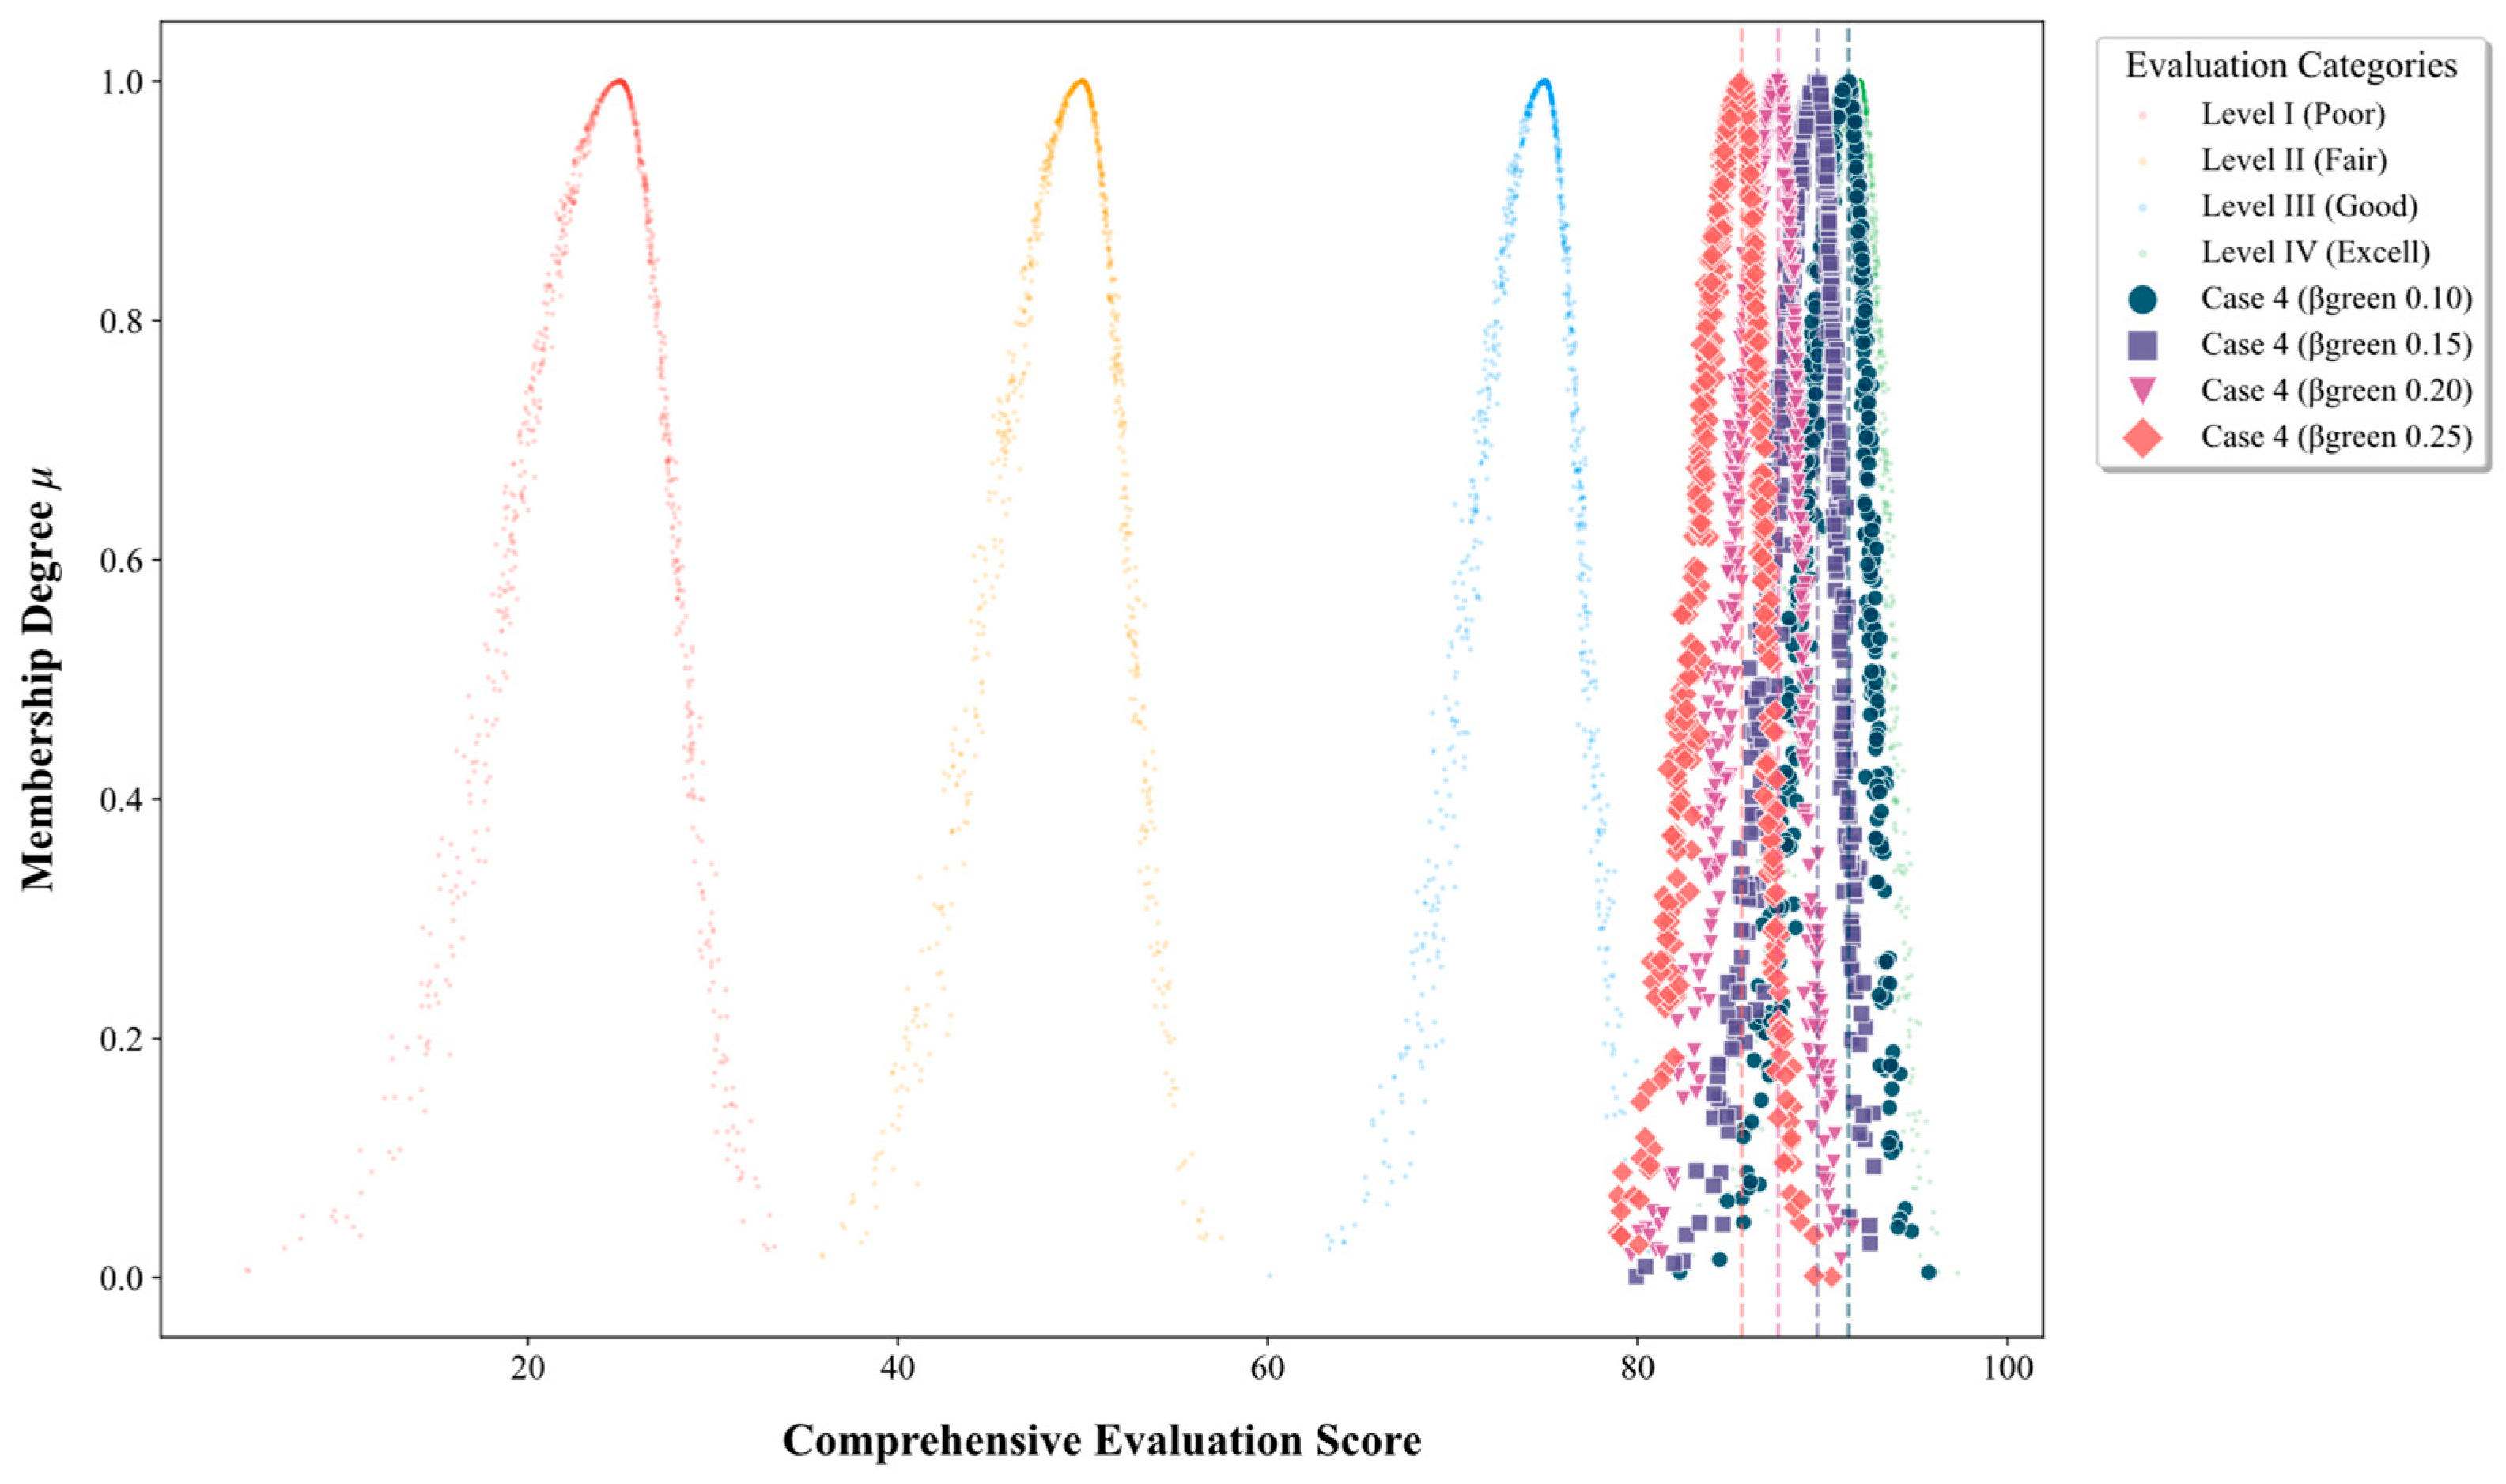
Figure 11 and Figure 12 illustrate the evolutionary trends of the comprehensive evaluation indices for Case 2 and Case 4 under a progressively increasing green certificate quota coefficient. A comparative analysis of these scenarios reveals that the cloud droplets for Case 2 are primarily concentrated around the 70-point mark, corresponding to Level III (Good). In contrast, Case 4 exhibits a robust distribution within the 85–92 range, signifying a consistent performance at Level IV (Excellent).
This disparity underscores that the integration of the “Green Hydrogen Certificate” mechanism facilitates a synergistic “electricity–hydrogen” energy flow. The resulting dual enhancement of economic and environmental dividends significantly bolsters the system’s renewable energy accommodation and decarbonization capabilities, effectively propelling the system performance from the “Good” category into the “Excellent” domain.
Across both scenarios, as the mandatory green certificate quota coefficient escalates from 0.10 to 0.25, the cloud maps exhibit a discernible leftward shift, indicating a downward trend in the evaluation scores. This phenomenon suggests that as regulatory authorities increase the stringency of mandatory quotas, the system may incur higher energy procurement costs or sacrifice direct economic yields to ensure compliance, thereby impacting overall economicity. Specifically, in Case 2, the score recedes from approximately 75 to 68. Although Case 4 follows a similar declining trajectory, it maintains a substantially higher baseline. This resilience demonstrates that the proposed joint mechanism not only elevates the ceiling of systemic benefits but also enhances the system’s robustness against policy-driven pressures.
Furthermore, the cloud distribution characteristics indicate that at a quota coefficient of 0.10, Case 4 achieves its highest expected score and maximum distributional convergence. This identifies 0.10 as the optimal equilibrium point, where the system successfully balances economic operational efficiency with peak low-carbon benefits.

5.2.4. Evaluation Results Under Different Green Hydrogen Certificate Quota Coefficients

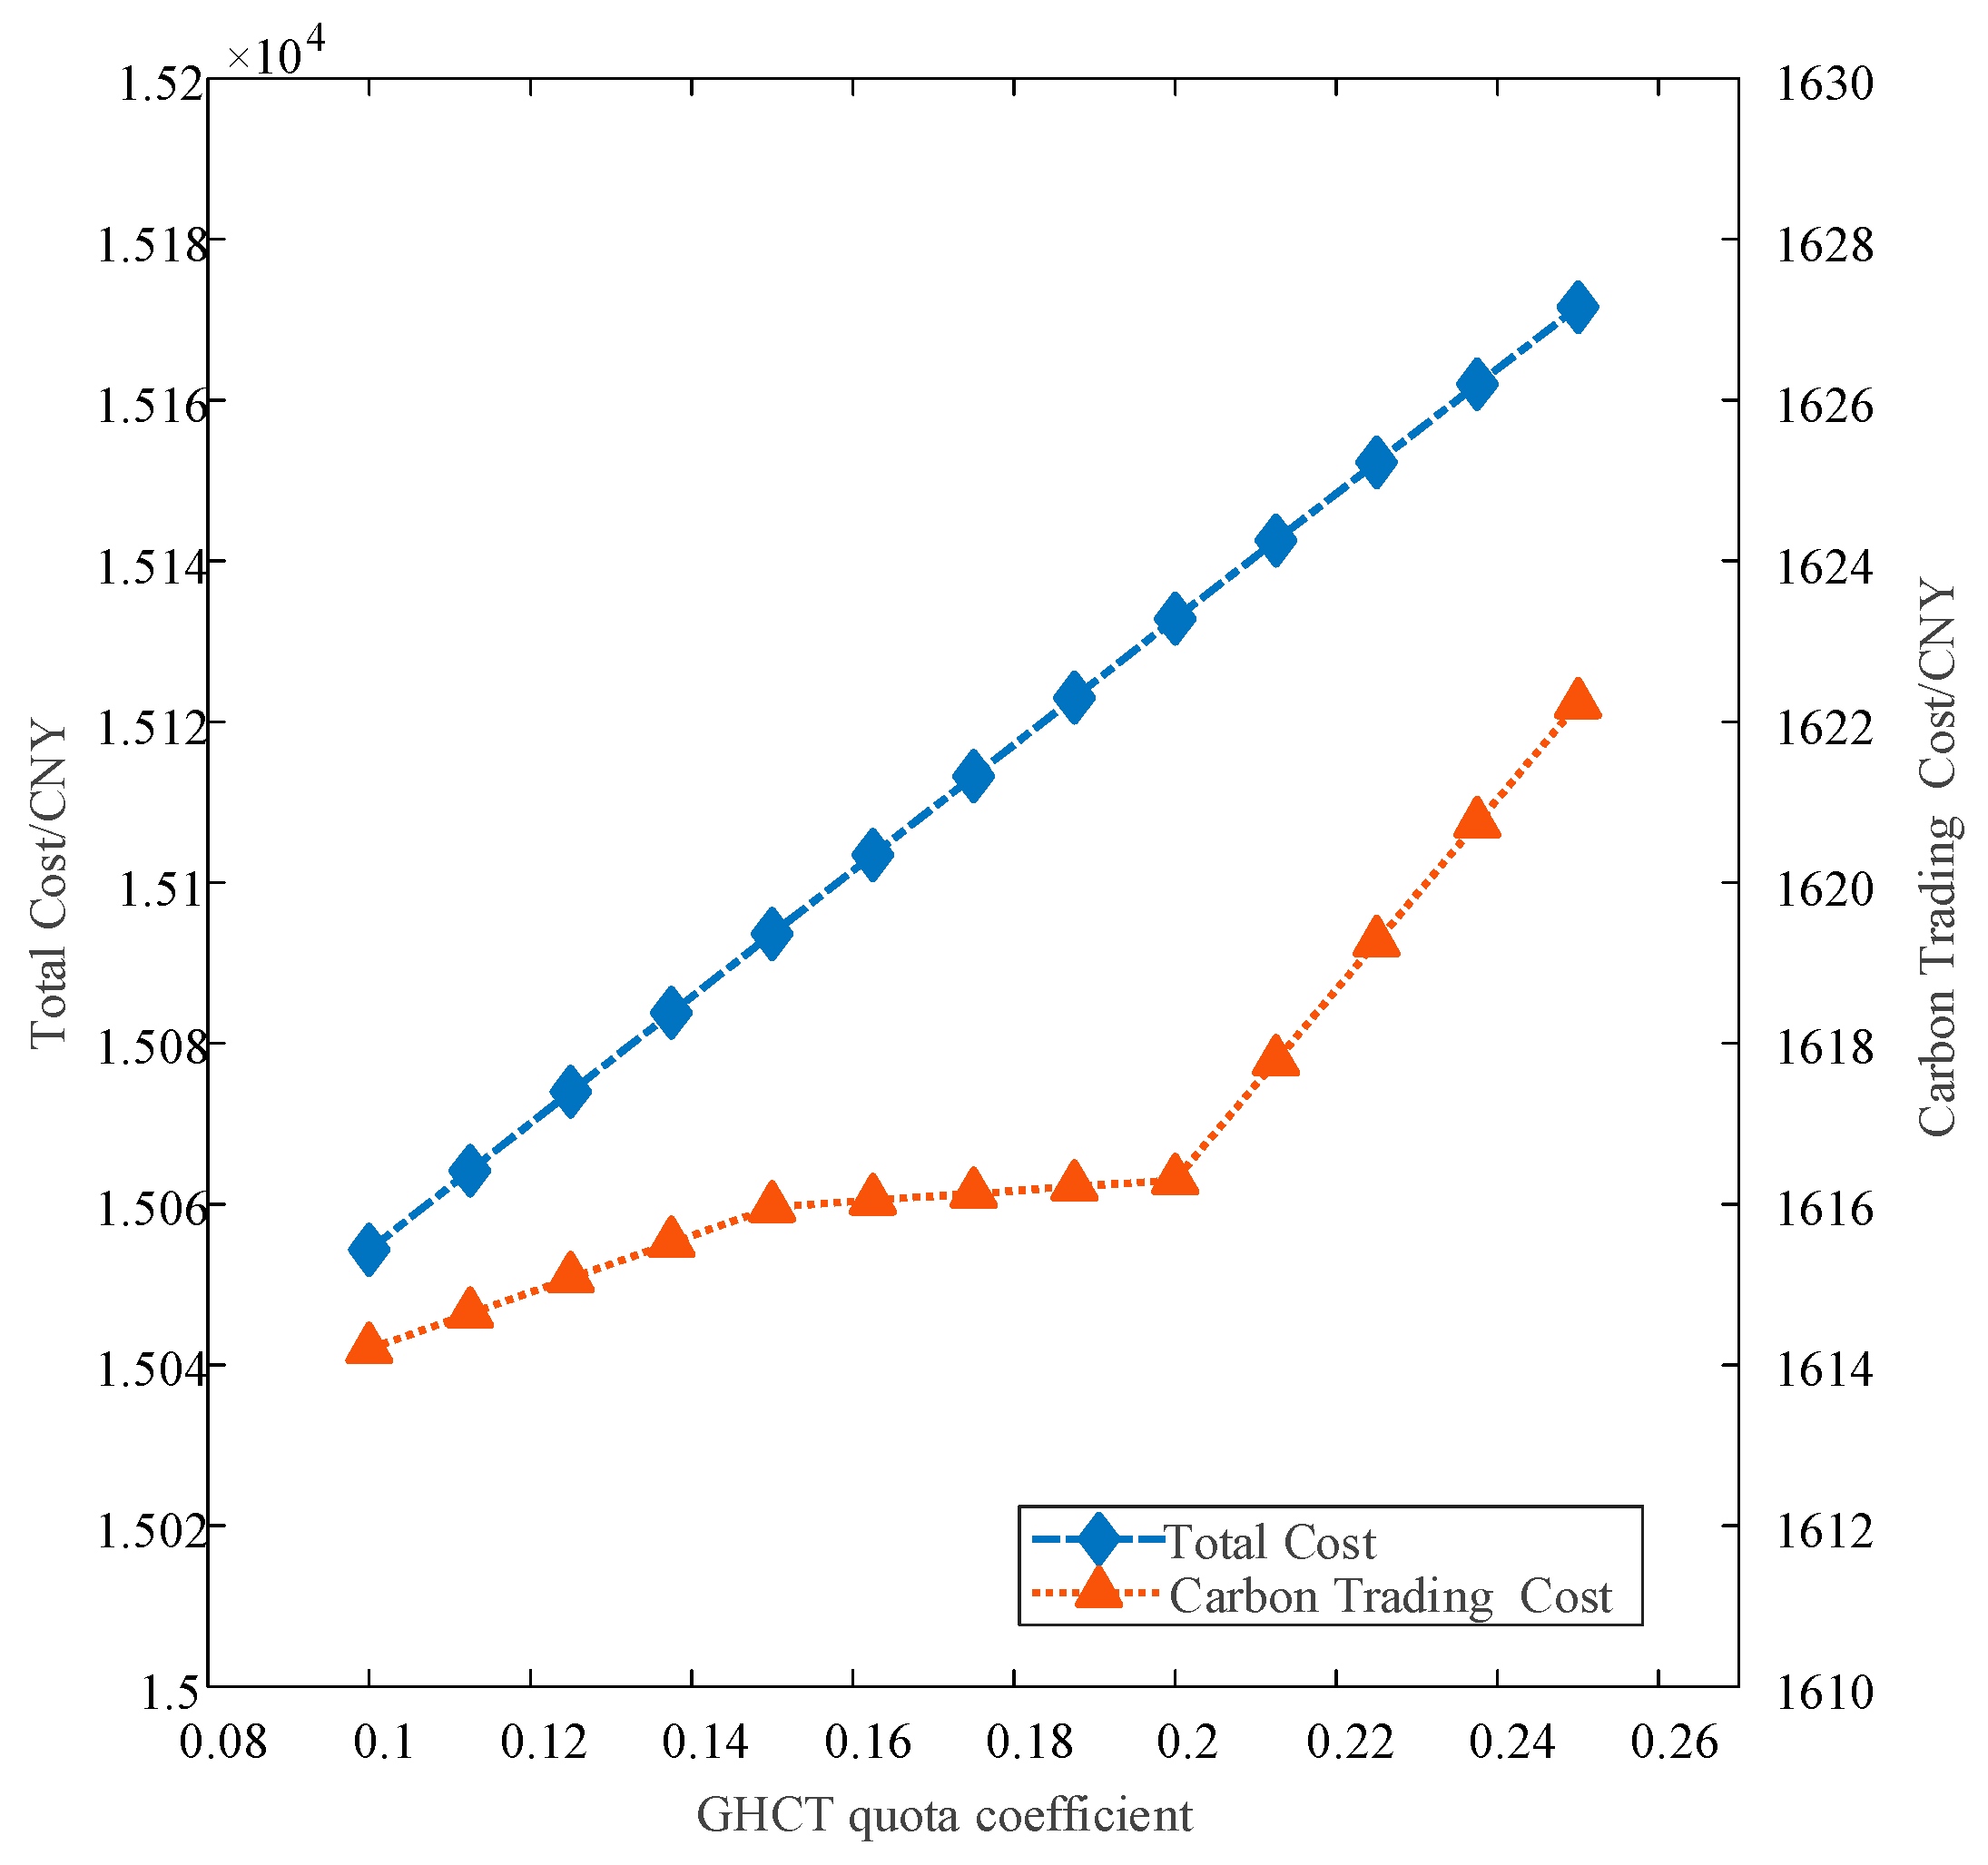
As illustrated in Figure 13, both the system operating cost and carbon trading cost exhibit a significant linear upward trend as the GHCT quota coefficient increases. At the threshold of 0.10, the system’s wind power accommodation capacity reaches its physical saturation point while satisfying all technical constraints. At this juncture, the marginal environmental benefit of further increasing the coefficient diminishes to zero. Since any increment beyond this critical point only serves to increase the marginal economic cost unilaterally, 0.10 is identified as the global optimal solution that balances the minimization of economic losses with the maximization of environmental benefits.
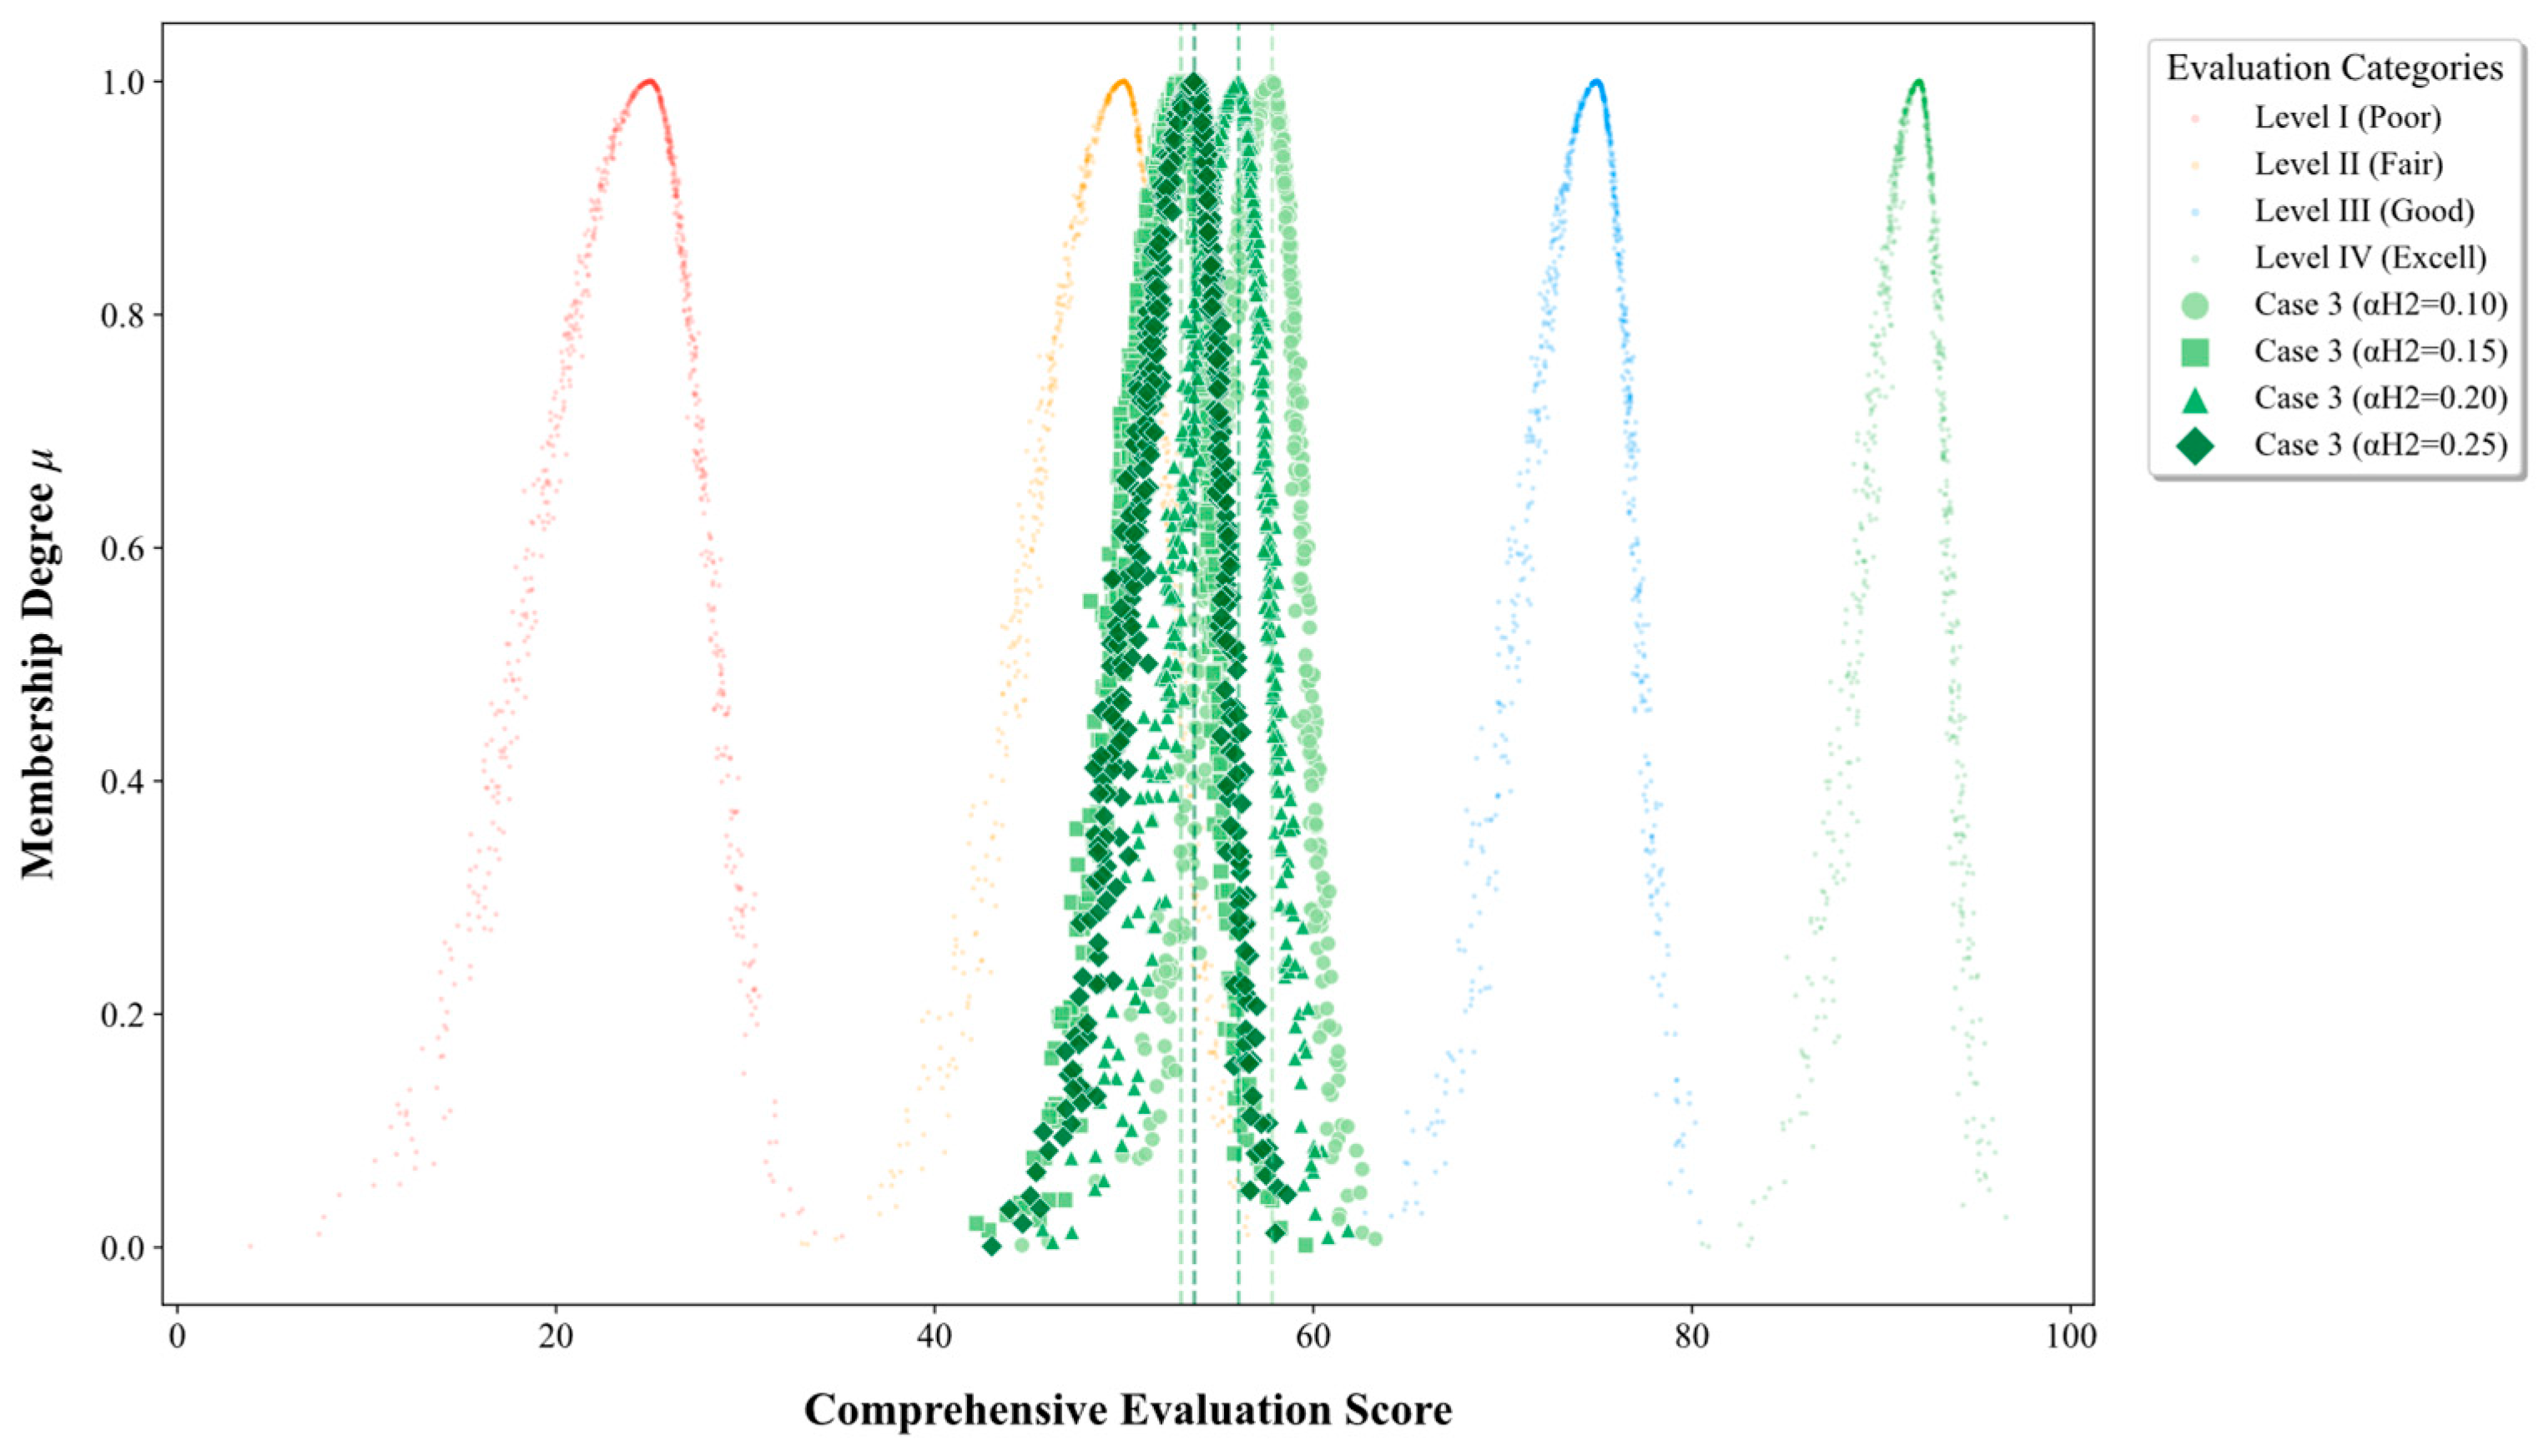
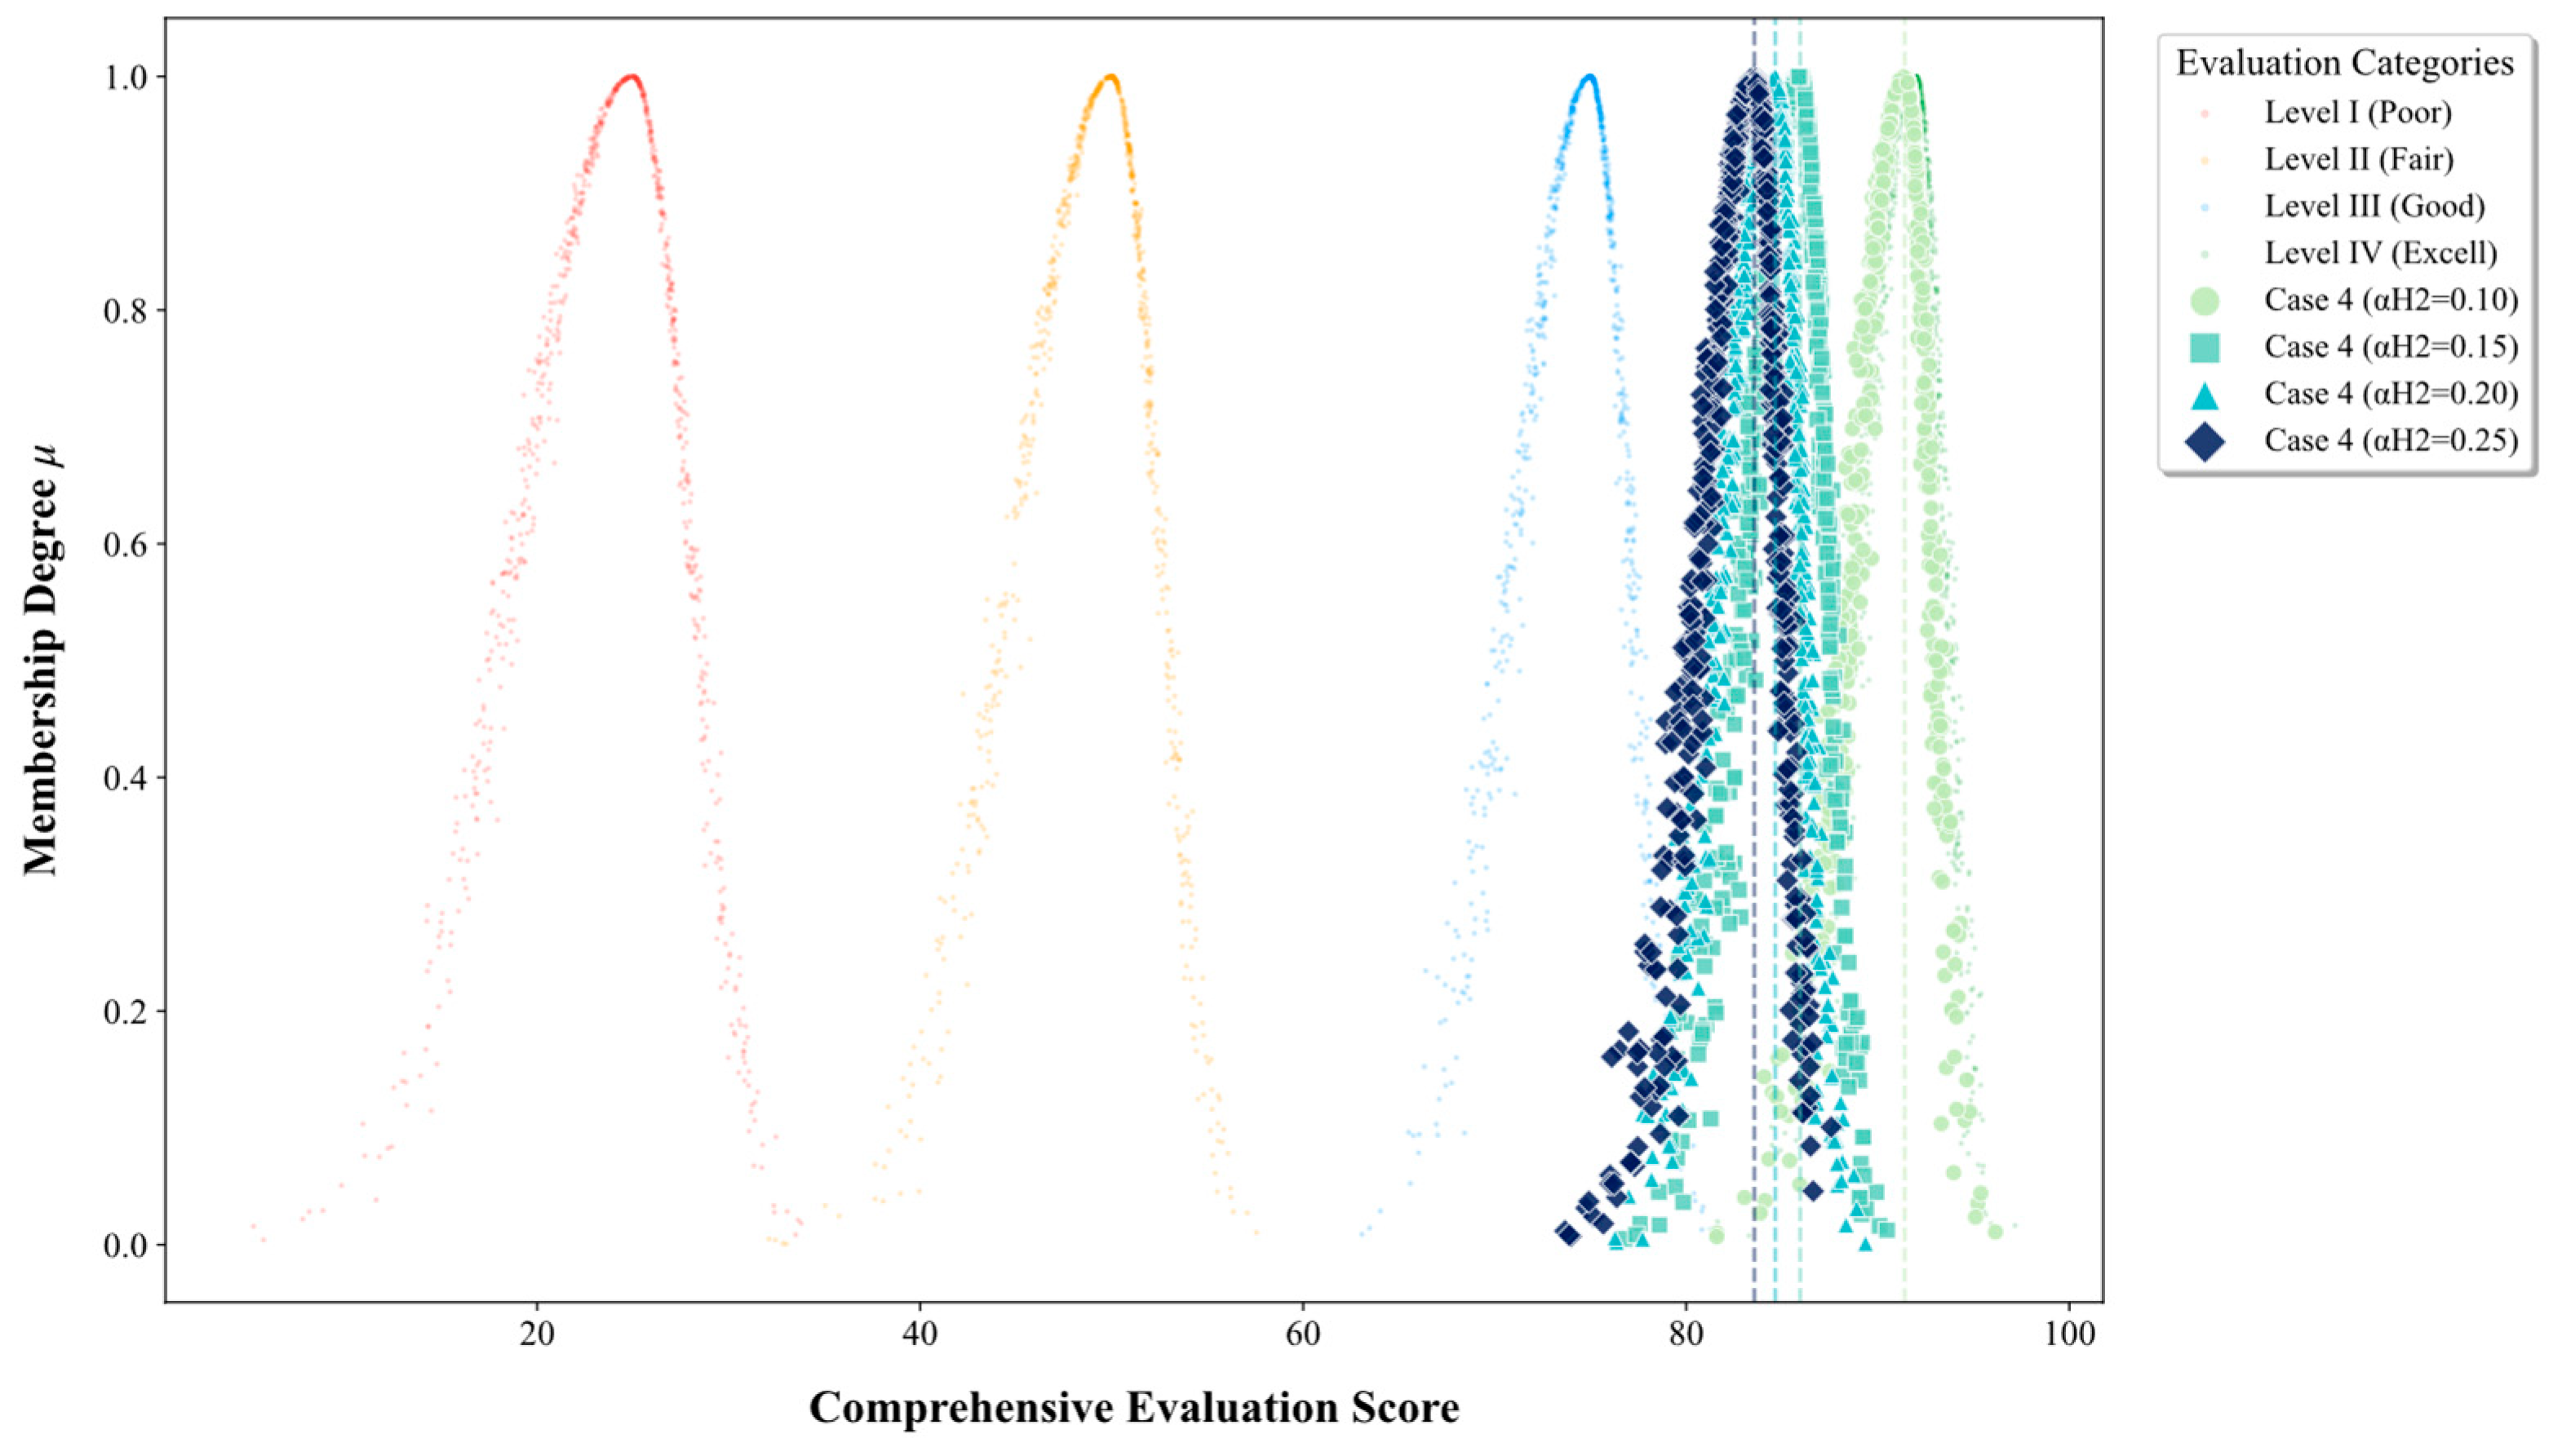
Figure 14 and Figure 15 illustrate the evolutionary trajectory of the comprehensive evaluation indices for Case 3 and Case 4 as the green hydrogen certificate quota coefficient progressively increases. A comparative analysis reveals that the cloud clusters for Case 4 are robustly distributed within the 82–92 point range, consistently aligning with Level IV. This performance underscores that the synergy between dynamic green electricity and green hydrogen certificates effectively maximizes the green premium, thereby achieving superior integrated operational efficiency. In contrast, the cloud clusters for Case 3 are concentrated within the 50–60 point interval, straddling the transition between Level II and Level III. This disparity indicates that, in the absence of green electricity certificate compensation, the value recovery from the hydrogen sector alone is insufficient to offset the high systemic operational costs, which significantly constrains the system’s overall competitiveness.
As the green hydrogen quota coefficient escalates from 0.10 to 0.25, both cloud maps exhibit a discernible leftward shift, indicating a decline in evaluation scores. Specifically, the score for Case 4 recedes from nearly 92 to approximately 83. While an increased quota may theoretically enhance decarbonization, the resultant pressure from energy procurement costs penalizes economic performance, leading to a reduction in the comprehensive index. For Case 3, the score declines from approximately 58 to 52. Without the buffer of electricity certificate subsidies, the constraints imposed by high hydrogen quotas become more severe, rendering the system susceptible to drifting into the “Fair” (Level II) evaluation zone.
Notably, Case 4 maintains its distribution above Level III even as the quota increases, demonstrating a significantly higher policy tolerance. This suggests that under the proposed joint mechanism, the system can sustain high comprehensive benefits even when regulatory bodies mandate ambitious quota targets. Conversely, the Case 3 distribution shifts closer to Level II with higher quotas, implying that under a singular mechanism, excessive targets rapidly degrade operational status, triggering a critical imbalance between the low-carbon transition and economic viability.
Consequently, based on the cloud distribution characteristics, a green hydrogen certificate quota coefficient of approximately 0.10 is recommended. At this threshold, Case 4 achieves its peak evaluation point, ensuring that wind power accommodation (B1) and carbon emission (C1) targets are met while maximizing environmental-economic incentives through “electricity–hydrogen” coordination.

5.2.5. Sensitivity Analysis of the ACME in Capturing System Cost Overruns

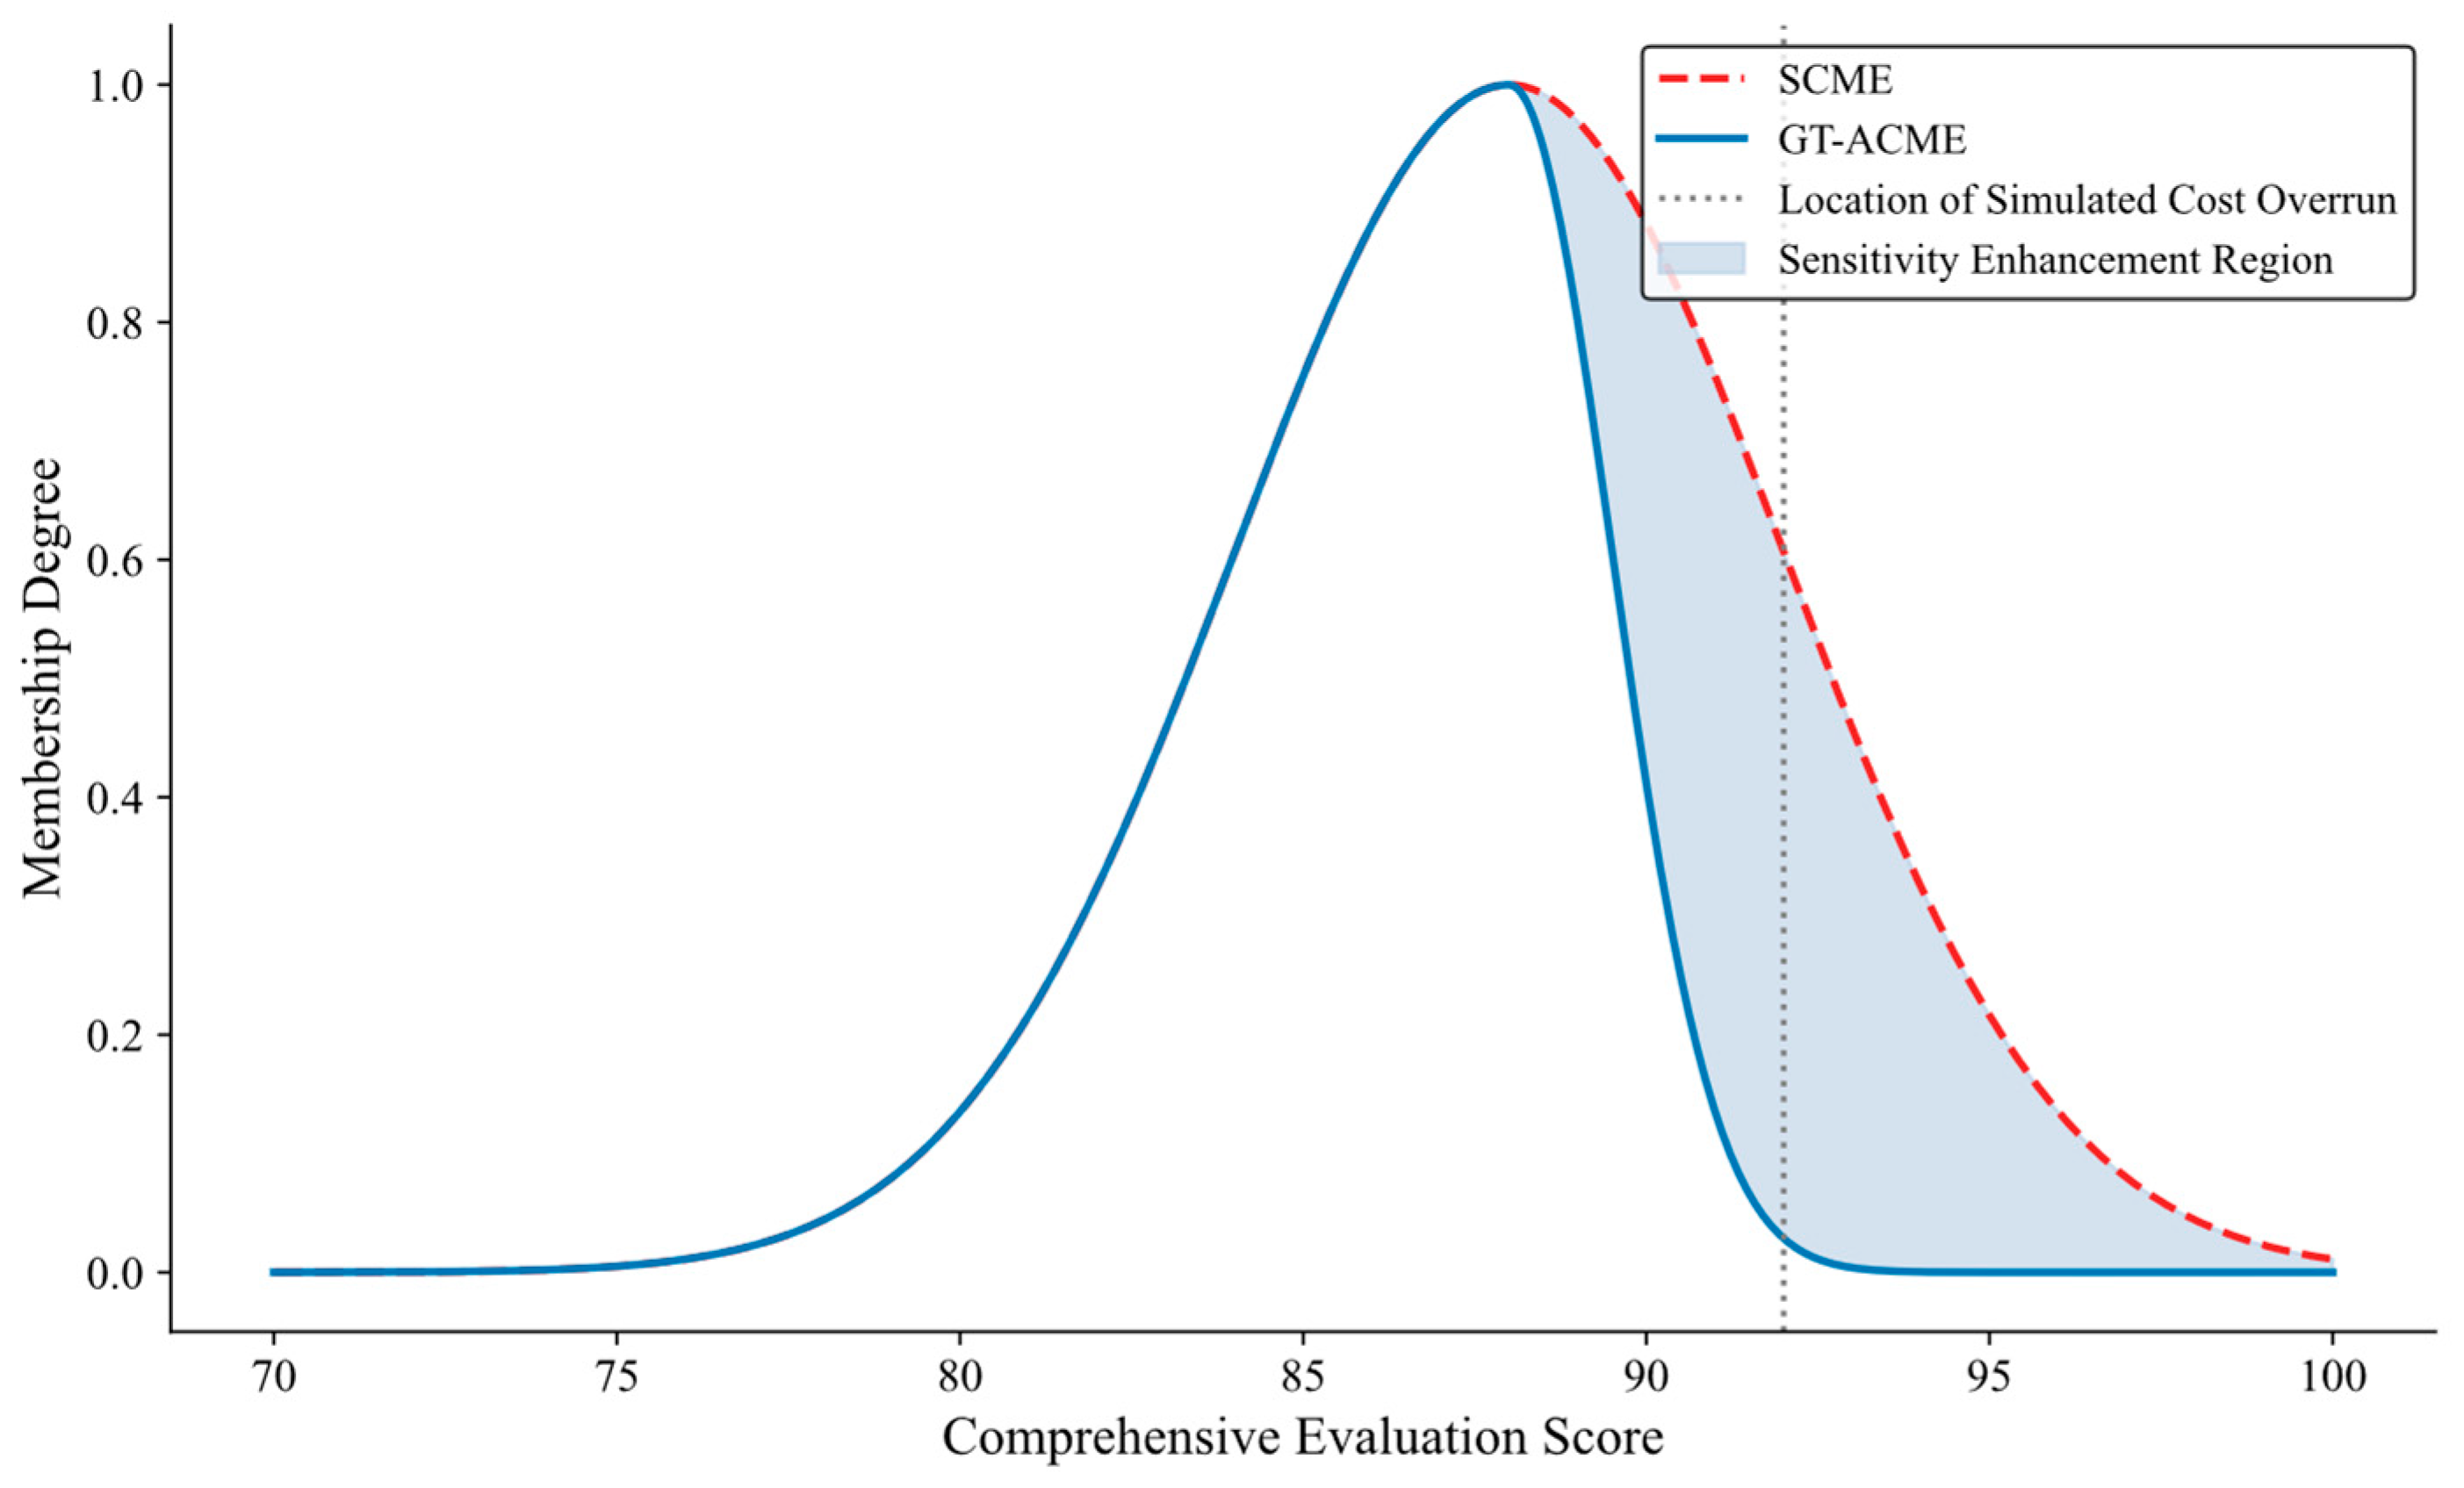
As illustrated in Figure 16 of the Symmetric Cloud Matter-Element (SCME) model, when a cost overrun of 4 points occurs, the membership degree remains at approximately 0.606. This implies that the system is still classified as “Good,” failing to trigger a timely warning. Conversely, in the GT-ACME model, due to Enr being merely 1.5, the membership degree plummets sharply to roughly 0.028. This signals that the system instantly exits the “Excellent/Good” interval and enters the “Poor” state. The comparative analysis indicates that under the identical magnitude of system cost overrun, the improved ACME exhibits a significantly faster membership response speed in the penalty zone than the traditional symmetric model. This effectively enables precise capture and rapid early warning of “system cost overrun” risks.

5.2.6. Monte Carlo Sensitivity Analysis Under Uncertainty

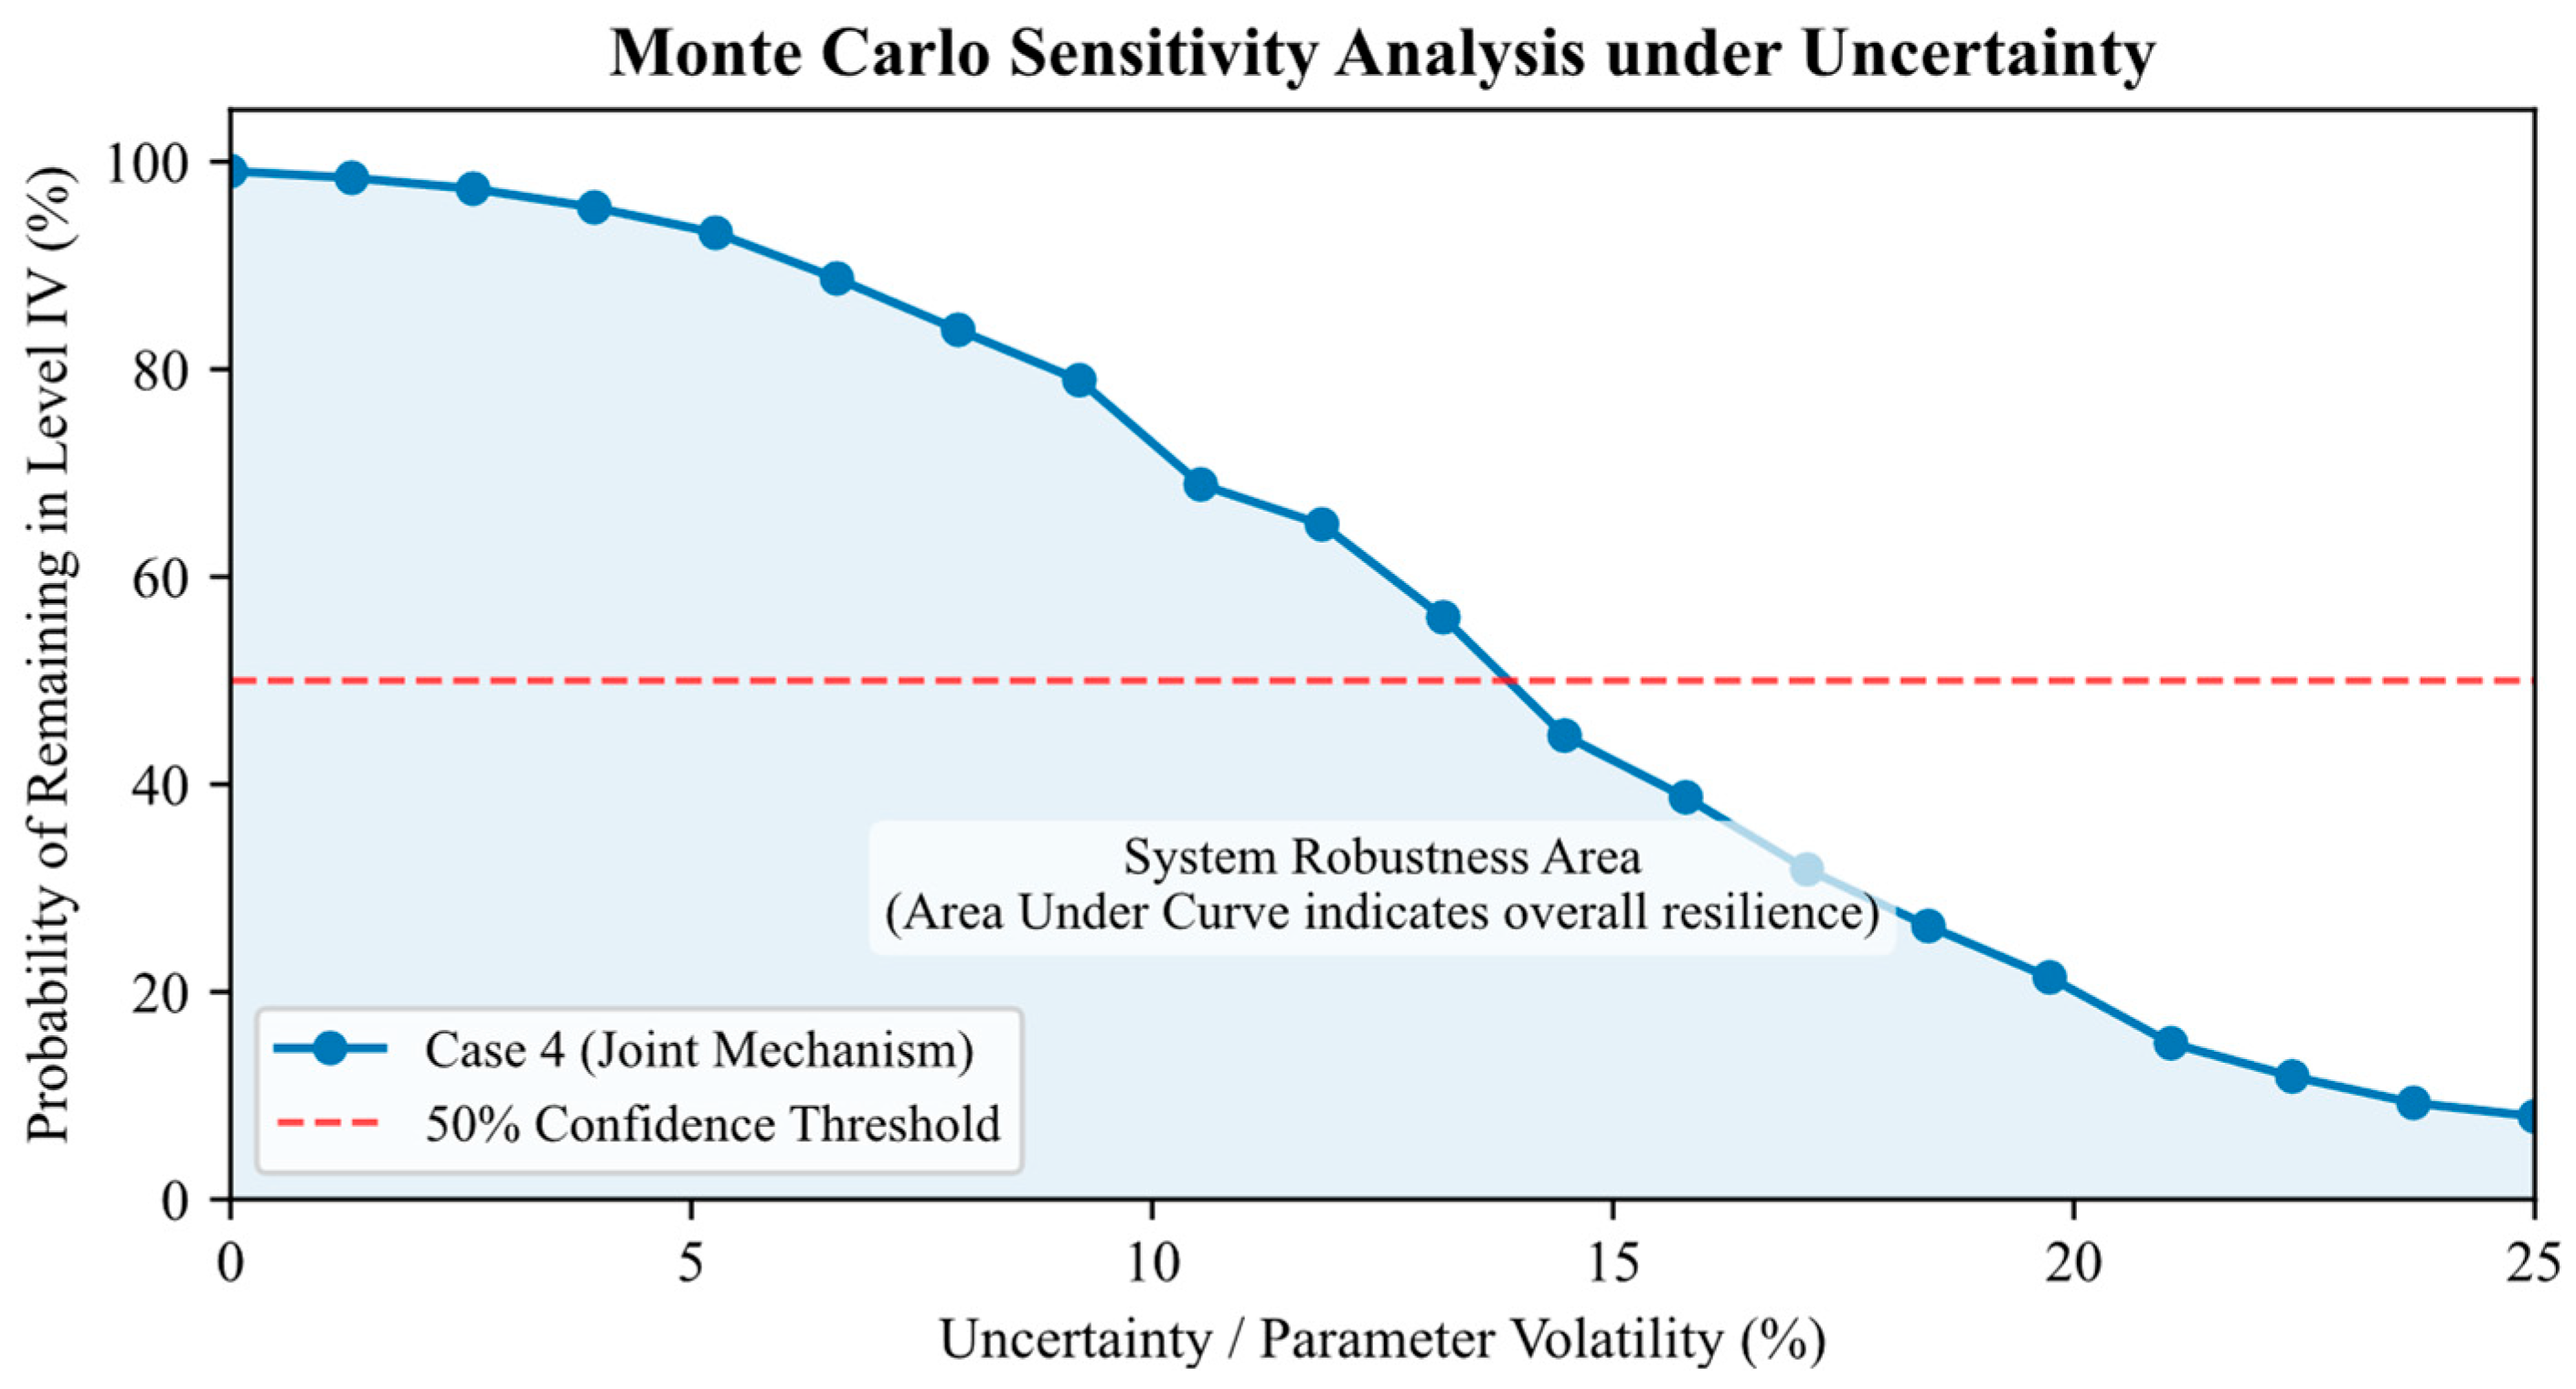
As illustrated in Figure 17 of the Monte Carlo sensitivity analysis, the proposed dynamic joint mechanism exhibits remarkable nonlinear robustness to wind power. Within the low-to-moderate perturbation range (volatility ≤ 10%), the probability that the system maintains the highest comprehensive evaluation tier (Level IV) remains consistently above 70%, indicating a strong capacity to absorb and buffer routine forecast errors and market fluctuations. However, as volatility exceeds a critical inflection point of approximately 13.5%, the system’s operational confidence rapidly breaches the 50% safety threshold, exhibiting an accelerated trajectory of performance degradation under extreme uncertainty (≥15%). This analysis not only statistically validates the joint mechanism’s superior stability under normal conditions but also provides precise, quantitative guidelines for establishing risk-warning boundaries in practical integrated energy system operations.

6. Conclusions

This study develops a mathematical model for the optimal low-carbon operation of IES under a joint dynamic GCT and GHCT mechanism, along with a tailored evaluation index system and assessment methodology. Case studies were conducted to evaluate the overall benefits conferred on the IES by this joint mechanism. The primary conclusions are summarized as follows:
  • The proposed dynamic GCT-GHCT joint mechanism establishes an effective coordination pathway between the green electricity and green hydrogen markets. By combining the revenues from both certificates, the mechanism facilitates renewable energy integration, mitigates wind power curtailment, and significantly reduces both carbon emissions and total operating costs of the IES. Results demonstrate that the joint mechanism outperforms isolated, single-certificate mechanisms in overall system performance, highlighting its superiority in simultaneously elevating economic and environmental outcomes.
  • To enhance the reliability of the evaluation process, a combinatorial weighting method grounded in game theory was introduced, seamlessly integrating the subjective weights derived from the AHP with the objective weights obtained via RFR. This approach effectively balances subjectivity and objectivity, yielding more rational and robust indicator weights. Furthermore, the proposed dynamic reward–penalty asymmetric cloud matter-element model strengthens the evaluation framework by capturing the system’s asymmetric sensitivity across reward and penalty zones. Compared to traditional symmetric evaluation models, the improved model exhibits heightened responsiveness in the penalty region, enabling the precise capture of risk states such as system cost overruns. Consequently, it offers a more pragmatic and sensitive diagnostic tool for assessing comprehensive benefits under dynamic market mechanisms.
This study validates that a dynamic joint mechanism significantly enhances the eco-nomic and environmental performance of IES. Future research will focus on:
  • Incorporating multi-party game theory to model interactions between different IES operators within a microgrid cluster.
  • Accounting for the long-term degradation of hydrogen storage and fuel cell components in the dynamic evaluation model.
  • The integration of stochastic optimization and robust optimization methodologies to address the potential impacts of renewable energy volatility and market price uncertainties on system decision-making.

Author Contributions

Literature search, data collection, data analysis, figures, and writing original draft preparation, H.L.; Resources and data interpretation, J.W.; Study design, supervision, and writing—review and editing, W.W. All authors have read and agreed to the published version of the manuscript.

Funding

Project supported by the Open project of Key Laboratory in Xinjiang Uygur Autonomous Region of China (2023D04071).

Data Availability Statement

The original contributions presented in this study are included in the article. Further inquiries can be directed to the corresponding author.

Conflicts of Interest

The authors declare no conflicts of interest.

References

  1. Pan, K.; Sun, T.; Pang, X.; Zheng, Z.; Li, H. Optimal scheduling of integrated energy systems with power-to-hydrogen for flexible supply-demand balance via Q-learning-enhanced grey wolf optimizer. Appl. Soft Comput. 2026, 192, 114795. [Google Scholar] [CrossRef]
  2. Dong, J.; Xu, C.; Zhu, M.; Zhang, Y.; Zhao, Z.; Hao, Z.; Han, S. Optimal capacity planning for grid-connected power-to-hydrogen integrated energy system considering dynamic hydrogen production efficiency. Sustain. Energy Grids Netw. 2026, 45, 102120. [Google Scholar] [CrossRef]
  3. Su, H.; Zhang, W. Low-carbon scheduling for electricity-hydrogen integrated energy systems with nearly zero-energy buildings based on Stackelberg game. Int. J. Hydrogen Energy 2026, 203, 153244. [Google Scholar] [CrossRef]
  4. Mullanu, S.; Chua, C.; Molnar, A.; Yavari, A. Artificial intelligence for hydrogen-enabled integrated energy systems: A systematic review. Int. J. Hydrogen Energy 2025, 141, 283–303. [Google Scholar] [CrossRef]
  5. Pu, Y.; Li, Q.; Zou, X.; Li, R.; Li, L.; Chen, W.; Liu, H. Optimal sizing for an integrated energy system considering degradation and seasonal hydrogen storage. Appl. Energy 2021, 302, 117542. [Google Scholar] [CrossRef]
  6. Sundararaman, M.; Sambasivam, B. The road to net zero in a renewable energy-dominated electricity system: Impact of EV charging and social cost of emission on the optimal economic dispatch. Green Energy Intell. Transp. 2025, 4, 100280. [Google Scholar] [CrossRef]
  7. Michaelides, E.E.; Nguyen, V.N.D.; Michaelides, D.N. The effect of electric vehicle energy storage on the transition to renewable energy. Green Energy Intell. Transp. 2023, 2, 100042. [Google Scholar] [CrossRef]
  8. Liu, Y.; Wang, Y.; Yang, Y.; Zhang, K.; Sun, Y.; Hou, C.; Dongye, Z.; Chen, J. GCT–CET Integrated Flexible Load Control Method for IES. Energies 2025, 18, 3667. [Google Scholar] [CrossRef]
  9. Hu, H.; Zhao, X.; Shang, G.; Zhao, P.; Dong, W.; Liu, Z.; Song, Y. Low-Carbon Optimization Scheduling of Hybrid Energy Storage in Integrated Energy System Considering Bidirectional Interaction Between Green Certificate and Carbon Trading. Energies 2026, 19, 70. [Google Scholar] [CrossRef]
  10. Xiong, X.; Tang, J. Low-carbon economic scheduling of rural virtual power plants considering carbon-green hydrogen certificates coupling mechanisms and farmers’ cognitive preferences. Energy 2026, 342, 139622. [Google Scholar] [CrossRef]
  11. Jia, D.Q.; Li, X.M.; Tan, Q.L.; Li, B.K.; Lv, X.Y. Expanding the economic benefits of waste gasification through carbon and green certificate markets: Optimal bidding strategies in multiple markets. Energy 2025, 319, 134918. [Google Scholar] [CrossRef]
  12. Chen, H.P.; Ding, Y.; Li, Z.W.; Shui, S.Y. An innovative dispatching method of integrated energy system coupling with HCNG under green certificate-carbon trading interaction mechanism. Int. J. Hydrogen Energy 2025, 149, 150119. [Google Scholar] [CrossRef]
  13. Zhang, B.; Xu, L.; Shu, H.; Gao, S.; Li, M.; Ma, Z.; Liang, J.; Xu, K. A Cloud Model-Based Optimal Combined Weighting Framework for the Comprehensive Reliability Evaluation of Power Systems with High Penetration of Renewable Energies. Sustainability 2025, 17, 2273. [Google Scholar] [CrossRef]
  14. Tang, M.; Li, R.; Dai, X.; Yu, X.; Cheng, X.; Yang, S. New Electric Power System Stability Evaluation Based on Game Theory Combination Weighting and Improved Cloud Model. Sustainability 2024, 16, 6189. [Google Scholar] [CrossRef]
  15. Wang, H.; Liu, Z.; Zhou, X.Y.; Li, L.; Fei, S.; Wang, X. Multi-ship collision risk situation assessment based on finite interval cloud model. Reliab. Eng. Syst. Saf. 2026, 271, 112290. [Google Scholar] [CrossRef]
  16. Chen, L.D.; Liu, K.Z.; Zhao, K.; Hu, L.; Liu, Z.J. Optimal scheduling of electricity-hydrogen-thermal integrated energy system with P2G for source-load coordination under carbon market environment. Energy Rep. 2025, 13, 2269–2276. [Google Scholar]
  17. Wang, Z.R.; Li, W.; Zhang, Y.Y. Two-tier optimal scheduling of integrated energy systems in parks considering P2G-CCS-CHP coupling and electricity-gas-heat-cooling price-demand response. Energy 2025, 338, 138803. [Google Scholar] [CrossRef]
  18. Yang, C.; Dong, X.F.; Wang, G.; Lv, D.R.; Gu, R.; Lei, Y.Q. Low-carbon economic dispatch of integrated energy system with CCS-P2G-CHP. Energy Rep. 2024, 12, 42–51. [Google Scholar] [CrossRef]
  19. Falcao, D.S.; Pinto, A. A review on PEM electrolyzer modelling: Guidelines for beginners. J. Clean. Prod. 2020, 261, 121184. [Google Scholar] [CrossRef]
  20. Wang, Z.; Qi, Y.; Wang, R.; Ren, S.Y.; Wu, J. Optimization of Low-Carbon Integrated Energy Systems with Efficient Hydrogen Use and Flexible CCPP-MR-HCHP Operations. Int. Trans. Electr. Energy Syst. 2025, 2025, 1924852. [Google Scholar] [CrossRef]
  21. He, K.J.; Zeng, L.J.; Yang, J.; Gong, Y.G.; Zhang, Z.H.; Chen, K. Optimization Strategy for Low-Carbon Economy of Integrated Energy System Considering Carbon Capture-Two Stage Power-to-Gas Hydrogen Coupling. Energies 2024, 17, 3205. [Google Scholar] [CrossRef]
  22. Chaofan, J.; Xin, A. Integrated energy system operation optimization model considering uncertainty of multi-energy coupling units. Power Syst. Technol. 2019, 43, 2843–2854. [Google Scholar] [CrossRef]
  23. Wu, J.Q.; Zheng, X.L.; Yu, S.M.; Yu, L.A. Modeling multi-market coupling effects considering the consumption above quota trading market in renewable portfolio standards: An agent-based perspective. Energy Econ. 2024, 138, 107826. [Google Scholar] [CrossRef]
  24. Vaidya, O.S.; Kumar, S. Analytic hierarchy process: An overview of applications. Eur. J. Oper. Res. 2006, 169, 1–29. [Google Scholar] [CrossRef]
  25. Breiman, L. Random forests. Mach. Learn. 2001, 45, 5–32. [Google Scholar] [CrossRef]
  26. Li, D.Y.; Liu, C.Y.; Gan, W.Y. A New Cognitive Model: Cloud Model. Int. J. Intell. Syst. 2009, 24, 357–375. [Google Scholar] [CrossRef]
  27. Ma, S.Q.; Xie, Y.L.; Qiu, J.L.; Lai, J.X.; Sun, H. An Improved Optimal Cloud Entropy Extension Cloud Model for the Risk Assessment of Soft Rock Tunnels in Fault Fracture Zones. Buildings 2025, 15, 2700. [Google Scholar] [CrossRef]
  28. Wang, Y.L.; Wang, Y.D.; Huang, Y.J.; Yang, J.L.; Ma, Y.Z.; Yu, H.Y.; Zeng, M.; Zhang, F.W.; Zhang, Y.F. Operation optimization of regional integrated energy system based on the modeling of electricity-thermal-natural gas network. Appl. Energy 2019, 251, 113410. [Google Scholar] [CrossRef]
Figure 1. Operation diagram of IES. (Note: The colored arrows indicate different energy and material flows within the system, where green represents hydrogen flow, blue represents gas flow, orange represents electric flow, red represents heat flow, and grey represents CO2 flow).
Electronics 15 02171 g001
Figure 2. Dynamic green certificate trading supply and demand curve considering reward and punishment characteristics.
Electronics 15 02171 g002
Figure 3. Flowchart of the IES dynamic reward-punishment asymmetric cloud matter-element comprehensive evaluation based on game theory combined weighting.
Electronics 15 02171 g003
Figure 4. Forecasting curves of load output.
Electronics 15 02171 g004
Figure 5. Transaction prices and quantities of green power certificates across different time periods.
Electronics 15 02171 g005
Figure 6. Green hydrogen certificate trading volumes across different time periods.
Electronics 15 02171 g006
Figure 7. Wind power-based hydrogen production and hydrogen demand across different time periods.
Electronics 15 02171 g007
Figure 8. Comparison of results of different weight methods.
Electronics 15 02171 g008
Figure 9. Comprehensive evaluation of the dynamic coordination mechanism in integrated energy systems based on an asymmetric half-cloud model. (Note: The vertical dashed lines denote the expected score Ex.).
Electronics 15 02171 g009
Figure 10. Influence curve of different GCT quota coefficients on the cost of the system.
Electronics 15 02171 g010
Figure 11. Case2: Comprehensive evaluation values under varying GCT quota coefficients. (Note: The vertical dashed lines denote the expected score Ex.).
Electronics 15 02171 g011
Figure 12. Case4: Comprehensive evaluation values under varying GCT quota coefficients. (Note: The vertical dashed lines denote the expected score Ex.).
Electronics 15 02171 g012
Figure 13. Influence curve of different GHCT quota coefficients on the cost of the system.
Electronics 15 02171 g013
Figure 14. Case3: Comprehensive evaluation values under varying GHCT quota coefficients. (Note: The vertical dashed lines denote the expected score Ex.).
Electronics 15 02171 g014
Figure 15. Case4: Comprehensive evaluation values under varying GHCT quota coefficients. (Note: The vertical dashed lines denote the expected score Ex.).
Electronics 15 02171 g015
Figure 16. Sensitivity analysis of the GT-ACME model in detecting system cost overruns. (Note: The vertical dashed lines denote the expected score Ex.).
Electronics 15 02171 g016
Figure 17. Monte Carlo sensitivity analysis of the proposed dynamic joint mechanism under wind power uncertainty.
Electronics 15 02171 g017
Table 1. Integrated energy system evaluation index system.
BenefitMetricSign
A Economic benefitsA1 Total operating cost
A2 Acquiring energy cost
A3 Green power certificate revenue+
A4 Green hydrogen certificate revenue+
B Technical benefitsB1 Wind power accommodation rate+
B2 Green hydrogen conversion efficiency+
C Environmental benefitsC1 Total system carbon emissions
C2 Renewable energy penetration rate+
Note: The plus sign (+) indicates a maximum-type indicator (the higher the indicator, the greater the benefit), and the minus sign (−) indicates a minimum-type indicator (the smaller the indicator, the greater the benefit).
Table 2. Electricity purchase prices.
PeriodSpecific TimeElectricity Price (CNY/kWh)
Valley01:00–07:00, 23:00–24:000.38
Flat08:00–11:00, 15:00–18:000.68
Peak12:00–14:00, 19:00–22:001.2
Table 3. Parameters of energy storage equipment.
EquipmentCapacity (kW)Capacity Upper/Lower Limit Constraints (%)Charging/Discharging Efficiency (%)Ramping Constraint (%)
Electrical Energy Storage45090, 109520
Thermal Energy Storage50090, 109520
Gas Energy Storage15090, 109520
Hydrogen Energy Storage20090, 109520
Table 4. Energy conversion equipment parameters.
EquipmentCapacity (kW)Energy Conversion Efficiency (%)Ramping Constraint (%)
EL5008720
MR2506020
HFC2509520
GB8009520
CHP6009220
Table 5. Scheduling results in 4 scenarios.
ParameterValues
Case 1Case 2Case 3Case 4
Carbon emissions (kg)4950.9657.24634.9417.6
Electricity purchase cost (CNY)572.5572.5610.7610.7
Gas purchase cost (CNY)7062.96729.36741.56741.5
Green certificate cost (CNY)0−1884.90−1884.9
Green hydrogen certificate cost (CNY)00−681.1−689.4
Wind power accommodation rate (%)87.996.297.497.5
Wind curtailment cost (CNY)209.665.244.943.1
Total cost (CNY)15,147.812,289.114,592.511,656.4
Table 6. Evaluation indicator data for the 4 scenarios under varying parameter settings.
Case β green α H 2 A1A2A3A4B1B2C1C2
1 15,147.87635.4001787.94950.974.7
20.1 12,289.17301.81884.9024.996.2657.281.2
0.15 12,485.37301.81688.7024.996.2657.281.2
0.2 12,669.67301.81504.3024.996.2657.281.2
0.25 12,842.17301.81331.8024.996.2657.281.2
3 0.114,592.57352.20681.129.397.44634.984.1
0.1514,631.07464.10642.629.397.44634.984.1
0.214,669.17335.00596.728.997.44648.583.9
0.2514,707.27335.00558.628.997.44648.583.9
40.10.111,656.47352.21884.9689.429.697.5417.684.4
0.150.111,852.67352.21688.7689.429.697.5417.684.4
0.20.112,036.97352.21504.3689.429.697.5417.684.4
0.250.112,209.47352.21331.8689.429.697.5417.684.4
0.10.1511,695.27349.21884.9646.729.597.5424.884.3
0.10.211,733.67337.31884.9599.829.197.5439.884.0
0.10.2511,771.77335.01884.9558.628.997.5446.283.9
Disclaimer/Publisher’s Note: The statements, opinions and data contained in all publications are solely those of the individual author(s) and contributor(s) and not of MDPI and/or the editor(s). MDPI and/or the editor(s) disclaim responsibility for any injury to people or property resulting from any ideas, methods, instructions or products referred to in the content.