Article

Radio Frequency Resonate and Fire (RF-RAF) Neurons Supporting Device Classification

by
David L. Weathers
,
Michael A. Temple
* and
Brett J. Borghetti
Department of Electrical and Computer Engineering, US Air Force Institute of Technology, Wright-Patterson AFB, Dayton, OH 45433, USA
*
Author to whom correspondence should be addressed.
Electronics 2026, 15(10), 2023; https://doi.org/10.3390/electronics15102023
Submission received: 7 April 2026 / Revised: 1 May 2026 / Accepted: 7 May 2026 / Published: 9 May 2026
(This article belongs to the Special Issue Advances in 5G and Beyond Mobile Communication)

Abstract

Radio Frequency Fingerprinting (RFF) enables passive physical-layer device authentication by exploiting unintentional hardware variations in wireless transmitters. Neuromorphic implementations are attractive, given their potential for low-latency, energy-efficient inference capability under Size, Weight, and Power (SWaP) constraints at the edge. A new RFF capability is demonstrated here using recently introduced Radio Frequency Resonate-and-Fire (RF-RAF) neurons and eight WirelessHART devices. Performance is evaluated for RF-RAF-generated fingerprints against the established Gabor Transform (GTX) baseline using three classifier architectures: Random Forest (RndF), Convolutional Neural Network (CNN), and a Time-Incremented Spiking Neural Network (TI-SNN). The results show that RF-RAF fingerprints achieve an average classification accuracy of 96.7% across all three classifier types and consistently outperform GTX fingerprints at all evaluated fingerprint sizes. This performance persists under time-span-matched conditions, and the RF-RAF versus GTX benefit is not solely attributable to input data utilization. The TI-SNN surpasses 94% classification accuracy using M = 4 time step RF-RAF fingerprints with approximately 100 spikes per inference—a 4× larger GTX fingerprint requires approximately 1000 spikes to achieve the same classification accuracy. RF-RAF fingerprints offer two additional benefits: they are natively non-negative, which supports efficient neuromorphic hardware implementation, and they provide greater flexibility in fingerprint size selection. It is concluded that RF-RAF neurons provide an efficient neuromorphic-native encoding pathway for device RFF discrimination and offer improved accuracy–efficiency tradeoffs in training and inference for various classifier architectures.

1. Introduction

Neuromorphic computing offers compelling advantages for Radio Frequency (RF) signal processing applications where power efficiency, low latency, and real-time operation are paramount. Drawing an analogy to event-based cameras [1], the concept of an “RF Event Radio” seeks to bring these same advantages to RF signal sensing and classification for physical-layer communication security [2]. The envisioned capability is a neuromorphic system providing localized inference at the edge where Size, Weight, and Power (SWaP) constraints dominate—such as monitoring Internet of Things (IoT) mesh networks for device authentication and intrusion detection.
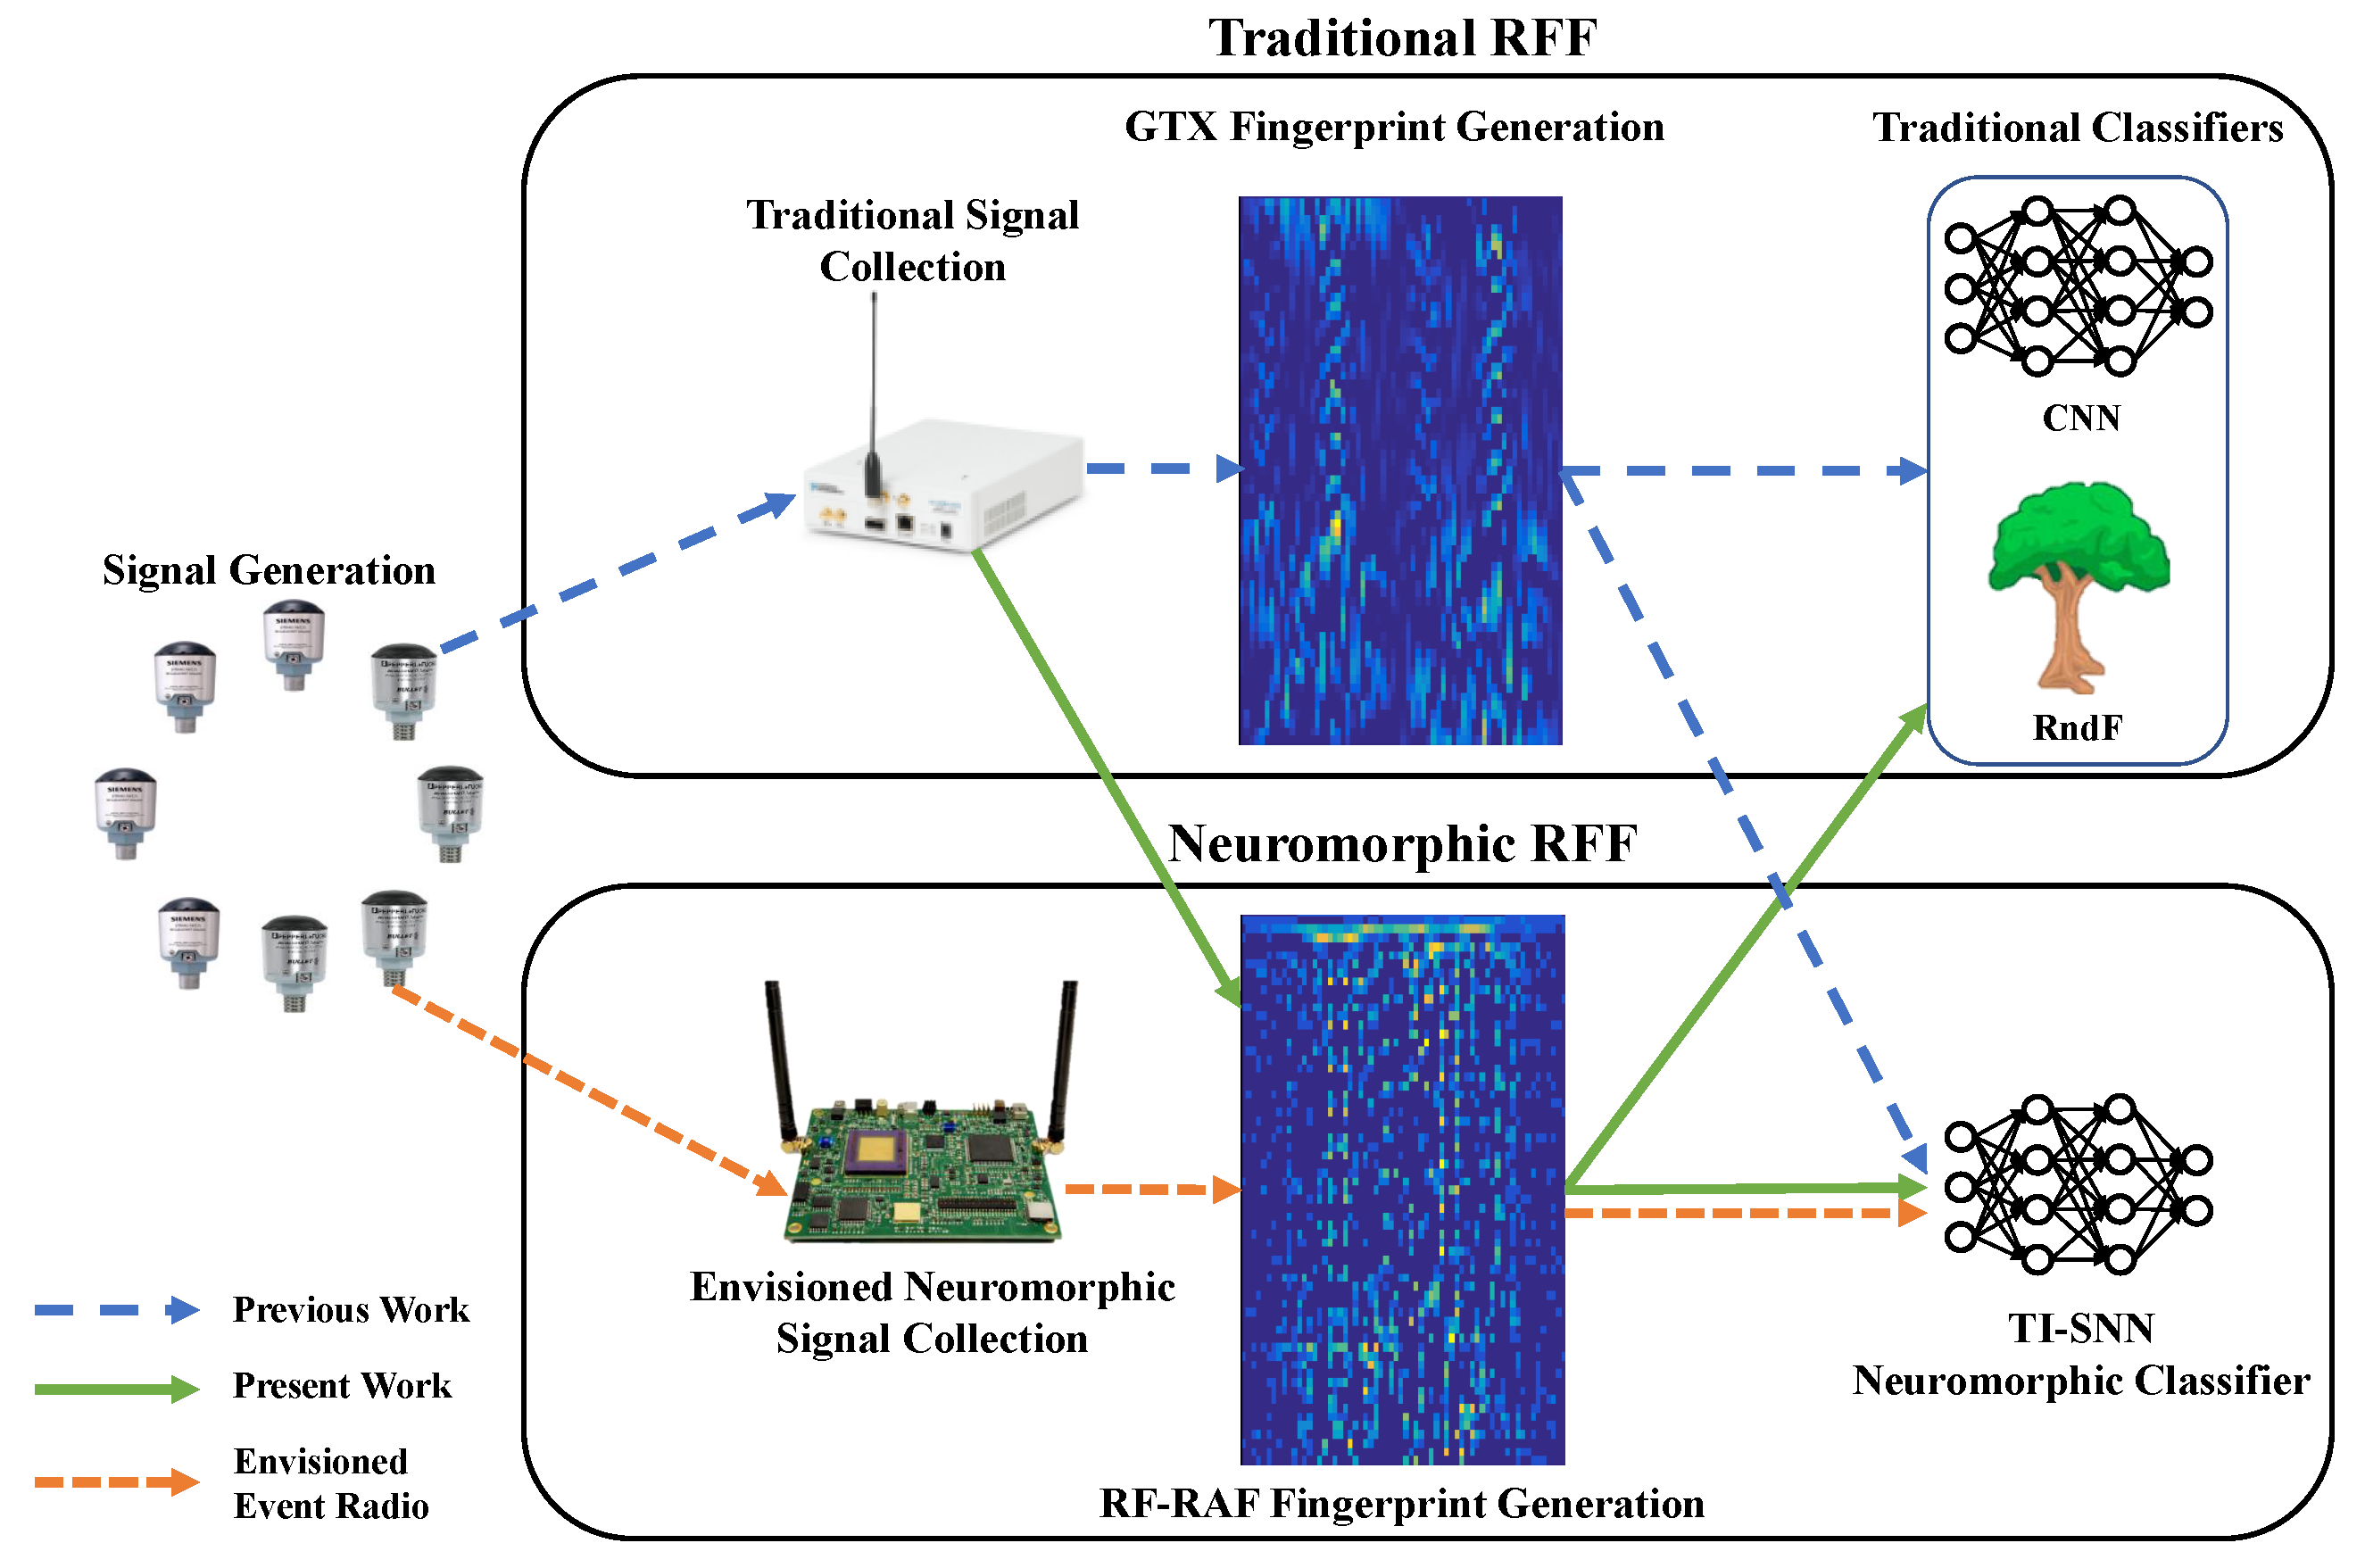
As depicted in Figure 1, this work continues the development and demonstration of an envisioned RF event radio capability [2] with a focus on neuromorphic fingerprint generation. Prior work introduced the Time-Incremented Spiking Neural Network (TI-SNN) classifier as a neuromorphic-friendly approach to RF signal classification [3], providing an alternative to conventional classifiers such as Convolutional Neural Network (CNN) and Random Forest (RndF). Related work also explored Gabor Transform (GTX) fingerprinting for encoding RF signals into sparse representations [2]. However, despite its effectiveness, the GTX approach relies on non-neuromorphic methods (Fast Fourier Transform (FFT)-based processing) and imposes algorithmic constraints that limit temporal resolution at smaller fingerprint sizes. While the TI-SNN can operate on GTX fingerprints, the overall pipeline remains dependent on non-neuromorphic processing stages, preventing the realization of a fully end-to-end neuromorphic RF Event Radio.
Resonate and Fire (RAF) neuron models address these limitations by providing a native mechanism for frequency-selective encoding [4,5]. The development of the subsequent Radio Frequency Resonate and Fire (RF-RAF) neuron [6] model extends the prior RAF formulations to operate directly on complex-valued RF signals. The RF-RAF neuron further mitigates discretization-induced frequency bias while providing more accurate frequency-selective responses. This enables the construction of fingerprint representations that are inherently sparse, non-negative, and directly compatible with neuromorphic processing.
The RF-RAF neuron model was first introduced in [6] and is adopted here to evaluate its effectiveness as a feature extraction mechanism for Radio Frequency Fingerprinting (RFF) applications. RF-RAF fingerprinting performance is evaluated across RndF, CNN and TI-SNN classifier architectures, and their discrimination performance is compared against baseline GTX-based representations under controlled experimental conditions using Wireless Highway Addressable Remote Transducer (WirelessHART) device transmissions.
This work investigates whether aligning the fingerprint generation process with neuromorphic principles—rather than adapting conventional transforms—yields improved model generation efficiency and classification performance. GTX serves as a functional baseline despite its being structurally mismatched to neuromorphic constraints—this differs from RF-RAF, which is structurally aligned with neuromorphic processing. The central question addressed here is whether the GTX versus RF-RAF structural differences translate into measurable advantages in terms of classification accuracy, spike efficiency, wall-clock training time, wall-clock inference time, and robustness to channel variations.
The results demonstrate that RF-RAF fingerprints provide consistent improvements in classification accuracy over GTX-based representations across multiple classifiers and various channel operating conditions. Importantly, these improvements persist under time-span-matched conditions, which suggest that performance gains are not solely attributable to differences in input data utilization. Rather, the observed improvements are (1) consistent with the structural alignment of RF-RAF encoding and neuromorphic processing and (2) demonstrate that RF-RAF representations remain effective when applied to conventional machine learning models.
The remainder of this paper is organized as follows: Section 2 provides background on RF device fingerprinting and a summary of the RF-RAF neuron model development in [6]. Section 3 presents the methodology for WirelessHART dataset generation, RF fingerprint generation, and the experimental design used for demonstration. The classification results are presented in Section 4, and the conclusions are provided in Section 5.

2. Background

This section provides background on RF device fingerprinting in Section 2.1 and summarizes the RF-RAF neuron model in Section 2.2. These collectively form the basis for the fingerprinting approach evaluated in this paper.

2.1. RF Device Fingerprinting

RFF exploits inherent device-dependent information-bearing features resulting from hardware variations in wireless transmitters to authenticate devices at the physical layer [7]. These variations arise from manufacturing tolerances in components such as oscillators, amplifiers, and filters that produce device-dependent signal characteristics that are difficult to clone. For IoT applications, RFF provides a passive, non-cryptographic authentication layer that can detect spoofing attacks and unauthorized devices.
Prior work in [7] has explored statistical fingerprinting approaches for IoT device discrimination that commonly rely on conventional classifiers that may be unsuitable for edge deployment. The eventized GTX approach in [2] demonstrated that sparse, event-based fingerprint representations can achieve adequate classification performance while reducing data volume. Overall efficiency was subsequently improved using the TI-SNN classifier in [3], which further reduced computational requirements by eliminating CNN pretraining, avoiding rate-encoded fingerprints and enforcing temporal causality.
RFF provides a capability for enhancing the security of WirelessHART communication devices (IEC 62591 compliant [8]) that are among the notable devices being used in industrial internet applications [9]—the main WirelessHART alternatives are ISA100.11a-compliant devices [10,11]. While there are some key differences between WirelessHART and ISA100.11a device types [12], they share common IEEE 802.15.4-2006 2.4 GHz physical layer signaling [13]. Thus, the demonstration success in transitioning GTX-based processing from software to hardware using WirelessHART devices, and the RFF process in Figure 1 suggests that similar success can be achieved for ISA100.11a devices—this demonstration remains of interest for future work.
There is continued interest in using RFF for the physical-layer protection of 5G and beyond-5G systems’ remains [7,14,15,16], and the use of Distinct Native Attribute (DNA) fingerprint features provides a viable alternative for discriminating between hardware devices. This includes a specific benefit that is realized when using GTX-based DNA features [2,17,18].
Additionally, the practical utility for using Field-Programmable Gate Array (FPGA) hardware for GTX generation extends beyond the DNA-based fingerprinting demonstrated here and holds certain promise for influencing the efficiency of other GTX-based processes across various application spaces [19,20,21,22,23,24,25].

2.2. RF-RAF Neurons

The RF-RAF neuron model [6] extends the Balanced RAF (BRAF) neuron [5] to address two key limitations when processing RF signals: frequency-dependent bias introduced by Euler discretization, and restriction to real-valued inputs.
The forward-Euler discretization in BRAF neurons induces a frequency warping effect, such that the effective discrete-time response deviates from the intended design frequency. This deviation causes neurons to respond maximally at frequencies above their nominal tuned frequency. The RF-RAF formulation compensates for the frequency-offset effect using a sinusoidal pre-warping term that causes each neuron to respond maximally at its design frequency.
The discrete-time membrane potential dynamics of an RF-RAF neuron are given by:
u k [ i ] = u k [ i 1 ] + β k [ i ] + j f s sin ( 2 π f k / f s ) u k [ i 1 ] + x [ i ] f s ,
where u k is the complex membrane potential of the k-th neuron, f k is the neuron’s resonant design frequency, f s is the sampling frequency, and x [ i ] = I [ i ] + j Q [ i ] is the complex-valued input accommodating both in-phase and quadrature components.
The adaptive damping factor is:
β k [ i ] = f s 1 + cos 2 π f k f s β q k [ i ] ,
where β is a trainable constant regulating spiking activity, and q k [ i ] is an adaptive refractory period defined as
q k [ i ] = γ q k [ i 1 ] + S k [ i 1 ] / f s .
The γ in (3) is the trainable decay factor governing refractory persistence, and S k [ i 1 ] is the spike output at the previous time step. The β and γ parameters collectively control the trade-off between frequency selectivity and temporal sparsity, such that a larger β produces sharper resonance and a larger γ increases temporal integration.
The pre-warping term in (1) eliminates the frequency-dependent bias present in BRAF neurons and ensures accurate frequency alignment. This modification also extends the stable operating range from | f k | < f s / 2 π (BRAF) to | f k | < f s / 4 (RF-RAF) while increasing the usable design frequency range without requiring higher-order integration or increased sampling rates [6].
Output spikes are generated using a magnitude-based threshold:
S k [ i ] = 1 , if   u k [ i ]   ϑ k [ i ] 0 , otherwise
where ϑ k [ i ] = ϑ c + q k [ i ] is the adaptive threshold. The magnitude-based condition in (4) enables symmetric sensitivity to both I and Q components and improves out-of-band rejection relative to the real-valued thresholding used in BRAF [6].
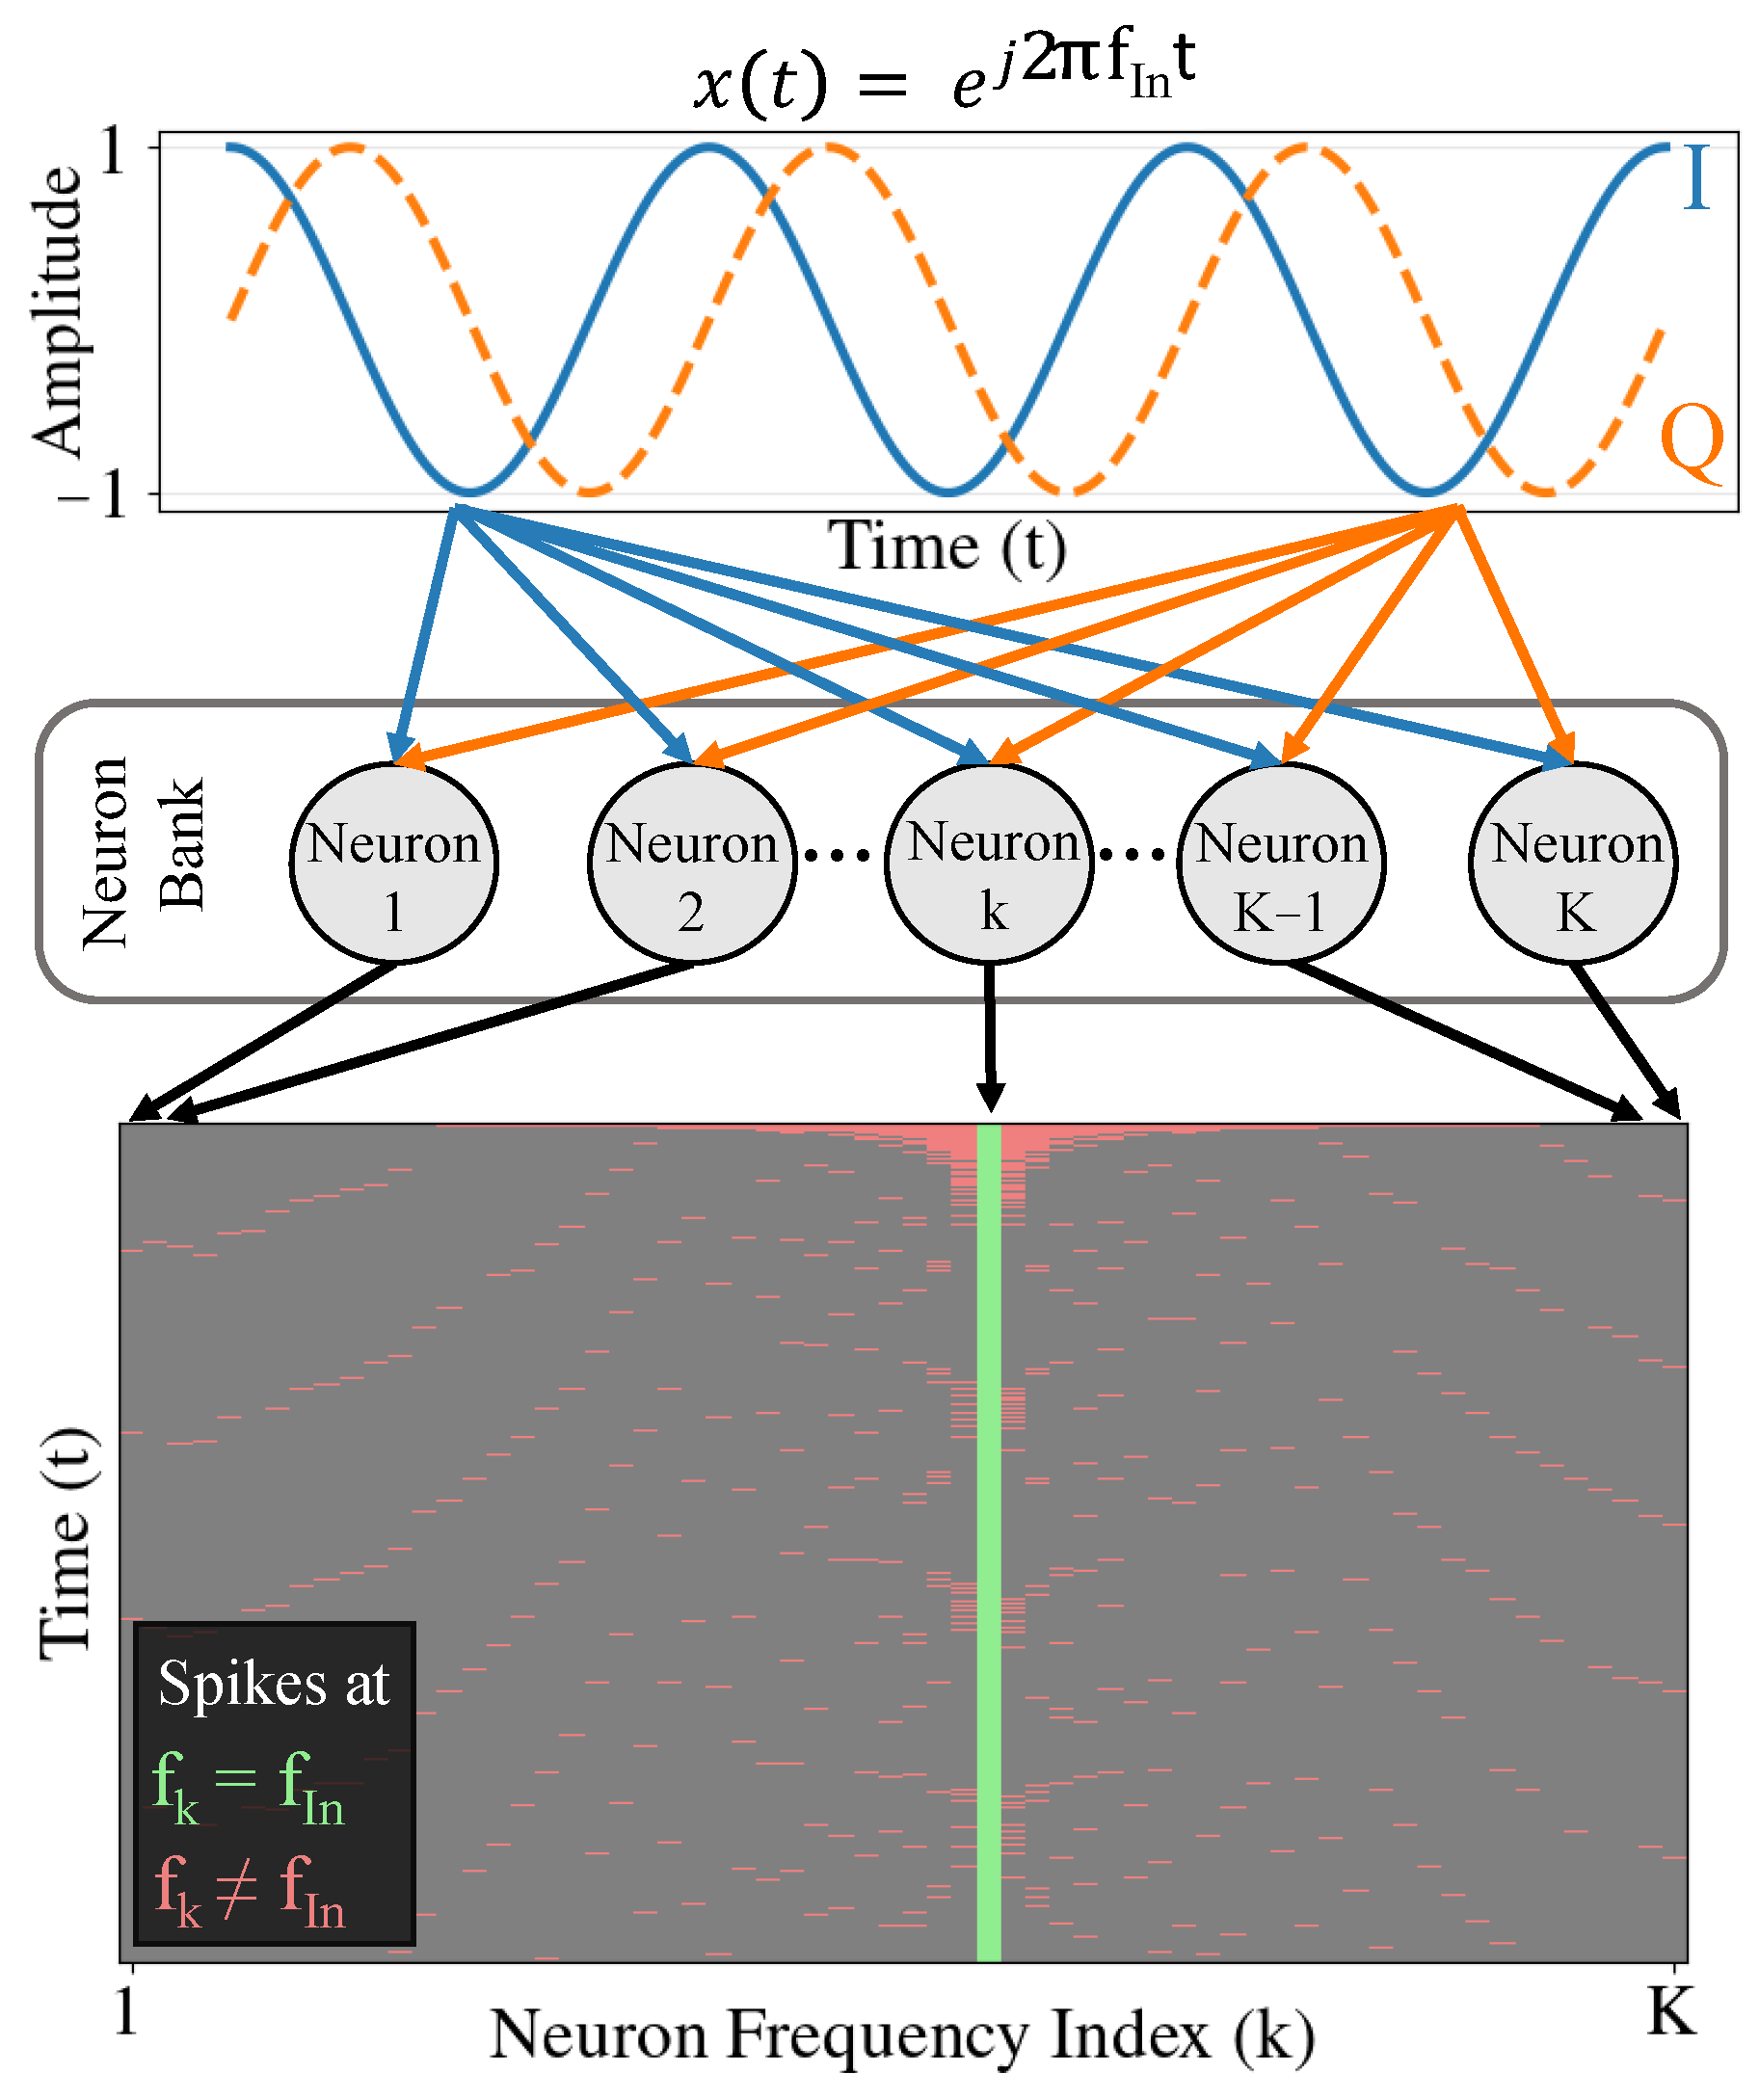
RF-RAF implementation eliminates frequency bias and extends the stable operating range while producing frequency-aligned responses across the neuron bank. When applied across K design frequencies, as in Figure 2, the resulting spike trains form a sparse time-frequency representation that serves as the basis for RF fingerprint generation.

3. Methodology

This section describes the methodology for evaluating the RF-RAF fingerprint approach. Section 3.1 details the WirelessHART dataset, Section 3.2 explains the fingerprint generation techniques, and Section 3.3 covers the experimental design including classifier design and training procedures.

3.1. WirelessHART Dataset

The WirelessHART dataset from [26] is used to evaluate the RF-RAF approach. A brief overview of the dataset is provided here for completeness, and more complete descriptions are available in [3,26,27]. The dataset is derived from experimentally collected transmissions for N D e v = 8 WirelessHART devices operating over N C h = 15 frequency channels in a Time-Slotted Channel Hopping (TSCH) configuration [28]. The complex-valued In-phase and Quadrature (I/Q) signals were collected using an X310 Software Defined Radio (SDR) [29]. The SDR was configured to provide down-conversion to the baseband, baseband filtering at W B B = 1.25 MHz and down-sampling to f s = 5 Mega Samples per Second (MSpS) [27]. A total of 8,576 burst preamble responses were collected per device ( N B r s t = 68,608 total). This total was split into 60%/20%/20% pools to train (5145/device), validate (1715/device), and test (1715/device) classifier performance.
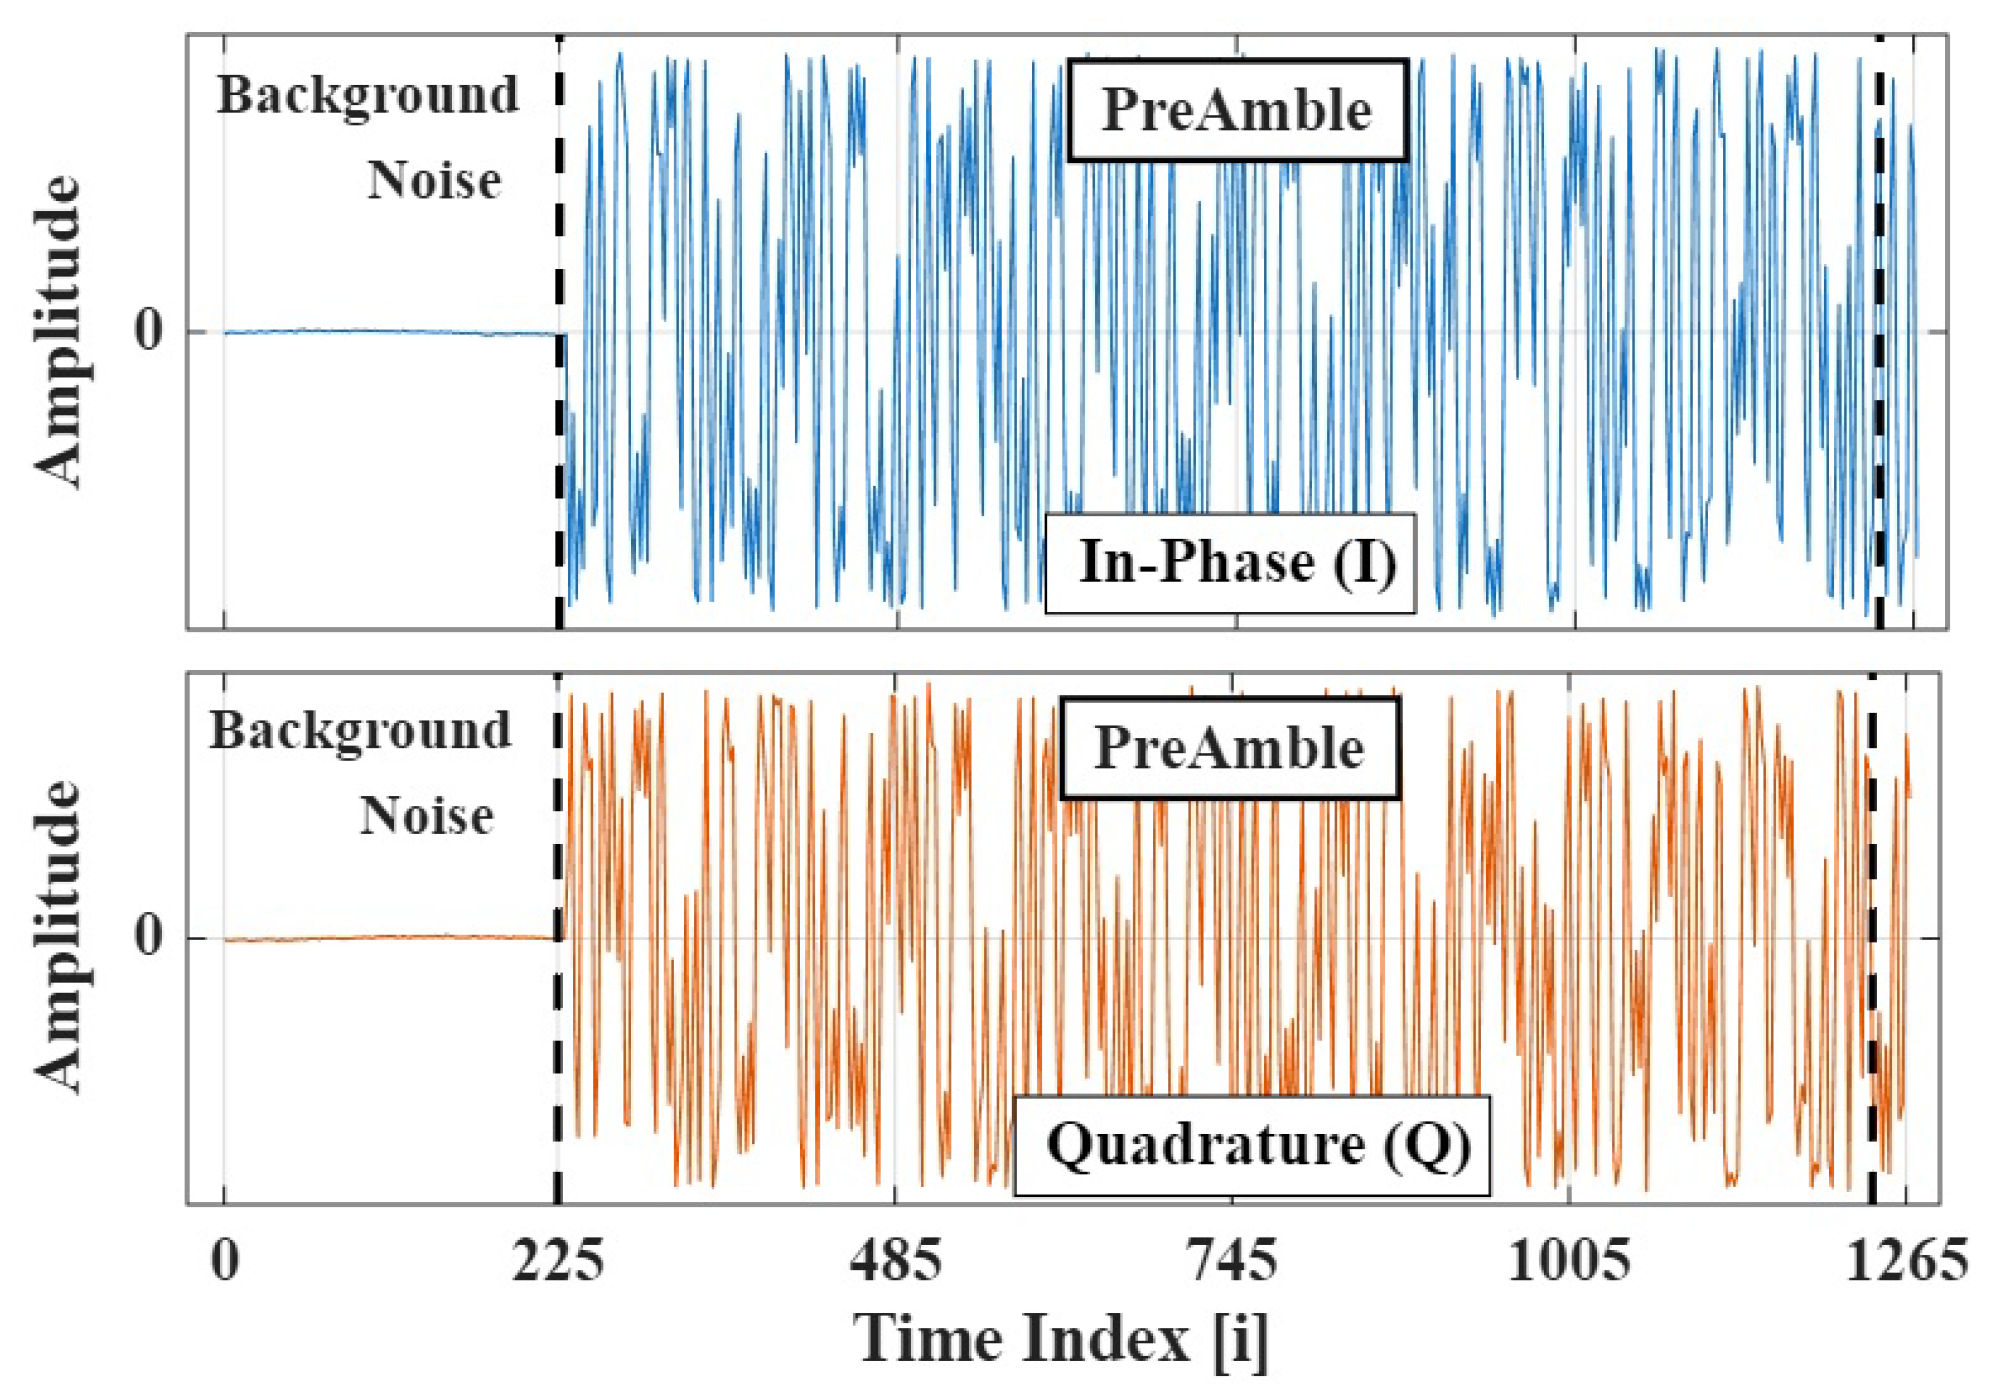
Figure 3 shows a representative WirelessHART burst from Device 1 with separate in-phase and quadrature components shown. The burst spans 1251 samples with the active preamble region containing classification-relevant information and spanning approximately 1000 samples. Both GTX and RF-RAF fingerprints are generated from this active region.

3.2. RF Fingerprint Generation

Two fingerprint generation approaches are evaluated, including: (1) the GTX-based fingerprint ( F G T X ) generation process taken from [2] and used in [3], and (2) the proposed RF-RAF-based fingerprint ( F R F - R A F ) generation process used here. Though based on fundamentally different generation mechanisms, both fingerprint types effectively capture time-frequency content of RF bursts and are used for device classification.
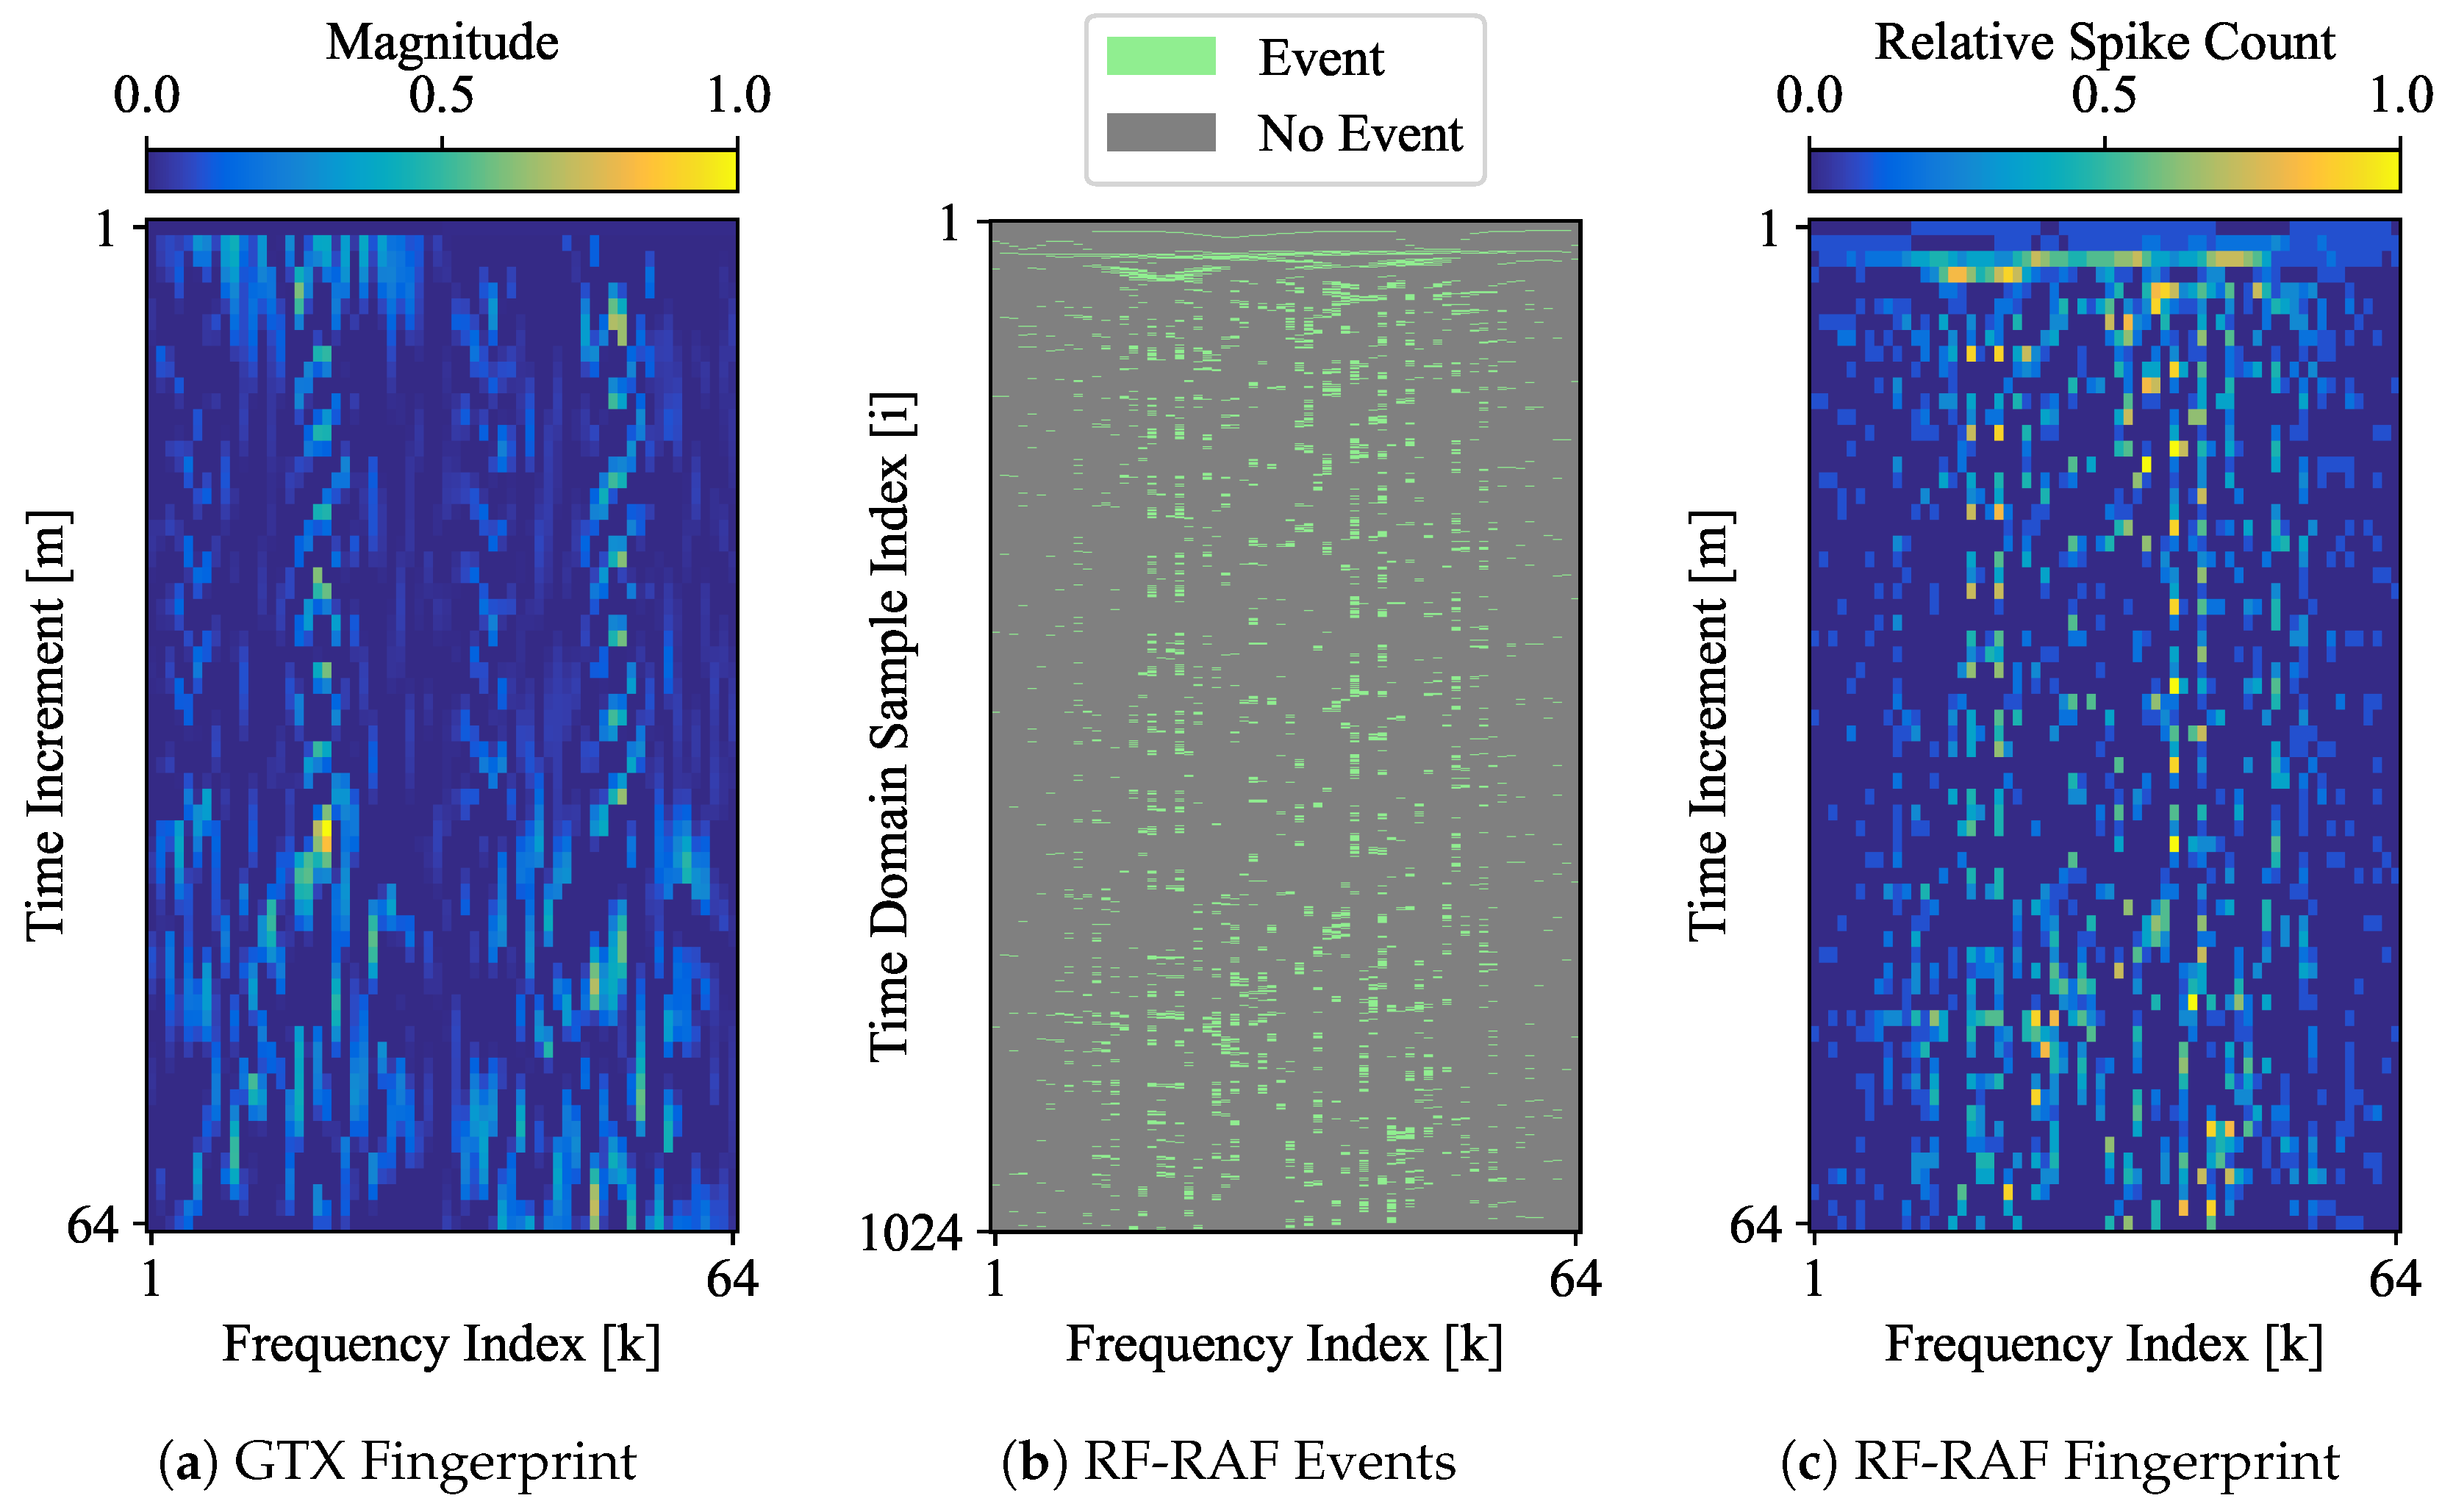
Specific details for F G T X fingerprint generation are provided in [3]. The GTX approach uses an FFT-based algorithm to compute a 2D matrix of complex time-frequency elements that are used to generate GTX-based fingerprints. GTX fingerprint features are derived from the GTX coefficient matrix that is first mean-centered and normalized. This produces both positive and negative values that cannot be directly input to neuromorphic classifiers. To address this, the negative and positive matrix values are then segregated into two separate matrices. The magnitude of the negative value matrix is taken, and the resultant matrix is concatenated with the positive value matrix to form the final GTX fingerprint, such as that shown in Figure 4a. This process effectively reduces the frequency resolution by a factor of one-half when considering comparisons using a fixed number of frequency bins. In contrast, the RF-RAF approach inherently produces non-negative outputs that can be directly input to neuromorphic classifiers without modification.
Alternative GTX fingerprint encodings that maintain frequency resolution (e.g., non-centered magnitude-only GTX representations) were originally explored but degraded overall classification performance and were, therefore, not considered further. For completeness in maintaining baseline GTX performance and to distinguish the work here from prior work, eventized GTX representations [3]—in which the centered-normalized | GTX ( m , k ) | elements are thresholded using a given eventization threshold to produce binary spike values—are not considered in this work.
The F R F - R A F generation approach proceeds as follows. The complex-valued preamble region samples, such as those shown in Figure 3, are first extracted and then processed by a bank of K RF-RAF neurons. The neuron bank outputs a T × K binary spike matrix where each matrix row corresponds to a time sample, and each column corresponds to a frequency-tuned neuron. Figure 4b shows an example output from an RF-RAF neuron bank processing a WirelessHART burst. The bank contains K = 64 neurons with resonant frequencies uniformly spaced over f n [ 1.25 ,   1.25 ] MHz. Spiking patterns capture the signal’s frequency content over time.
To reduce dimensionality, temporal binning is applied to the T × K binary spike matrix by summing spike events over N Δ samples, resulting in an M × K fingerprint, F R F - R A F , where each element represents accumulated activity within a time increment. Features of the F R F - R A F fingerprints are directly used as input to the classifiers. Figure 4c shows the binned RF-RAF fingerprint ( F R F - R A F ) with N Δ = 30.
Feature characteristics of the F R F - R A F fingerprint are chiefly governed by the two parameters introduced in Section 2.2: the damping sharpness β , which controls the sharpness of each neuron’s frequency-selective resonance window, and the refractory decay rate γ , which governs how rapidly the adaptive threshold decays between firings. These parameters were selected through Bayesian tuning using the Optuna framework [30] with the Tree-structured Parzen Estimator (TPE) sampler.
The F R F - R A F fingerprint β and γ parameters were simultaneously tuned for classification accuracy over the training fingerprint and validation fingerprint partitions. The tuning search included β varying on a log-uniform scale over the range of [ 1 × 10 3 , 1 × 10 2 ] . This range effectively spans the broad low-selectivity resonance to narrow discriminative tuning regimes. The tuning search for γ was uniform over [ 0.950 ,   0.999 ] , where lower values permit rapid successive spiking, and higher values impose prolonged post-firing suppression. A single parameter set was applied across all RF-RAF fingerprint sizes to maintain consistency and demonstrate robustness. Tuning was evaluated for each candidate β and γ pair by training a TI-SNN classifier on the generated fingerprints and measuring classification accuracy on the validation set. The best-performing final selected parameter pair included β = 0.0031 and γ = 0.998. Empirically, moderate variations in β and γ around these selected values produced consistent classification performance and indicate limited sensitivity to precise tuning.
The RF-RAF fingerprint offers two immediate advantages over GTX. First, RF-RAF natively produces non-negative outputs compatible with neuromorphic hardware. In contrast, GTX representations contain signed values and, therefore, require additional encoding to produce a non-negative representation, reducing the number of distinct frequency bins for a fixed fingerprint size. Alternative encoding strategies were explored but degraded classification performance and are, therefore, not considered further.
Second, the number of time increments M and frequency bins K can be selected independently for RF-RAF. This differs from GTX, which imposes coupled constraints on valid [ M , K ] that can adversely limit the number of burst samples processed (transformed time span). This is particularly true for smaller fingerprint sizes, where the effect of [ M , K ] can be most impactful. Additional details for [ M , K ] size constraints and a reduced sample span are discussed in Section 3.3.1.

3.3. Experimental Design

The experimental evaluation compares RF-RAF and GTX fingerprints across three classifier architectures at six fingerprint sizes. The comparative performance metrics include measured classification accuracy, the spike count per inference (TI-SNN only), the training duration (wall-clock time), and the time per inference (wall-clock time). The spike count per inference is measured as the total number of spikes generated by the TI-SNN during a single inference cycle and is used as a proxy for inference energy—spike operations are a major contributor to neuromorphic computational costs [31].
All wall-clock times reported herein are relative and based on processing using a fixed hardware-software environment to provide a consistent comparison across classifiers—it is reasonable to expect that actual values will differ for neuromorphic hardware deployment. All experiments were conducted on a laptop workstation equipped with an Intel Core i9-13950HX processor (24 cores), 128 GB of system memory, and an NVIDIA RTX 5000 Ada Generation GPU with 16 GB of VRAM. Classifiers were implemented in Python 3.11.9 using PyTorch 2.4 with CUDA 12.0, scikit-learn 1.5 for the RndF baseline, snnTorch 0.9 for SNN training, and Optuna 4.7 for Bayesian hyperparameter tuning.
To ensure statistical robustness, each fingerprint type–size–classifier configuration is evaluated over 20 independent repetitions (varying random initialization and training stochasticity), and the results are reported as aggregated statistics across all repetitions. The 95% Confidence Intervals (CIs) [32] are computed from these 20 repetitions, each of which includes 1715 test bursts per each of the eight devices (274,400 total test trials per configuration). CIs are sufficiently small, such that they are not visually distinguishable in the figures of Section 4. In addition, robustness to noise is assessed in Section 4.2, where the results are presented for M = 32 fingerprints. These results are also based on 20 repetitions per SNR level with channel conditions for SNR = −22 dB to SNR = 20 dB in 2 dB increments.

3.3.1. Fingerprint Sizes

As is summarized in Table 1 for F G T X fingerprints and Table 2 for F R F - R A F fingerprints, classification performance was evaluated for multiple fingerprint sizes. This included varying time increment M while fixing the number of frequency bins to K = 64. For generating the F G T X fingerprints, the Region of Interest (ROI) N G T M and N G T K dimensions were selected to satisfy GTX algorithm constraints while maximizing the number of burst time-domain samples ( N B T D ) used. The first t S t a r t samples of the burst are omitted to meet the constraint in (5) while prioritizing the most active portion of the burst. The resultant frequency range ( f R a n g e ) and resolution ( f Δ ) are kept as consistent as possible across GTX fingerprint sizes, given the constrained [ N G T M , N G T K , N Δ ] combinations.
Note that GTX fingerprints generated for M ≤ 8 use significantly fewer time-domain burst samples and thus cannot extract all usable information from the active region. The two constraints for GTX generation are (1) N G T M × N Δ cannot exceed the number of time-domain burst samples N S a m p l e s , as shown in (5), and (2) the time increments must exceed the temporal bin size for a meaningful temporal resolution, as shown in (6). Smaller N G T M values, therefore, limit the number of input samples that can be incorporated while satisfying both constraints, resulting in the underutilization of the active burst.
N G T M × N Δ = N B T D N S a m p l e s
N G T M > N Δ
The RF-RAF approach involves no such constraint and can utilize all active burst samples. For a direct comparison, the last two rows of Table 2 are time-span-matched to the corresponding GTX fingerprints in Table 1 by using similar time-domain sample counts. Because RF-RAF outputs are non-negative, K = 64 frequency bins are maintained without concatenating positive and negative values, as in GTX. This allows denser frequency spacing within the RF-RAF neuron bank.

3.3.2. Classifiers

The GTX and RF-RAF fingerprint generation approaches are evaluated using three different classifier types: RndF, CNN, and TI-SNN. RndF operates on aggregated feature statistics without explicitly modeling the spatial or temporal structure, the CNN exploits local spatial correlations in the time–frequency representation, and the TI-SNN processes spike-based data and can leverage temporal structure and sparsity. Thus, the performance differences between the classifiers are expected to be consistent with the inductive biases that each posseses. These differences are expected to become evident when all the classifiers are used to process the same input fingerprint representation.
As introduced in [3], the TI-SNN classifier is a neuromorphic-friendly Spiking Neural Network (SNN) designed for event-based fingerprint classification. The RndF and CNN classifiers are considered to provide non-neuromorphic machine learning benchmarks. The TI-SNN classifier here follows the architecture and training procedure of [3], which includes: (1) a three-layer fully connected Leaky Integrate-and-Fire (LIF) network with arctangent surrogate gradients [33], (2) training with an Mean Squared Error (MSE) count loss (correct-class rate of 0.8 and incorrect-class rate of 0.2), and (3) the use of an Adam optimizer ( l r = 0.015) with cosine annealing. The number of neurons in the hidden layers is set to N h = 110, as in [3]. The LIF membrane decay β L I F and firing threshold ϑ L I F are initialized from Bayesian tuning and remain learnable throughout training. Early stopping is applied after epoch 15 if validation accuracy fails to improve over P = 10 epochs.
The CNN classifier here follows the two-layer convolutional structure of [3] and is reimplemented here in PyTorch [34] with channel widths automatically scaled to target approximately 20,000 parameters. For small-time-dimension fingerprints ( M 8 ), a One-Dimensional (1D) convolution is performed with time bins absorbed as channels. For ( M 16 ), a standard Two-Dimensional (2D) convolution is performed. For the CNN classifier, the training uses an Adam optimizer ( l r = 0.01), cosine annealing, and cross-entropy loss with P = 10 epochs for early stopping, as with the TI-SNN.
The RndF classifier follows the implementation of [3] with a 100-tree scikit-learn ensemble fit on the flattened fingerprint. The RndF classification performance serves as a classical machine-learning baseline.

4. Results

This section evaluates whether the structural differences between GTX and RF-RAF fingerprinting translate into measurable performance advantages. In particular, RF-RAF provides a native, event-driven encoding aligned with neuromorphic processing, whereas GTX represents an adapted, transform-based approach subject to constraints on temporal resolution and data utilization.
The performance is analyzed in terms of average cross-device classification accuracy, % C , spike efficiency, N S p k / I n f , the wall-clock training duration, T T r n , and the wall-clock inference time, T I n f . These metrics enable a comparison of both effectiveness and computational costs across fingerprinting methods, fingerprint sizes and classifier architectures.
Section 4.1 presents performance metrics over varied fingerprint sizes. Section 4.2 evaluates the robustness of RF-RAF and GTX fingerprints to noise by comparing classification accuracy across a range of channel Signal-to-Noise Ratio (SNR) levels. Finally, Section 4.3 analyzes misclassification patterns to distinguish and assess whether the RF-RAF fingerprinting approach mitigates these challenges compared to the GTX baseline.

4.1. Fingerprint Size Variation Analysis

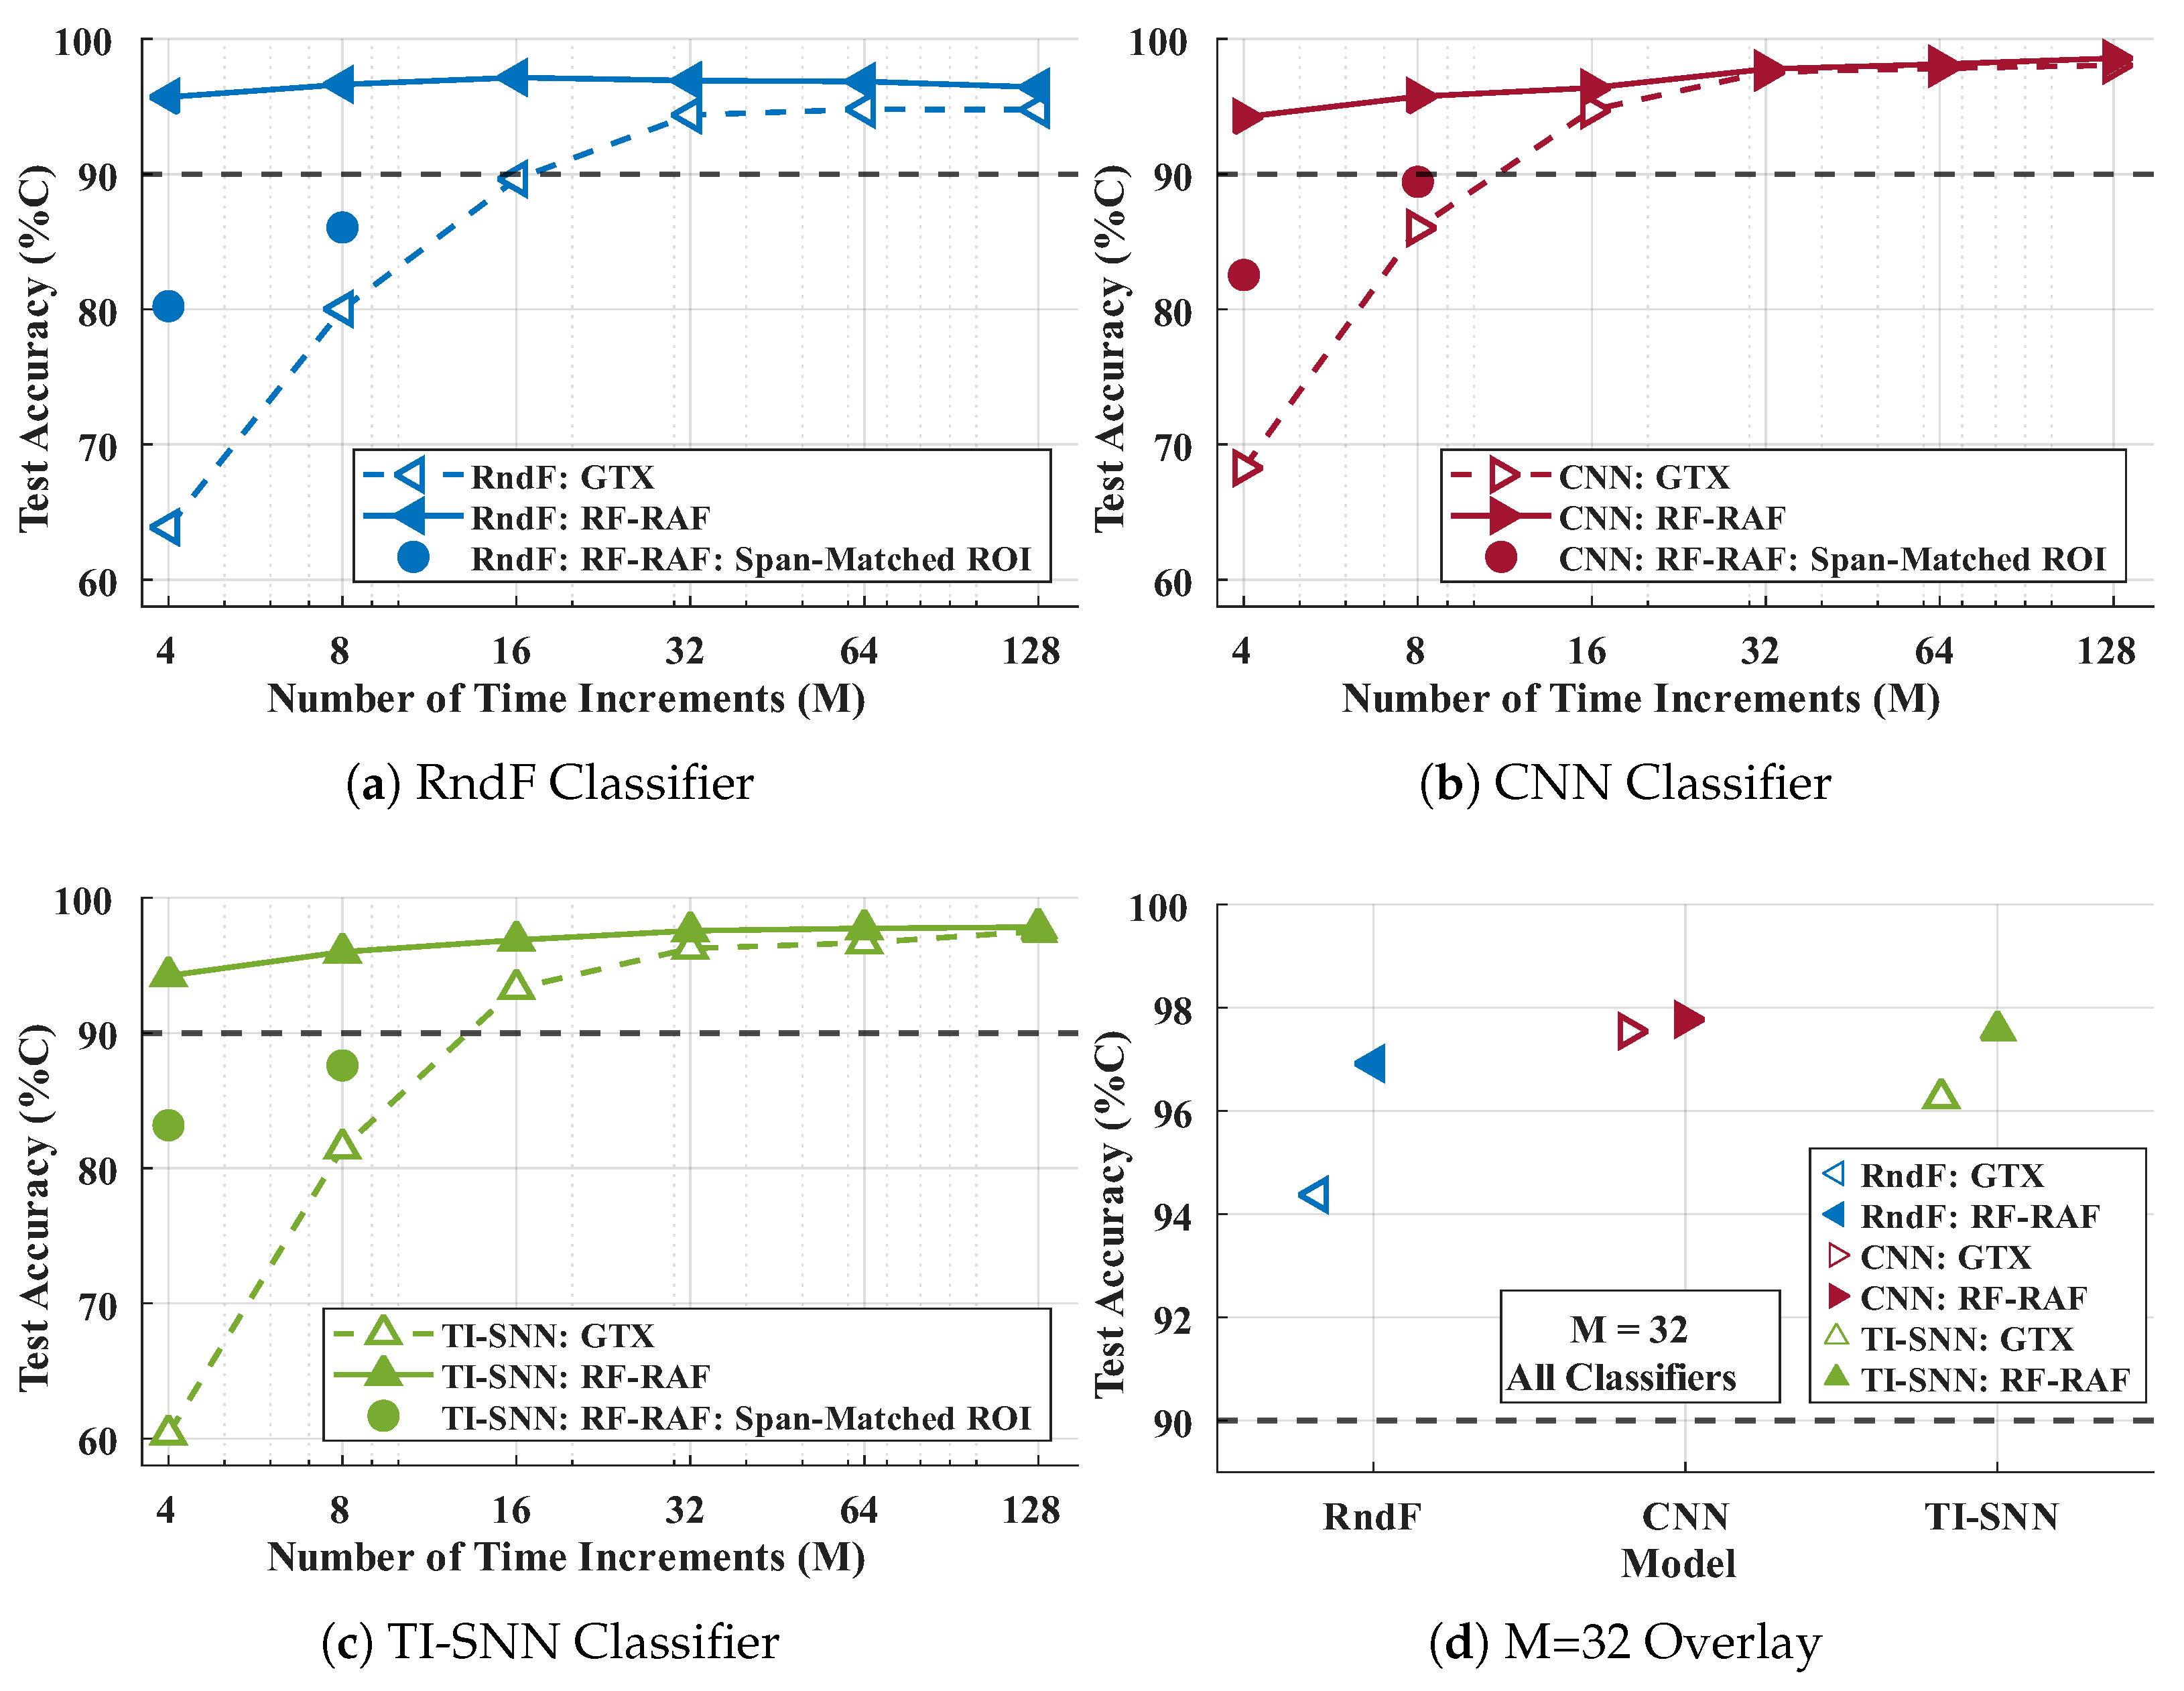
Figure 5a–c show classification accuracy as a function of the number of time increments, M, included in the fingerprint for both F G T X and F R F - R A F fingerprints. Figure 5d compares all classifiers at M = 32 time increments. All three classifiers show a general trend of increasing accuracy with more time increments, with the RF-RAF fingerprints consistently outperforming the GTX fingerprints across all M values. The separation in performance is most pronounced at lower M values, where the GTX fingerprints exhibit reduced classification accuracy, while the RF-RAF fingerprints maintain relatively high accuracy, even with fewer time increments. To isolate algorithmic effects from data utilization, span-matched RF-RAF fingerprints (•) were constructed using matched time-domain support as GTX. These markers correspond to the last two rows of Table 2. While this work did not isolate all contributing factors, the consistency of the results across time-span-matched conditions and multiple classifier types suggests that the observed gains of RF-RAF over GTX are not solely attributable to differences in the data utilization or classifier selection.
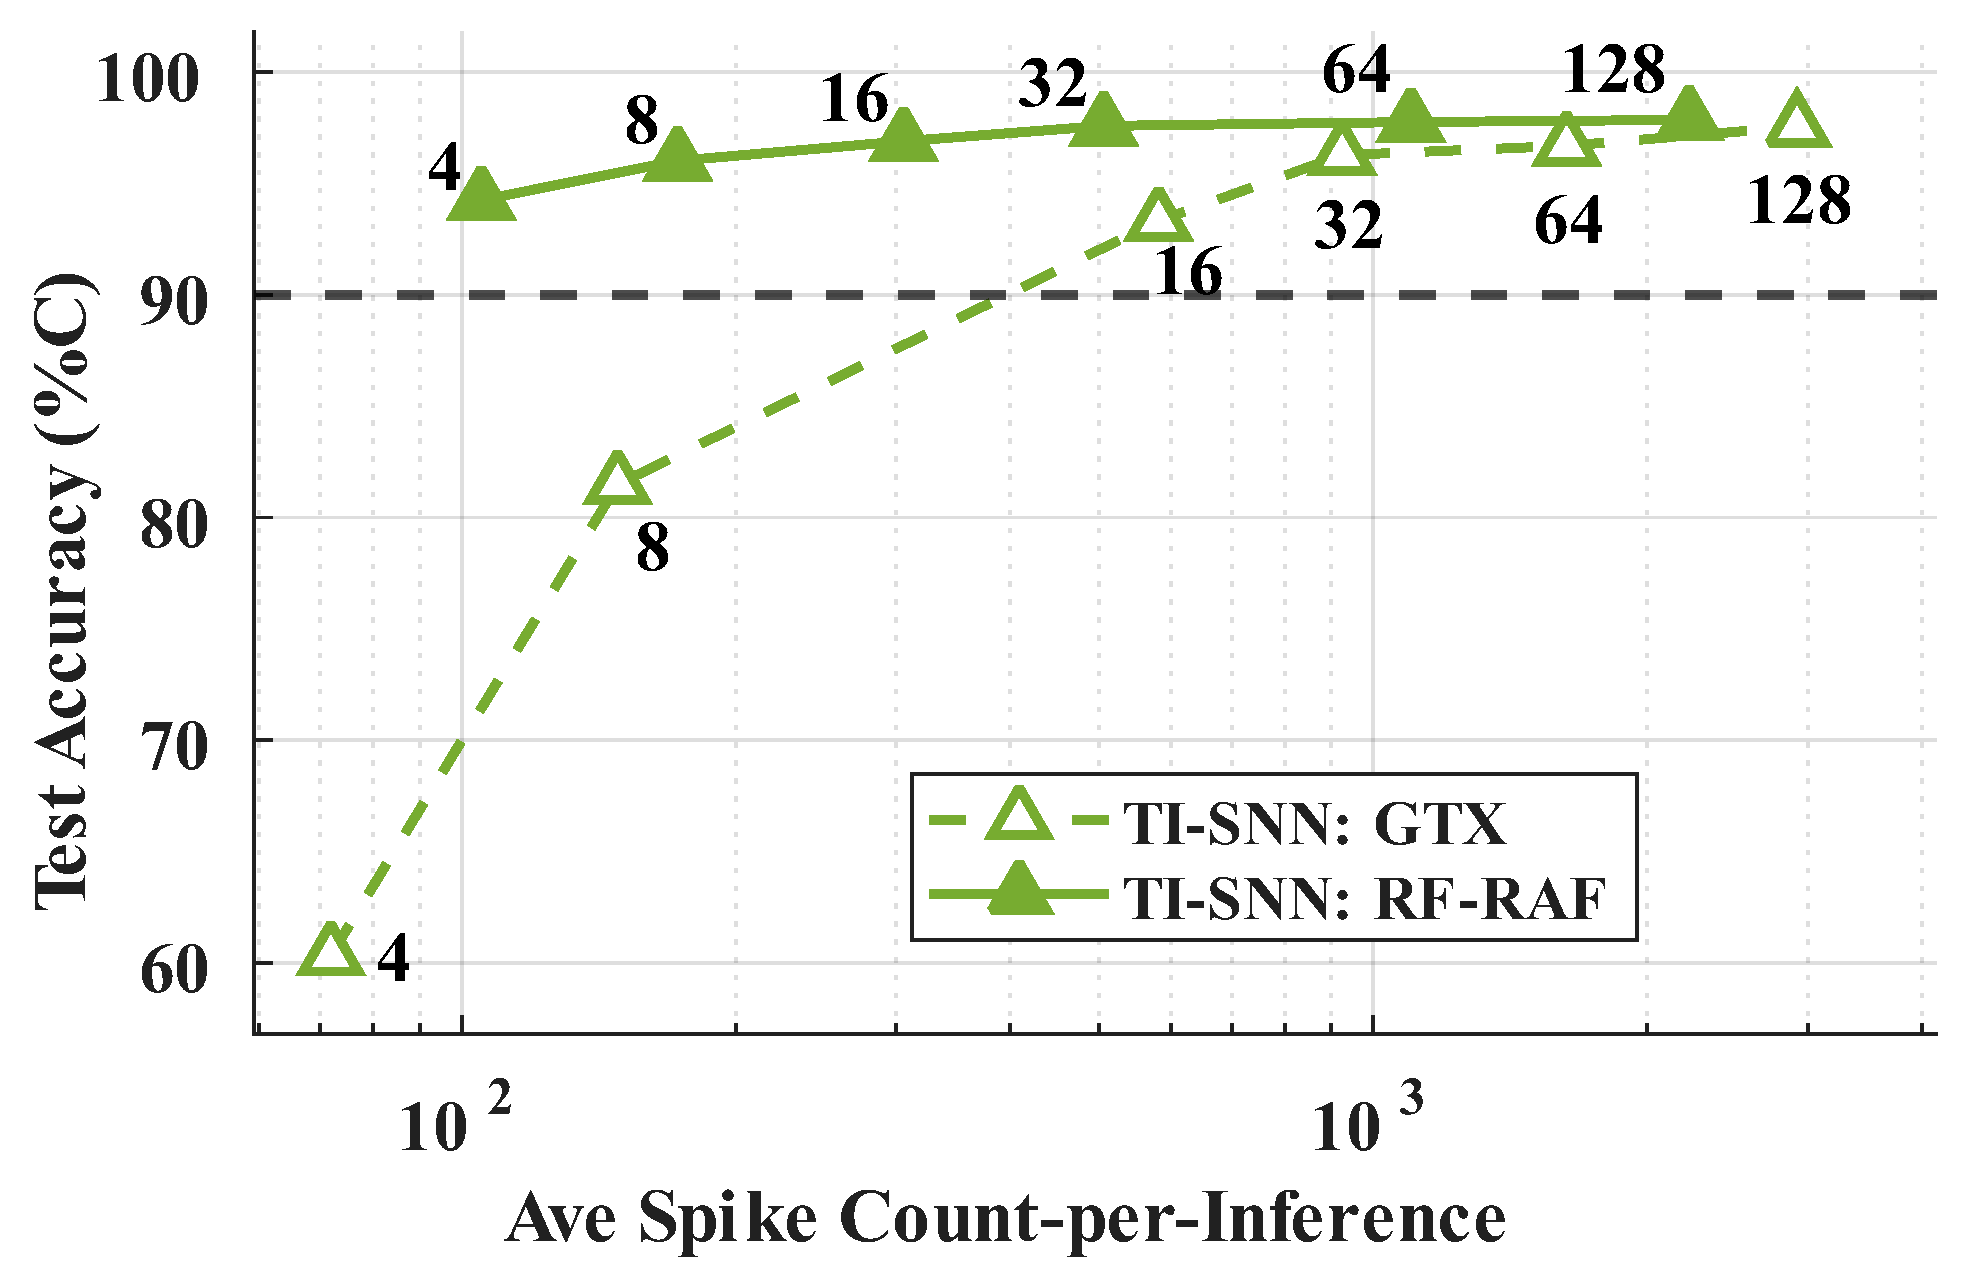
Beyond classification accuracy, spike efficiency provides insight into how effectively each representation encodes discriminative information for neuromorphic processing. Figure 6 plots classification accuracy, % C , against the average number of spikes generated per inference, N S p k / I n f . The results are limited to the TI-SNN classifier, as it is the only model that can be directly implemented on neuromorphic hardware, for which the spike count is a critical metric for energy efficiency. When processing F R F - R A F , the TI-SNN achieves higher accuracy with fewer spikes compared to processing F G T X , demonstrating the efficiency of the RF-RAF fingerprint in encoding relevant information for classification. For instance, with the RF-RAF fingerprints, the TI-SNN surpasses the % C = 90% benchmark with an M = 4 RF-RAF fingerprint, achieving % C = 94% accuracy with around 100 spikes. However, the TI-SNN requires a M = 16 GTX fingerprint to surpass the % C = 90% benchmark, generating 1000 spikes in the process. This demonstrates that RF-RAF encodes discriminative information more efficiently, enabling accurate classification with significantly fewer spikes.
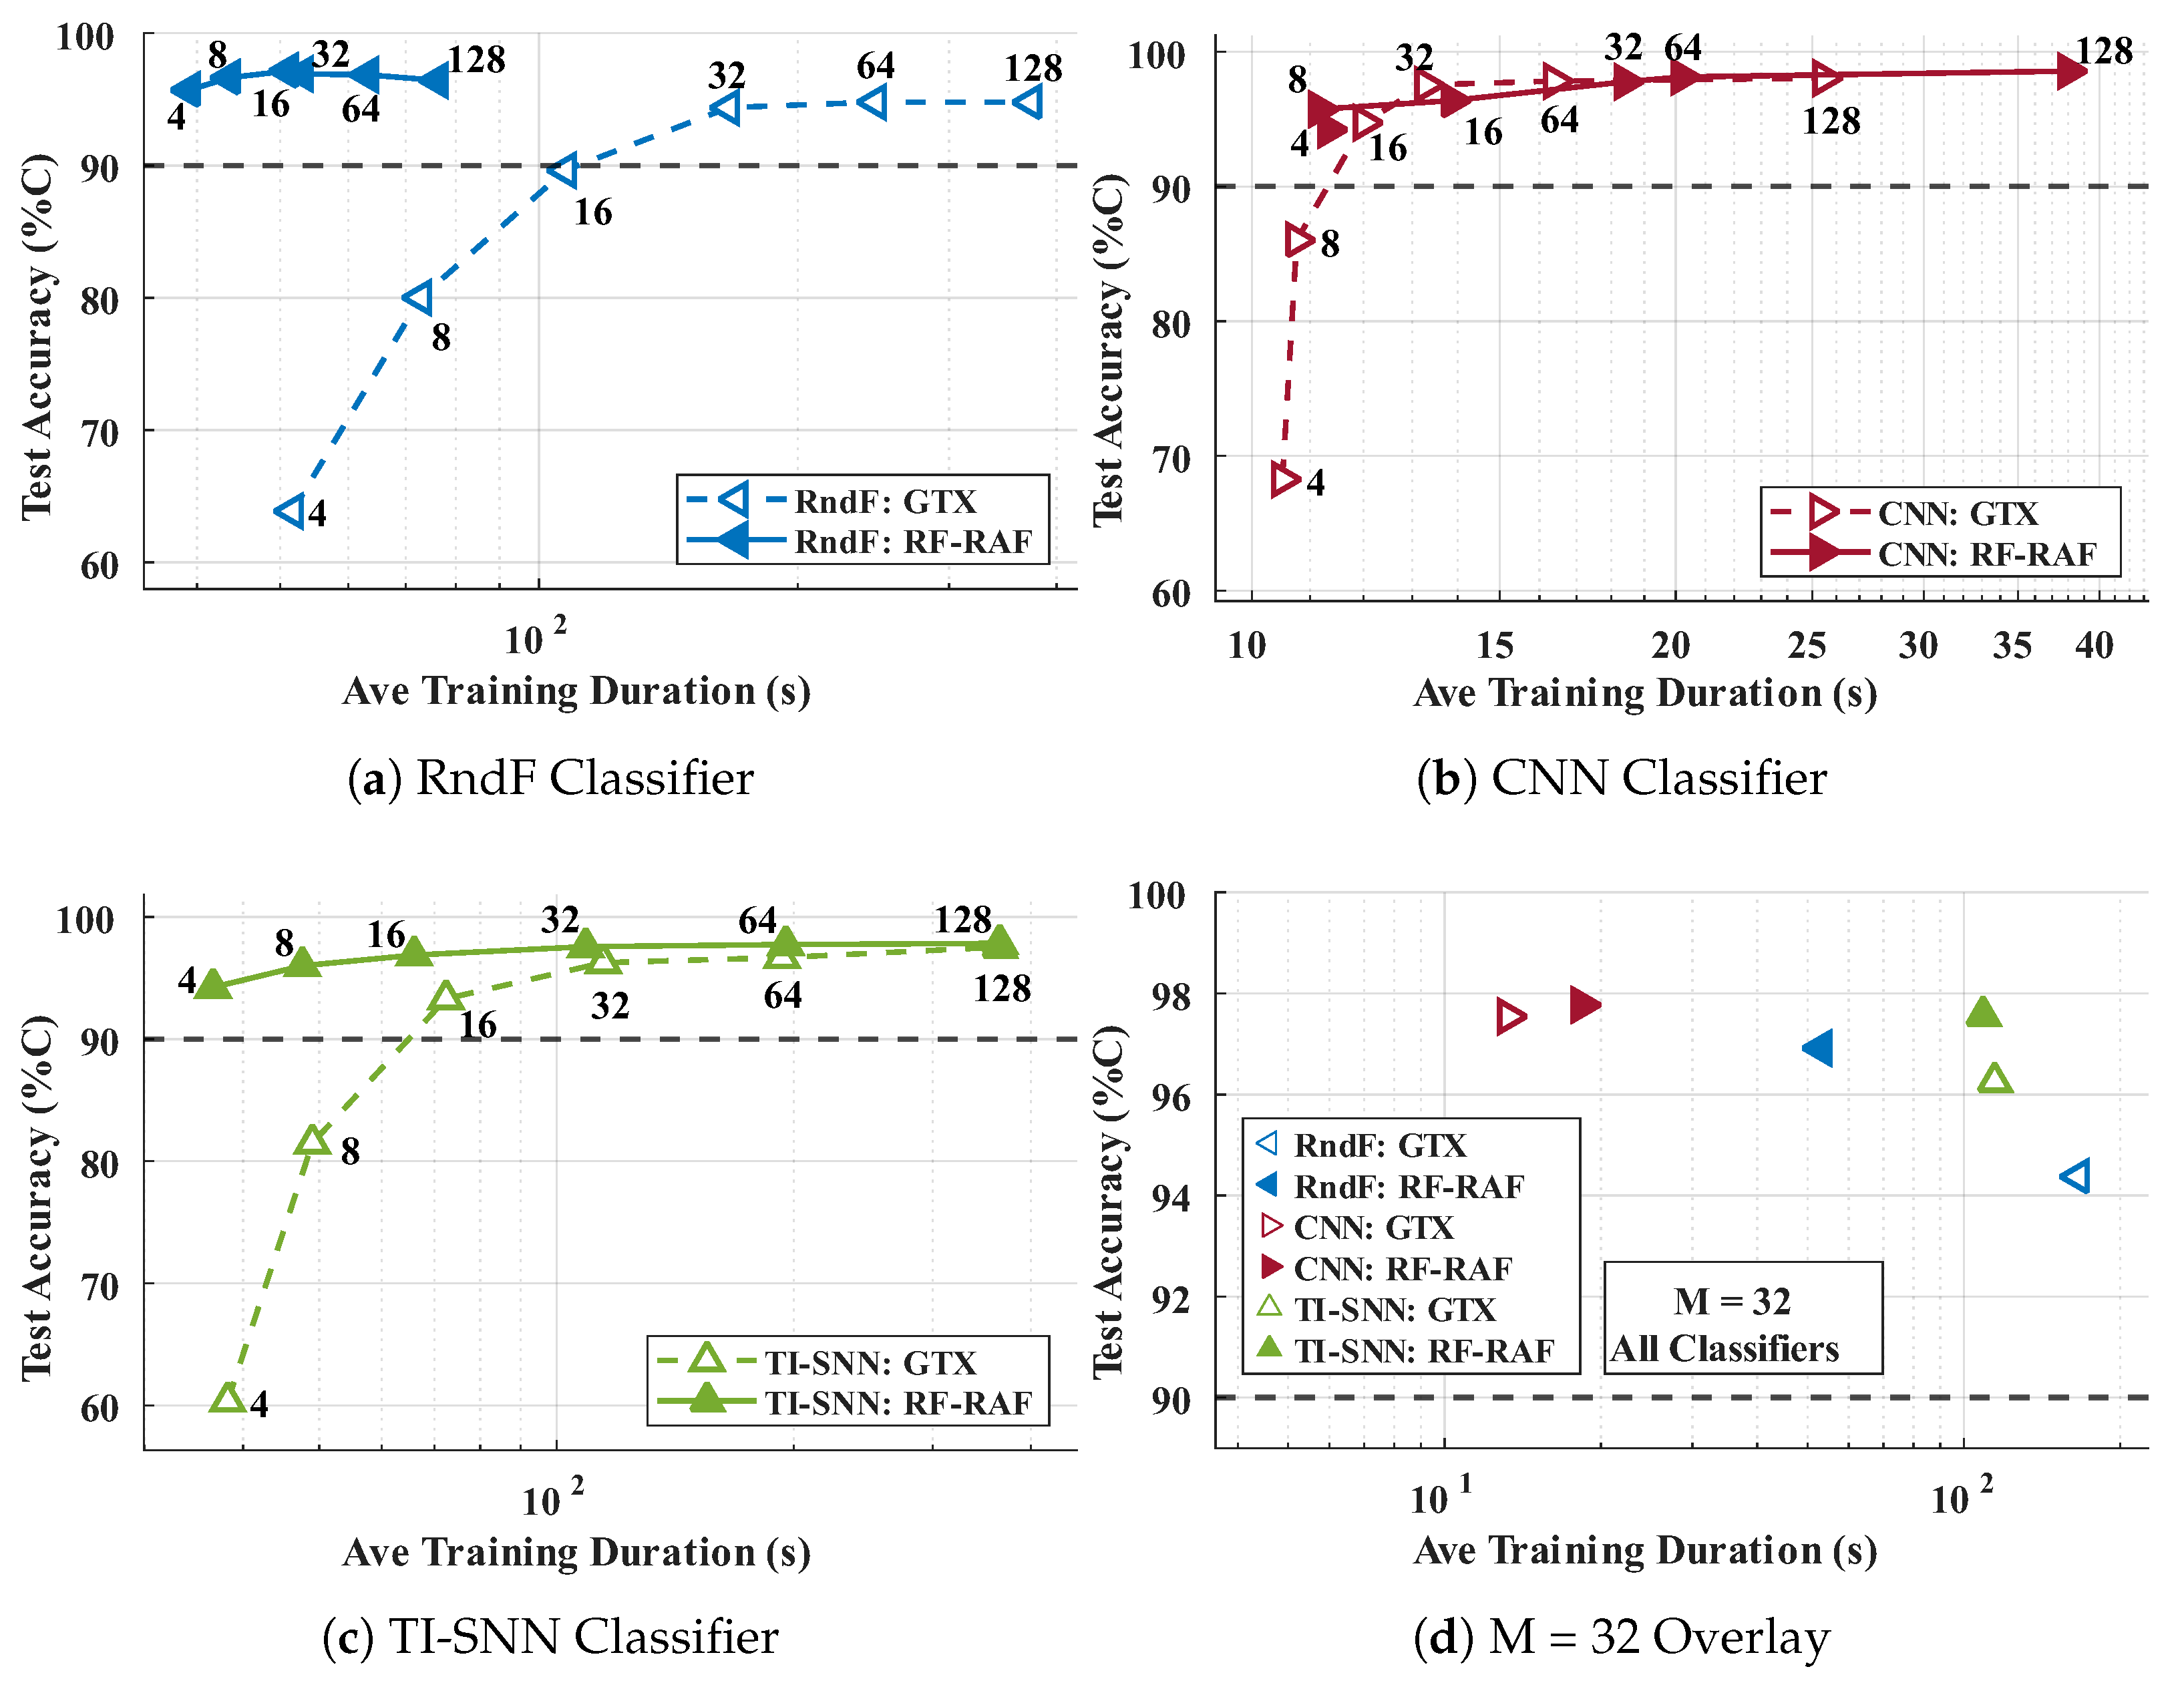
While spike efficiency captures representational compactness, training time reflects the computational cost required to learn from each representation. Figure 7 presents classification accuracy, % C , as a function of the average wall-clock training duration, T T r n . Rather than comparing the training duration only at fixed fingerprint sizes, this view illustrates the training cost required to reach a desired accuracy level. The results should be interpreted in the context of the common hardware and software environment used for all experiments, as the absolute training times may differ across implementations.
Across classifiers, a larger fingerprint size generally increases T T r n , and the accuracy gained for the additional T T r n differs by fingerprint type and model architecture. For a given accuracy target, RF-RAF often reaches a comparable or higher % C value at similar or shorter training durations than GTX, most notably for RndF and TI-SNN. This indicates that the RF-RAF representation can provide a more favorable accuracy–training-cost trade space, even when the fixed-M training time comparison is not uniformly lower across all classifiers.
The CNN achieves the shortest absolute training durations across most configurations, but its training-time advantage must be interpreted alongside the achieved accuracy. The TI-SNN incurs a greater training cost as the fingerprint size increases, yet it continues to improve with larger RF-RAF fingerprints, whereas RndF accuracy begins to saturate or degrade beyond moderate fingerprint sizes.
These results indicate that RF-RAF does not uniformly reduce training costs but instead alters the accuracy–training-time trade space, enabling higher-accuracy configurations at practical training durations. Thus, Figure 7 shows that RF-RAF expands the set of high-accuracy configurations available at practical training durations.
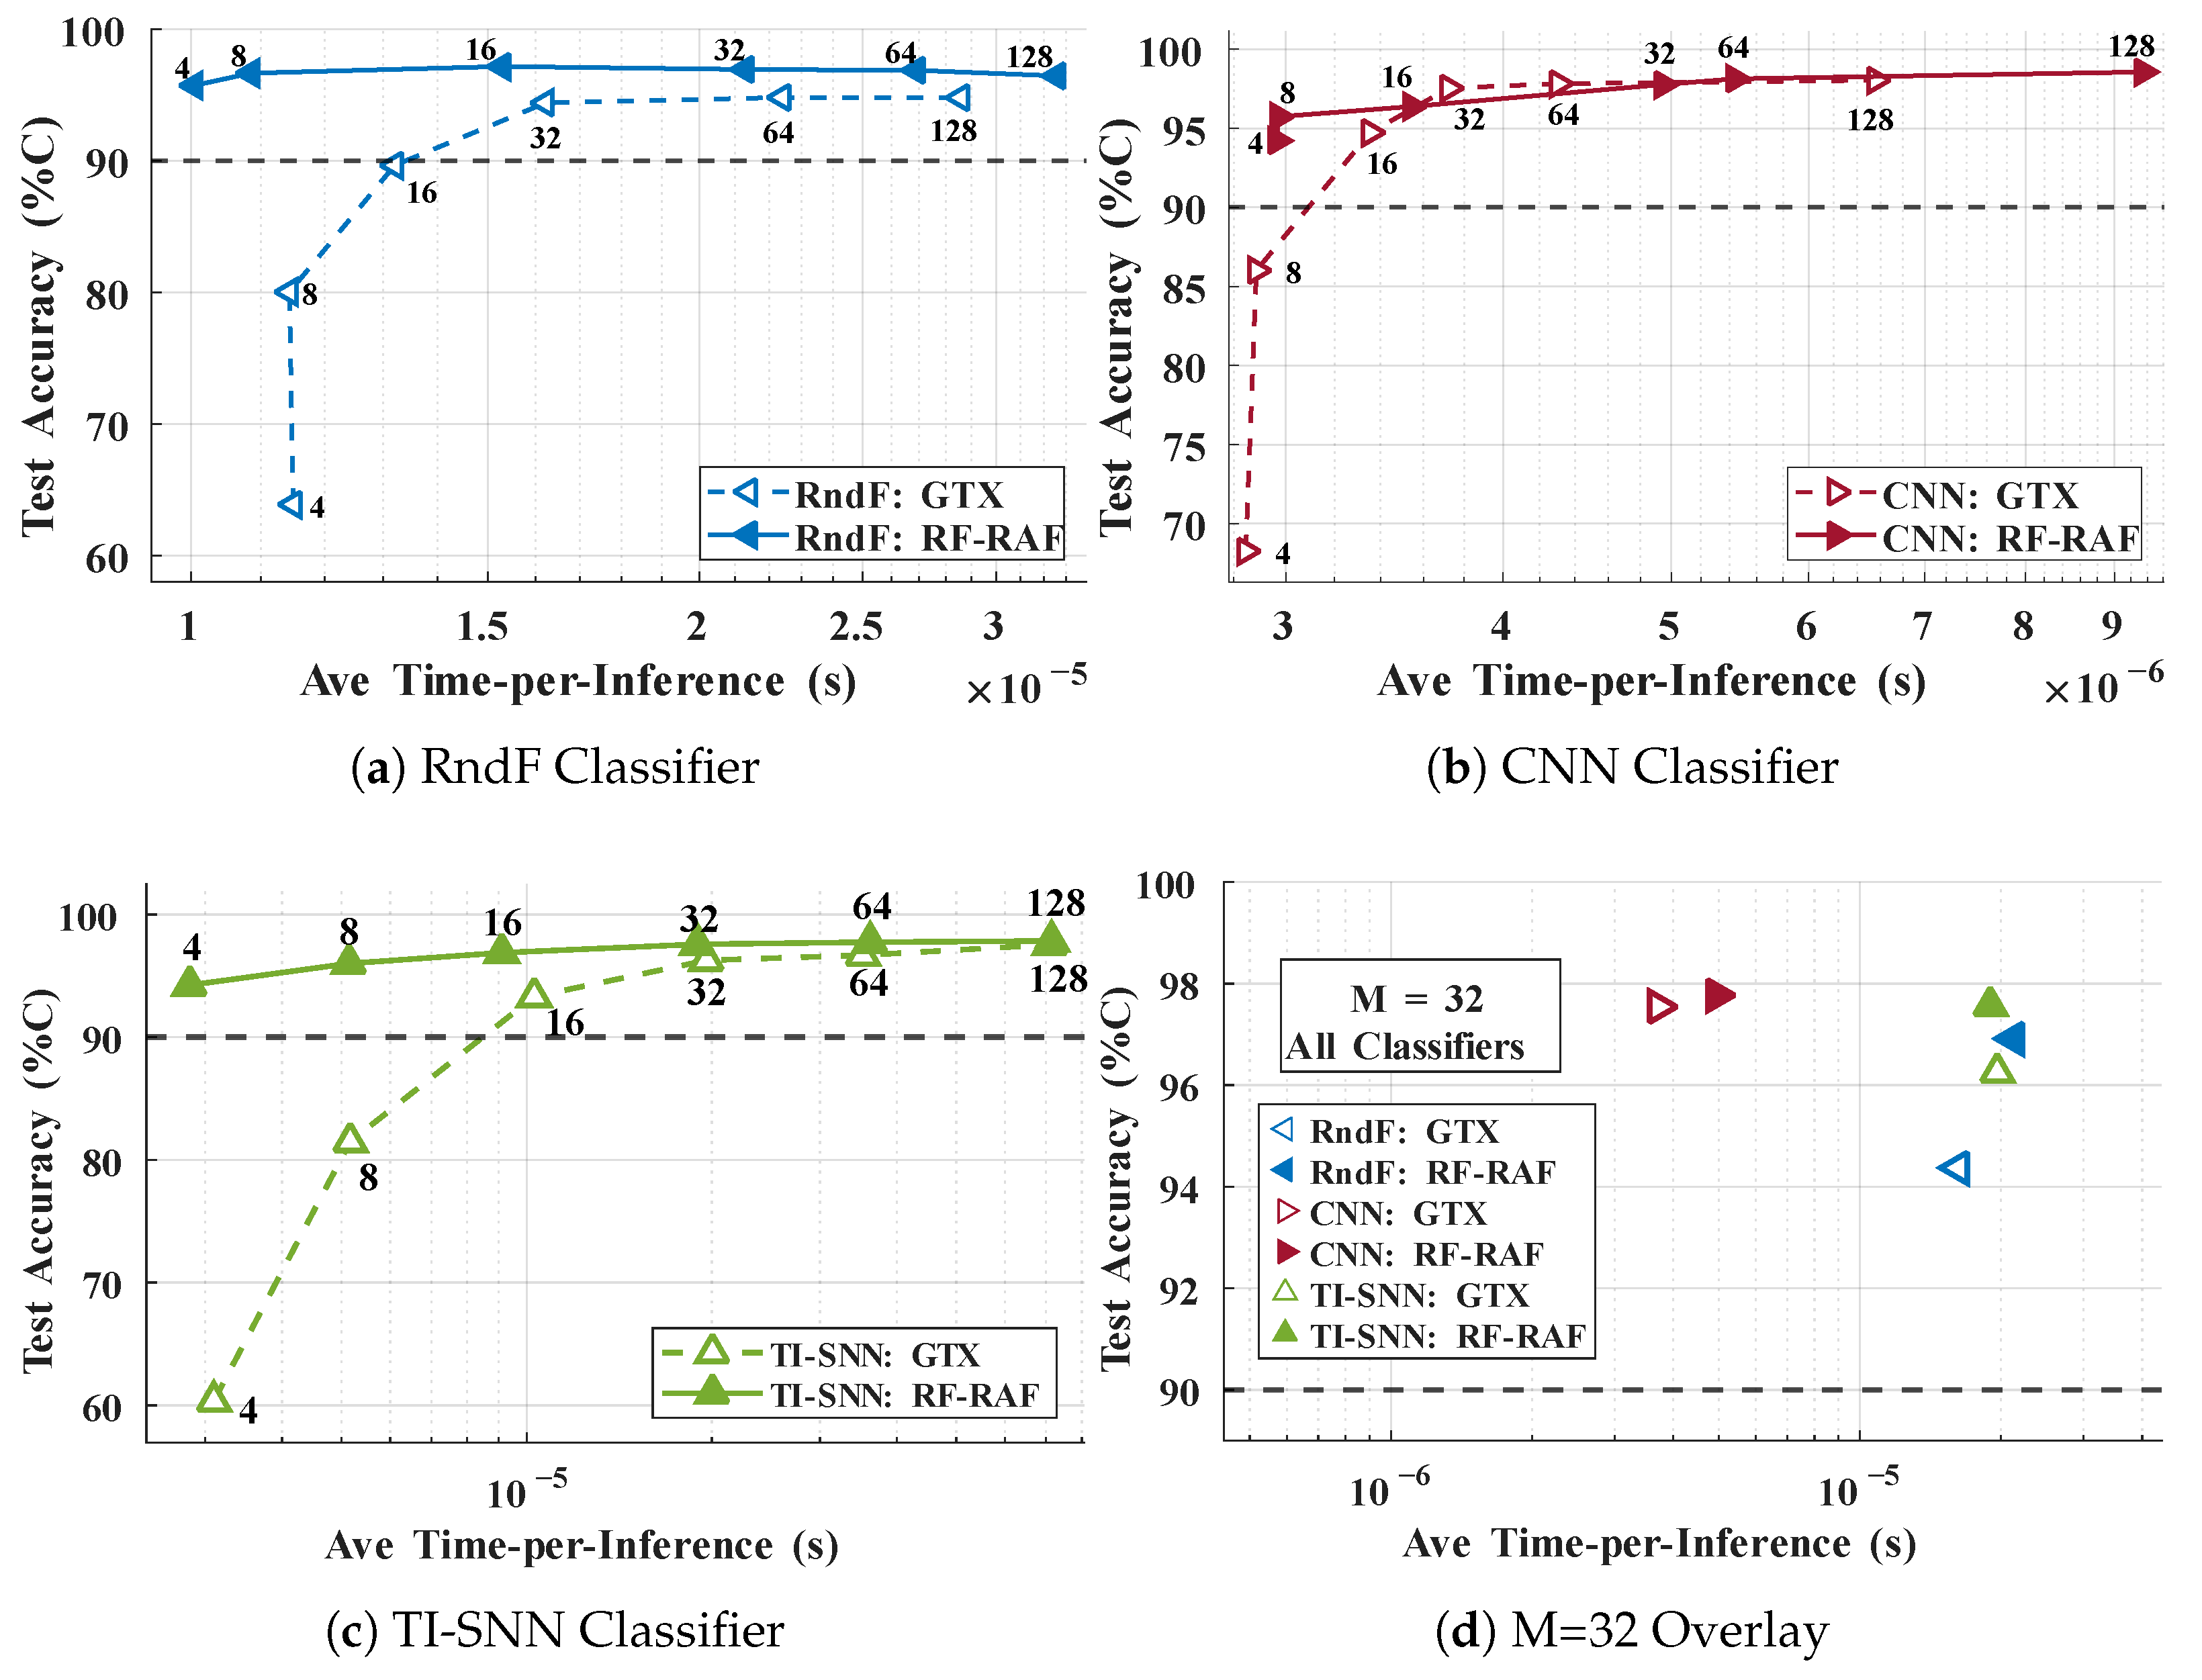
The inference time further evaluates the practical deployment cost of each representation once trained. Figure 8 presents classification accuracy % C as a function of the average inference time T I n f for all classifier and fingerprint combinations. Similar to the training-time analysis, this representation emphasizes the inference cost required to achieve a given accuracy level, rather than comparing performance at fixed fingerprint sizes. All results are based on the common hardware and software environment described in Section 3.3.
Across all classifiers, an increasing fingerprint size improves accuracy at the cost of a longer inference time. However, the efficiency of this tradeoff differs between fingerprinting methods. At comparable accuracy levels, RF-RAF fingerprints generally achieve lower inference cost than GTX fingerprints.
For example, the TI-SNN achieves approximately 95% accuracy using an M = 4 RF-RAF fingerprint with an average inference time on the order of microseconds, whereas a GTX fingerprint requires a larger M (e.g., M = 16 ) and a correspondingly higher inference cost to reach similar accuracy. This indicates that RF-RAF provides a more favorable accuracy–inference-time trade space for neuromorphic classification.
Comparing across classifiers at fixed fingerprint sizes reveals that the TI-SNN achieves accuracy comparable to the CNN with a similar or lower inference time when using RF-RAF fingerprints while significantly outperforming RndF in inference efficiency. These results highlight that the combination of RF-RAF encoding and TI-SNN classification enables rapid and accurate inference in neuromorphic systems. Overall, Figure 8 demonstrates that RF-RAF expands the set of high-accuracy operating points achievable at a low inference cost.

4.2. SNR Variation Analysis

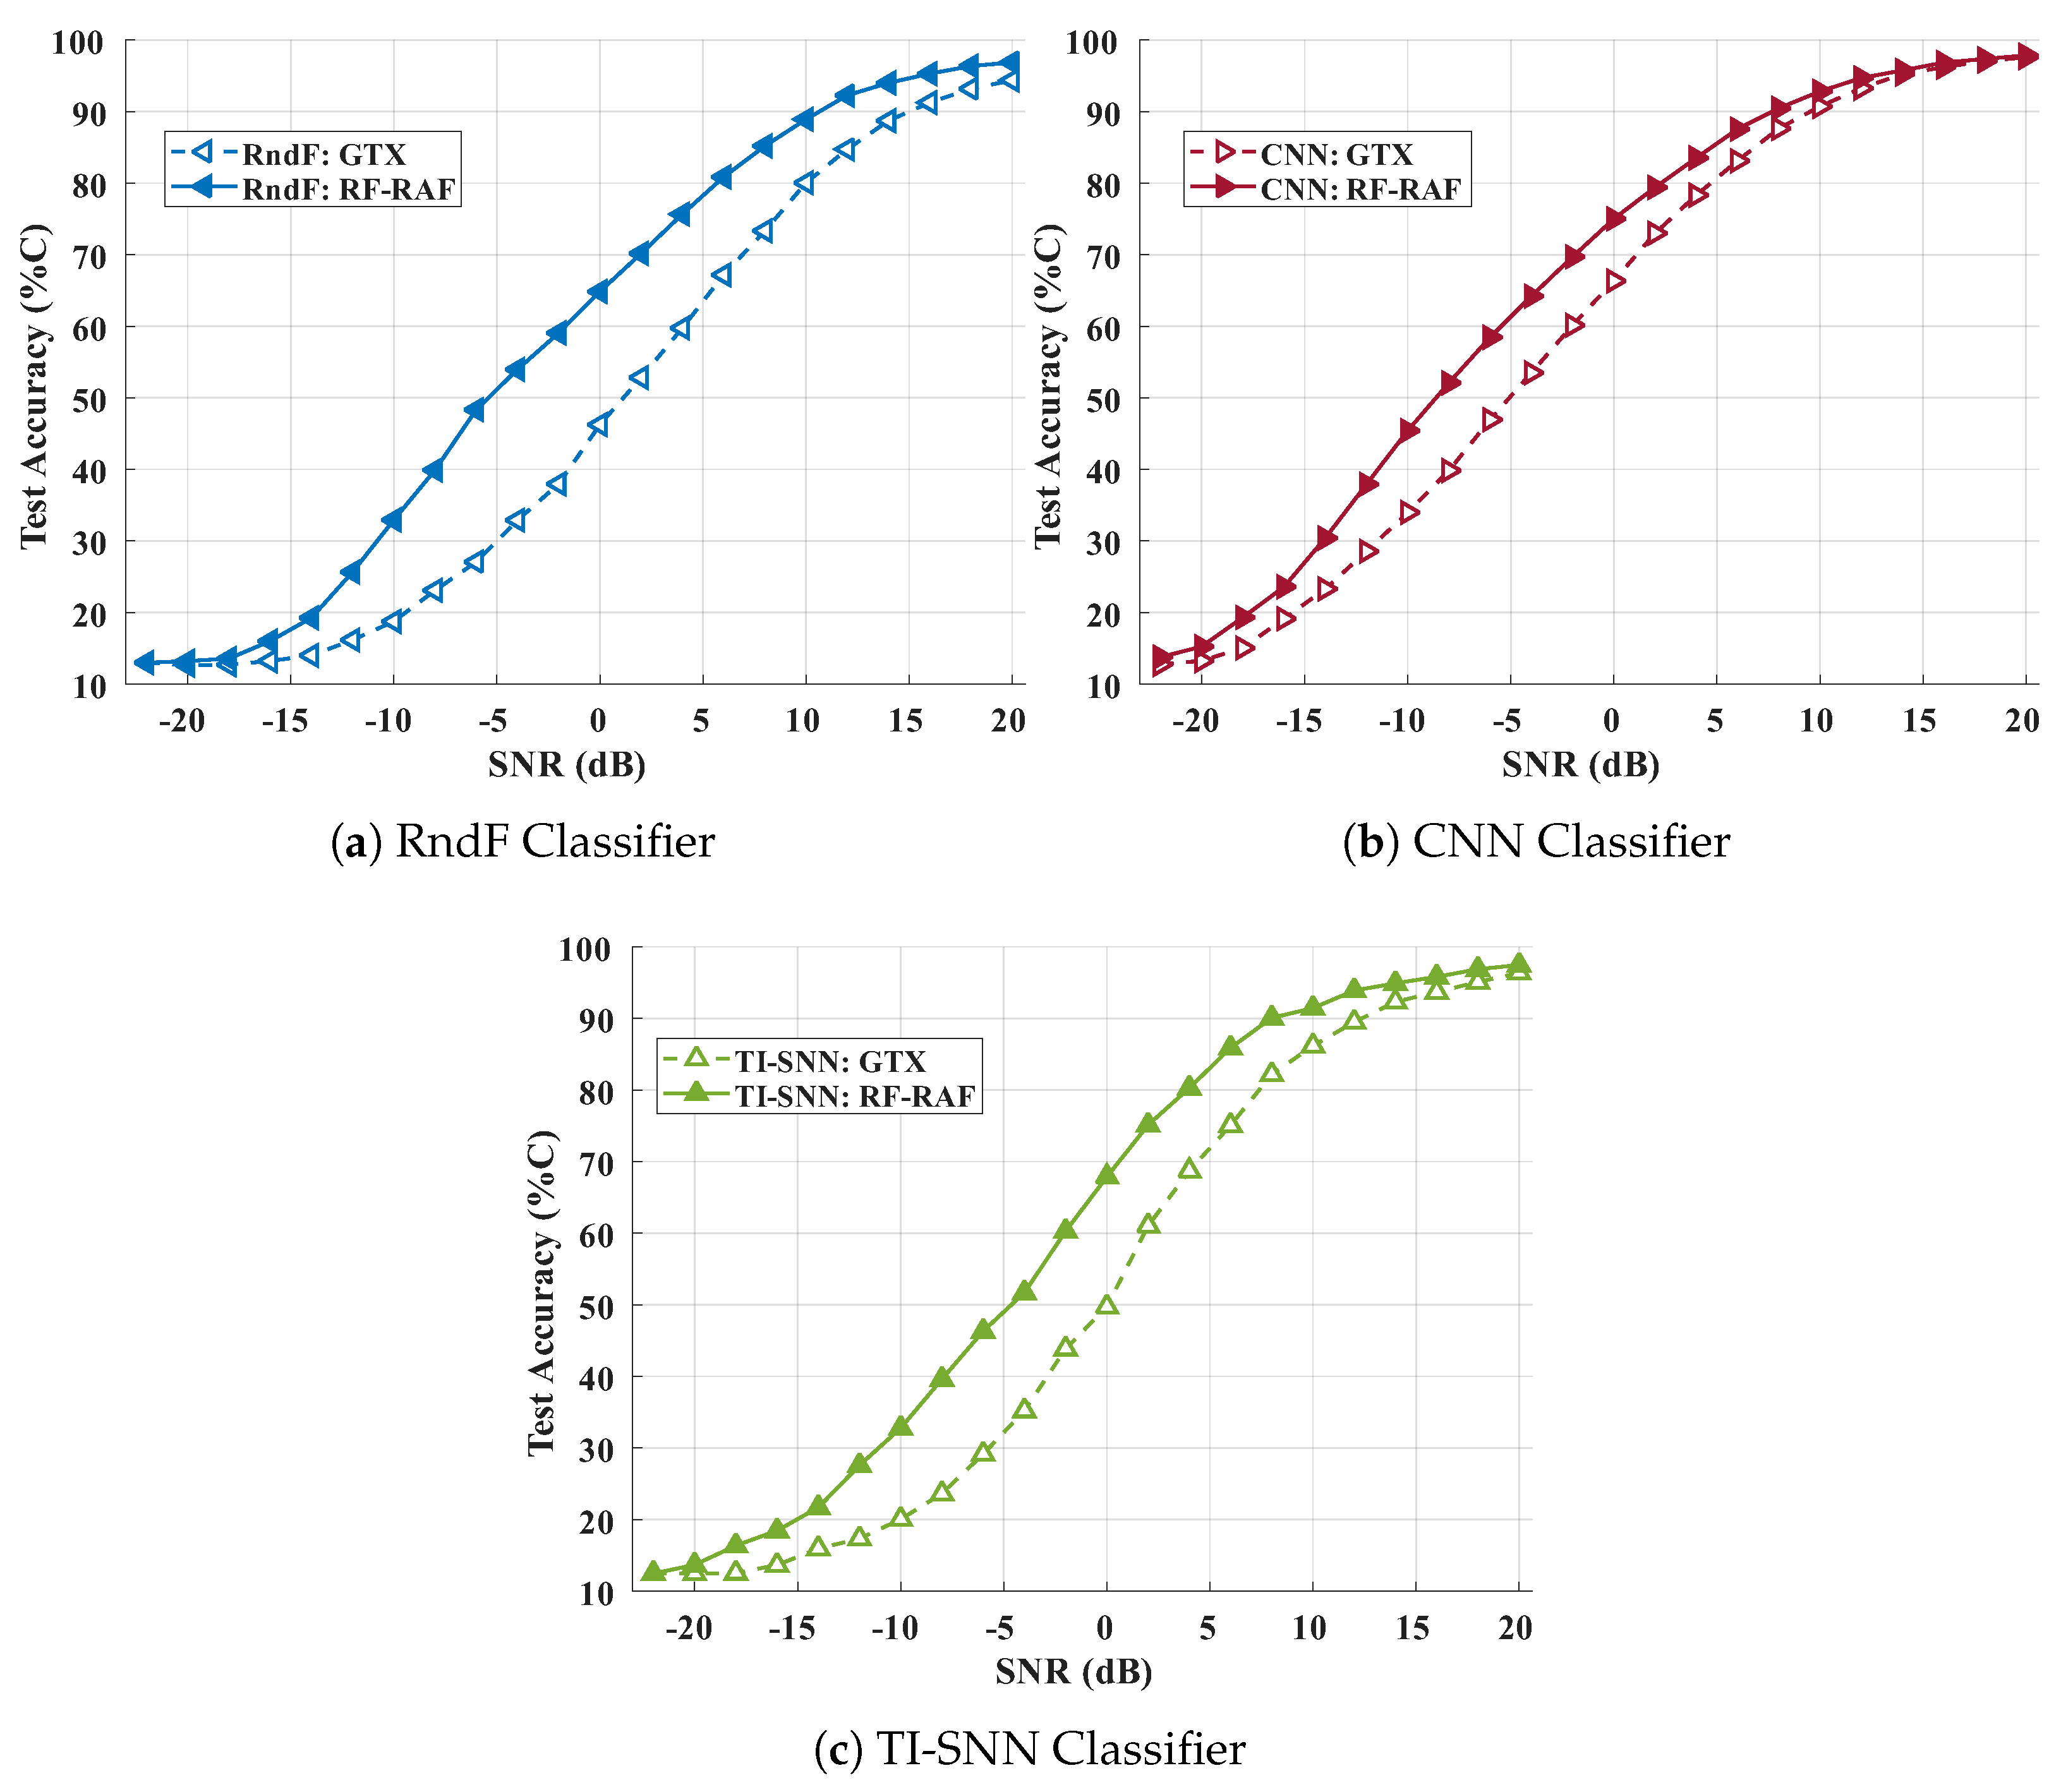
The robustness to channel noise variation was evaluated to determine whether RF-RAF performance advantages persist under degraded channel conditions. Figure 9 presents the classification accuracy, % C , against SNR for all classifier and fingerprint combinations at M = 32 time increments. The results show that the RF-RAF fingerprints consistently outperform the GTX fingerprints across all SNR levels. The performance gap widens as the channel SNR decreases, suggesting that RF-RAF fingerprints exhibit improved robustness to noise under the evaluated conditions. For instance, at SNR = 0 dB, the TI-SNN achieves %C ≈ 67% accuracy with the RF-RAF fingerprints and %C ≈ 50% accuracy with the GTX fingerprints. Alternatively, to achieve the same %C ≈ 67% accuracy as the RF-RAF fingerprints under SNR = 0 dB conditions, the GTX fingerprints require SNR ≈ 4.0 dB conditions. This behavior is advantageous for real-world applications where channel conditions may vary substantially.

4.3. Fingerprint Misclassification Analysis

A fingerprint misclassification analysis was performed to (1) evaluate whether RF-RAF fingerprints improve separability among the most confusable device classes and (2) provide insight into how information representation (fingerprint structure) impacts classification behavior. Table 3 and Table 4 present the confusion matrices for the TI-SNN classifier processing M = 32 time increments of GTX and RF-RAF fingerprints, respectively. The confusion matrices provide insight into cross-device misclassification patterns of the model and show how often fingerprints from each true device class were classified within each predicted device class. The diagonal entries represent correct fingerprint classification, while the off-diagonal entries indicate misclassification.
The classifier test accuracy ( % C ) in Figure 5, Figure 6, Figure 7, Figure 8 and Figure 9 is reported as the overall multi-class classification accuracy, i.e., the average correct percentage across all classes. This represents the fraction of all testing fingerprints that are correctly assigned to the true device class. There is an alternate per-class A C C accuracy metric that can be considered and calculated as [35]
A C C = T P + T N T P + T N + F P + F N   ,
where T P , T N , F P , and F N are the true positive, true negative, false positive and false negative testing outcomes for the device class of interest. These outcomes can also be used to calculate two additional metrics of Precision ( P R C ) and Recall ( R C L ) using [35]
P R C = T P T P + F P ,         R C L = T P T P + F N   .
The results in Table 5 and Table 6 summarize the per-class A C C , P R C , and R C L calculations for each device class using the confusion matrix results in Table 3 (GTX fingerprints) and Table 4 (RF-RAF fingerprints). These metrics provide a more granular view of model performance for each device class and highlight (1) the device-specific accuracy— A C C , (2) how well the model identifies fingerprints from each class— P R C , and (3) how well the model captures and utilizes all relevant samples— R C L .
When considering performance across all devices in Table 5 and Table 6, the RF-RAF fingerprints outperformed GTX fingerprints in aggregate classification performance while preserving the same overall confusion (misclassification) behavior. This is reflected in (1) an average per-device A C C increase from A C C ≈ 99.04 ± 0.02% for GTX to A C C ≈ 99.37 ± 0.04% for RF-RAF and (2) average P R C and R C L improvements, including (a) from P R C ≈ 96.16 ± 0.07% for GTX to P R C ≈ 97.48 ± 0.16% for RF-RAF and (b) from P R C ≈ 96.16 ± 0.07% for GTX to P R C ≈ 97.47 ± 0.17%.
For both GTX and RF-RAF fingerprint representations, the largest misclassification errors were concentrated among devices D5, D6, and D8 indicating that these devices are intrinsically harder to discriminate. However, most notable is the observation that RF-RAF fingerprints reduced severity of these dominant confusions. This included RF-RAF fingerprints decreasing misclassification of (1) D8 to D6 from 4.22% to 2.95%, (2) D6 to D8 from 3.74% to 1.53%, and (3) D6 to D5 from 3.48% to 2.66%. The most difficult class discrimination for both fingerprint types was device D6. However, the D6 recall improved substantially from R C L ≈ 90.21 ± 0.31% with GTX fingerprints to R C L ≈ 94.56 ± 0.61% with RF-RAF fingerprints. Collectively, these results indicate that RF-RAF fingerprints possess more discriminable information than GTX fingerprints, and the greatest benefit appears across the most confusable devices.

5. Summary and Conclusions

An alternative Radio Frequency Fingerprinting (RFF) method is demonstrated using neuromorphic-friendly Radio Frequency Resonate and Fire (RF-RAF) neurons to generate fingerprints for Wireless Highway Addressable Remote Transducer (WirelessHART) devices. Performance of RF-RAF-generated fingerprints is evaluated against established Gabor Transform (GTX) baseline fingerprints using Random Forest (RndF), Convolutional Neural Network (CNN), and Time-Incremented Spiking Neural Network (TI-SNN) classifiers. Results for multiple fingerprint sizes and varying channel Signal-to-Noise Ratio (SNR) conditions show that RF-RAF neurons provide an efficient neuromorphic-native encoding pathway for device RFF discrimination and offer improved accuracy–efficiency tradeoffs in training and inference for various classifier architectures.
The results show that RF-RAF fingerprints consistently outperform GTX fingerprints across all evaluated classifiers and fingerprint sizes. The largest performance gains occur for lower GTX M values that limit the time-span of burst samples used to generate fingerprints—a result of satisfying the required GTX parameter constraints that limit the effective use of all available burst samples. The RF-RAF improvement persists under time-span-matched conditions, and it is shown that gains are not solely attributable to differences in input data utilization. For the TI-SNN classifier, the RF-RAF fingerprints achieve an arbitrary %C = 90% benchmark for M = 4 and approximately 100 spikes per inference. For the GTX classifier, 4× larger GTX fingerprints (M = 16) and approximately 1000 spikes per inference (10× increase in wall-clock time) are required to achieve the same %C = 90% benchmark.
The observed GTX versus RF-RAF fingerprint performance differences are not surprising, given the structural property consistencies of RF-RAF encoding and TI-SNN classification. Unlike GTX fingerprint generation, which uses a fixed linear transform, RF-RAF fingerprints are generated using neurons that operate as adaptive frequency-selective filters with nonlinear thresholding. The RF-RAF β and γ parameters jointly regulate spectral selectivity that effectively emphasizes discriminative transient features while suppressing noise effects. The spectral selectivity produces relatively sparse event-driven encoding that is more readily distinguishable using both conventional and neuromorphic classifiers. This is evident in the results here that show that RF-RAF fingerprinting benefits are not limited to neuromorphic systems and are obtainable to some degree across various classifiers.
As a first work using neuron-derived RF-RAF fingerprints in an RFF application, the results here are sufficiently promising to motivate taking the next demonstration step. The work here was limited to discriminating between eight between WirelessHART devices operating under the WirelessHART physical layer protocol—multi-channel frequency, multi-user Direct Sequence Spread Spectrum (DSSS) encoding, Offset Quadrature Phase-Shift Keying (O-QPSK) data modulation, etc. [28]. Interest remains in considering an increased number of devices and/or alternate devices operating under a different physical layer protocol. There is near-term interest in devices using the Orthogonal Frequency Division Multiplexing (OFDM) protocol in existing 5G and emerging 6G systems [36]—the spectral diversity of OFDM and frequency-selective nature of RF-RAF processing are believed to be very complementary, and integration remains an area of future work.

Author Contributions

Conceptualization, D.L.W. and M.A.T.; data curation, M.A.T.; formal analysis, D.L.W., M.A.T. and B.J.B.; investigation, D.L.W.; methodology, D.L.W., M.A.T. and B.J.B.; project administration, M.A.T.; resources, M.A.T.; supervision, M.A.T.; graphic visualization, D.L.W. and M.A.T.; writing—original draft, D.L.W.; writing—review and editing, D.L.W., M.A.T. and B.J.B. All authors have read and agreed to the published version of the manuscript.

Funding

This research was funded in part by support funding received from the Spectrum Warfare Division, Sensors Directorate, U.S. Air Force Research Laboratory, Wright-Patterson AFB, Dayton, OH, during U.S. Government Fiscal Years 2023–2026.

Data Availability Statement

The experimentally collected WirelessHART data and fingerprint processing code used to obtain the results were not approved for public release at the time of paper submission. Requests for the release of the experimental data and processing code to a third party should be directed to the corresponding author. Data and code distribution to a third party will be made on a request-by-request basis and are subject to public affairs approval.

Acknowledgments

The views expressed are those of the authors and do not reflect the official guidance or position of the United States Government, the Department of Defense, the United States Air Force or the United States Space Force. This paper is approved for public release, Case Number 88ABW-2026-0199.

Conflicts of Interest

The authors declare no conflicts of interest. The funders had no role in the design of the study; in the collection, analyses, or interpretation of data; in the writing of the manuscript, or in the decision to publish the results.

Abbreviations

The following abbreviations are used in this manuscript:
1DOne-Dimensional
2DTwo-Dimensional
ACCPer-class Accuracy
BRAFBalanced Resonate and Fire
CIConfidence Interval
CNNConvolutional Neural Network
CUDACompute Unified Device Architecture
DNADistinct Native Attribute
FFTFast Fourier Transform
FNFalse Negative
FPFalse Positive
FPGAField-Programmable Gate Array
GPUGraphics Processing Unit
GTXGabor Transform
IoTInternet of Things
I/QIn-phase and Quadrature
LIFLeaky Integrate-and-Fire
MSpSMega Samples per Second
OFDMOrthogonal Frequency Division Multiplexing
O-QPSKOffset Quadrature Phase-Shift Keying
PRCPrecision
RAFResonate and Fire
RCLRecall
RFRadio Frequency
RFFRadio Frequency Fingerprinting
RF-RAFRadio Frequency Resonate and Fire
RndFRandom Forest
ROIRegion of Interest
SDRSoftware Defined Radio
SNNSpiking Neural Network
SNRSignal-to-Noise Ratio
SWaPSize, Weight, and Power
TI-SNNTime-Incremented Spiking Neural Network
TNTrue Negative
TPTrue Positive
TPETree-structured Parzen Estimator
TSCHTime-Slotted Channel Hopping
WirelessHARTWireless Highway Addressable Remote Transducer

References

  1. Gallego, G.; Delbrück, T.; Orchard, G.; Bartolozzi, C.; Taba, B.; Censi, A.; Leutenegger, S.; Davison, A.J.; Conradt, J.; Daniilidis, K.; et al. Event-Based Vision: A Survey. IEEE Trans. Pattern Anal. Mach. Intell. 2022, 44, 154–180. [Google Scholar] [CrossRef]
  2. Smith, M.J.; Temple, M.A.; Dean, J.W. Effects of RF Signal Eventization Encoding on Device Classification Performance. Electronics 2024, 13, 2020. [Google Scholar] [CrossRef]
  3. Weathers, D.L.; Temple, M.A.; Borghetti, B.J. An Event-Based Time-Incremented SNN Architecture Supporting Energy-Efficient Device Classification. Electronics 2025, 14, 3712. [Google Scholar] [CrossRef]
  4. Izhikevich, E.M. Resonate-and-fire neurons. Neural Netw. 2001, 14, 883–894. [Google Scholar] [CrossRef]
  5. Higuchi, S.; Kairat, S.; Bohté, S.M.; Otte, S. Balanced resonate-and-fire neurons. In Proceedings of the 41st International Conference on Machine Learning, Vienna, Austria, 21–27 July 2024. [Google Scholar]
  6. Weathers, D.L.; Temple, M.A.; Oliver, R. Radio Frequency Resonate and Fire (RF-RAF) Neurons. In Proceedings of the International Conference on Neuromorphic Systems (ICONS ’26), Chicago, IL, USA, 4–6 August 2026. [Google Scholar]
  7. Xie, L.; Peng, L.; Zhang, J.; Hu, A. Radio Frequency Fingerprint Identification for Internet of Things: A Survey. Secur. Saf. 2024, 3, 2023022. [Google Scholar] [CrossRef]
  8. IEC 62591:2016; Industrial Networks—Wireless Communications Network and Communication Profiles—WirelessHART™. IEC: Geneva, Switzerland, 2016. Available online: https://webstore.iec.ch/en/publication/24433 (accessed on 7 April 2026).
  9. Raptis, T.; Passarella, A.; Conti, M. A Survey on Industrial Internet With ISA100 Wireless. IEEE Access 2020, 8, 157177–157196. [Google Scholar] [CrossRef]
  10. ANSI/ISA-100a-2011; Wireless Systems for Industrial Automation: Process Control and Related Applications. ISA: Geneva, Switzerland, 2011. Available online: https://www.isa.org/standards-and-publications/isa-standards/isa-100-standards (accessed on 7 April 2026).
  11. Devan, P.; Hussin, F.; Ibrahim, R.; Bingi, K.; Khanday, F. A Survey on the Application of WirelessHART for Industrial Process Monitoring and Control. Sensors 2021, 21, 4951. [Google Scholar] [CrossRef]
  12. Petersen, S.; Carlsen, S. WirelessHART Versus ISA100.11a: The Format War Hits the Factory Floor. IEEE Ind. Electron. Mag. 2011, 5, 23–34. [Google Scholar] [CrossRef]
  13. IEEE Standard 802.15.4-2006; IEEE Standard for Information Technology—Telecommunications and Information Exchange Between Systems—Local and Metropolitan Area Networks—Specific Requirements—Part 15.4: Wireless Medium Access Control (MAC) and Physical Layer (PHY) Specifications for Low-Rate Wireless Personal Area Networks (LR-WPANs). IEEE: New York, NY, USA, 2006.
  14. Soltanieh, N.; Norouzi, Y.; Yang, Y.; Karmakar, N.C. A Review of Radio Frequency Fingerprinting Techniques. IEEE J. Radio Freq. Identif. 2020, 4, 222–233. [Google Scholar] [CrossRef]
  15. Jagannath, A.; Jagannath, J.; Kumar, P. A Comprehensive Survey on Radio Frequency (RF) Fingerprinting: Traditional Approaches, Deep Learning, and Open Challenges. Comput. Netw. 2022, 219, 109455. [Google Scholar] [CrossRef]
  16. Abbas, S.; Talib, M.; Nasir, Q.; Idhis, S.; Alaboudi, M.; Mohamed, A. Radio Frequency Fingerprinting Techniques for Device Identification: A Survey. Int. J. Inf. Secur. 2024, 23, 1389–1427. [Google Scholar] [CrossRef]
  17. Reising, D.; Temple, M.; Jackson, J. Authorized and Rogue Device Discrimination Using Dimensionally Reduced RF-DNA Fingerprints. IEEE Trans. Inf. Forensics Secur. 2015, 10, 1180–1192. [Google Scholar] [CrossRef]
  18. Hessman, R.; Rondeau, C.; Temple, M. Introduction of Gabor Transform Features for an Internet of Things Security Paradigm. In Proceedings of the 59th Hawaii International Conference on System Sciences (HICSS), Maui, HI, USA, 6–9 January 2026; Available online: https://hdl.handle.net/10125/112254 (accessed on 7 April 2026).
  19. Rathinaraj, J.; McKinley, G. Gaborheometry: Applications of the Discrete Gabor Transform for Time Resolved Oscillatory Rheometry. J. Rheol. 2023, 67, 479. [Google Scholar] [CrossRef]
  20. Erwin; Karo, N.N.B.; Sari, A.Y.; Aziza, N.; Putra, H.K. The Enhancement of Fingerprint Images using Gabor Filter. J. Phys. Conf. Ser. 2019, 1196, 012045. [Google Scholar] [CrossRef]
  21. Ahily, J.S.; Al Dujaili, H.; Jawad, M.; Al Dulaimi, M.A. Automatic Human Identification Using Fingerprint Images Based on Gabor Filter and SIFT Features Fusion. Open Eng. 2024, 14, 20240020. [Google Scholar] [CrossRef]
  22. Bourkache, N.; Laghrouch, M.; Sidhom, S. Gabor Filter Algorithm for Medical Image Processing: Evolution in Big Data Context. In Proceedings of the 2020 International Multi-Conference on Organization of Knowledge and Advanced Technologies (OCTA), Tunis, Tunisia, 6–8 February 2020. [Google Scholar] [CrossRef]
  23. Deivasigamani, S.; Senthilpari, C.; Siva Sundhara Raja, D.; Thankaraj, A.; Narmadha, G.; Gowrishankar, K. Gabor Transform-Based Deep Learning System Using CNN for Melanoma Detection. Computers 2026, 15, 54. [Google Scholar] [CrossRef]
  24. Taha, M.; Fadul, M.; Tyler, J.; Reising, D.R.; Loveless, T.D. Enhancing Internet of Things Security Using Entropy-Informed RF-DNA Fingerprint Learning from Gabor-Based Images. EURASIP J. Inf. Secur. 2024, 2024, 27. [Google Scholar] [CrossRef]
  25. Tyler, J.; Fadul, M.; Hilling, M.; Reising, D.R.; Loveless, T.D. Assessing Adversarial Replay and Deep Learning-Driven Attacks on Specific Emitter Identification-Based Security Approaches. Discov. Internet Things 2024, 4, 25. [Google Scholar] [CrossRef]
  26. Rondeau, C.M.; Temple, M.A.; Kabban, C.S. DNA Feature Selection for Discriminating WirelessHART IIoT Devices. In Proceedings of the Annual Hawaii International Conference on System Sciences, Maui, HI, USA, 7–10 January 2020; pp. 6387–6396. [Google Scholar] [CrossRef]
  27. Maier, M.J.; Hayden, H.S.; Temple, M.A.; Fickus, M.C. Ensuring the Longevity of WirelessHART Devices in Industrial Automation and Control Systems using Distinct Native Attribute Fingerprinting. Int. J. Crit. Infrastruct. Prot. 2023, 43, 100641. [Google Scholar] [CrossRef]
  28. HART Communication Foundation. Co-Existence of WirelessHART with Other Wireless Technologies. Tech Note HCF_LIT-122, Rev. 1.0. 2010. Available online: https://www.emerson.com/documents/automation/white-paper-co-existence-of-wirelesshart-other-wireless-technologies-by-hcf-en-42582.pdf (accessed on 7 April 2026).
  29. Ettus. USRP X300 and X300 X Series. Specification Sheet. 2024. Available online: https://www.ettus.com/wp-content/uploads/2024/01/X300_X310_Spec_Sheet_2024-01-23.pdf (accessed on 7 April 2026).
  30. Akiba, T.; Sano, S.; Yanase, T.; Ohta, T.; Koyama, M. Optuna: A Next-generation Hyperparameter Optimization Framework. arXiv 2019, arXiv:1907.10902. [Google Scholar] [CrossRef]
  31. Esser, S.K.; Merolla, P.A.; Arthur, J.V.; Cassidy, A.S.; Appuswamy, R.; Andreopoulos, A.; Berg, D.J.; McKinstry, J.L.; Melano, T.; Barch, D.R.; et al. Convolutional Networks for Fast, Energy-Efficient Neuromorphic Computing. Proc. Natl. Acad. Sci. USA 2016, 113, 11441–11446. [Google Scholar] [CrossRef] [PubMed]
  32. Park, H.; Leemis, L.M. Ensemble confidence intervals for binomial proportions. Stat. Med. 2019, 38, 3460–3475. [Google Scholar] [CrossRef]
  33. Eshraghian, J.K.; Ward, M.; Neftci, E.O.; Wang, X.; Lenz, G.; Dwivedi, G.; Bennamoun, M.; Jeong, D.S.; Lu, W.D. Training Spiking Neural Networks Using Lessons from Deep Learning. Proc. IEEE 2023, 111, 1016–1054. [Google Scholar] [CrossRef]
  34. Paszke, A.; Gross, S.; Massa, F.; Lerer, A.; Chanan, G.; Killeen, T.; Lin, Z.; Gimelshein, N.; Antiga, L.; Desmaison, A.; et al. PyTorch: An Imperative Style, High-Performance Deep Learning Library. Adv. Neural Inf. Process. Syst. 2019, 32, 1–12. [Google Scholar] [CrossRef]
  35. Tharwat, A. Classification Assessment Methods. Appl. Comput. Inform. 2021, 17, 168–192. [Google Scholar] [CrossRef]
  36. Choi, K. Waveform Design for 5G and Beyond. Electronics 2021, 10, 2124. [Google Scholar] [CrossRef]
Figure 1. Overview of the RF Fingerprinting (RFF) pipelines showing traditional RFF methods (top) and the envisioned neuromorphic-centric RF Event Radio approach (bottom).
Electronics 15 02023 g001
Figure 2. Neuron Bank architecture for spectral encoding [6]. An exemplary complex-valued input signal, consisting of in-phase (I, blue solid) and quadrature (Q, orange dashed) components, is processed by a bank of RF-RAF neurons, each tuned to a specific resonant frequency. Colored arrows illustrate distribution of the I/Q signal components to each neuron in the bank. The neurons generate sparse spiking outputs that encode the frequency content of the input signal, forming the basis for event-based fingerprinting. Green spikes denote responses from neurons tuned to the input frequency ( f k = f In ), while red spikes denote responses from off-resonance neurons ( f k f In ).
Electronics 15 02023 g002
Figure 3. In-phase (top) and quadrature (bottom) components of a representative WirelessHART burst. Plots show background noise, followed by the preamble response region. Both GTX and RF-RAF fingerprints are generated from the preamble region.
Electronics 15 02023 g003
Figure 4. (a) A GTX fingerprint ( F G T X ) , (b) RF-RAF output before binning for the same WirelessHART signal burst, (c) corresponding RF-RAF fingerprint ( F R F - R A F ) .
Electronics 15 02023 g004
Figure 5. Accuracy vs. number of time increments (M) for all classifiers. Span-matched ROI markers (•) denote RF-RAF fingerprints computed using the same effective time-domain support as GTX. For M     16 , GTX and RF-RAF spans capture the entire preamble burst; for M = 4, 8, RF-RAF (•) is span-constrained to match the limited GTX support.
Electronics 15 02023 g005
Figure 6. Accuracy versus average spike count per inference with numeric labels indicating the number of time increments (M); the spike count increases monotonically with M.
Electronics 15 02023 g006
Figure 7. Accuracy vs. training duration (wall-clock time) for all classifiers with numeric labels indicating the number of time increments (M).
Electronics 15 02023 g007
Figure 8. Accuracy vs. time per inference (wall-clock time) for all classifiers, with numeric labels indicating the number of time increments (M). (d) All classifiers at M = 32 time increments.
Electronics 15 02023 g008
Figure 9. Accuracy vs. SNR for all classifiers at M = 32 time increments.
Electronics 15 02023 g009
Table 1. F G T X fingerprint generation parameters.
MKNGTMNGTKNΔNBTDtStartfRange (MHz)fΔ (kHz)
12864150758120150 ± 2.13 133
6464757516120150 ± 2.13 133
3264377432118566 ± 2.16 135
1664247550120051 ± 2.13 133
86497550450801 ± 2.13 133
464674372221029 ± 2.16 135
Table 2. F R F - R A F fingerprint generation parameters. The final two rows correspond to the time-span-matched fingerprint sizes used for comparison against the GTX fingerprints.
MKNΔNBTDtStartfRange (MHz)fΔ (kHz)
1286481024227±1.2536.8
6464161024227±1.2536.8
3264321024227±1.2536.8
1664641024227±1.2536.8
8641281024227±1.2536.8
4642561024227±1.2536.8
86456448803±1.2536.8
464562241027±1.2536.8
Table 3. Confusion matrix (mean ± 95% CI) for GTX fingerprints at SNR = 20 dB. Bold diagonal entries indicate the correct classification rate for each device class.
Inferred Device
D1D2D3D4D5D6D7D8
True
Dev
D199.14 ± 0.100.11 ± 0.020.34 ± 0.050.00 ± 0.000.00 ± 0.000.12 ± 0.040.00 ± 0.000.29 ± 0.05
D20.07 ± 0.0398.24 ± 0.120.82 ± 0.070.00 ± 0.000.01 ± 0.010.69 ± 0.070.01 ± 0.010.17 ± 0.03
D30.41 ± 0.050.96 ± 0.0897.53 ± 0.150.00 ± 0.000.04 ± 0.020.45 ± 0.060.55 ± 0.070.06 ± 0.03
D40.00 ± 0.000.00 ± 0.000.00 ± 0.0098.84 ± 0.090.40 ± 0.060.01 ± 0.010.73 ± 0.080.02 ± 0.02
D50.00 ± 0.000.01 ± 0.010.01 ± 0.010.86 ± 0.0694.28 ± 0.193.80 ± 0.160.98 ± 0.070.07 ± 0.02
D60.20 ± 0.030.80 ± 0.060.86 ± 0.100.01 ± 0.013.48 ± 0.2490.21 ± 0.310.70 ± 0.083.74 ± 0.14
D70.00 ± 0.000.01 ± 0.011.30 ± 0.101.11 ± 0.111.01 ± 0.090.83 ± 0.0895.74 ± 0.210.01 ± 0.01
D80.28 ± 0.040.22 ± 0.040.00 ± 0.010.00 ± 0.010.00 ± 0.014.22 ± 0.150.00 ± 0.0095.28 ± 0.20
Table 4. Confusion matrix (mean ± 95% CI) for RF-RAF fingerprints at SNR = 20 dB. Bold diagonal entries indicate the correct classification rate for each device class.
Inferred Device
D1D2D3D4D5D6D7D8
True
Dev
D198.97 ± 0.190.21 ± 0.040.33 ± 0.090.00 ± 0.000.00 ± 0.000.12 ± 0.040.00 ± 0.000.37 ± 0.10
D20.14 ± 0.0699.26 ± 0.130.42 ± 0.090.00 ± 0.000.00 ± 0.000.14 ± 0.050.00 ± 0.000.03 ± 0.02
D30.15 ± 0.071.20 ± 0.1798.05 ± 0.280.00 ± 0.000.01 ± 0.010.17 ± 0.130.42 ± 0.090.00 ± 0.00
D40.00 ± 0.000.00 ± 0.000.00 ± 0.0099.43 ± 0.180.10 ± 0.050.00 ± 0.000.45 ± 0.160.03 ± 0.02
D50.00 ± 0.000.00 ± 0.000.02 ± 0.020.21 ± 0.0595.29 ± 0.373.63 ± 0.420.80 ± 0.210.05 ± 0.04
D60.10 ± 0.040.29 ± 0.090.41 ± 0.140.00 ± 0.002.66 ± 0.3394.56 ± 0.610.45 ± 0.131.53 ± 0.30
D70.00 ± 0.000.00 ± 0.000.94 ± 0.070.96 ± 0.400.76 ± 0.200.60 ± 0.1996.72 ± 0.570.02 ± 0.02
D80.41 ± 0.160.10 ± 0.030.01 ± 0.010.03 ± 0.030.03 ± 0.022.95 ± 0.360.00 ± 0.0096.48 ± 0.44
Table 5. Per-device TI-SNN classification performance metrics using GTX fingerprints at S N R = 20 dB. The entries include the mean %C with ±95% confidence intervals.
DeviceACC (%)PRC (%)RCL (%)
D199.77 ± 0.0299.04 ± 0.0699.14 ± 0.10
D299.52 ± 0.0297.91 ± 0.0998.24 ± 0.12
D399.27 ± 0.0396.69 ± 0.1797.53 ± 0.15
D499.61 ± 0.0298.03 ± 0.1198.84 ± 0.09
D598.67 ± 0.0495.03 ± 0.2394.28 ± 0.19
D697.51 ± 0.0589.92 ± 0.2390.21 ± 0.31
D799.10 ± 0.0396.99 ± 0.1095.74 ± 0.21
D898.86 ± 0.0395.63 ± 0.1795.28 ± 0.20
Ave99.04 ± 0.0296.16 ± 0.0796.16 ± 0.07
Table 6. Per-device TI-SNN classification performance metrics using RF-RAF fingerprints at S N R = 20 dB. The entries include the mean %C with ±95% confidence intervals.
DeviceACC (%)PRC (%)RCL (%)
D199.77 ± 0.0399.25 ± 0.1398.93 ± 0.18
D299.69 ± 0.0498.21 ± 0.2999.35 ± 0.09
D399.52 ± 0.0498.09 ± 0.1598.04 ± 0.29
D499.82 ± 0.0499.05 ± 0.2599.55 ± 0.11
D599.02 ± 0.0696.41 ± 0.3195.69 ± 0.34
D698.42 ± 0.0992.88 ± 0.5294.62 ± 0.37
D799.39 ± 0.0798.00 ± 0.2797.10 ± 0.39
D899.31 ± 0.0597.99 ± 0.1796.48 ± 0.30
Ave 99.37 ± 0.0497.48 ± 0.1697.47 ± 0.17
Disclaimer/Publisher’s Note: The statements, opinions and data contained in all publications are solely those of the individual author(s) and contributor(s) and not of MDPI and/or the editor(s). MDPI and/or the editor(s) disclaim responsibility for any injury to people or property resulting from any ideas, methods, instructions or products referred to in the content.