Article

A Traffic Sign Detection Algorithm Based on an Improved YOLOv8n

College of Artificial Intelligence & Computer Science, Xi’an University of Science and Technology, Xi’an 710054, China
*
Author to whom correspondence should be addressed.
Electronics 2026, 15(10), 2022; https://doi.org/10.3390/electronics15102022
Submission received: 14 April 2026 / Revised: 7 May 2026 / Accepted: 7 May 2026 / Published: 9 May 2026
(This article belongs to the Section Computer Science & Engineering)

Abstract

To address the limitations of YOLOv8n in multi-scale feature representation and high false negative rates for small traffic signs under edge-computing constraints, this paper proposes an improved lightweight detection algorithm integrating the VoVGSCSP module and a Multi-scale Contextual Attention (MCA) mechanism. Specifically, the original C2f module is replaced with VoVGSCSP to enhance gradient flow and aggregate multi-scale receptive fields, while MCA captures discriminative shape, boundary, and color features via multi-branch pooling with dynamic weight fusion. The PAN-FPN is further optimized using Learnable Weight Concatenation (LWConcat) for adaptive multi-level feature fusion. On the CTSDB dataset, the proposed model reduces parameter count to 2.90 M (4.0% reduction) and FLOPs to 7.4 G (8.6% reduction), while improving mAP0.5 from 96.2% to 99.4% and mAP0.5:0.95 from 94.8% to 98.6%. On the TT100K dataset, mAP0.5 increases from 60.2% to 61.9% and mAP0.5:0.95 from 44.9% to 46.5%. The smaller improvement on TT100K suggests greater dataset diversity and annotation complexity, indicating a direction for future work. Overall, the proposed algorithm achieves a favorable trade-off among accuracy, model size, and computational cost, validating its practicality for resource-constrained edge deployment.

1. Introduction

The ongoing intelligent transformation of the automotive industry has positioned autonomous driving at the forefront of global technological competition. Traffic sign detection, a critical component of environmental perception in autonomous driving, plays a pivotal role in ensuring vehicle safety [1]. Its accuracy and real-time performance directly influence the vehicle’s understanding of traffic regulations and the reliability of its driving decisions [2].
Compared with general object detection tasks, traffic sign detection exhibits unique challenges. First, target scales vary dramatically: distant signs may occupy as few as 10 pixels, while nearby signs may exceed 200 pixels. Second, the category distribution follows a long-tail pattern, with significant sample size disparities across different types of traffic signs. Third, environmental factors such as illumination changes, adverse weather (e.g., rain and fog), and partial occlusion substantially degrade sign visibility [3]. Furthermore, in mass-production autonomous driving solutions, perception algorithms must be deployed on onboard computing platforms with strict constraints on power consumption, heat dissipation, and cost. Given that onboard cameras continuously capture video streams at over 30 fps, real-time and lightweight algorithm design becomes imperative [4].
In recent years, deep learning-based object detectors have achieved significant progress in traffic sign recognition. One-stage detectors, especially the YOLO series, have become mainstream due to their balance between accuracy and speed [5,6]. YOLOv8n, a lightweight version released by Ultralytics in 2023 [7], employs an optimized CSPDarknet53 backbone, a C2f feature extraction module, and an anchor-free detection head. However, when applied to traffic sign detection, YOLOv8n shows limitations: the C2f module has limited multi-scale feature capture capability, the feature enhancement network inadequately fuses shallow detail features with deep semantic features, leading to high miss rates for small signs, and the model lacks effective background interference suppression [3,8].
To address these issues, researchers have proposed various improvements. Dewi et al. [3] developed a YOLOv4-based model incorporating synthetic training data. Wang et al. [8] modified YOLOv5 for real-time multi-scale detection. Wang et al. [9] proposed YOLO-AEF for complex illumination conditions. He et al. [10] introduced NTS-YOLO for nighttime detection. Ji et al. [11] improved YOLOv8 for small-target detection in complex environments. Du et al. [12] presented ES-YOLO, achieving a 10.4% mAP50 improvement on the TT100K dataset. Despite these contributions, there remains room for improvement in balancing feature representation and computational efficiency [8].
In this paper, we propose an improved algorithm integrating the VoVGSCSP module with a Multi-scale Contextual Attention mechanism. The main contributions are threefold: (1) introducing VoVGSCSP to replace the C2f module in the feature enhancement network, enhancing feature representation through parallel residual branches and cross-stage connections; (2) designing MCA mechanism with multi-branch global average pooling and max pooling operations to extract features at different receptive fields, while dynamic weight fusion adaptively combines spatial and channel-wise attention to capture geometric features and color semantics effectively; and (3) optimizing the PAN-FPN feature fusion path by incorporating learnable weight concatenation (LWConcat), which assigns adaptive weights to different feature levels during multi-scale fusion, enabling the model to dynamically balance information from various feature maps. Experiments on the CTSDB and TT100K datasets validate the advantages of the proposed algorithm in accuracy, speed, and model lightweighting.

2. Methodology

2.1. Analysis of the YOLOv8n Baseline Model

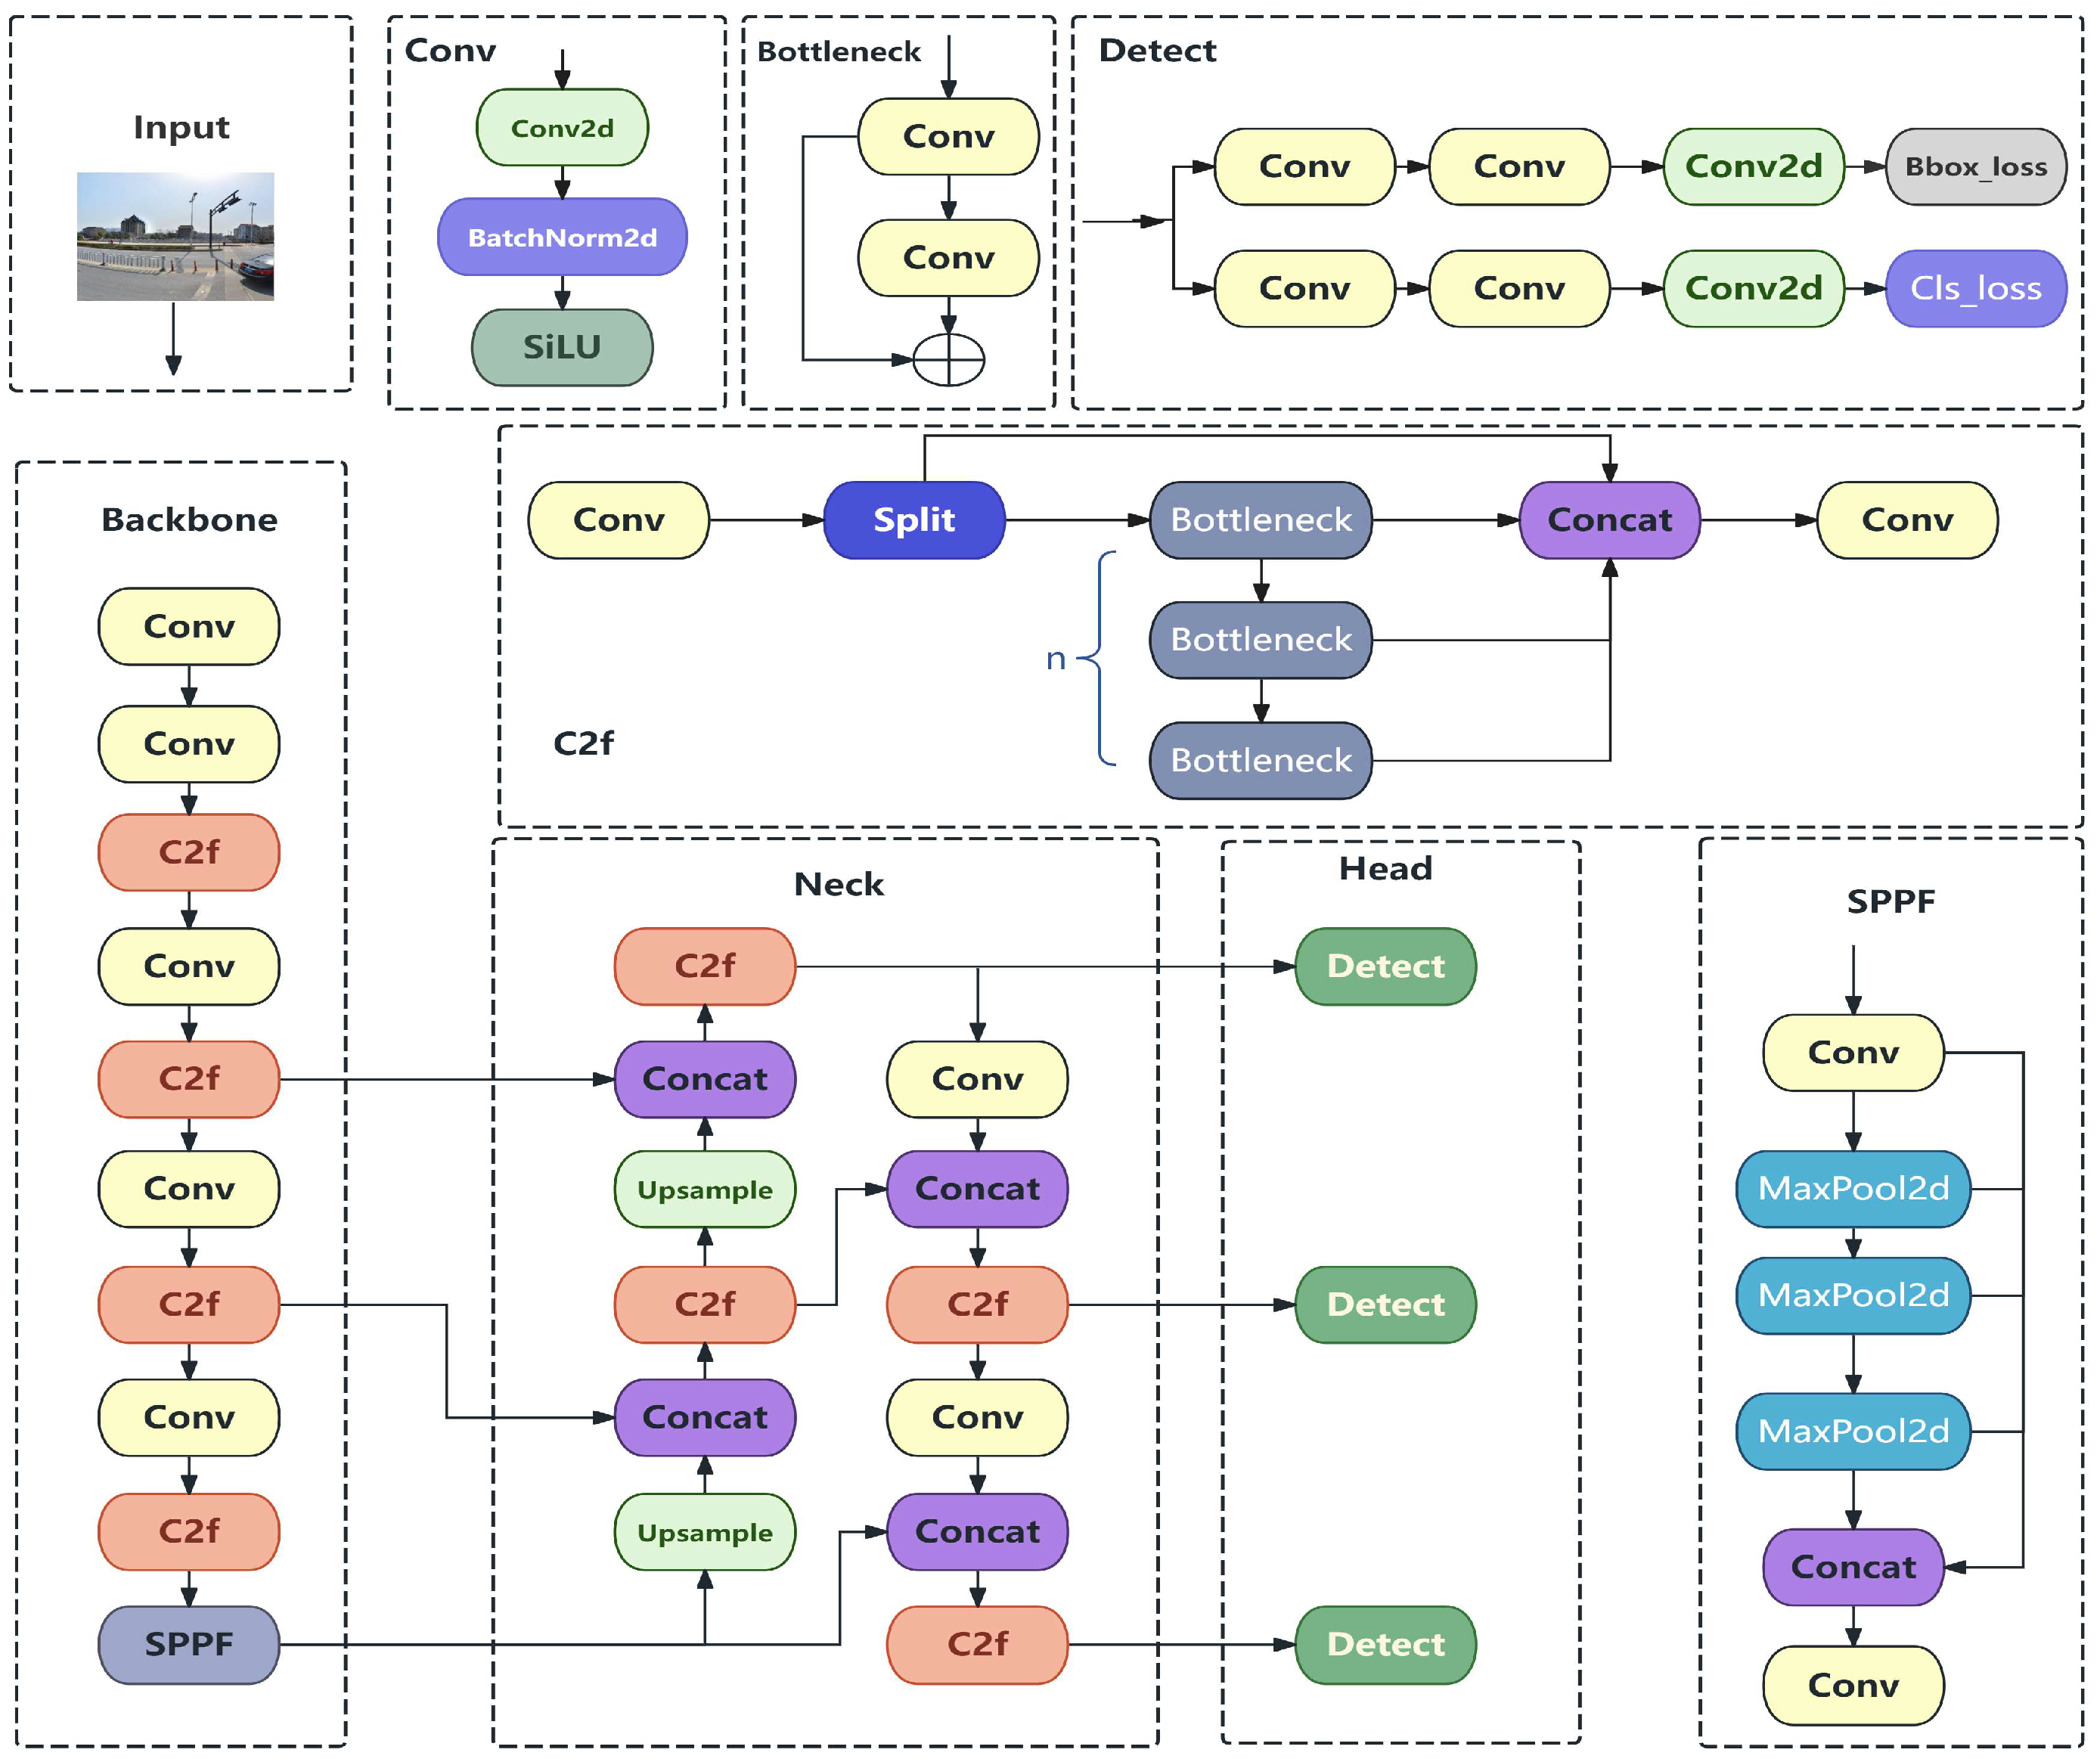
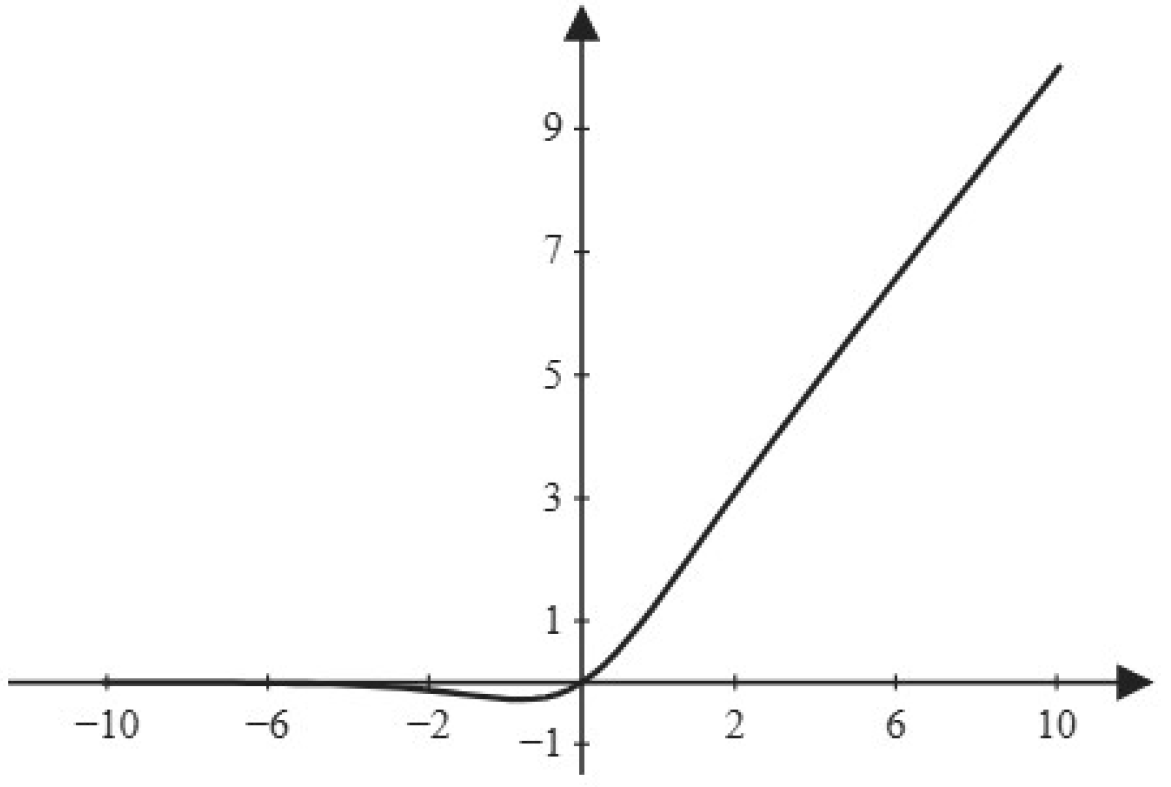
YOLOv8n is a lightweight object detection model whose architecture consists of four components (Figure 1): input, backbone, neck, and head [7]. The backbone adopts an optimized CSPDarknet53 architecture, comprising Conv modules, C2f modules, and an SPPF module. The input image is resized to 640 × 640 × 3, and three feature maps are output at scales of 80 × 80 × 256, 40 × 40 × 512, and 20 × 20 × 512. The C2f module draws on the ELAN design concept from YOLOv7, employing a gradient branching strategy to achieve lightweighting while enhancing feature transfer and fusion efficiency [6]. The SPPF module uses serial and parallel max-pooling layers to enlarge the receptive field with reduced computational cost [8]. The Conv module combines convolution, batch normalization, and the SiLU activation function (Equation (1), Figure 2).
SiLU(x) = x⋅Sigmoid(x)
The neck adopts a PAN-FPN hybrid structure [13] with a top-down FPN path and a bottom-up PAN path for multi-scale feature fusion. The head uses a decoupled design, with binary cross-entropy loss for classification and a combination of distribution focal loss (DFL) [14] and CIoU loss [15] for regression. As an anchor-free model, YOLOv8n dynamically assigns samples using a task-aligned assigner (Equation (2)).
t = sα × uβ
where s is the classification score, u is the IoU between the predicted box and the ground truth, and α and β are hyperparameters.

2.2. Improved Network Architecture

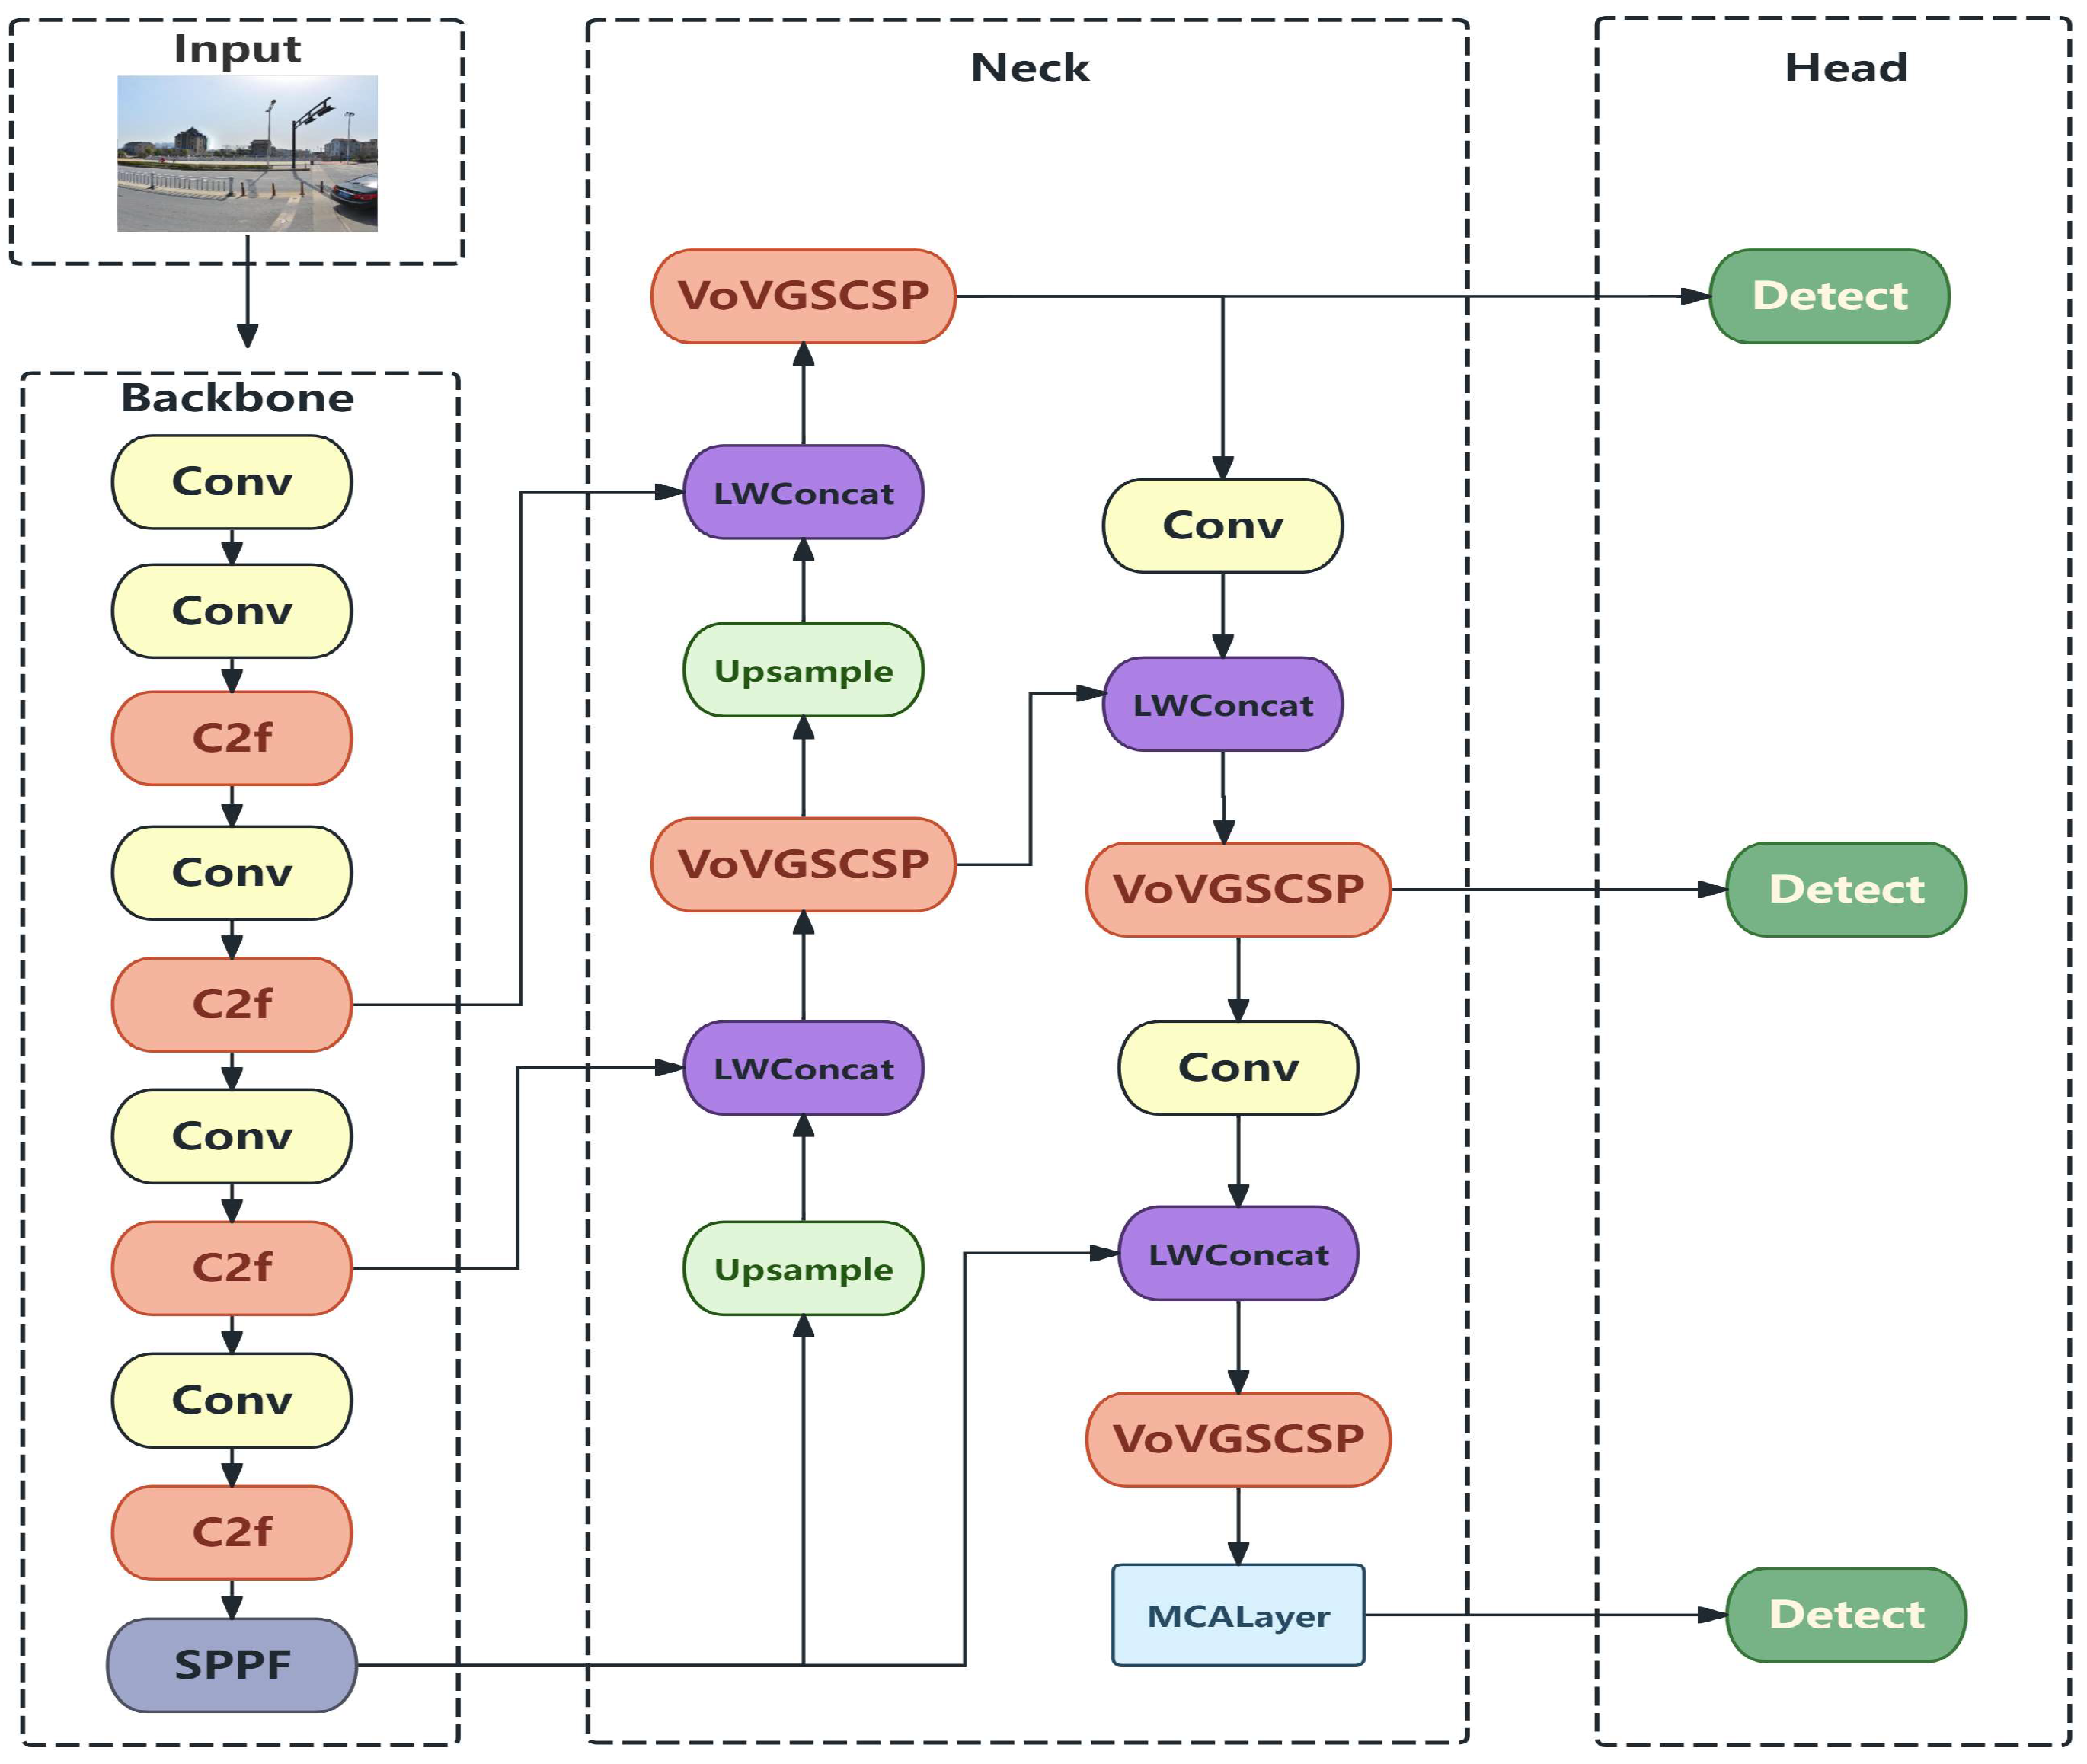
As illustrated in Figure 3, the network architecture of the proposed improved algorithm consists of four main components: input, backbone, neck, and head. To enhance the feature representation capability of the neck, this study introduces the VoVGSCSP module as a replacement for the original C2f module. The VoVGSCSP module improves feature extraction by leveraging parallel residual branches and cross-stage partial connections, while maintaining computational efficiency. For capturing multi-scale contextual information, the Multi-scale Contextual Attention (MCA) mechanism is integrated into the head network. The MCA employs multi-branch global average pooling and max pooling operations to extract features across different receptive fields. Furthermore, adaptive weight fusion is utilized to dynamically combine spatial and channel-wise attention, enabling the model to effectively capture geometric features and color semantics. The neck adopts a PAN-FPN structure augmented with Learnable Weight Concatenation (LWConcat) for adaptive multi-scale feature fusion. This layer merges shallow and deep feature maps through upsampling and downsampling pathways, thereby enhancing the model’s ability to detect small targets. During multi-scale fusion, LWConcat assigns adaptive weights to different feature levels, allowing the model to dynamically balance information from various feature maps. The following sections will sequentially detail the VoVGSCSP, the MCA mechanism, and LWConcat.

2.2.1. VoVGSCSP Module

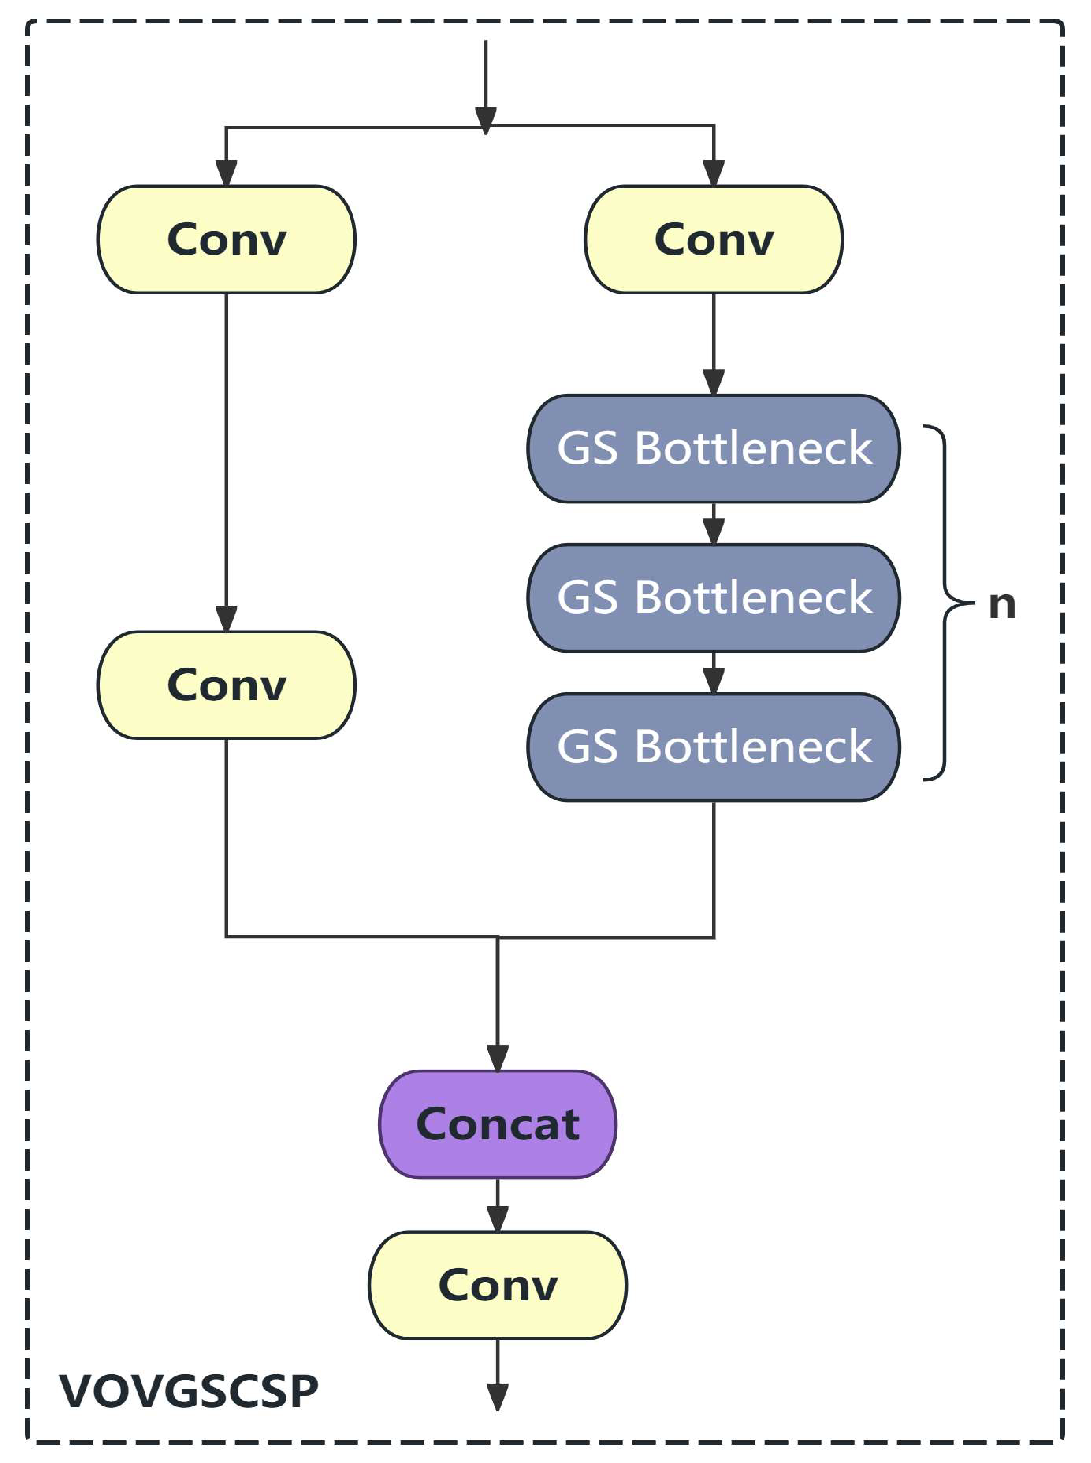
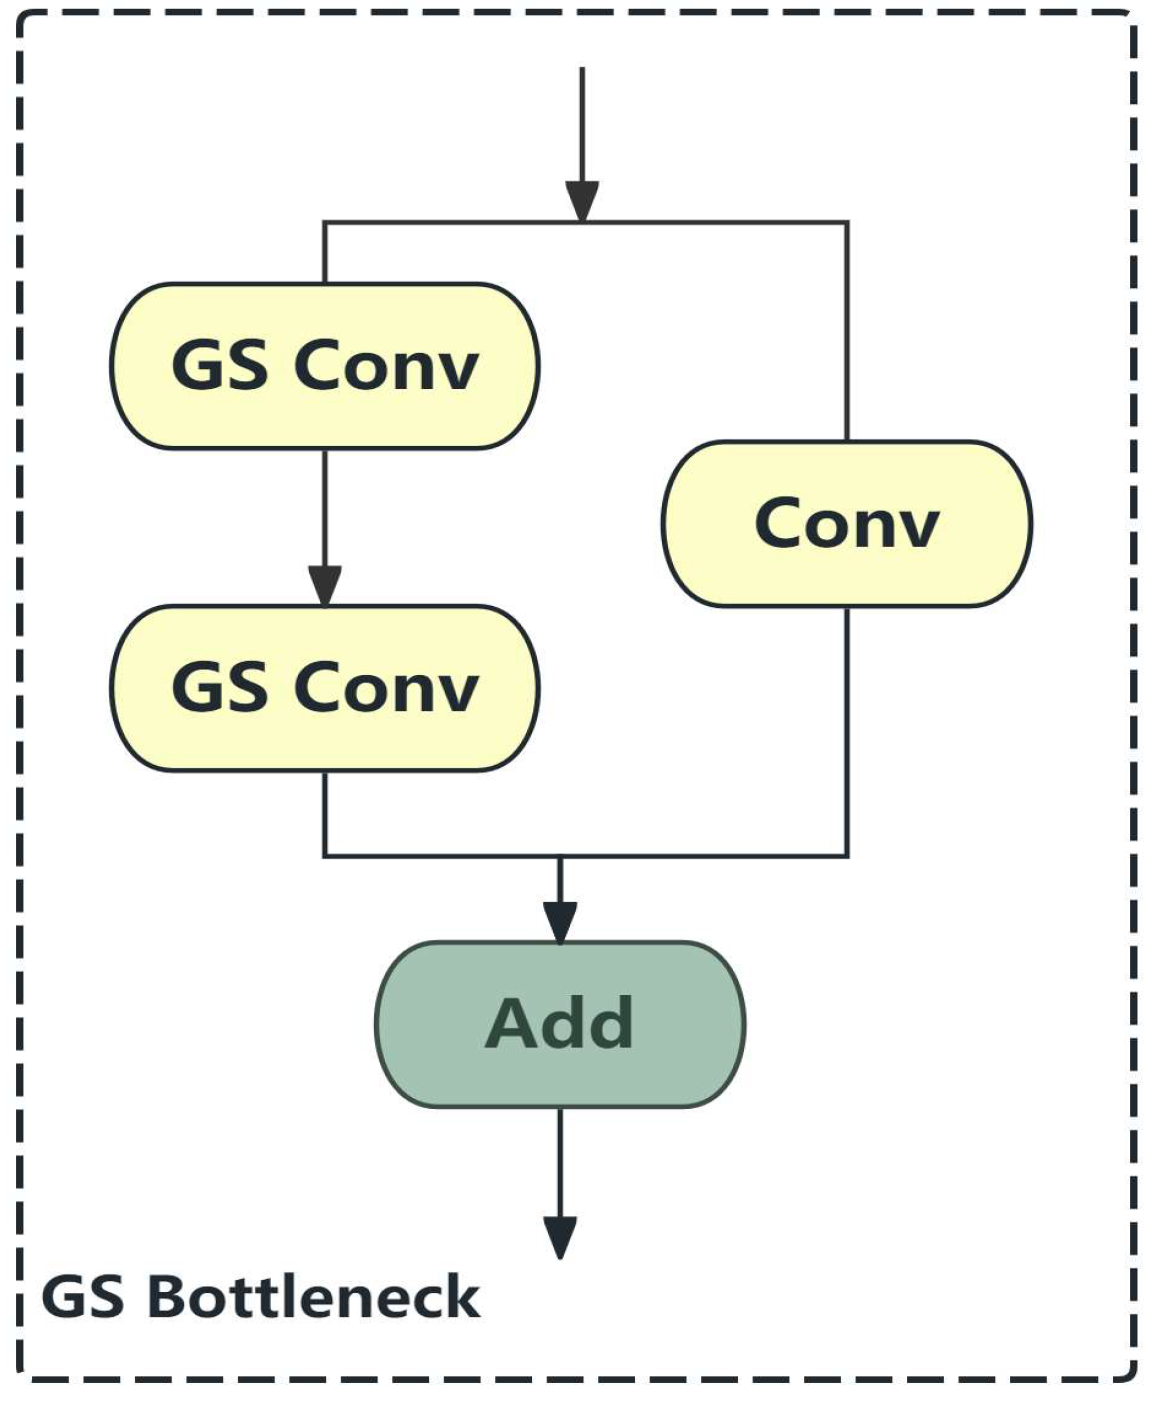
To address the high sensitivity of traffic sign detection to geometric features and color semantics, this study replaces the original C2f module with the VoVGSCSP (Voxel-Guided Visual Geometry Group Shuffling Cross-Stage Partial) module. As shown in Figure 4, VoVGSCSP employs the GS bottleneck structure illustrated in Figure 5, which incorporates parallel residual and dense connection branches based on the CSP architecture [16] to capture both local detail features and global semantic features of traffic signs, while employing channel grouping strategies to reduce computational complexity [16,17,18]. Compared with C2f, VoVGSCSP improves gradient flow within the network, ensures stable training, and leverages the structural advantages of parallel branches to extract complementary features, making it more suitable for traffic sign detection [17].

2.2.2. Multi-Scale Contextual Attention (MCA)

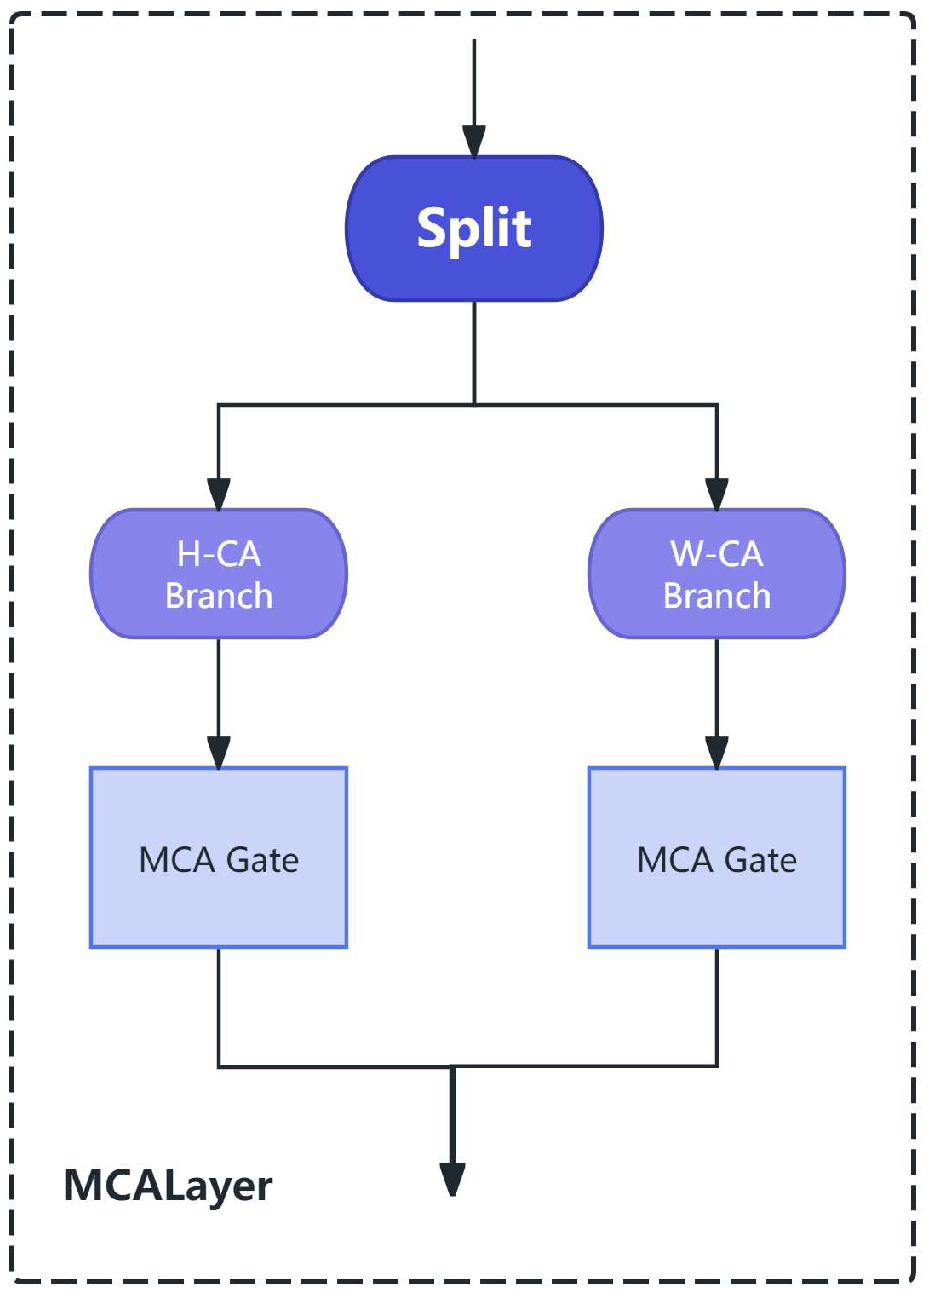
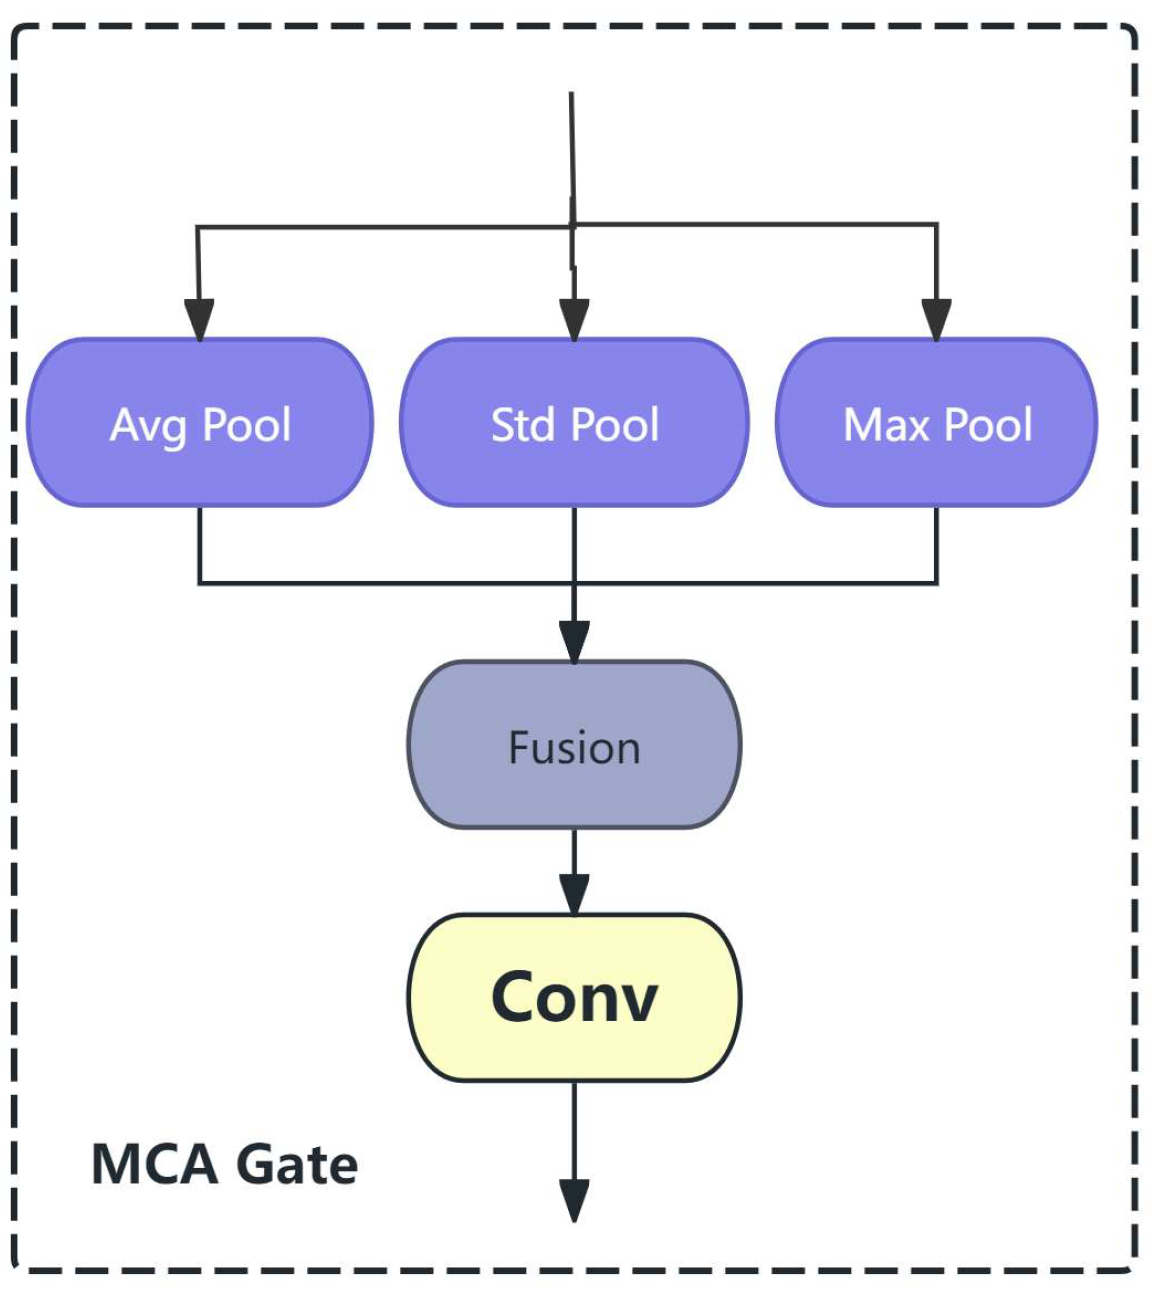
The Multi-scale Contextual Attention Layer (MCALayer) is designed to capture spatial–contextual information through a dual-path attention mechanism. As shown in Figure 6, MCALayer consists of two parallel attention branches: horizontal attention (H-CA) and vertical attention (W-CA). Each branch employs three pooling operations, i.e., average pooling, max pooling, and standard deviation pooling, with learnable weights to extract multi-scale features from different receptive fields. As illustrated in Figure 7, the core component MCAGate processes these pooled features through a learnable weight fusion strategy, followed by a one-dimensional convolution and Sigmoid activation to generate the attention weights. The outputs from both H-CA and W-CA branches are fused by weighted summation, enabling the model to capture both local details and global semantic information effectively. The kernel size in the spatial attention is dynamically adjusted based on the input channel dimensions, ensuring adaptability across different feature scales. The core computation is defined in Equation (3):
F o u t = 1 2 ( G h ( F h ) + G w ( F w ) )
Among them:
F h = p e r m u t e ( F , 0 , 2 , 1 , 3 ) ( C o m p r e s s   a l o n g   h e i g h t )
F w = p e r m u t e ( F , 0 , 3 , 2 , 1 ) ( C o m p r e s s   a l o n g   w i d t h )
G ( ) = C o n v 1 d ( 1 3 i P o o l i + i w i P o o l i )

2.2.3. Learnable Weight Concatenation (LWConcat)

The Learnable Weight Concatenation (LWConcat) module is designed to adaptively fuse multi-scale feature maps in the PAN-FPN structure. LWConcat assigns learnable weights to each input feature map, which are dynamically adjusted during training through gradient backpropagation. The weights are normalized using the Softmax function to ensure that they sum to one, which can be formulated as Equation (4):
w i = e w i j = 0 n 1 e w j
The computation process is defined as follows: first, each input feature map F i is multiplied by its corresponding normalized weight w i ; then, all weighted feature maps are concatenated along the specified dimension. The overall process can be expressed as Equation (5):
O = C o n c a t ( w 0 F 0 , w 1 F 1 , , w n 1 F n 1 )
Traffic signs exhibit significant scale variations in real-world scenarios, ranging from large regulatory signs to small warning signs. This design allows the model to adaptively balance the contribution of each feature map, particularly enhancing the detection of small traffic signs by learning optimal fusion weights automatically. Compared with the standard concatenation operation, LWConcat enables the model to focus more on feature maps containing fine-grained details of traffic signs at different scales, thereby improving detection accuracy for both large and small traffic signs.

3. Experimental Design

3.1. Dataset

The Chinese Traffic Sign Detection Benchmark (CTSDB) is a comprehensive dataset specifically designed for intelligent transportation systems and autonomous driving technologies. The original dataset consists of 17,856 images, covering 58 traffic sign classes across five major categories: speed limit signs (8 classes), prohibitory signs (12 classes), indicative signs (12 classes), warning signs (20 classes), and yield/stop signs (6 classes). To enhance training efficiency while maintaining sufficient diversity, we randomly sampled approximately one-third of the original dataset, resulting in 5998 images, the distribution of various types of traffic signs is shown in Table 1. Note that this random sampling, while preserving the overall class distribution, may under-represent challenging cases such as small, occluded, or poorly illuminated signs, making the subset easier than the full CTSDB dataset. The dataset is divided into 4775 training images (85.6%), 617 validation images (11.1%), and 606 test images (10.9%). To verify the generalization ability of the proposed algorithm in real traffic sign detection scenarios, we also selected TT100K for generalization experiments. The Tsinghua Tencent 2016 (TT100K) is a large-scale Chinese road traffic sign dataset jointly established by Tsinghua University and Tencent. The original dataset consists of 100,000 panoramic street scene images captured from Tencent’s street view, featuring over 30,000 annotated traffic sign instances across various scenarios such as urban roads, highways, and tunnels, and various weather conditions such as rain, snow, and fog. The images demonstrate substantial variations in illumination and atmospheric conditions, offering high representativeness for real-world Chinese road traffic environments. To ensure adequate training samples and balanced class distribution for our 45 selected traffic sign categories, we employed a curated subset from Roboflow. It consists of 7336 training images, 921 validation images, and 913 test images. All images are resized to 640 × 640 pixels to conform with the YOLOv8n input specifications.

3.2. Experimental Setup

The experiments were conducted using the PyTorch2.8.0 deep learning framework (Python 3.9.25, torch 2.8.0+cu129). The hardware configuration is as follows: all experiments were carried out on a laptop platform equipped with an Intel Core Ultra 9 275HX processor, an NVIDIA GeForce RTX 5060 laptop GPU (8 GB VRAM), and a 128 MB integrated graphics card. The training configuration is as follows: CTSDB was trained for 50 epochs (TT100K for 150 epochs), with a batch size of 16 and an input size of 640 × 640. The AdamW optimizer was used, combined with a cosine decay learning rate scheduler, with an initial learning rate of 0.001 and a final learning rate of 0.00001. Mixed precision training (AMP) was enabled to accelerate training, and an early stopping mechanism was adopted with a patience value of 10 epochs to prevent overfitting. The improved model was configured through a custom YAML file to load the architecture for training.

3.3. Evaluation Metrics

To comprehensively evaluate the performance of the improved model, mean average precision (mAP), precision, recall, and F1-score are used as detection accuracy metrics, while parameter count, computational cost (GFLOPs), and frames per second (FPS) serve as lightweighting and real-time performance metrics [5,7].
(1)
Mean average precision (mAP):
m A P = 1 N i = 1 N A P i
where A P i is the average precision for class i, computed as the area under the precision–recall curve, and N is the total number of traffic sign categories [1].
(2)
Precision and recall:
P r e c i s i o n = T P T P + F P
R e c a l l = T P T P + F N
where TP is the number of true positives (correctly detected signs), FP is the number of false positives (background incorrectly detected as signs), and FN is the number of false negatives (undetected signs) [9].
(3)
F1-score:
F 1 = 2 × P r e c i s i o n × R e c a l l P r e c i s i o n + R e c a l l
The F1-score is the harmonic mean of precision and recall, providing a comprehensive assessment of detection performance [6].

4. Results and Analysis

To demonstrate the traffic sign detection capability of the improved YOLOv8n model in real-world scenarios, this section first presents the results of comparative experiments. Subsequently, the effectiveness of the proposed improvements is comprehensively validated through ablation experiments, generalization experiments, and visualization of detection results.

4.1. Comparative Experiments

In the comparative experiments of traffic sign detection, this study evaluates the proposed algorithm against six state-of-the-art object detection models, including RT-DETR-ResNet50, YOLOv5n, YOLOv8n (baseline), YOLOv10n, YOLO11n, and YOLO26n. All models are evaluated using seven metrics: Precision (P), Recall (R), mAP0.5, mAP0.5:0.95, Parameters, GFLOPs and FPS. As presented in Table 2, the proposed algorithm achieves the highest accuracy among all compared methods, with a precision of 89.5%, a recall of 99.9%, a mAP0.5 of 99.4%, and a mAP0.5:0.95 of 98.6%. However, its FPS (96.29) is lower than that of some lightweight models, indicating a trade-off where accuracy is prioritized over inference speed.
Compared with the baseline YOLOv8n, the proposed algorithm improves precision by 3.5 percentage points, recall by 7.2 percentage points, mAP0.5 by 3.2 percentage points, and mAP0.5:0.95 by 3.8 percentage points. Compared with YOLOv10n, the proposed algorithm achieves a precision improvement of 1.8 percentage points, a recall improvement of 4.7 percentage points, a mAP0.5 improvement of 2.0 percentage points, and a mAP0.5:0.95 improvement of 3.4 percentage points. Notably, the recall of the proposed algorithm reaches 99.9%, demonstrating exceptional capability in detecting traffic signs with minimal missed detections. In terms of computational efficiency, the inference speed of the proposed model was 96.29 FPS. Although it was slightly lower than the 103.6 FPS of the baseline YOLOv8n, it still met the requirements for real-time detection. It is worth noting that the proposed model achieved significant performance improvement while maintaining only 2.9 M parameters and 7.4 GFLOPs. This slight sacrifice in speed resulted in an all-round improvement in Precision, Recall, mAP0.5, and mAP0.5:0.95. In contrast, although YOLOv5n achieved the highest 129.03 FPS, its accuracy metrics were significantly lower than those of the proposed model. The proposed model maintains a lightweight architecture with only 2.9 M parameters and 7.4 GFLOPs, striking an effective balance between detection accuracy and computational efficiency.

4.2. Ablation Experiments

To evaluate the impact of the proposed improvements on the YOLOv8n model, ablation experiments are conducted on the traffic sign detection dataset. These improvements include VoVGSCSP, MCALayer, and LWConcat, demonstrating their effectiveness and necessity. “√” indicates that the corresponding module is employed in the model, while “-” indicates the use of the original YOLOv8n module.
The ablation experiment results are presented in Table 3. Compared with the baseline YOLOv8n, the introduction of VoVGSCSP module improves mAP0.5 from 96.2% to 99.1% and mAP0.5:0.95 from 94.8% to 98.6%, while reducing GFLOPs from 8.1 to 7.4. This indicates that VoVGSCSP effectively enhances feature representation through parallel residual branches and cross-stage connections, improving gradient flow and extracting complementary features. However, the computational efficiency slightly decreases from 103.6 FPS to 95.59 FPS due to the increased model complexity.
The YOLOv8n model with MCALayer achieves a mAP0.5 of 97.9% and mAP0.5:0.95 of 97.0%, with a marginal reduction in computational cost (7.4 GFLOPs). The multi-scale contextual attention mechanism effectively captures geometric features and color semantics through dual-path attention and multi-branch pooling, leading to improved detection accuracy. The FPS slightly decreases to 99.35 due to the additional attention computation.
The LWConcat module alone improves mAP0.5 to 95.3% and mAP0.5:0.95 to 93.3%, while maintaining the original computational complexity (8.1 GFLOPs) and achieving the highest FPS of 105.3. This demonstrates that LWConcat enables adaptive multi-scale feature fusion through learnable weights, improving detection efficiency without additional computational burden.
The combination of VoVGSCSP and LWConcat achieves a mAP0.5 of 99.2% and a mAP0.5:0.95 of 98.6% at 100.12 FPS. These results demonstrate that VoVGSCSP enhances feature representation while LWConcat reduces fusion redundancy, thereby achieving a better accuracy–speed trade-off than using VoVGSCSP alone. The combination of VoVGSCSP and MCALayer achieves a mAP0.5 of 99.0% and mAP0.5:0.95 of 98.8%, significantly outperforming individual modules. The combination of MCALayer and LWConcat achieves a mAP0.5 of 99.2%, demonstrating the complementary nature of these modules. The full model with all three improvements (VoVGSCSP + MCALayer + LWConcat) achieves the best performance with mAP0.5 of 99.4%, mAP0.5:0.95 of 98.6%, 7.4 GFLOPs, and 96.29 FPS.
In summary, each proposed improvement contributes to the detection accuracy of the original network. In particular, VoVGSCSP provides the most significant improvement in mAP0.5 (+2.9 percentage points), while LWConcat maintains the highest inference speed (105.3 FPS). The full combination achieves the optimal balance between accuracy and efficiency, demonstrating the effectiveness of the proposed algorithm for traffic sign detection.

4.3. Generalization Experiment

To further validate the generalization capability of the proposed algorithm, experiments are conducted on the TT100K dataset, which is a large-scale Chinese traffic sign detection dataset with more diverse scenarios and categories. Table 4 presents the comparative experimental results on the TT100K dataset.
As shown in Table 4, the proposed algorithm achieves the best detection performance among all compared models on the TT100K dataset. Specifically, the proposed model achieves a precision of 59.3%, a recall of 58.5%, a mAP0.5 of 61.9%, and a mAP0.5:0.95 of 46.5%, outperforming all other compared algorithms.
Compared with the baseline YOLOv8n, the proposed algorithm improves mAP0.5 by 1.7 percentage points (from 60.2% to 61.9%) and mAP0.5:0.95 by 1.6 percentage points (from 44.9% to 46.5%). Compared with YOLOv5n, the proposed algorithm achieves improvements of 2.7 percentage points in mAP0.5 and 2.2 percentage points in mAP0.5:0.95. Notably, compared with the latest YOLO variants such as YOLOv10n, YOLO11n, and YOLO26n, the proposed algorithm consistently achieves superior performance across all metrics, demonstrating its effectiveness and robustness in handling diverse traffic sign detection scenarios.
Furthermore, with only 2.89 M parameters and 7.4 GFLOPs, the proposed model is as lightweight as other YOLO variants yet achieves the highest detection accuracy among all compared models. Notably, on the TT100K dataset, the model achieves an FPS of 34.01, slightly higher than the baseline YOLOv8n (33.04 FPS), demonstrating that the accuracy gains do not come at the cost of inference speed. This balance of high accuracy and competitive inference speed further validates the algorithm’s practical applicability for real-world traffic sign detection.
The proposed method achieves substantial gains on CTSDB but only modest improvements on TT100K (e.g., +1.7% vs. +3.2% in mAP0.5). We attribute this discrepancy primarily to the sampling bias of CTSDB. Specifically, the CTSDB subset used in this work is a random sample of the original dataset, which likely under-represents challenging cases such as small, occluded, or poorly illuminated signs. This makes the CTSDB subset an easier benchmark where performance saturation is easier to achieve. In contrast, TT100K is used in its full form and explicitly includes difficult scenarios (adverse weather, tunnels, occlusions) along with a long-tail category distribution across 45 classes. It is worth noting that the proposed model consistently outperforms the baseline in detection accuracy across both datasets, achieving particularly substantial gains on the more challenging TT100K dataset. The relatively smaller margin of improvement on CTSDB does not indicate a weakness of the proposed method; rather, it reflects the inherent difficulty gap between a relatively simpler benchmark (CTSDB) and a more realistic, challenging one (TT100K). This finding suggests that future work should focus on domain adaptation and data augmentation to further enhance robustness under diverse real-world conditions.

4.4. Visualization and Analysis

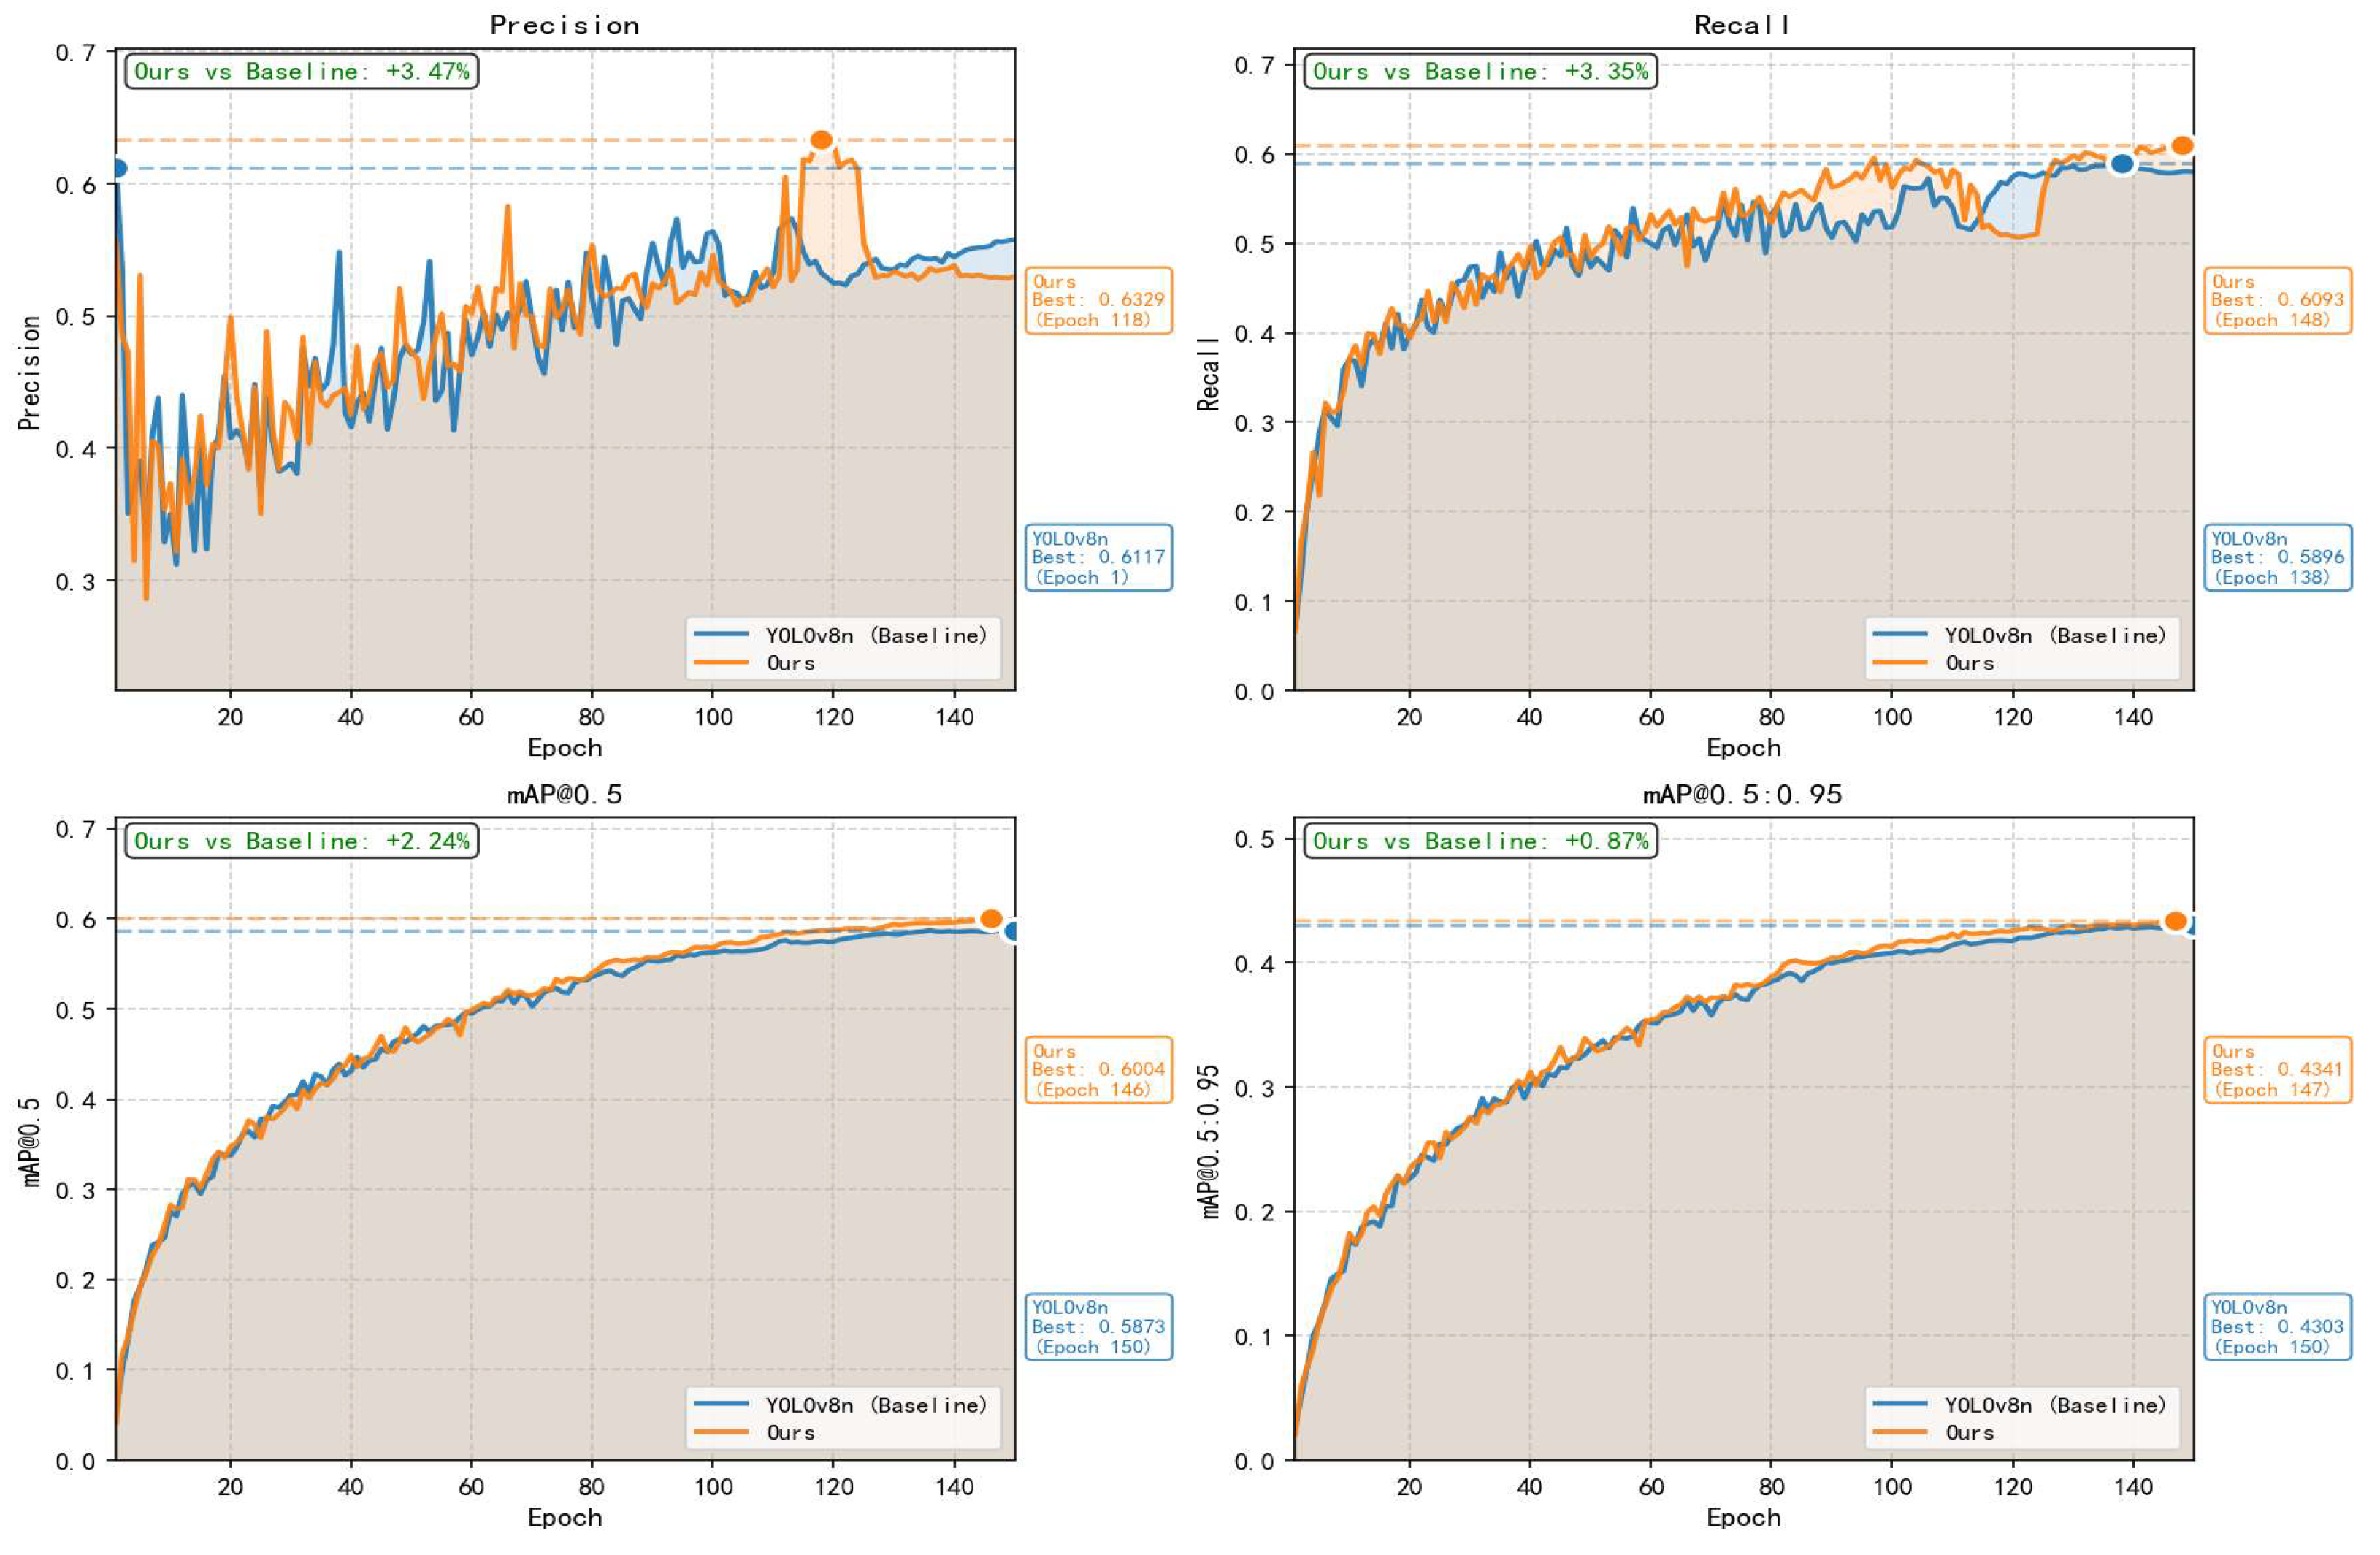
To demonstrate the detection performance of the proposed algorithm, comparative experiments were conducted on the TT100K dataset. The four metrics of our improved model, including mAP0.5, mAP0.5–0.95, P, and R, are illustrated in Figure 8. Our model converges smoothly during training, and all four metrics achieve improvements compared to the baseline YOLOv8n, with P increasing by 3.47%, R by 3.35%, mAP0.5 by 2.24%, and mAP0.5–0.95 by 0.87%, respectively. These results validate the effectiveness of the proposed VoVGSCSP, MCALayer, and LWConcat modules in enhancing the detection performance for traffic signs.
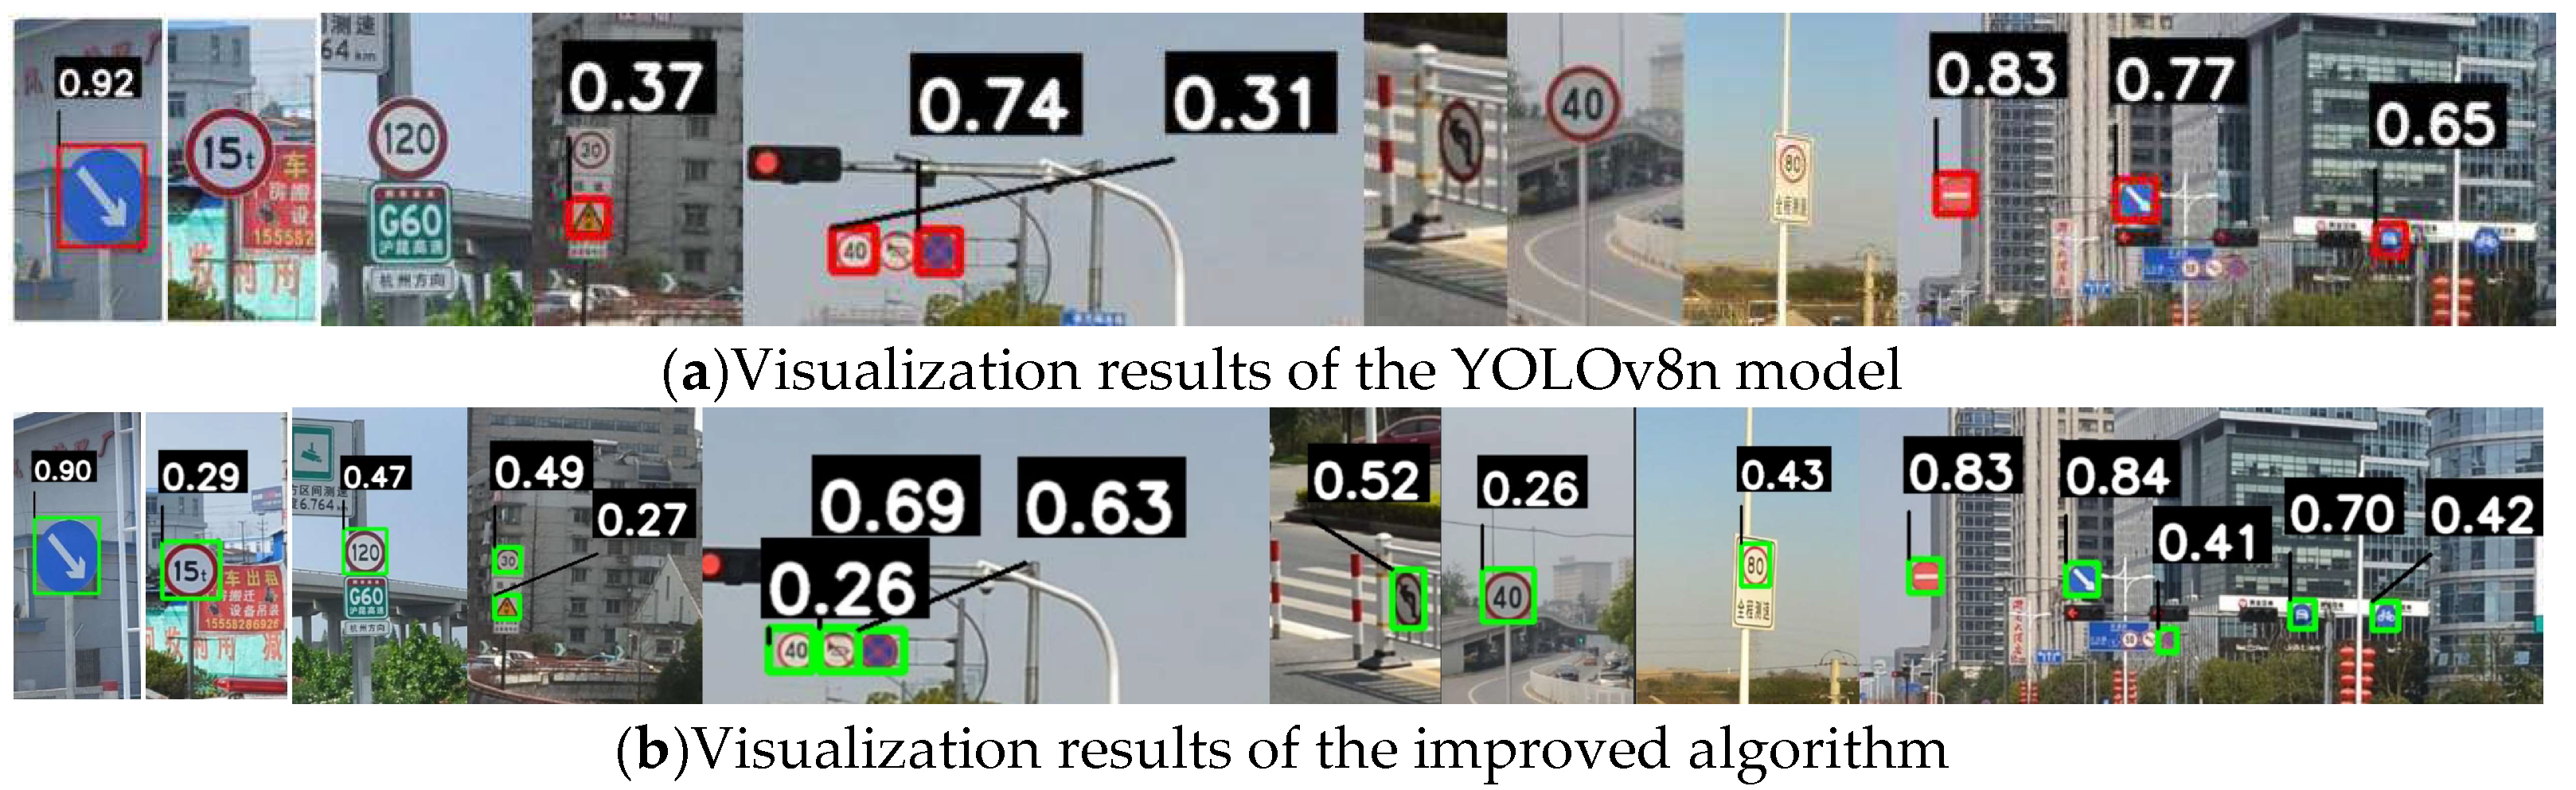
Figure 9 compares the detection effectiveness between YOLOv8n and our proposed method. Figure 9a shows the detection results using the baseline YOLOv8n algorithm, while Figure 9b presents the results using our improved algorithm. By comparing eight pairs of detection results from the same traffic sign scenes, it is evident that our proposed method can detect a greater number of targets compared to YOLOv8n, particularly for densely packed small traffic signs and partially occluded signs. Our algorithm also improves overall detection accuracy. The comparison of detection results demonstrates that our improved method excels in detecting traffic signs in complex road scenes, effectively addressing missed detections of small targets and enhancing the detection precision.

5. Conclusions

To address the limitations of YOLOv8n in traffic sign detection—namely insufficient multi-scale feature representation, high false negatives for small targets, and poor robustness in complex environments—this paper proposes an improved lightweight detection algorithm that integrates the VoVGSCSP module, Multi-scale Contextual Attention (MCA) mechanism, and LWConcat. The original C2f module is replaced with VoVGSCSP to enhance feature representation while reducing computational complexity. MCA employs multi-branch pooling with dynamic weight fusion to capture geometric features and color semantics. LWConcat enables adaptive multi-scale feature fusion. Experimental results on the CTSDB dataset show that our model improves P by 3.5%, R by 7.2%, mAP0.5 by 3.2%, and mAP0.5:0.95 by 3.8%, while reducing parameters by 4.0% and computational cost by 8.6%. On the TT100K dataset, our model improves P by 1.0%, R by 0.9%, mAP0.5 by 2.8%, and mAP0.5:0.95 by 3.6%, with parameters reduced by 4.0% and GFLOPs reduced by 8.6%. These results confirm the effectiveness of the proposed improvements in balancing detection accuracy and efficiency.
Future work will focus on improving cross-scenario robustness under extreme weather and illumination conditions, as well as exploring knowledge distillation for further model compression.


Author Contributions

Conceptualization, Y.J. and S.W.; methodology, Y.J. and S.W.; software, Y.W. and S.W.; validation, Y.J. and Y.W.; formal analysis, Y.J.; investigation, Y.J. and Y.W.; resources, Y.J.; data curation, Y.J. and Y.W.; writing—original draft preparation, Y.J.; writing—review and editing, Y.J. and Y.W.; visualization, Y.J. and Y.W.; supervision, Y.J.; project administration, Y.J.; funding acquisition, Y.J. All authors have read and agreed to the published version of the manuscript.

Funding

This research received no external funding.

Data Availability Statement

The original contributions presented in this study are included in the article. Further inquiries can be directed to the corresponding author.

Conflicts of Interest

The authors declare no conflicts of interest.

References

  1. Zhu, Z.; Liang, D.; Zhang, S.; Huang, X.; Li, B.; Hu, S. Traffic-sign detection and classification in the wild. In Proceedings of the IEEE Conference on Computer Vision and Pattern Recognition, Las Vegas, NV, USA, 26 June–1 July 2016; pp. 2110–2118. [Google Scholar]
  2. Stallkamp, J.; Schlipsing, M.; Salmen, J.; Igel, C. The German traffic sign recognition benchmark: A multi-class classification competition. In Proceedings of the International Joint Conference on Neural Networks, San Jose, CA, USA, 31 July–5 August 2011; pp. 1453–1460. [Google Scholar]
  3. Dewi, C.; Chen, R.-C.; Liu, Y.-T.; Jiang, X.; Hartomo, K.D. YOLO V4 for advanced traffic sign recognition with synthetic training data. IEEE Access 2021, 9, 97228–97242. [Google Scholar] [CrossRef]
  4. Howard, A.G.; Zhu, M.; Chen, B.; Kalenichenko, D.; Wang, W.; Weyand, T.; Andreetto, M.; Adam, H. MobileNets: Efficient convolutional neural networks for mobile vision applications. arXiv 2017, arXiv:1704.04861. [Google Scholar] [CrossRef]
  5. Redmon, J.; Farhadi, A. YOLOv3: An incremental improvement. arXiv 2018, arXiv:1804.02767. [Google Scholar] [CrossRef]
  6. Bochkovskiy, A.; Wang, C.-Y.; Liao, H.Y.M. YOLOv4: Optimal speed and accuracy of object detection. arXiv 2020, arXiv:2004.10934. [Google Scholar] [CrossRef]
  7. Ultralytics YOLOv8, version 8.0.0; Ultralytics: Frederick, MD, USA, 2023. Available online: https://github.com/ultralytics/ultralytics (accessed on 13 April 2026).
  8. Wang, J.; Chen, Y.; Dong, Z.; Gao, M. Improved YOLOv5 network for real-time multi-scale traffic sign detection. Neural Comput. Appl. 2023, 35, 7853–7865. [Google Scholar] [CrossRef]
  9. Wang, P.; Mohamed, R.; Mustapha, N.; Manshor, N. YOLO-AEF: Traffic sign detection via adaptive enhancement and fusion. Neurocomputing 2025, 655, 131430. [Google Scholar] [CrossRef]
  10. He, Y.; Guo, M.; Zhang, Y.; Xia, J.; Geng, X.; Zou, T.; Ding, R. NTS-YOLO: A nocturnal traffic sign detection method based on improved YOLOv5. Appl. Sci. 2025, 15, 1578. [Google Scholar] [CrossRef]
  11. Ji, B.; Xu, J.; Liu, Y.; Fan, P.; Wang, M. Improved YOLOv8 for small traffic sign detection under complex environmental conditions. Frankl. Open 2024, 8, 100167. [Google Scholar] [CrossRef]
  12. Pan, W.; Du, S.; Xu, B.; Zhang, B.; Liu, H. ES-YOLO: Edge and shape fusion-based YOLO for traffic sign detection. Comput. Mater. Contin. 2026, 87, 88. [Google Scholar] [CrossRef]
  13. Lin, T.Y.; Dollár, P.; Girshick, R.; He, K.; Hariharan, B.; Belongie, S. Feature pyramid networks for object detection. In Proceedings of the IEEE Conference on Computer Vision and Pattern Recognition, Honolulu, HI, USA, 21–26 July 2017; pp. 2117–2125. [Google Scholar]
  14. Li, X.; Wang, W.; Wu, L.; Chen, S.; Hu, X.; Li, J.; Tang, J.; Yang, J. Generalized focal loss: Learning qualified and distributed bounding boxes for dense object detection. In Proceedings of the Advances in Neural Information Processing Systems (NeurIPS), Virtual, 6–12 December 2020; Curran Associates Inc.: Red Hook, NY, USA; Volume 33, pp. 23902–23912.
  15. Rezatofighi, H.; Tsoi, N.; Gwak, J.; Sadeghian, A.; Reid, I.; Savarese, S. Generalized intersection over union: A metric and a loss for bounding box regression. In Proceedings of the IEEE/CVF Conference on Computer Vision and Pattern Recognition, Long Beach, CA, USA, 15–20 June 2019; pp. 658–666. [Google Scholar]
  16. Wang, C.Y.; Bochkovskiy, A.; Liao, H.Y.M. Scaled-YOLOv4: Scaling cross stage partial network. In Proceedings of the IEEE/CVF Conference on Computer Vision and Pattern Recognition, Nashville, TN, USA, 20–25 June 2021; pp. 13029–13038. [Google Scholar]
  17. Li, H.; Li, J.; Wei, H.; Liu, Z.; Zhan, Z.; Ren, Q. Slim-neck by GSConv: A lightweight design for real-time detector architectures. J. Real.-Time Image Process. 2024, 21, 62. [Google Scholar] [CrossRef]
  18. Liu, Z.; Li, J.; Shen, Z.; Huang, G.; Yan, S.; Zhang, C. Learning efficient convolutional networks through network slimming. In Proceedings of the IEEE International Conference on Computer Vision, Venice, Italy, 22–29 October 2017; pp. 2736–2744. [Google Scholar]
Figure 1. Network structure of YOLOv8n.
Electronics 15 02022 g001
Figure 2. SiLU activation function curve.
Electronics 15 02022 g002
Figure 3. Network structure of the improved algorithm.
Electronics 15 02022 g003
Figure 4. VoVGSCSP module structure.
Electronics 15 02022 g004
Figure 5. GS Bottleneck structure.
Electronics 15 02022 g005
Figure 6. MCALayer structure.
Electronics 15 02022 g006
Figure 7. MCA Gate structure.
Electronics 15 02022 g007
Figure 8. Comparison of Precision, Recall, mAP0.5, and mAP0.5:0.95 between YOLOv8n and our proposed method across 150 training epochs on the TT100K dataset.
Electronics 15 02022 g008
Figure 9. Visual comparison of the detection results between the baseline YOLOv8n and the proposed algorithm (Display of the cropped detection area).
Electronics 15 02022 g009
Table 1. Distribution Table of the Five Major Categories in the CTSDB Dataset.
CategoryClassNumber of Annotation BoxesProportion
Indicative signs12154225.7%
Speed limit signs8131621.9%
Prohibitory signs12128821.5%
Warning signs20116219.4%
Yield signs669011.5%
Table 2. The experimental results of this algorithm were compared with those of other object detection algorithms on the CTSDB dataset.
ModelP/%R/% m A P 50/% m A P 50:95/%Parameters/MGFLOPsFPS
rtdetr-resnet5091.188.594.491.942125.948.04
yolov5n87.691.296.894.52.517.1129.03
Baseline8692.796.294.83.018.1103.6
yolov10n87.795.297.495.22.276.6121.57
yolo11n82.59594.6932.596.4114.99
yolo26n88.390.196.5952.385.3111.77
ours89.599.999.498.62.897.496.29
Table 3. Experimental results of each component on the CTSDB dataset.
VoVGSCSPMCALayerLWConcat m A P 50/% m A P 50:95/%GFLOPsFPS
96.294.88.1103.6
99.198.67.495.59
97.9977.499.35
95.393.38.1105.3
9998.87.490.43
99.298.67.4100.12
99.296.98.189.94
99.498.67.496.29
Table 4. The experimental results of this algorithm on the TT100K dataset were compared with those of other object detection algorithms.
ModelP/%R/% m A P 0.5/% m A P 0.5:0.95/% Parameters/MGFLOPsFPS
rtdetr-resnet5064.35653.434.842125.822.74
yolov5n59.154.859.244.32.517.132.6
Baseline58.75860.244.93.018.133.04
yolov10n5953.458.143.52.276.634.69
yolo11n53.15757.843.42.596.434.15
yolo26n47.454.353392.385.234.17
ours59.358.561.946.52.897.434.01
Disclaimer/Publisher’s Note: The statements, opinions and data contained in all publications are solely those of the individual author(s) and contributor(s) and not of MDPI and/or the editor(s). MDPI and/or the editor(s) disclaim responsibility for any injury to people or property resulting from any ideas, methods, instructions or products referred to in the content.