Article

Experimental and Physics-Informed Deep-Learning-Enhanced Wearable Microwave Sensor for Non-Invasive Blood Glucose Monitoring


by
Zaid A. Abdul Hassain
1,
Malik J. Farhan
1,
Taha A. Elwi
2 and
Iulia Andreea Mocanu
3,*
1
Electrical Engineering Department, Mustansiriyah University, Baghdad 10052, Iraq
2
Department of Automation and Artificial Intelligence Engineering, College of Information Engineering, Al-Nahrain University, Baghdad 10072, Iraq
3
Telecommunications Department, National University of Science and Technology Politehnica Bucharest, 060042 Bucharest, Romania
*
Author to whom correspondence should be addressed.
Electronics 2026, 15(1), 72; https://doi.org/10.3390/electronics15010072
Submission received: 21 November 2025 / Revised: 5 December 2025 / Accepted: 10 December 2025 / Published: 23 December 2025

Abstract

This study details the design, fabrication, and experimental validation of a wearable, non-invasive microwave sensor for continuous blood glucose monitoring. It incorporates a crescent-loaded elliptical patch antenna with a complementary split-ring resonator (CSRR) tag unit to greatly improve sensing sensitivity. The sensor operates across multiple resonant frequencies, enabling broadband dielectric characterization of glucose-dependent blood permittivity. Incorporation of the CSRR tag unit leads to a marked improvement in electromagnetic coupling and field confinement, resulting in a substantial increase in sensitivity, achieving 1.14 MHz/mg/dL in resonant frequency shift and 0.015 dB/mg/dL in reflection coefficient sensitivity compared to conventional designs. The sensor was fabricated on an FR-4 substrate and experimentally characterized using a vector network analyzer (VNA), showing strong agreement between simulated and measured S11 responses, with minimal frequency deviations and consistent resonance behavior. Experimental results confirmed improved sensitivity in response to glucose concentration variations over the range of 0–500 mg/dL, validating the sensor’s performance under realistic conditions. Furthermore, a physics-informed deep learning (PI-DL) model was developed to predict glucose concentration directly from measured S11 data. The model achieved enhanced prediction accuracy, with a mean absolute error below 1 mg/dL and a strong generalization across unseen samples, demonstrating the power of combining physical modeling with data-driven approaches. These results confirm that the proposed sensor, enhanced with the CSRR tag unit and supported by a PI-DL framework, offers a promising pathway toward next-generation non-invasive, accurate, and wearable glucose monitoring solutions.

1. Introduction

Diabetes mellitus has become one of the most critical global health challenges of the 21st century, with the number of affected individuals rising dramatically from 108 million in 1980 to more than 422 million in 2014 and exceeding 537 million according to the most recent IDF Diabetes Atlas report in 2021 [1,2,3]. Persistent dysregulation of blood glucose levels leads to severe long-term complications, including retinopathy, kidney failure, cardiovascular disorders, stroke, and limb amputation, making accurate and frequent glucose monitoring a fundamental requirement for effective clinical management [4,5,6]. Although finger-prick glucometers remain the most widely used tools for self-monitoring of blood glucose, their invasive nature, discomfort, and ongoing consumable costs significantly reduce patient compliance and limit the clinical benefits of regular monitoring [7]. Minimally invasive continuous glucose monitors (CGMs) provide improved glycemic tracking but require subcutaneous insertion and periodic sensor replacement and remain costly for long-term use [8,9,10]. These limitations have intensified global research efforts toward developing reliable, non-invasive glucose monitoring (NIGM) technologies that provide pain-free, continuous, and cost-effective measurement.
Traditional NIGM approaches have primarily relied on optical techniques such as Raman spectroscopy, near-infrared absorption, or multi-wavelength scattering. While these methods demonstrate theoretical potential, they typically require bulky, complex, and power-hungry optical assemblies and exhibit high sensitivity to environmental and physiological variations, resulting in substantial measurement errors in practical settings [10]. Enzyme-based sensing in fluids such as sweat, saliva, or tears has also been explored, but the correlation between these biofluids and actual blood glucose levels remains inconsistent and clinically unreliable [6].
Against this background, planar microwave sensors have emerged as promising candidates for non-invasive biomedical measurements due to their small footprint, low fabrication cost, compatibility with PCB technologies, and strong ability to detect minute variations in dielectric properties [11,12,13]. Their sensing mechanism is fundamentally governed by near-field electromagnetic perturbation, where changes in the complex permittivity of the material under test (MUT) induce measurable variations in resonant frequency, |S11| magnitude, and Q-factor. This mechanism can be described by the resonant perturbation relationship f f o α ε r ε r where increased glucose concentration decreases the effective permittivity of aqueous solutions, leading to a blue shift in resonant frequency and changes in reflection characteristics. Such sensitivity to dielectric perturbations enables several microwave structures—including SRR, CSRR, SIW, and dielectric resonators—to translate molecular-level variations into measurable electromagnetic responses [14,15,16,17,18].
Planar microwave glucose sensors can be categorized into several major families. Transmission-line sensors (microstrip or CPW) incorporate discontinuities or stubs to enhance field–analyte interaction. Split-ring and complementary split-ring resonators (SRR/CSRR) provide strong electric-field confinement within narrow gaps, enabling high sensitivity to small permittivity variations and forming the basis of many modern microwave biosensors [19,20,21,22]. Multi-resonator approaches, such as three-cell CSRRs, triple-pole CSRRs, and four-cell hexagonal CSRR structures, attempt to enhance field coupling through cascaded or coupled resonators [23,24,25]. Other approaches include substrate integrated waveguide (SIW) sensors, which offer improved Q-factor and field uniformity [26], as well as metamaterial-inspired microfluidic sensors, which achieve enhanced analyte-field interaction via engineered dispersion [18].
To improve sensitivity, recent microwave biosensing strategies have explored several techniques, including multi-resonator coupling for enhanced field localization, capacitive or inductive loading to increase effective inductance, microfluidic channels for sample alignment, SIW-based high-Q structures, and data-driven post-processing using machine learning to compensate for physiological nonlinearities [27,28]. Despite these advances, current designs still face challenges such as limited sensitivity within physiologically relevant glucose ranges (typically 70–150 mg/dL), sample-volume dependence, susceptibility to thermal drift, and reduced Q-factor when low-cost substrates like FR4 are used. Furthermore, many multi-cell or multi-pole structures increase complexity and footprint without providing commensurate improvements in performance, and most studies do not integrate modern artificial intelligence frameworks for robust glucose prediction.
It is important to acknowledge that planar microwave glucose sensors still face significant challenges related to selectivity, particularly in multicomponent biological environments where several blood constituents (e.g., electrolytes, urea, lactate, and proteins) vary simultaneously. Recent studies have emphasized that cross-sensitivity remains a major limitation, and therefore improving selectivity represents a key direction for future work in this field [22,25].
In this paper, a novel planar antenna-based microwave sensor is proposed, aiming to achieve a highly sensitive and compact platform for non-invasive blood glucose detection. The proposed sensing system comprises a groundless metamaterial resonator functioning as a passive tag, integrated with a simple multiband antenna acting as the reader. The tag design is inspired by the fundamental geometry of three complementary split-ring resonator (CSRR) units, optimized to enhance field confinement and frequency selectivity in the near-field region. A homogeneous, finger-equivalent rectangular tissue phantom is employed to emulate realistic interaction conditions between the resonator and biological tissue. Simulation and experimental investigations demonstrate that the proposed configuration exhibits significant frequency shifts and strong sensitivity to dielectric property variations associated with glucose concentration. The detailed methodology, sensor design and specifications, simulation and measurement results, as well as regression-based performance analysis, are presented in the following sections.

2. Sensor Design and Specification

The design and integration of an advanced microwave sensor are fundamental to enhancing the performance of microwave structures, particularly in biomedical applications. Such a sensor significantly contributes to the precise calibration of blood glucose level (BGL) measurement systems, while also ensuring minimal electromagnetic and transmission losses. The successful realization of this technology could constitute a major breakthrough, offering the first truly non-invasive and clinically viable method for continuous glucose monitoring in daily medical practice.
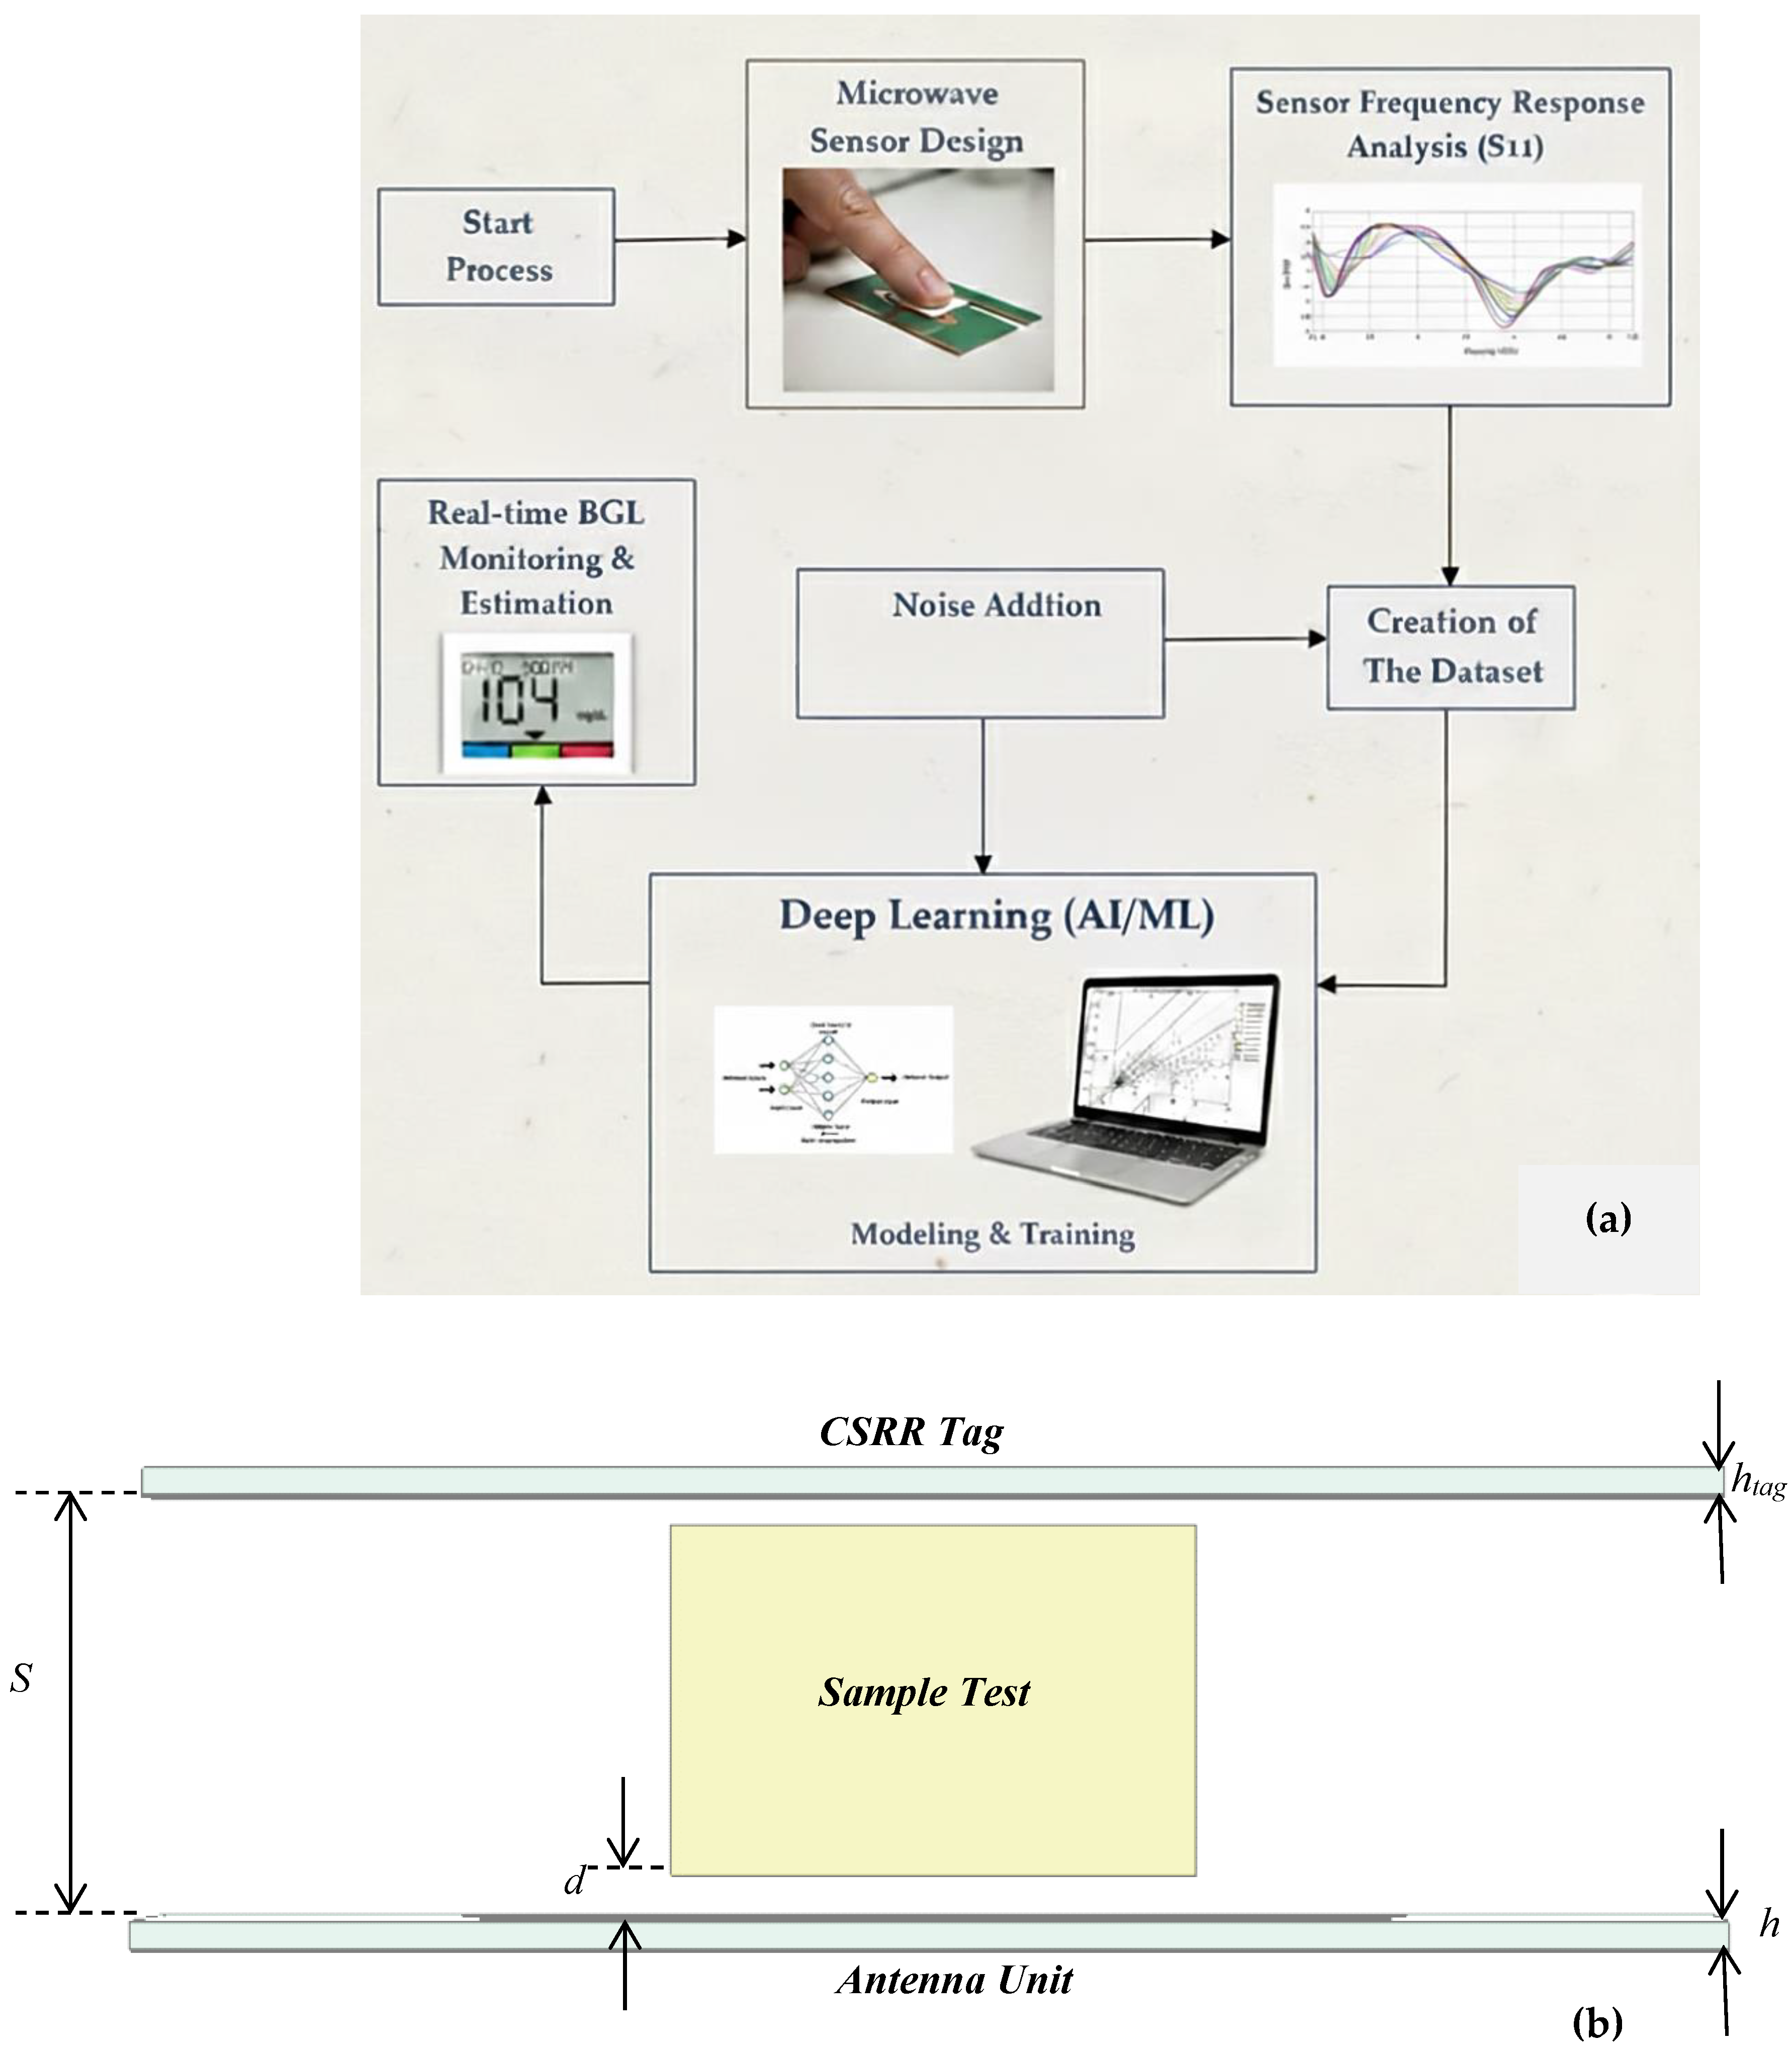
Figure 1a shows a block schematic of the designed system, which is based on measuring the resonating frequency of the microwave sensor by means of the return loss (S11 parameter) of the sensor antenna at several levels of human BGL. The BGL values are recorded, and the obtained data are analyzed in order to estimate BGL. As shown in Figure 1b, the proposed sensor construction consists of a simple, flexible, tri-band patch antenna that functions as a reader and a groundless complementary split-ring resonator (CSRR) metamaterial resonator that acts as a passive tag.

2.1. The Tag Unit Design

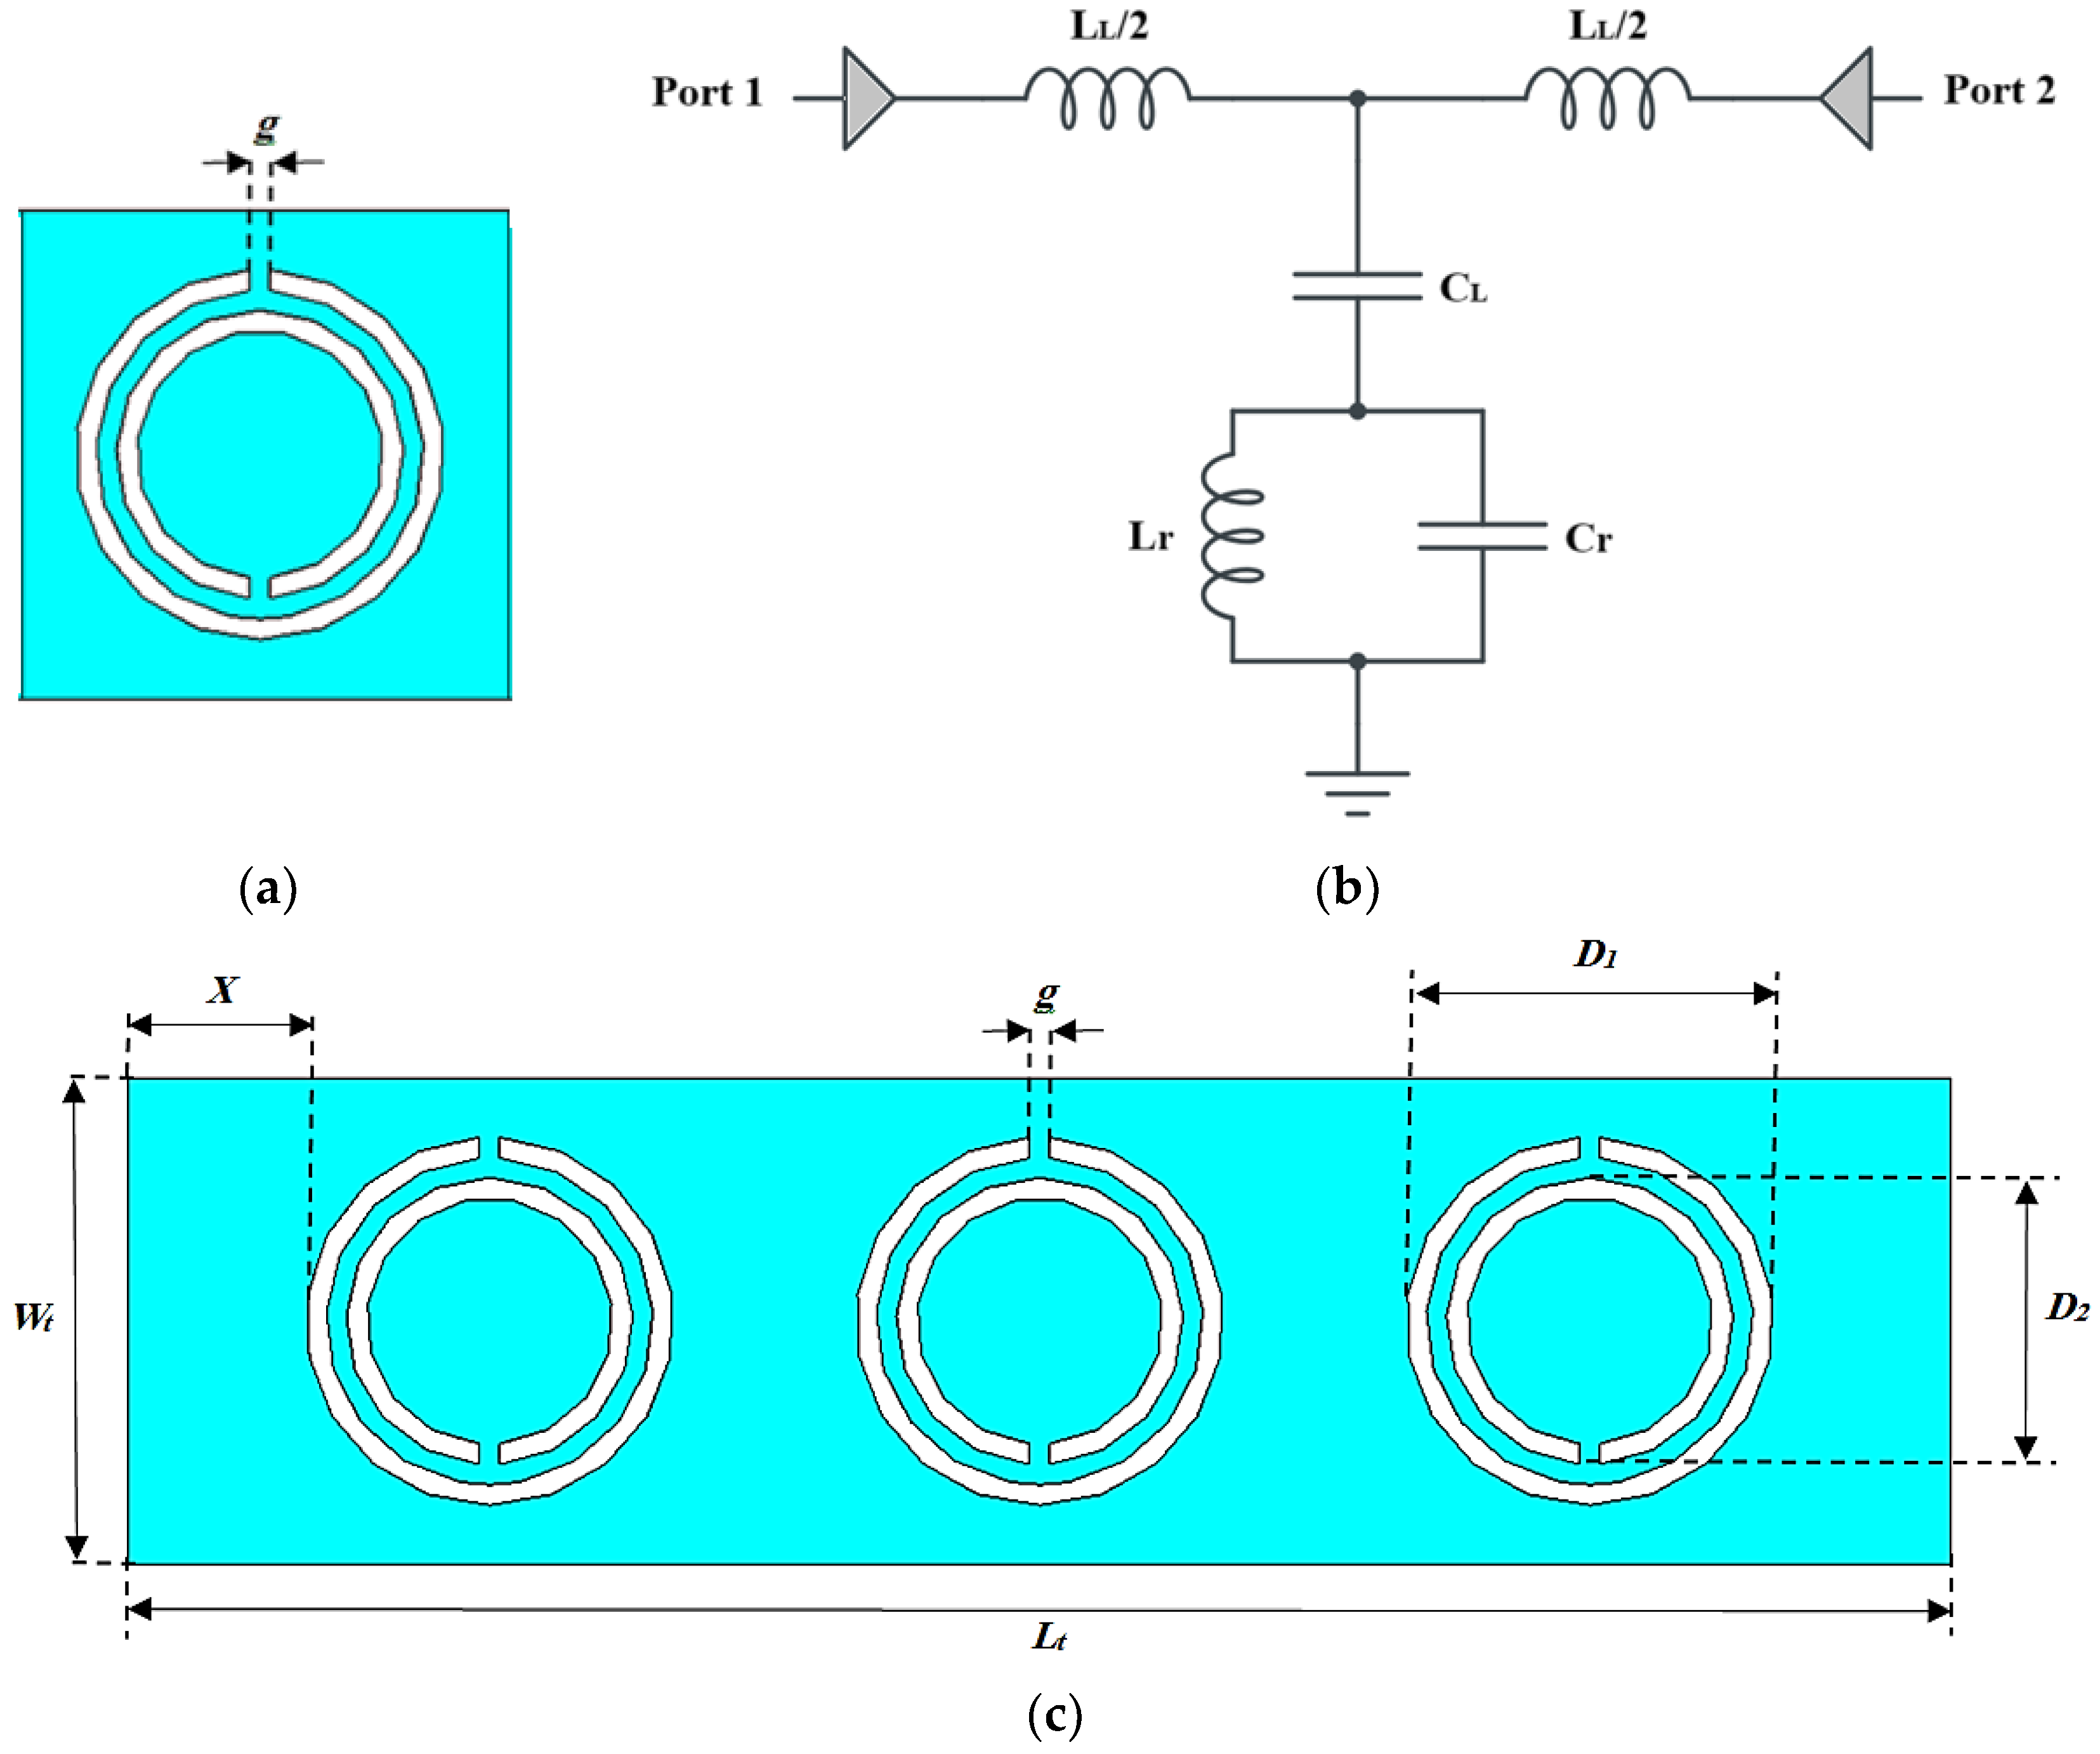
The fundamental geometry of the CSRR serves as the primary inspiration for the tag sensing structure. As seen in Figure 2, it is specifically made up of three identical cells of CSRRs arranged horizontally on the top layer of a dielectric substrate with dimensions of Lt, Wt, and ht, as shown in Table 1. The dielectric substrate is composed of FR4 material, which has a dielectric constant of 4.4 and a loss tangent of tanδ = 0.02. The distance between the unit cells is set at 13.5 mm. When the tag is electrically connected by the antenna radiation at the resonance frequency, an electric field with high localization and concentration will form along the tag surface in the near-field region. This procedure enables the sensor to pick up on a small change in the electromagnetic characteristics that characterize the varying glucose levels. Significant changes in the scattering response at the antenna port would also be induced by the connected finger, which would subsequently affect the distribution of the highly concentrated electric field in the tag. We extract the blood glucose measurement signature by further analyzing the fluctuations in the reflected signals.
ε = Y p j w = C c 1 w 2 L r C r 1 w 2 C L + C r L r f o r   ε < 0 : f s < f < f o
where ε is the complex dielectric constant f s = 1 2 π L R C L + C r , is the short circuit frequency that eliminates the parallel impedance, while f o = 1 2 π L r C r , is the open circuit frequency that eliminates the parallel admittance.

2.2. Antenna Design (Reader Unit)

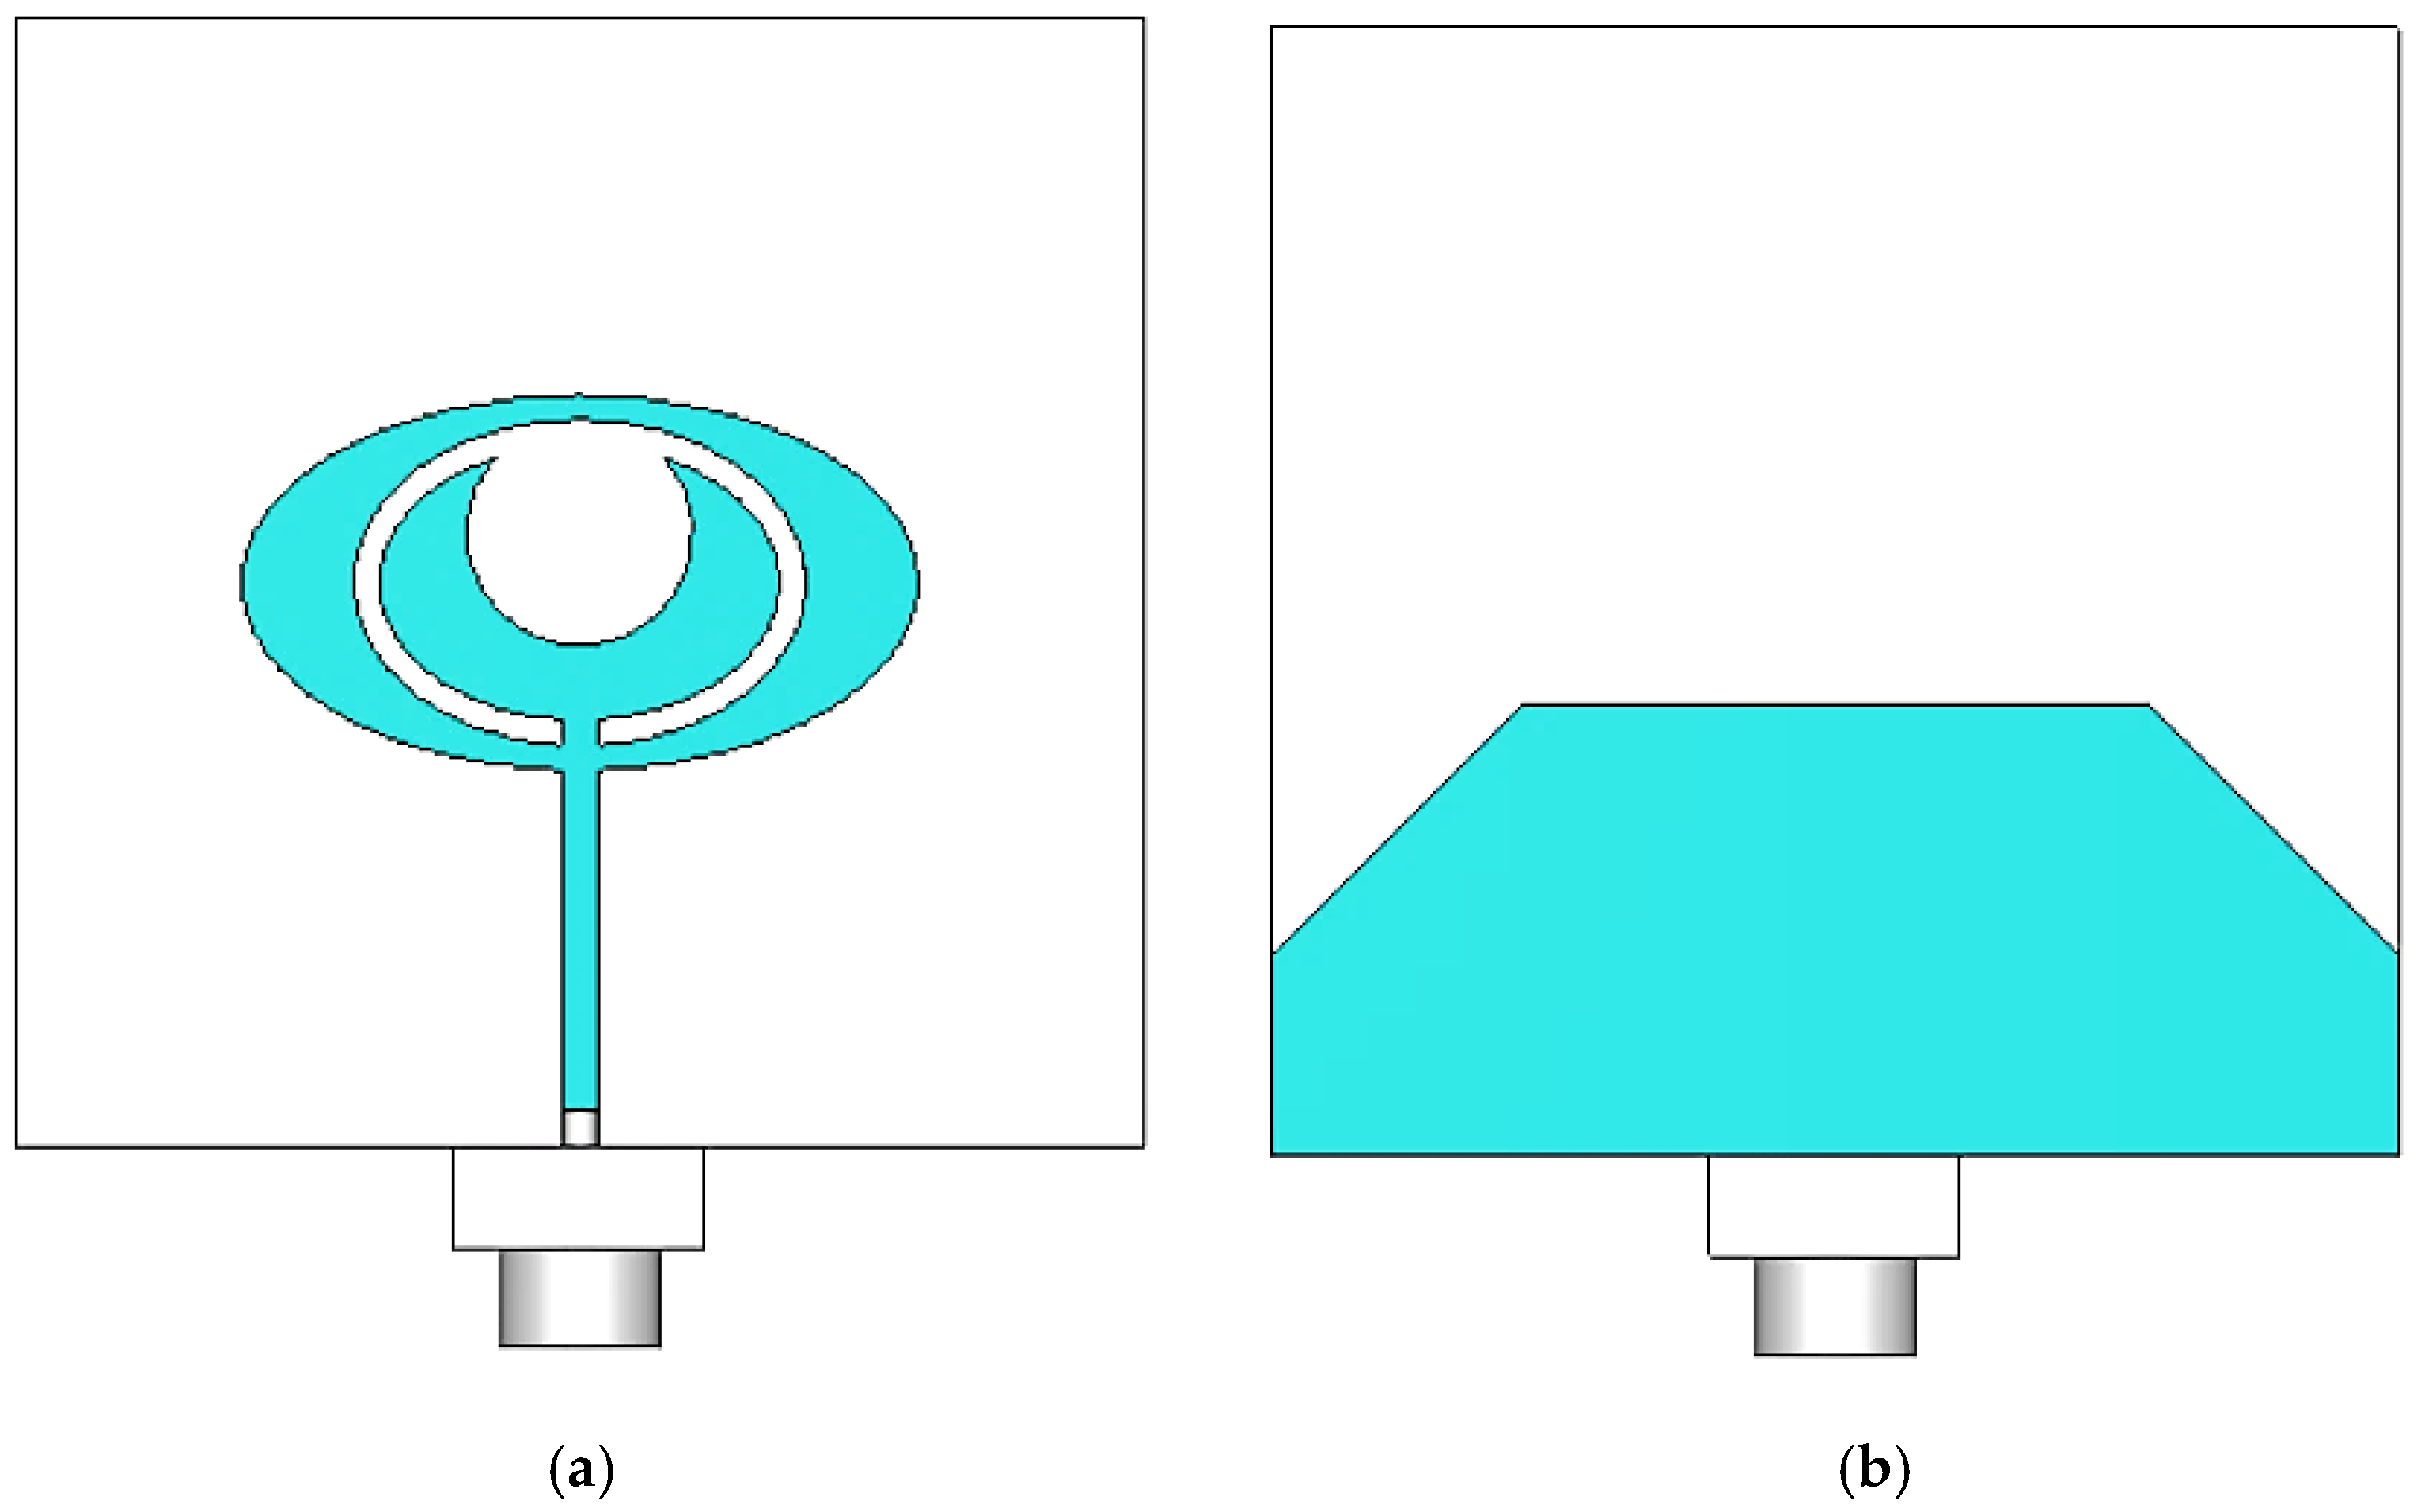
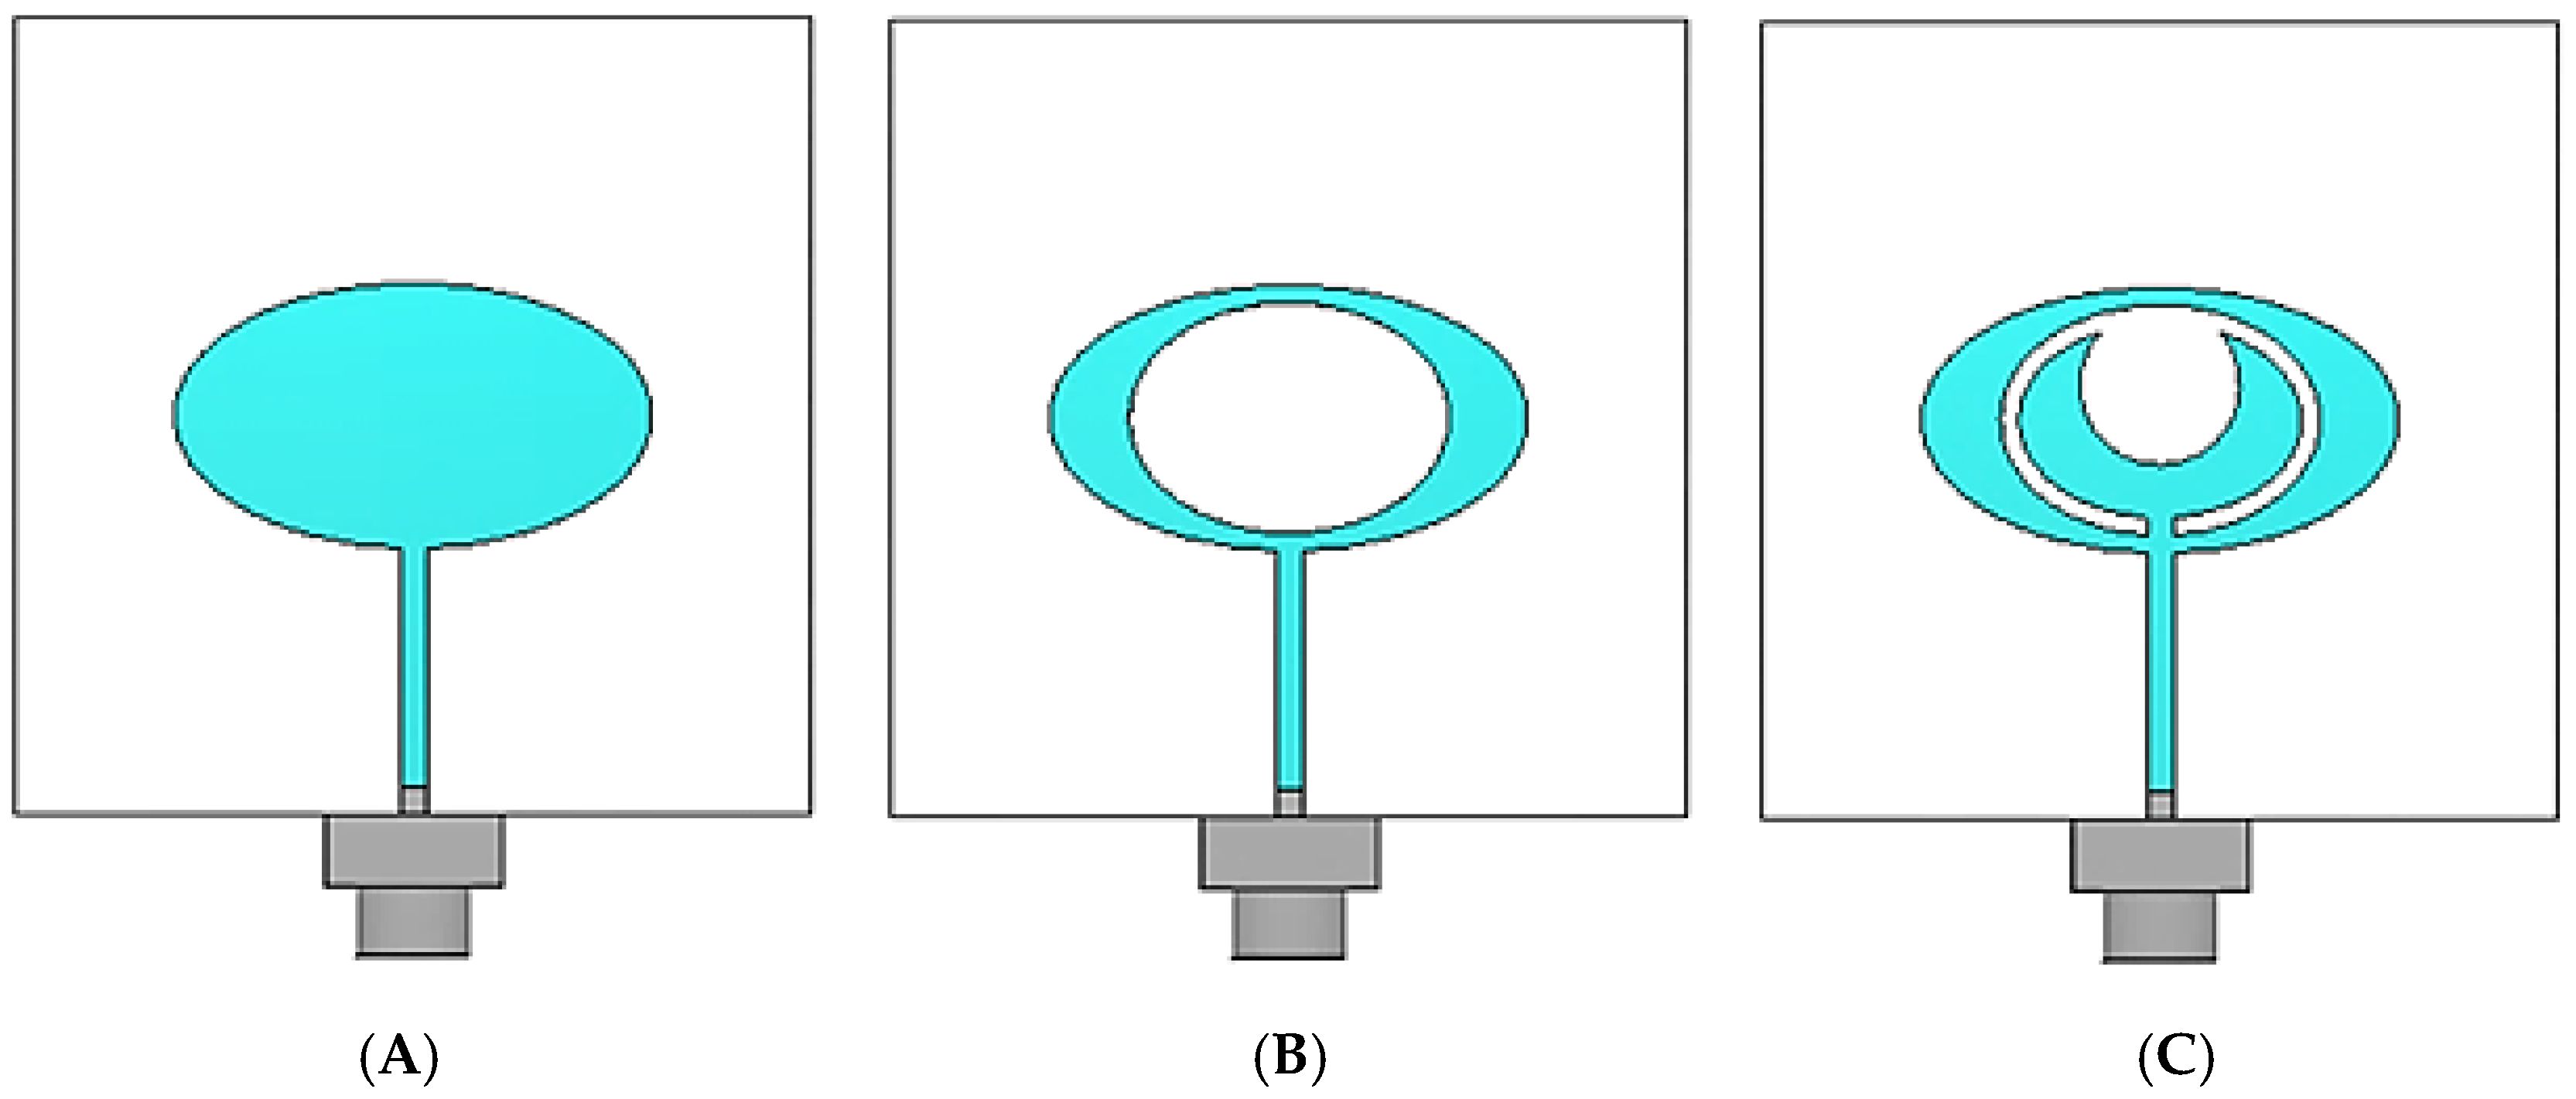
The proposed resonance radiator consists of a slotted elliptical-shaped patch antenna loaded by a crescent-shaped microstrip antenna, printed on an FR4 substrate (dielectric constant εr = 4.4 and loss tangent δ = 0.02). The antenna is fed by a microstrip line. The physical size of the proposed antenna resonator is Ws × Ls × h mm3, as illustrated in Figure 3. The proposed antenna is designed, studied, and optimized using numerical simulation software CST based on the Finite Integration Technique (FIT) method. Firstly, the design of the elliptical-shaped patch radiator is presented in Figure 4A to resonate around 6.8 GHz by using appropriate electrical dimensions. The elliptical patch has been analyzed using a variety of techniques, including the Hammerstad formula, Mathieu’s function, modified Mathieu’s function, and the variational method. The elliptical patch antenna is analyzed using the following equations provided by [29] in order to obtain the resonant frequency at fo:
r e f f = r 1 + 2 h π ε r l n a 2 h + 1.41 ε r + 1.77 + h a 0.268 ε r + 1.65 1 2
f o = X 11 2 π r ε e f f
r = a b
1 b 2 a 2 0 < e < 1
ε e f f = ε r + 1 2 + ε r 1 2 1 + 12 h W e q 1 2
where a and b are the semi-major and minor axes, respectively; reff is the effective radius, which is slightly larger than r due to radiation fringing at the patch edges; e is the eccentricity of the elliptical patch; X 11 = 1.8412; and w e q = 2 a b [30].
The present work proposes synthesizing and optimizing the elliptical antenna. In this paper, the major axis of the elliptical patch for a given value of eccentricity and other input parameters is calculated and optimized. The results are calculated and verified by using the CST simulator. Table 2 represents the calculated dimensions of the EMSA.
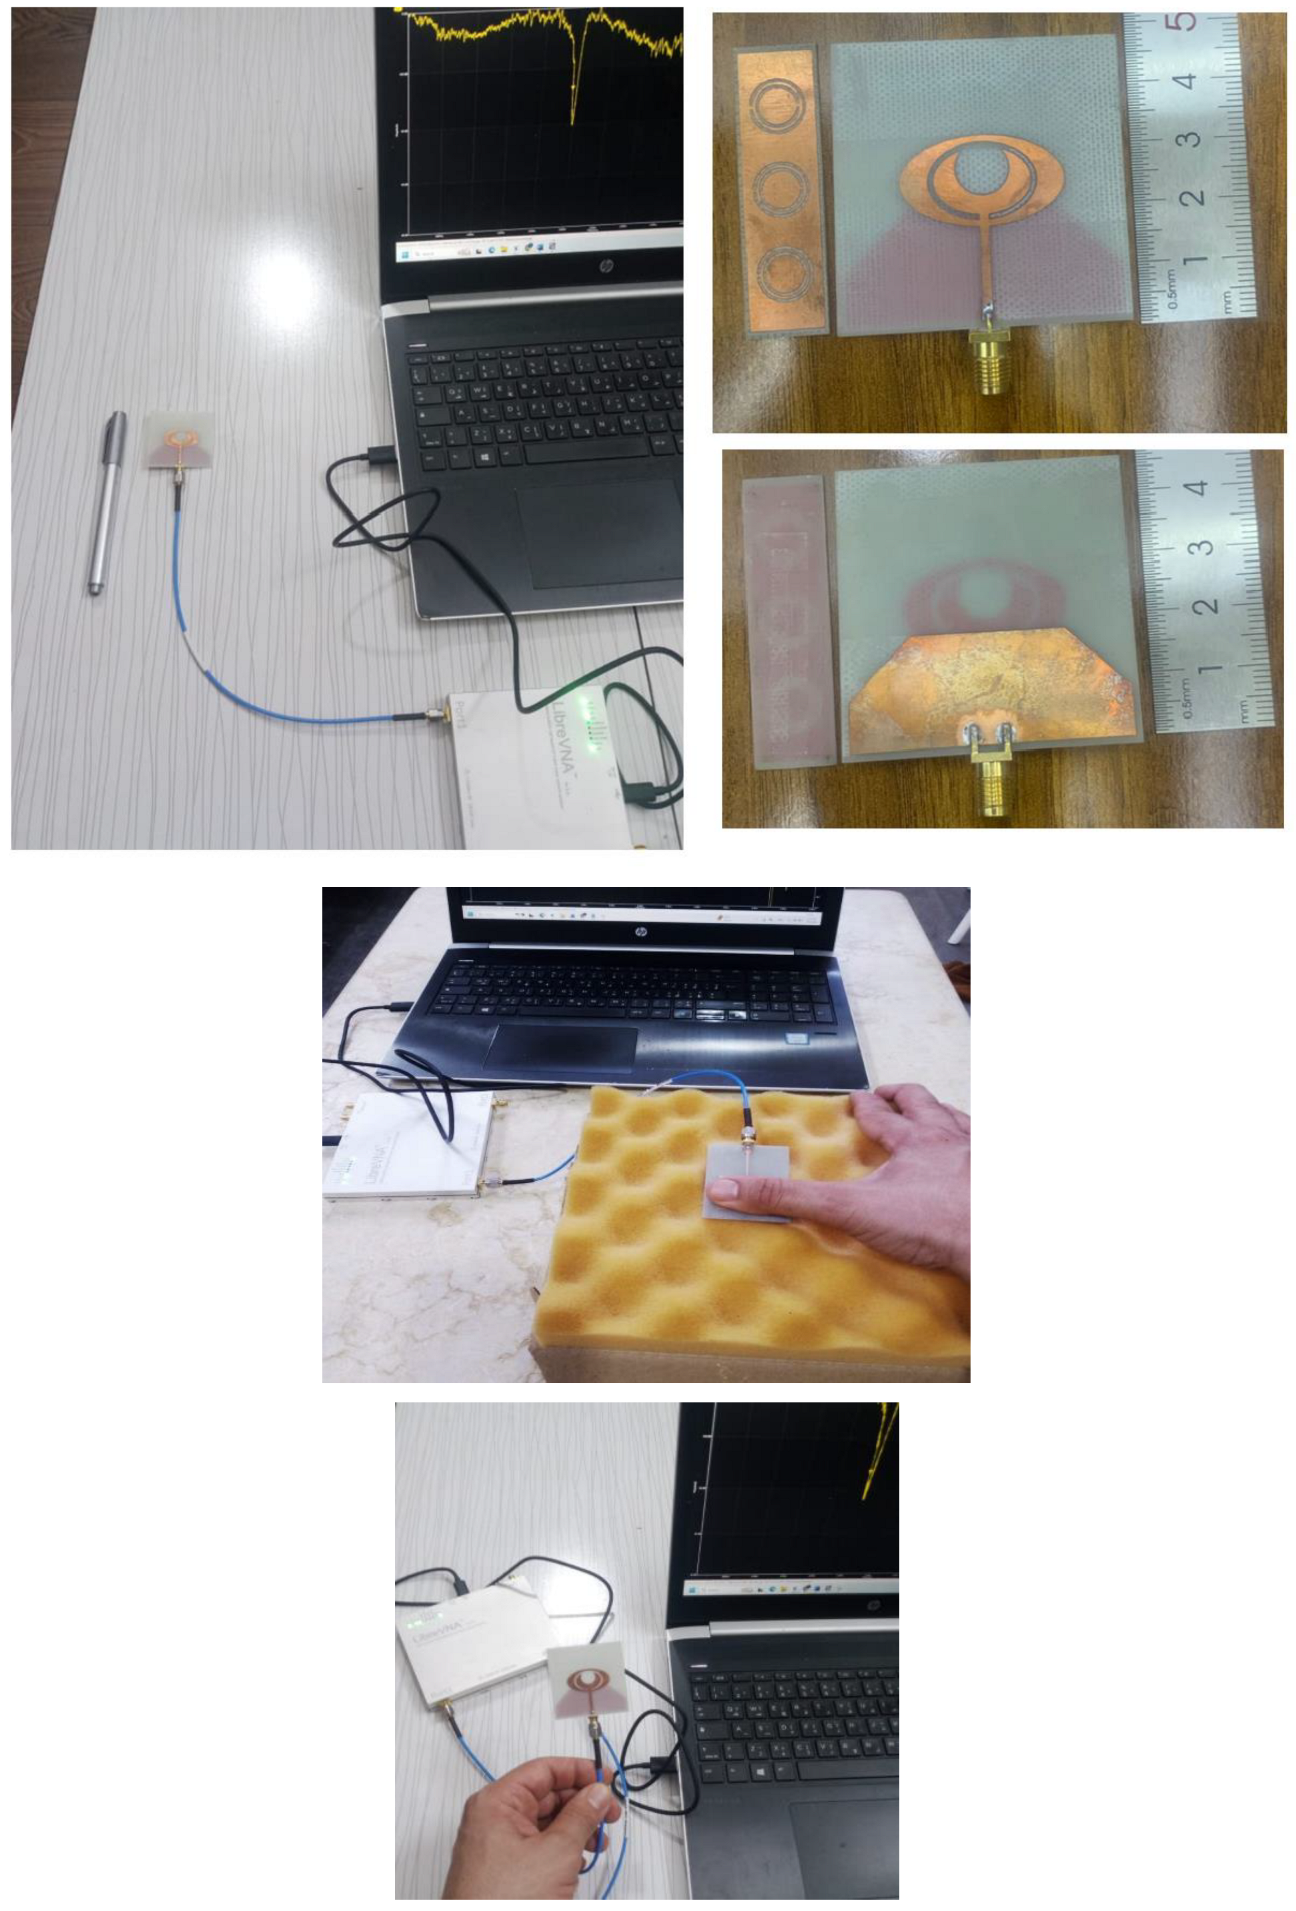
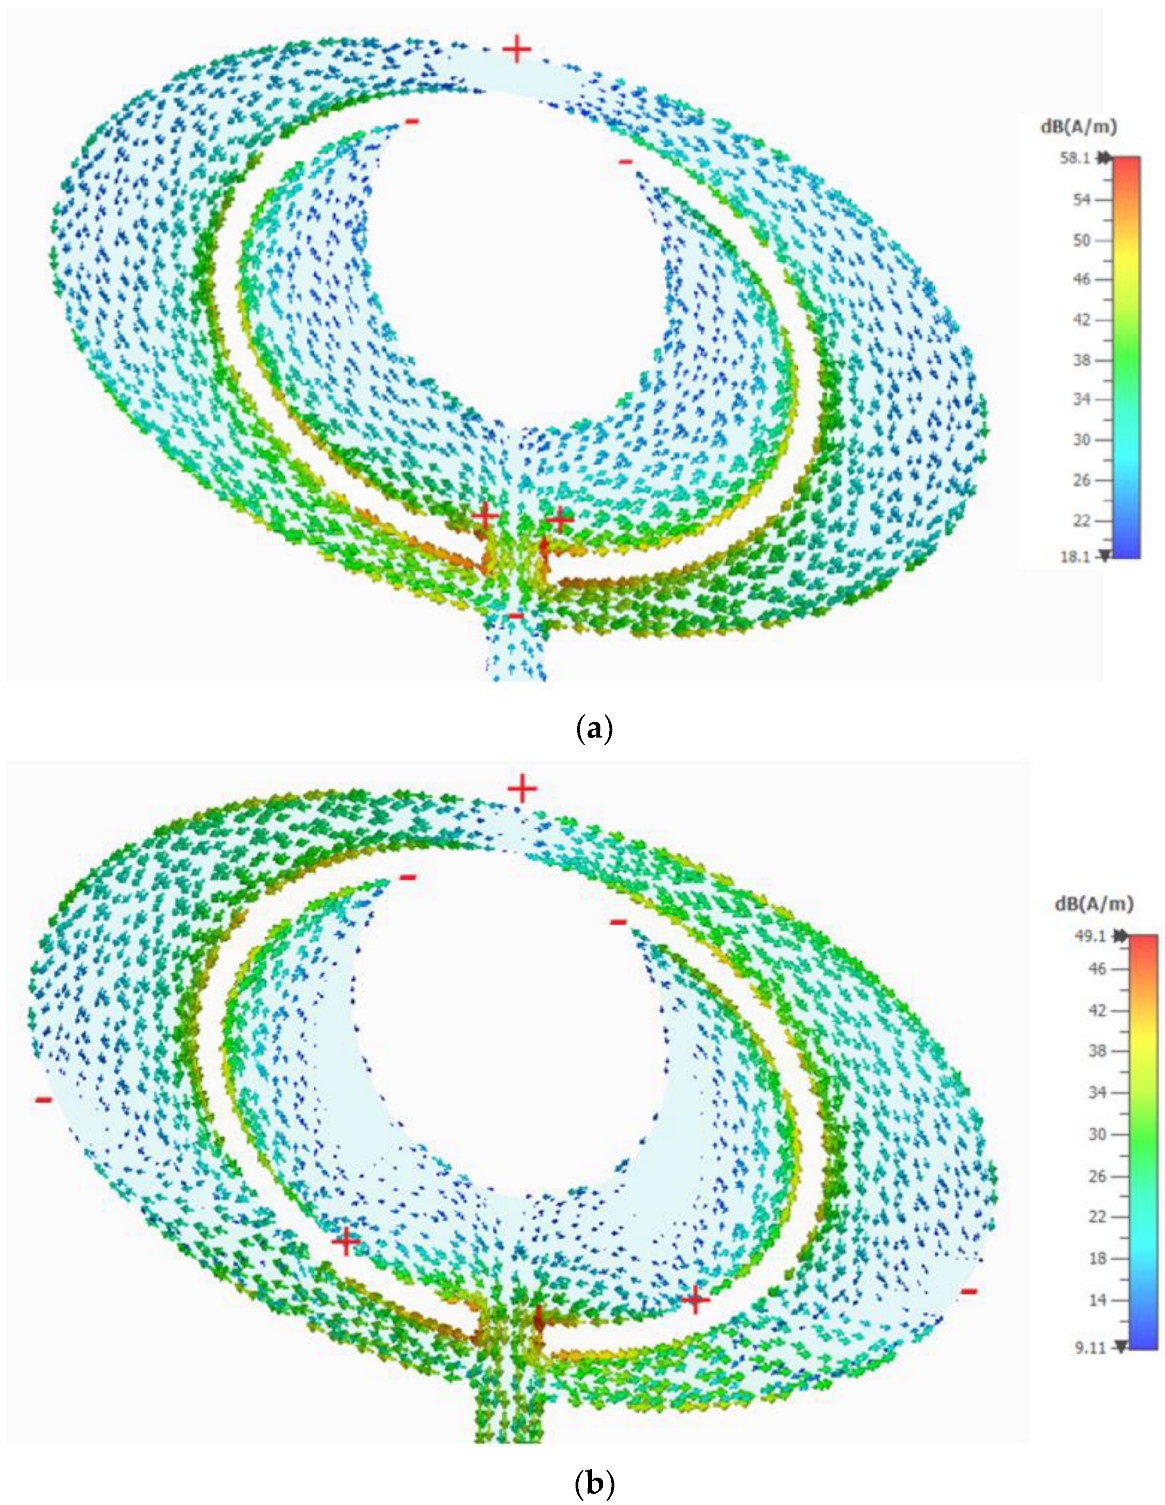
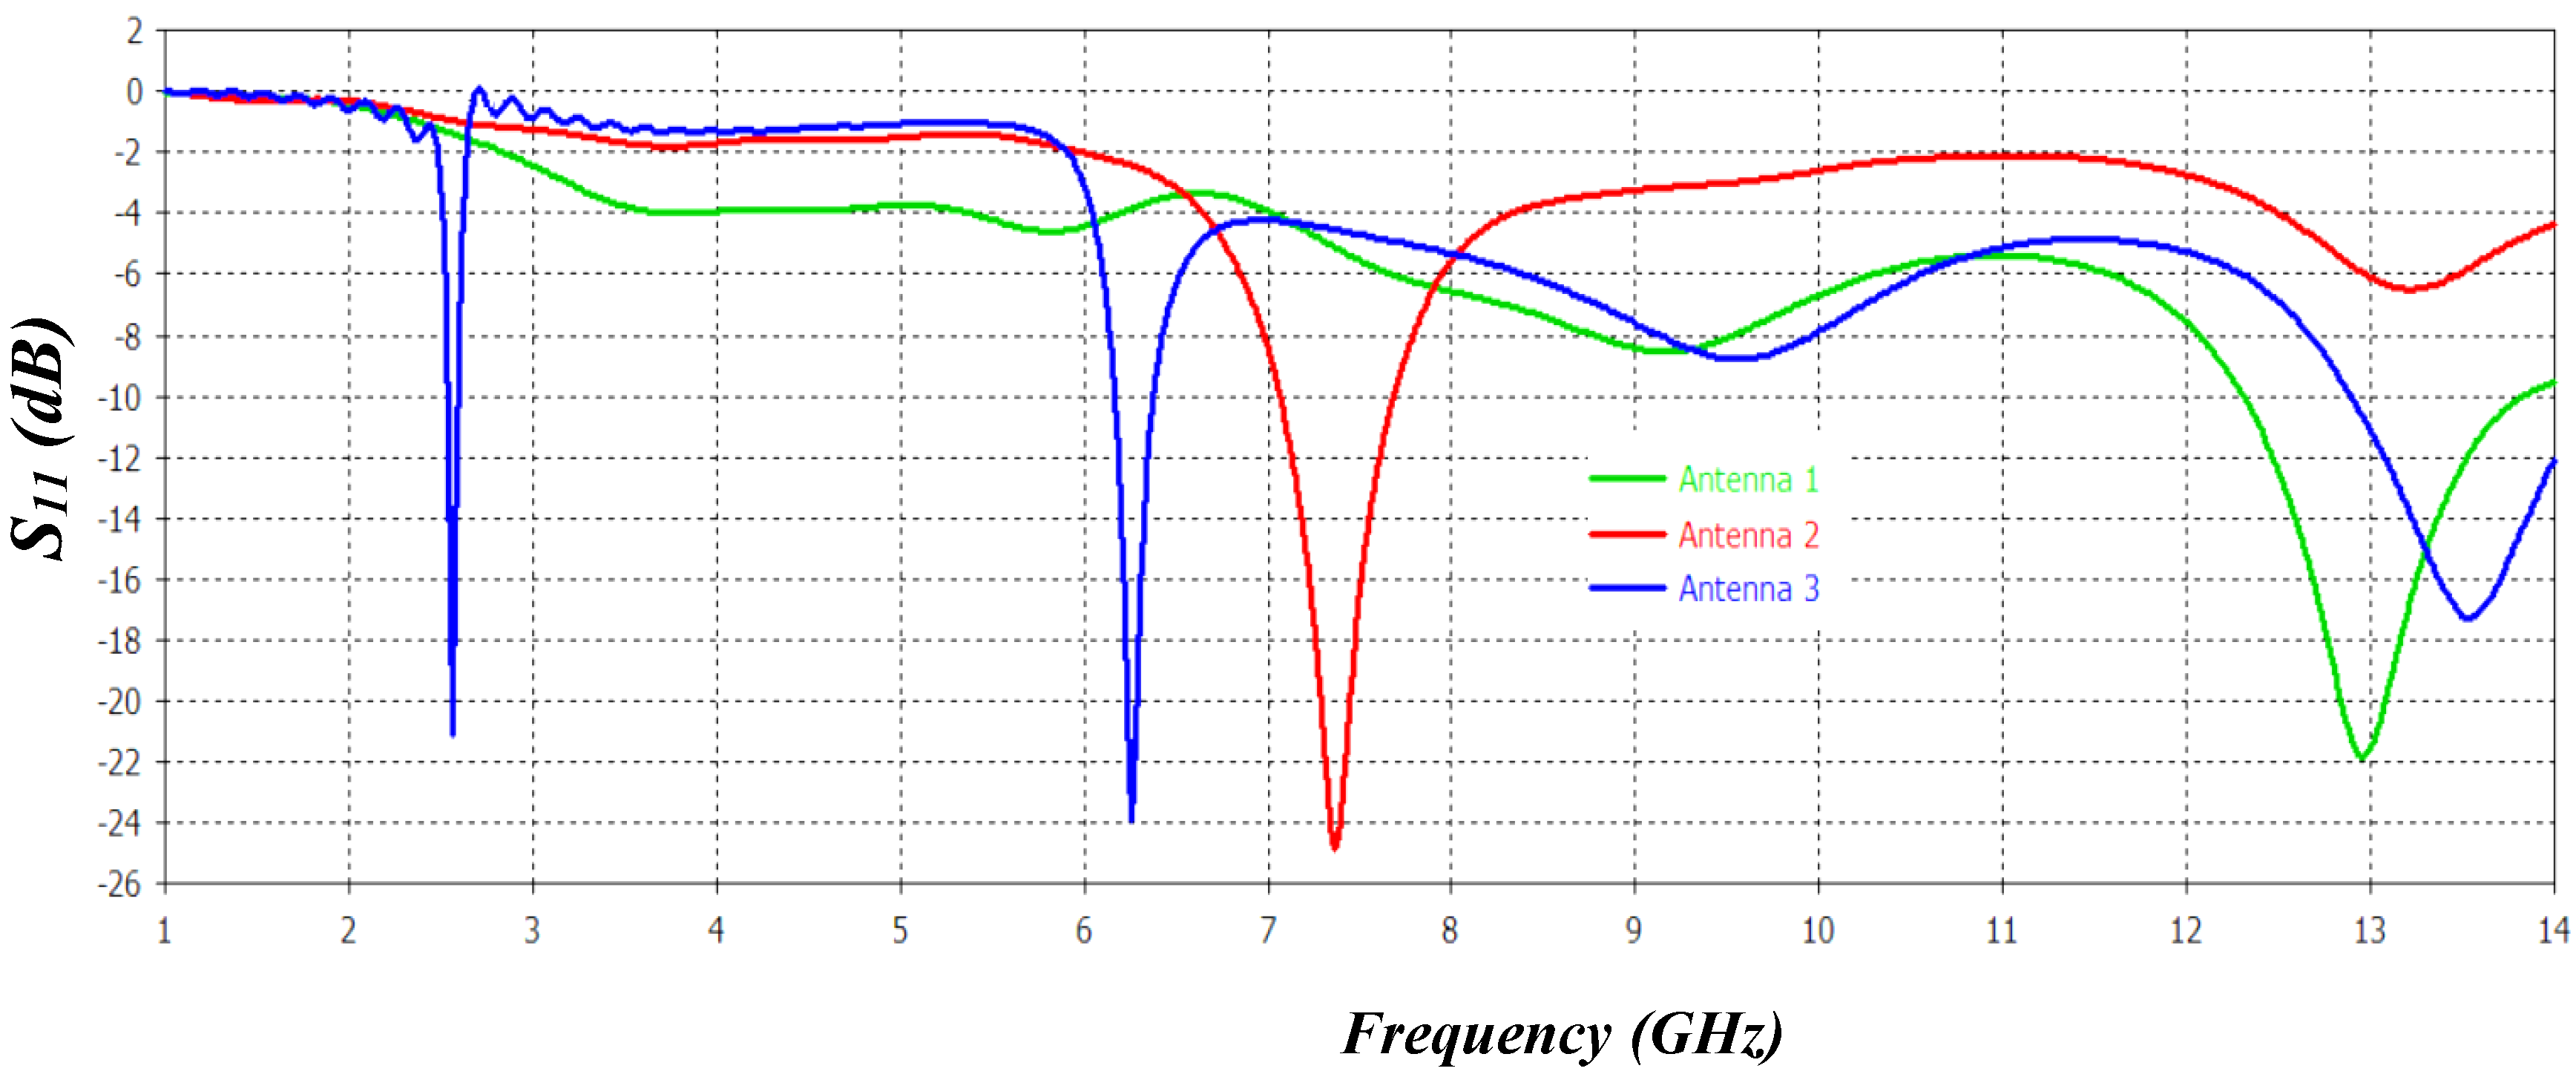
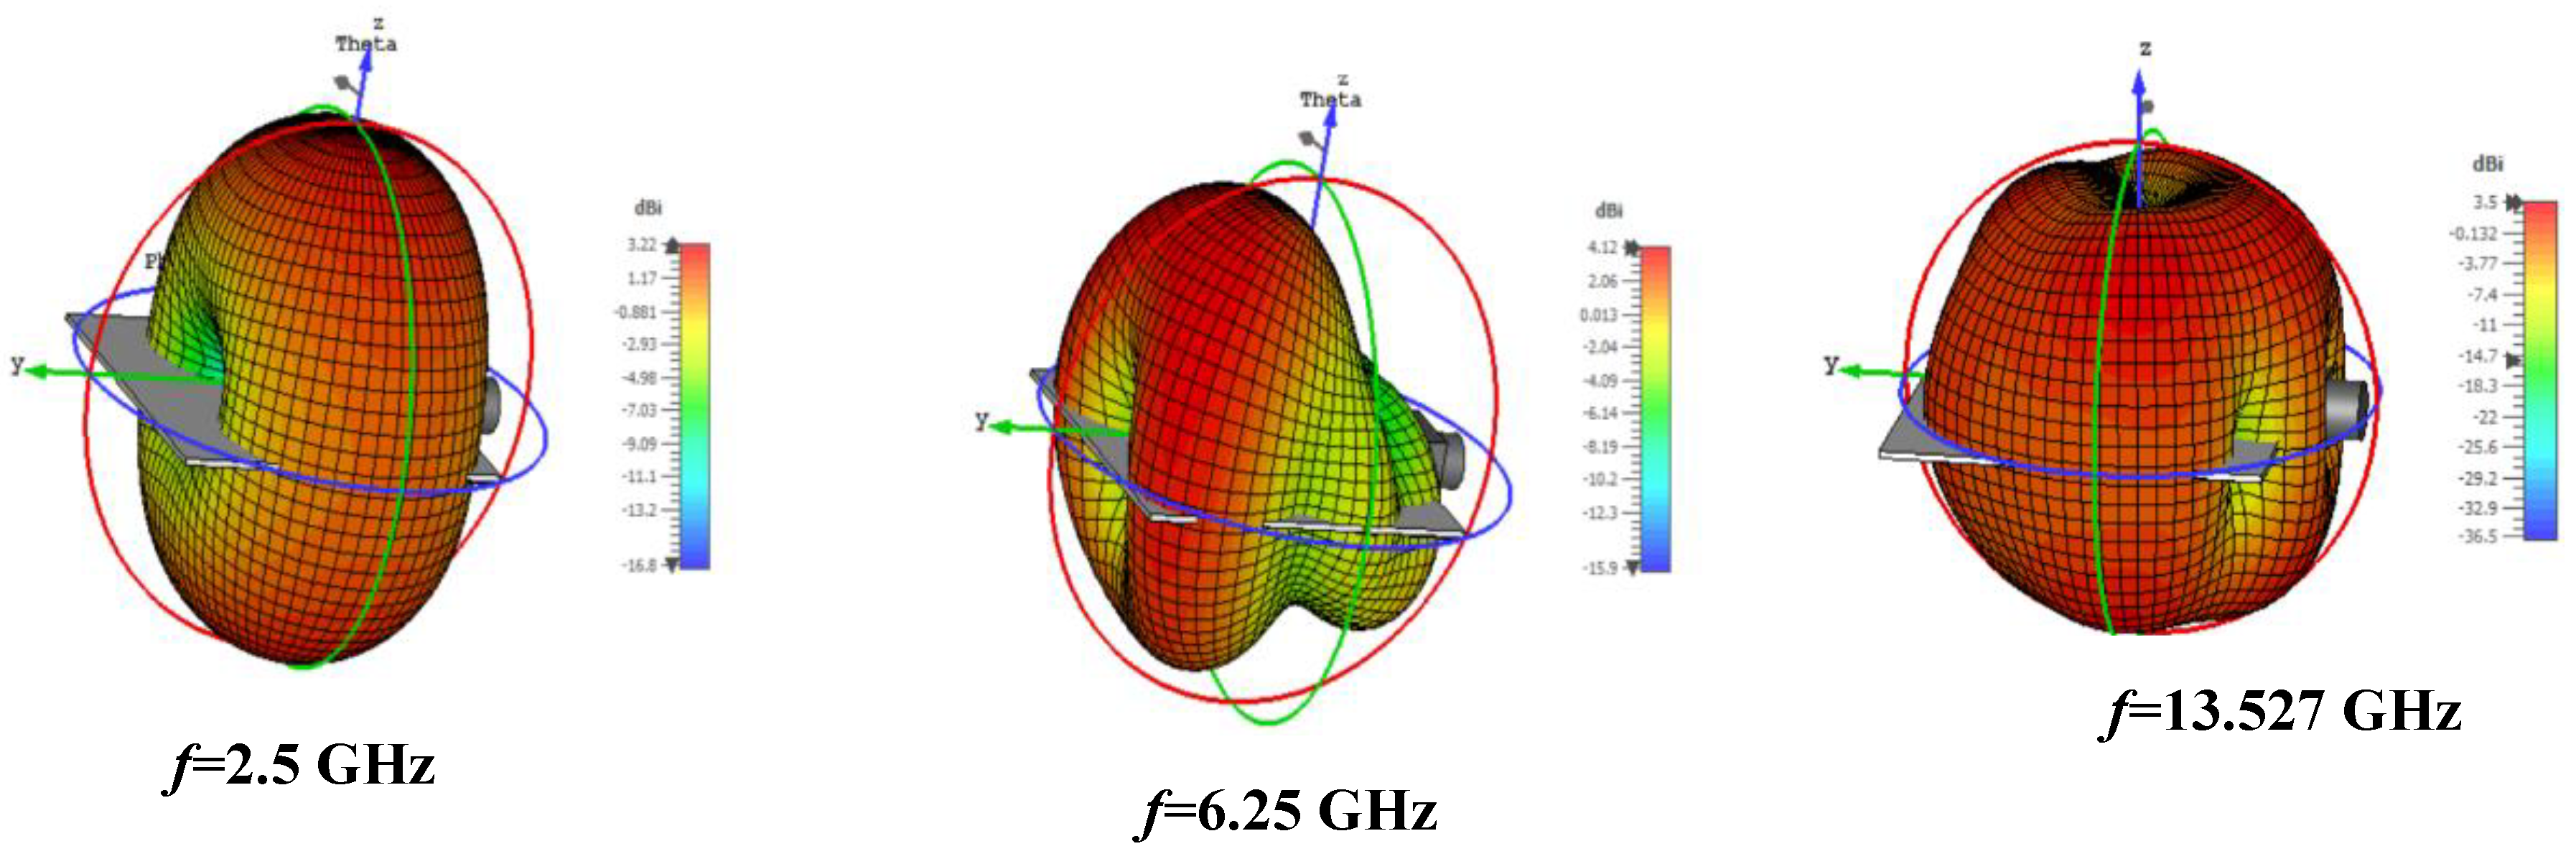
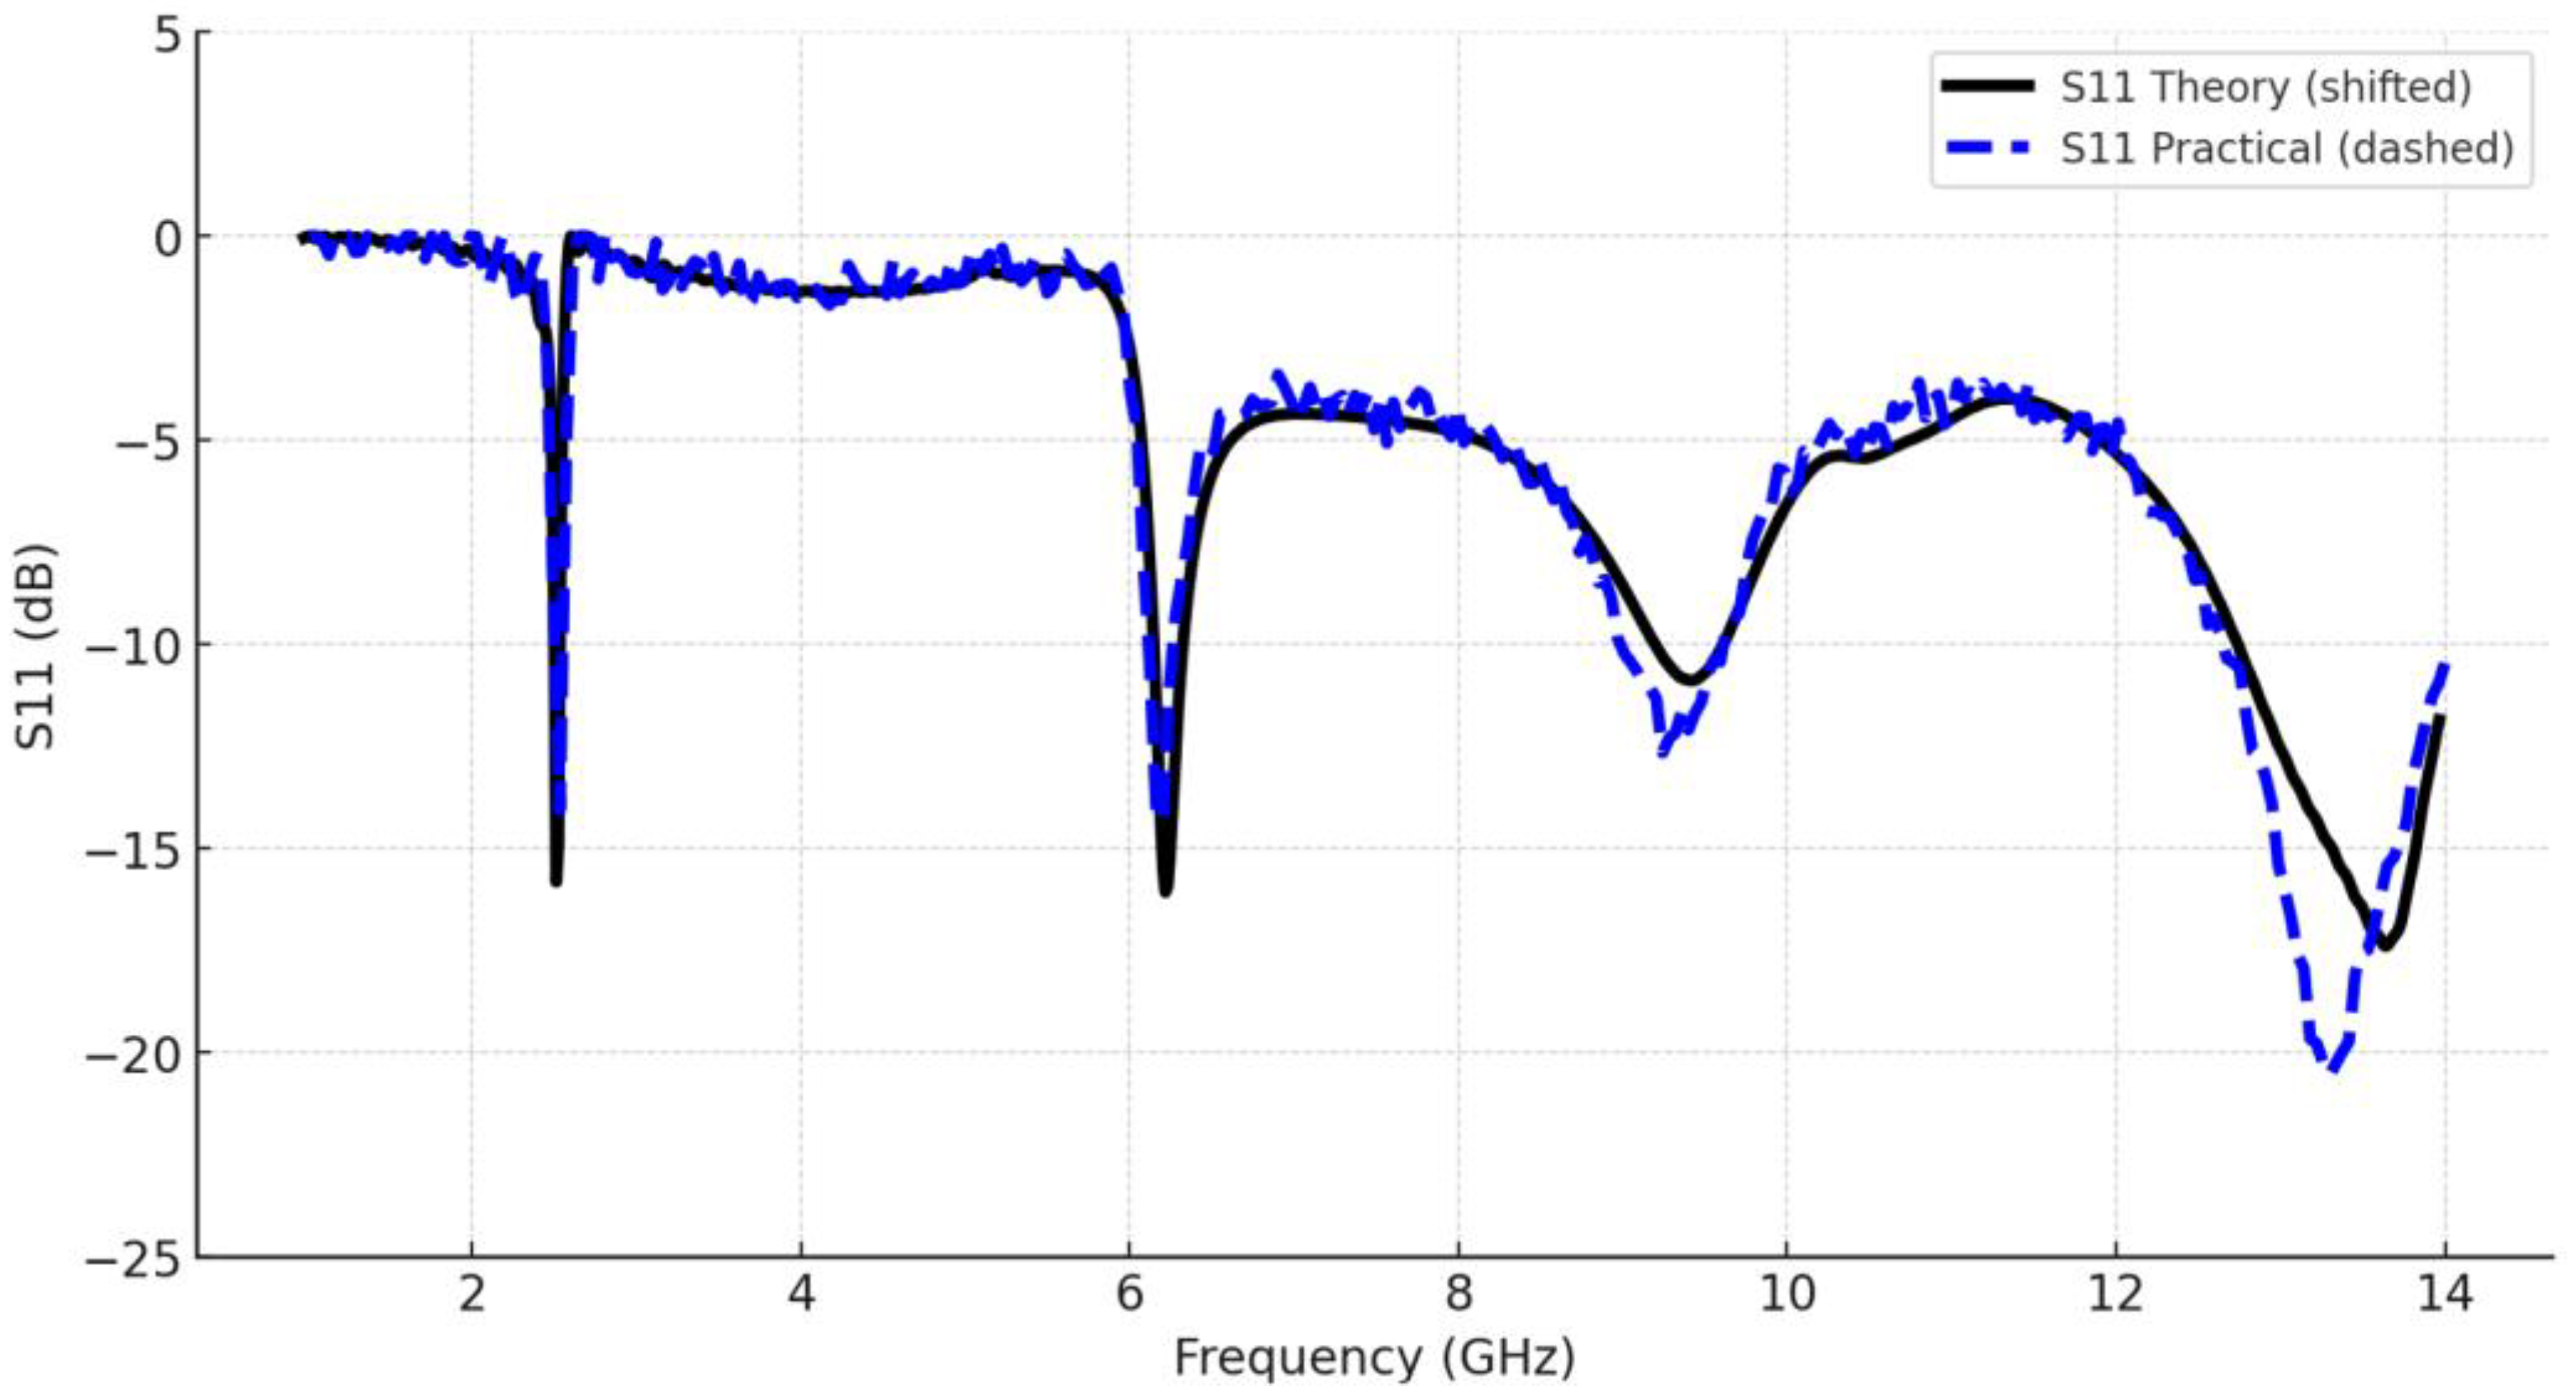
This configuration resonates at two frequency bands: 9.14 GHz has poor matching, while the second harmonic at 13 GHz has a low-quality factor of about 2.6 with 35% bandwidth. The above-mentioned EMSA was modified by etching an elliptical slot (Figure 4B) having a semi-major axis of 4.75 mm and a 0.68 eccentricity factor. Dual-band characteristics are achieved with the first band resonance at 7.33 GHz with an enhanced quality factor of about 11.6 with 9% fractional bandwidth, while the second band is at 13.2 GHz with poor matching in this band. Furthermore, by incorporating the crescent-shaped patch with optimized physical size (Figure 4C). The antenna is simulated for several values of “R” in order to examine the behavior of the resonant mode. Figure 5 displays the resonance surface current distribution at the measured resonant modes. The frequencies of the three resonant modes decrease with slot radius. Currents show integer multiples of half-wavelength fluctuations both inside and outside the patch at three resonant modes. As a result, these modes are called TMm0. In this case, the variation along the patch perimeter is denoted by index “m”, which has the integer values 1, 2, 3,…, or half-wavelength variations. In current plots, the field polarity is shown by the “+” and “−” signs. As shown in Figure 6. Triple band operation was observed at 2.57 GHz with a 44.3 quality factor and 2.2% bandwidth, 6.25 GHz with a 19.1 quality factor and 10.4% bandwidth, and 13.527 GHz with a 9.6 quality factor and 11% bandwidth. The 3D radiation pattern of the proposed EMSA is plotted in Figure 7 at three resonance frequencies. The maximum gain is recorded as 3.22 dB at f = 2.57 GHz, 4.15 dB at f = 6.25 GHz, and 3.55 dB at f = 13.527 GHz. Figure 8 shows the fabricated microwave resonator sensor and its measurement setup. The left image illustrates the complete experimental configuration, where the sensor is connected to a vector network analyzer (VNA) and a laptop for S-parameter acquisition. The right images present the front and back views of the fabricated sensor on an FR-4 substrate, along with a scale for physical dimension reference. This setup is used to experimentally validate the sensor performance and compare it with the theoretical simulation results. Figure 9 illustrates a direct comparison between the simulated (theoretical) and measured (experimental) S11 responses of the proposed microwave resonator sensor over a wide frequency range. The black solid line represents the simulation results, while the blue dashed line shows the measured data. Both curves exhibit good agreement in terms of resonance frequencies and overall response shape, with minor discrepancies attributed to fabrication tolerances, material property variations, and measurement setup losses. This close correlation confirms the accuracy of the design and validates the sensor’s electromagnetic performance under real-world conditions.
The fabricated sensor was connected to a vector network analyzer (Libre VNA) and tested under controlled laboratory conditions. The fingertip was gently placed on the sensor’s sensing region to emulate non-invasive measurement conditions. A low-loss dielectric foam block was used beneath the sensor to minimize unwanted reflections and mechanical vibrations, thereby ensuring a stable electromagnetic environment during the measurement process. The foam material also provides mechanical support and mimics the thermal and dielectric boundary conditions typically encountered in practical wearable applications.

3. Phantom Description

To make numerical analysis easier, it is appropriate to build the phantom by striking a balance between the physical target description and complexity. To achieve this, we scrutinize a phantom featuring four layers—skin, fat, blood, and muscle—commonly utilized in the literature [31]. Given the minuscule size of the sensors in question, the assumed angularity of the interfaces between the different tissue layers makes logical sense. The phantom’s transverse size, as well as the dielectric and conductivity of the layers, are altered based on the detecting area and operating frequencies of the several sensors in question. In particular, we determine the properties of the skin, fat, muscle, and bone layers using the four-pole Cole–Cole dielectric model outlined in [32]. Rather, we employ the blood layer model outlined in [33]. As mentioned before, we want to see how the sensors respond when the nominal attributes are not the same as the phantom attributes. In the analysis that follows, the properties of the layers of skin, fat, muscle, bone, and blood will be altered. Of course, the proposed analysis still requires multi-parametric study. A tissue’s spectrum could be more clearly described using several Cole–Cole dispersions as follows:
ε ^ w , g = ε ω , g j ε ω , g = ε + n Δ ε n 1 + j w τ n 1 α n + σ i j w ε o
where ε ^ w is the complex permittivity as a function of angular frequency ω,
  • ε is the permittivity at very high frequencies;
  • Δ ε n is the permittivity difference for each relaxation process n;
  • τ n is the relaxation time for each process n;
  • α n is the fractional order parameter, representing non-ideal relaxation behavior for process n;
  • σ I is the ionic conductivity.
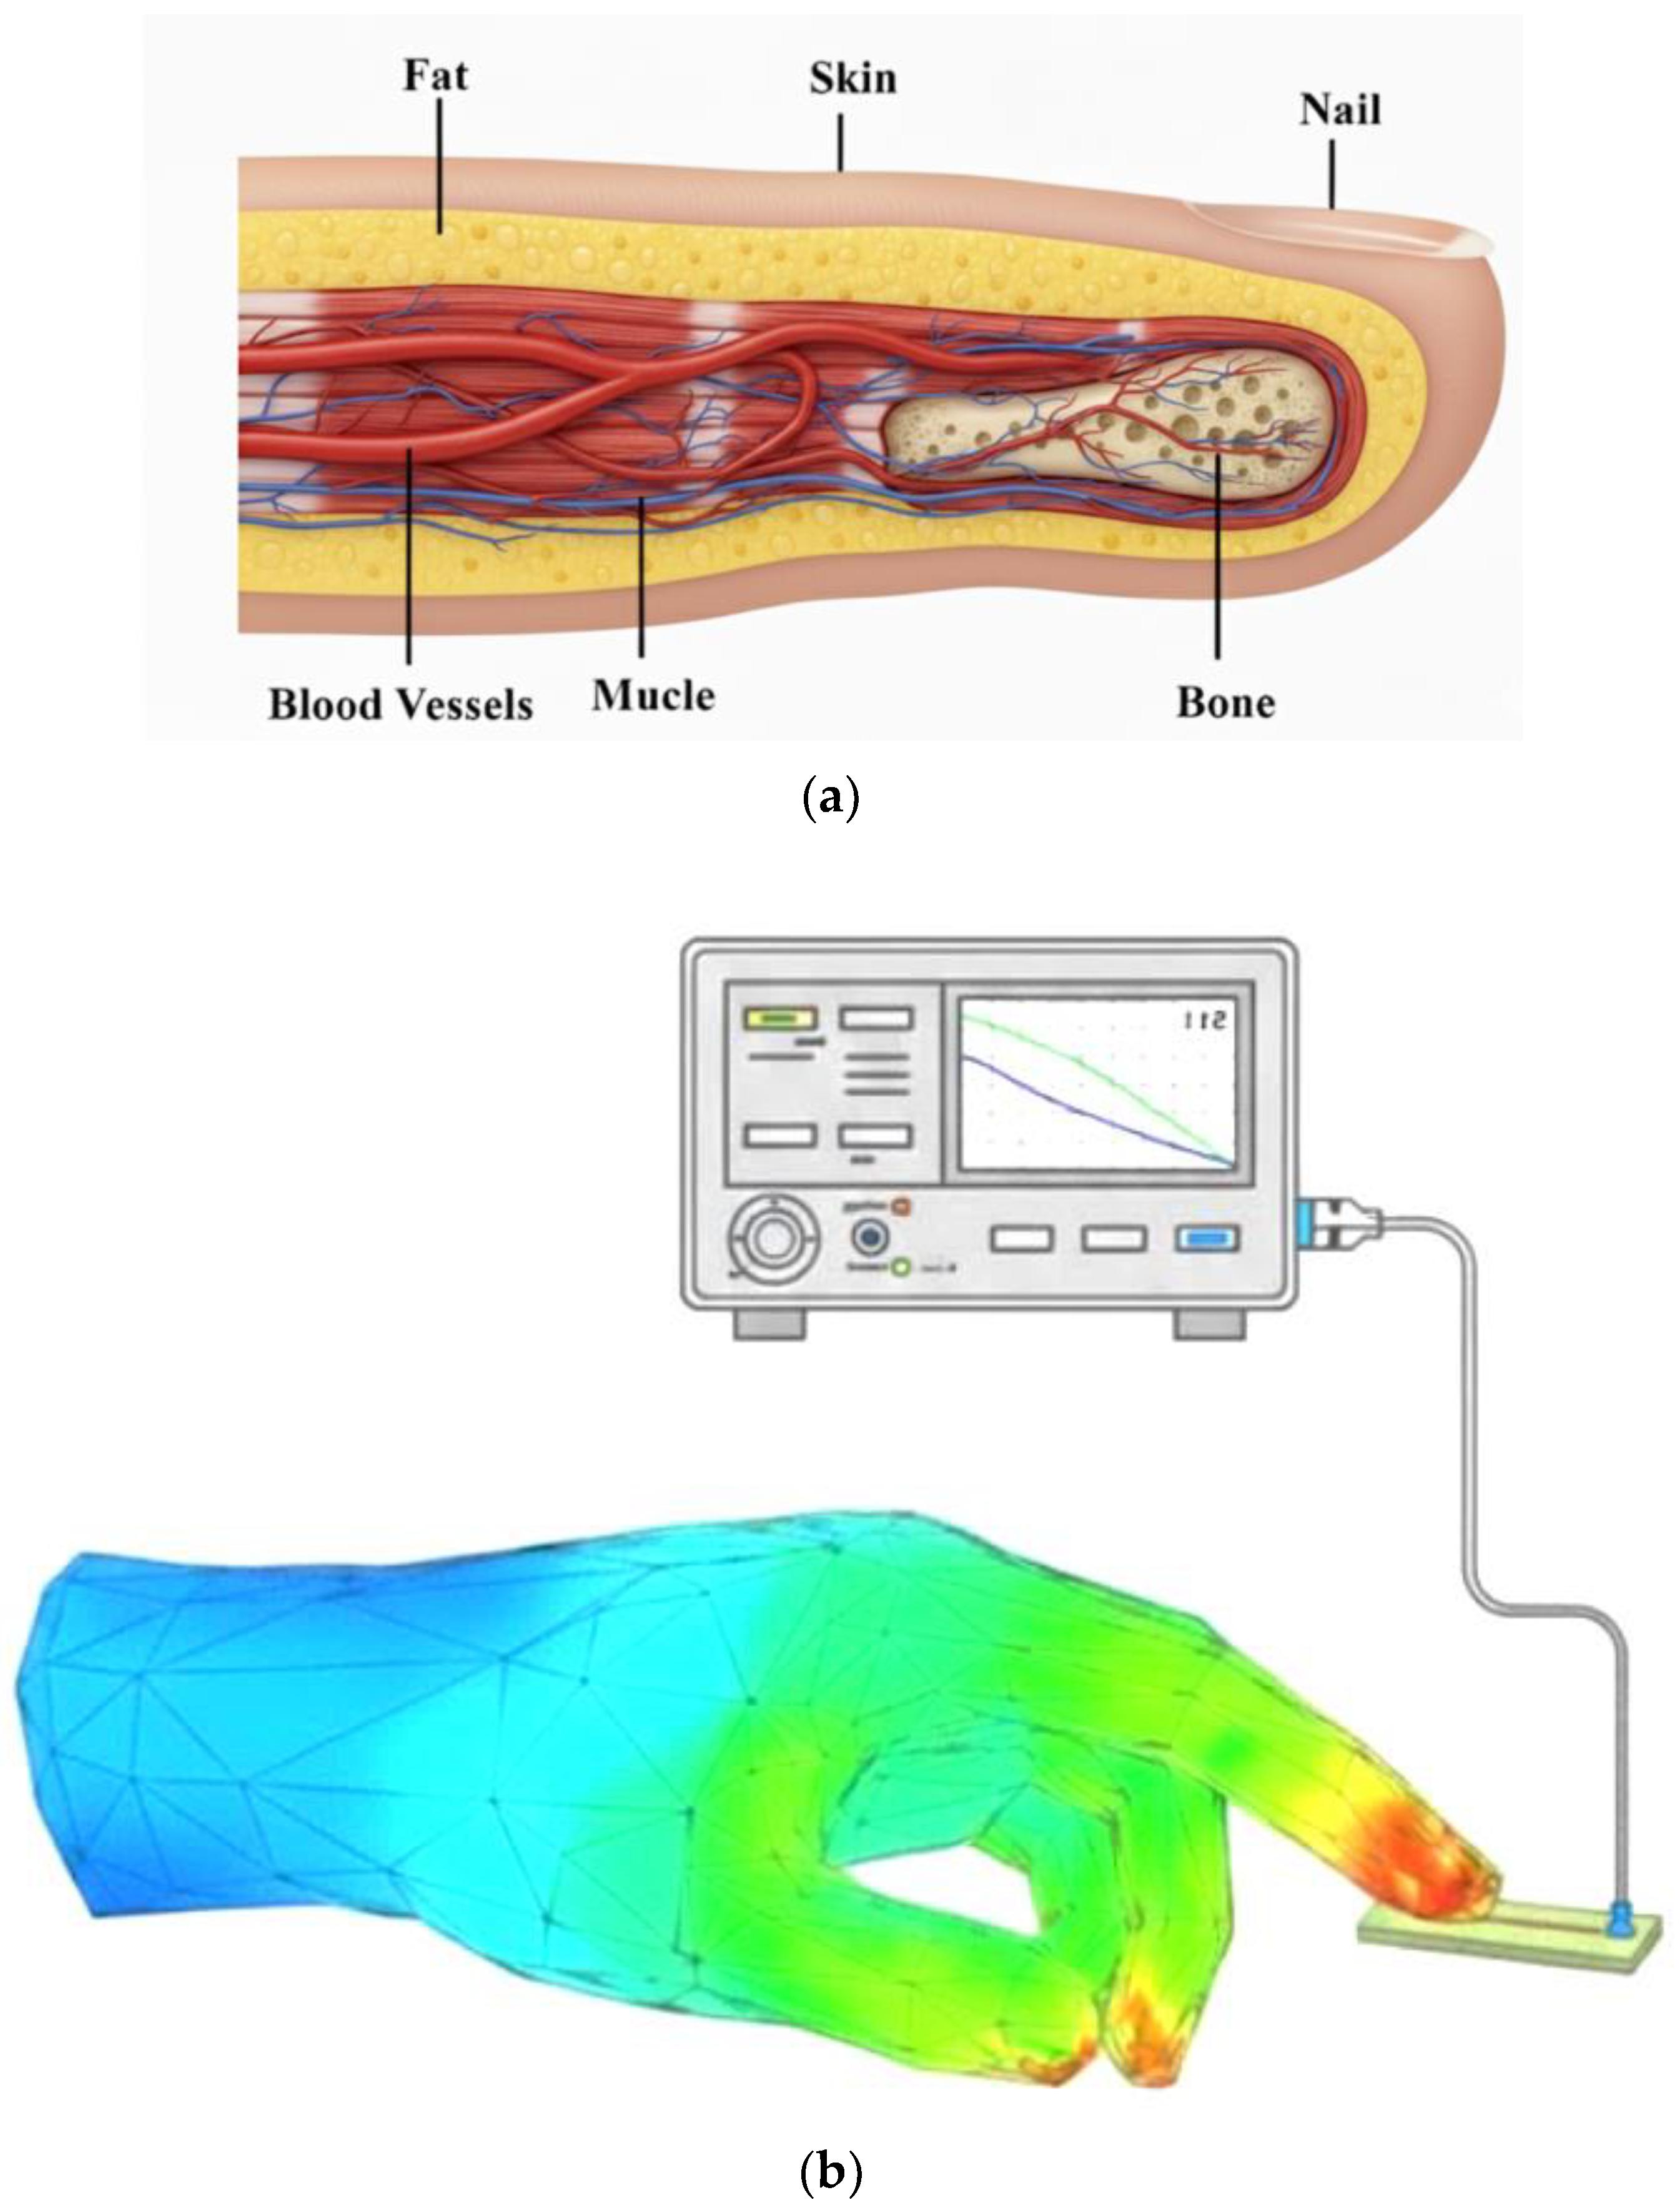
This model can be used to forecast the dielectric behavior across the desired frequency range by selecting parameters that are suitable for particular tissue. The parameters mentioned in Equation (1) are related to conductivity due to ionic drift and the mechanisms of low-frequency polarization. At higher frequencies, the spectrum was fitted to Equation (7) using a least-squares minimization procedure. The resulting dispersion parameters (summarized in Table 3) provide insights into the dielectric response of tissue water. This analysis was conducted in the frequency range above 400 MHz to capture the response of all tissue water. The water content in the tissues studied ranged from over 95% in the vitreous humor and over 85% in the retina to less than 20% in cortical bone. The Cole–Cole model parameters were determined for four biological tissue layers, including skin, fat, muscle, capillary blood vessels, and bone, with corresponding thicknesses of 1 mm for the skin, 0.5 mm for the fat layer, 0.4 mm for the muscle, 1.5 mm for the capillary blood vessels, and 3 mm for the bone, as shown in Figure 10.
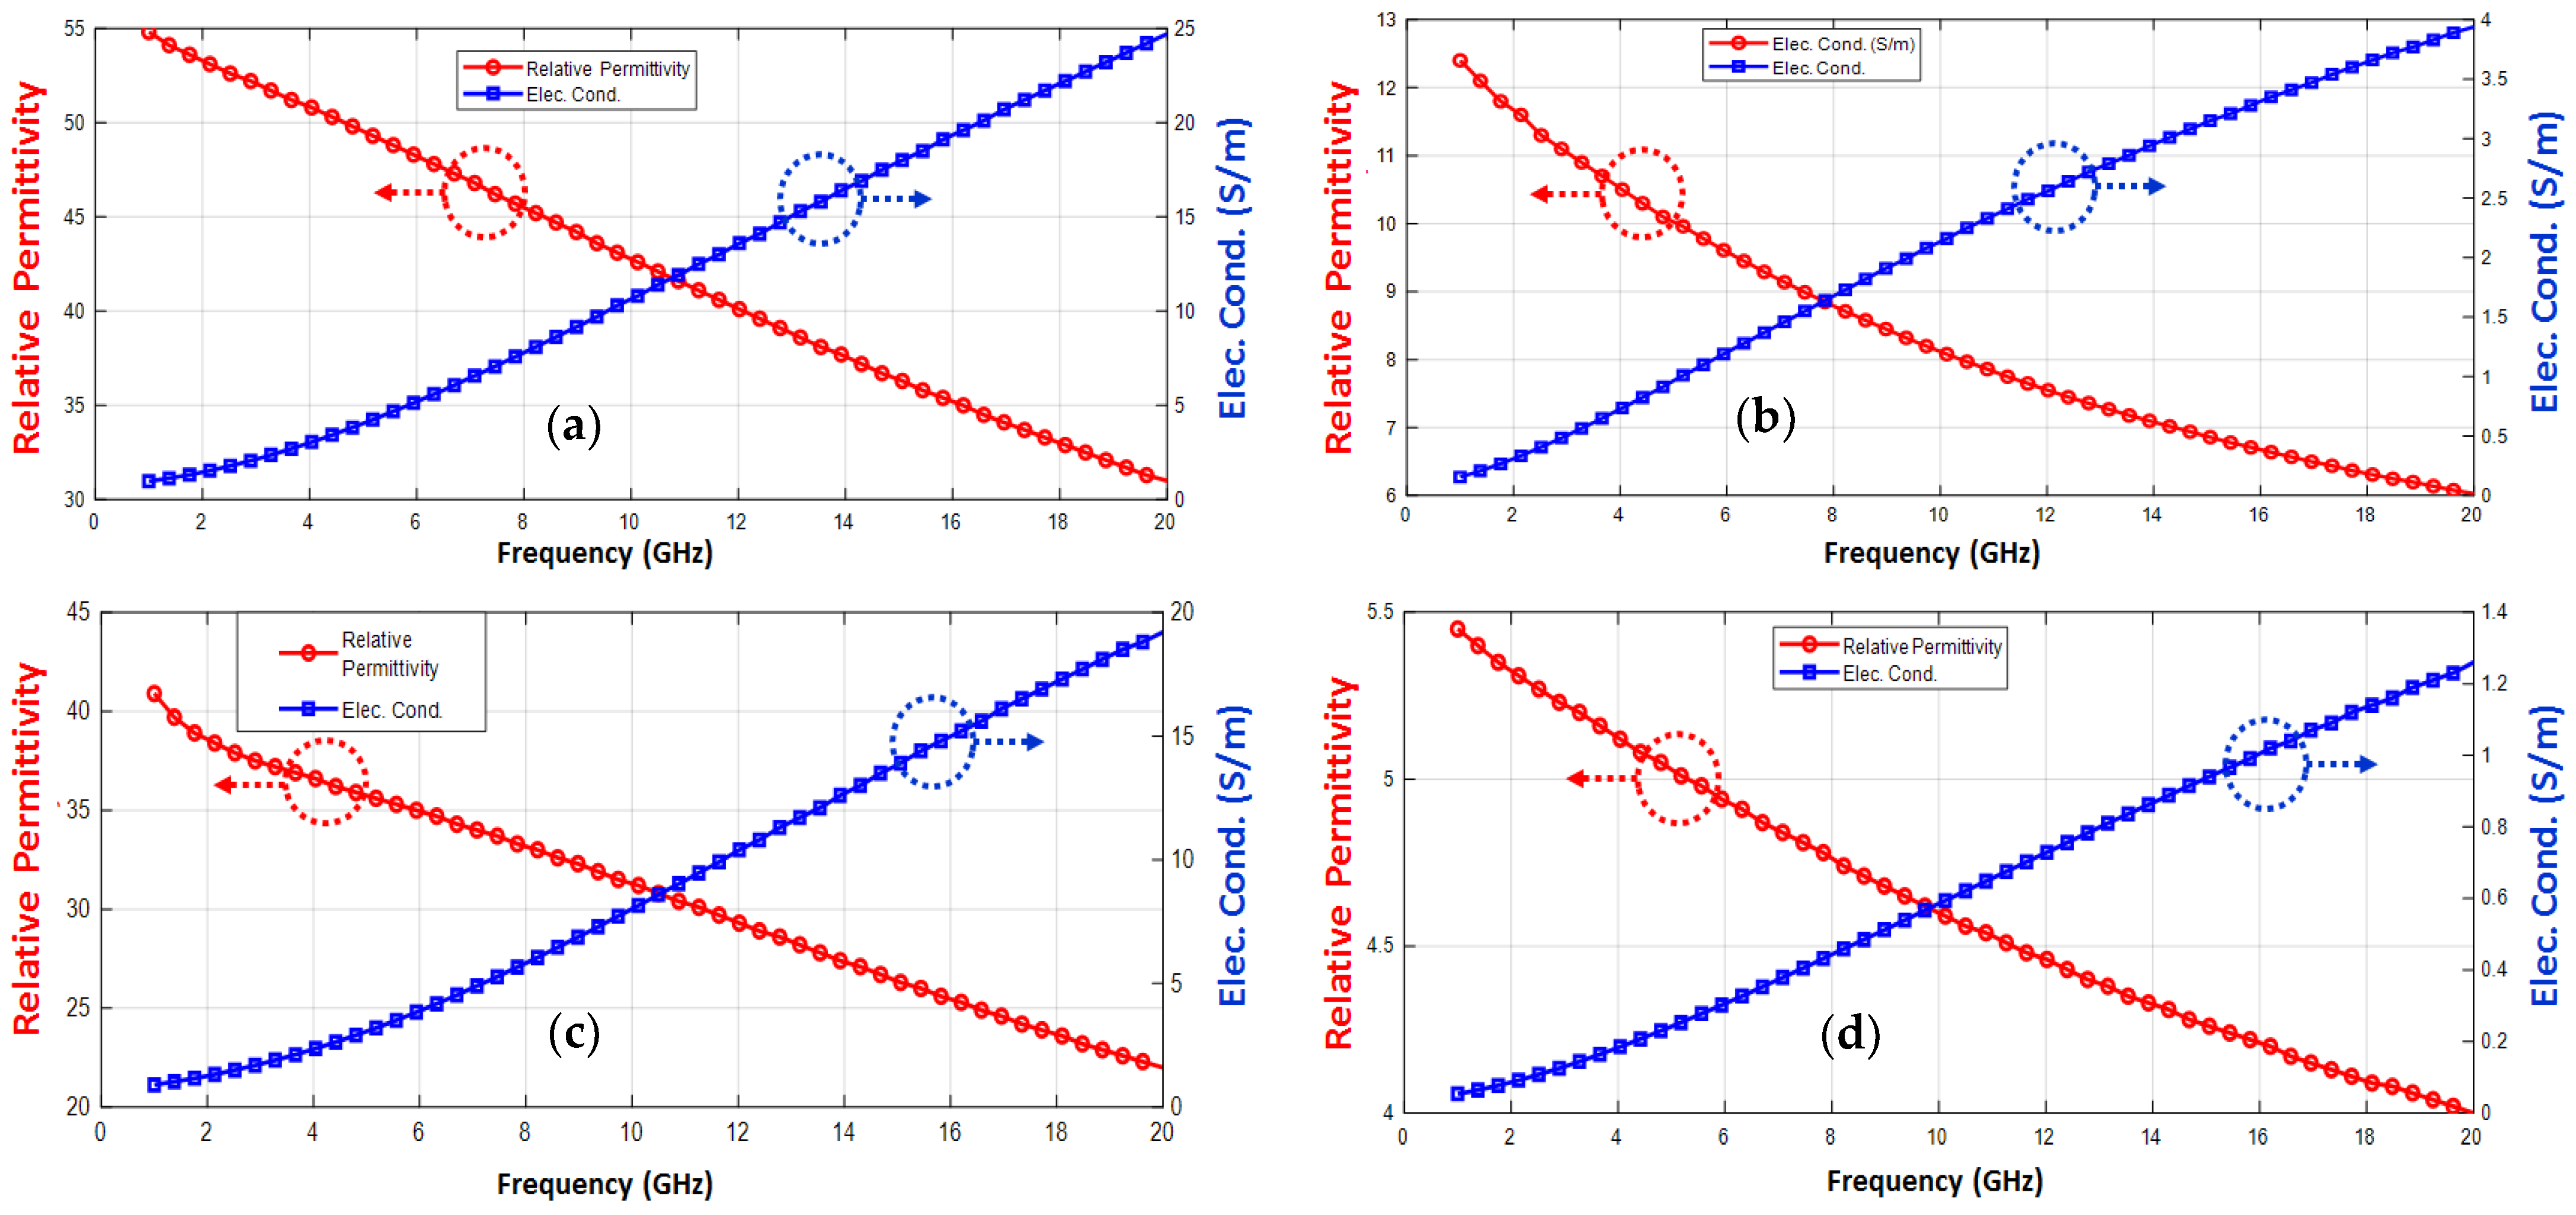
Figure 11a–d displays a graphical prediction of the model applied to the four tissues (skin, fat, muscle, and bone). The model parameters listed in Table 3 were utilized to create the graphs in Figure 11. This analysis’s primary goal is to forecast dielectric measurements that are consistent with the extensive body of research on the topic. However, given the nature of the model, it should be mentioned that the outcome for every spectrum is not unique. As a result, this model should not be employed in its entirety to relate the dielectric properties to the different tissues’ composition and structure. This can be accomplished by looking at several spectrum components in a comparative way. The calculations are made up of the spectrum between 1 GHz and 20 GHz.
The Cole–Cole model, which was presented in [34], is utilized to estimate how the glucose–aqueous solutions’ dielectric characteristics disperse at the various amounts. In the FEM simulator, the estimation is accomplished by integrating each of their dielectric properties across the 1–10 GHz operating frequency range. Specifically, each glucose sample’s relative permittivity is modeled using Equation (1) for the real and imaginary permittivity:
ε ^ w = R e ε + n = 1 2 ε n 1 + j w τ n 1 α n 0.001445 g + 1.145882 + I m ε + n = 1 2 ε n 1 + j w τ n 1 α n + σ i j w ε o  
The corresponding concentration-dependent Cole–Cole parameters ε ^ w is the complex permittivity as a function of angular frequency ω. In this context, ε represents the permittivity at very high frequencies, Δε denotes the permittivity difference for each relaxation process, n indicates the relaxation time for each process, and α is the fractional order parameter listed in Table 4. We have also attempted to simulate the glucose tissues for narrowband analysis using a single parameter, yielding nearly identical results.

4. Quantitative Evaluation

In this section, the performance of the proposed sensor is numerically analyzed when used for non-invasive blood glucose monitoring using the Computer Simulation Technology (CST) that features the FIT. Firstly, a tri-band crescent-embedded elliptical patch antenna is designed, which excites the passive tag unit (TP-CSRR) as shown in Figure 1. The tag’s passive resonators will be electrically excited at a distance of d. Therefore, when employed for glucose sensing, the dipole antenna will function as an active reader that interacts with the CSRR tag from this sensing distance. The glucose samples are first simulated by using the reader unit only (without the CSRR tag unit). The phantom is located at a distance of z = 1 mm from the antenna surface. To study the effects of the glucose level variations on the electric field induced by the interrogating antenna and its scattering response, the parametric sweep function is used to vary the glucose samples from 0 mg/dL to 500 mg/dL. Figure 12 displays the S11 parameters that were obtained. It may be seen from the graph that, when the concentration of glucose rises, the frequency moves to the right. There is a small noticeable frequency shift when the glucose concentration rises, with a shift of at least several MHz every step of the glucose level increase.
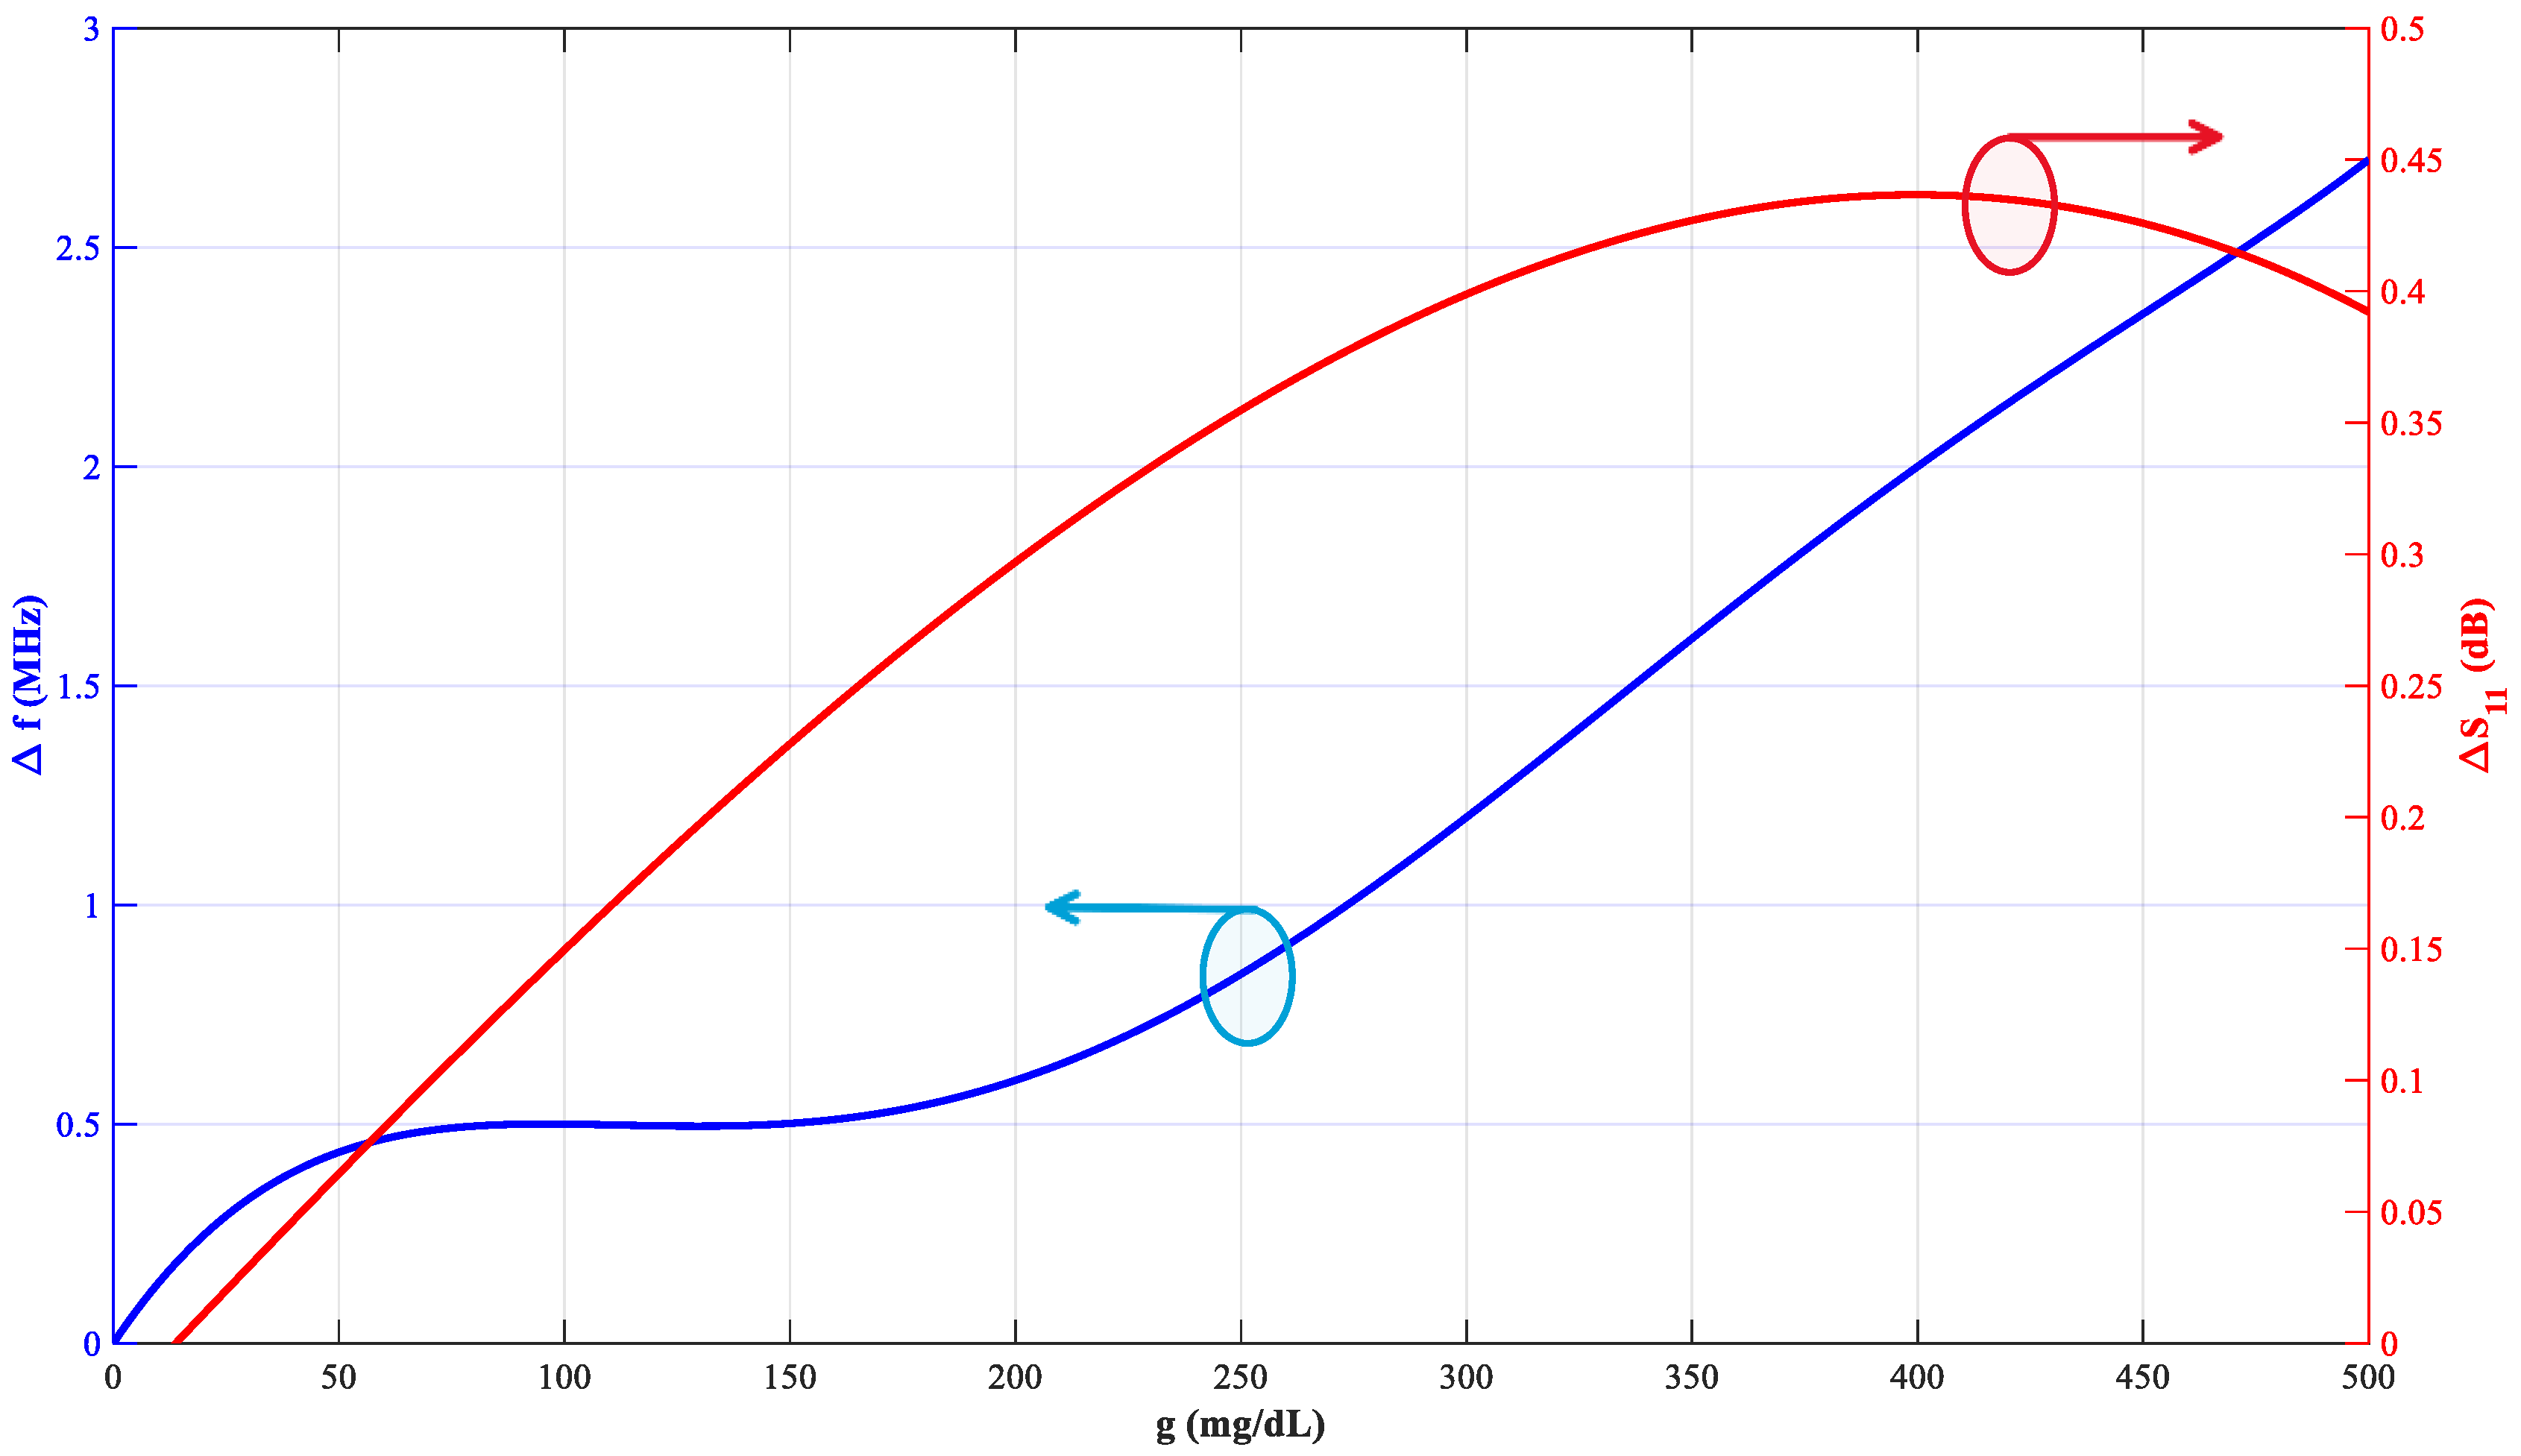
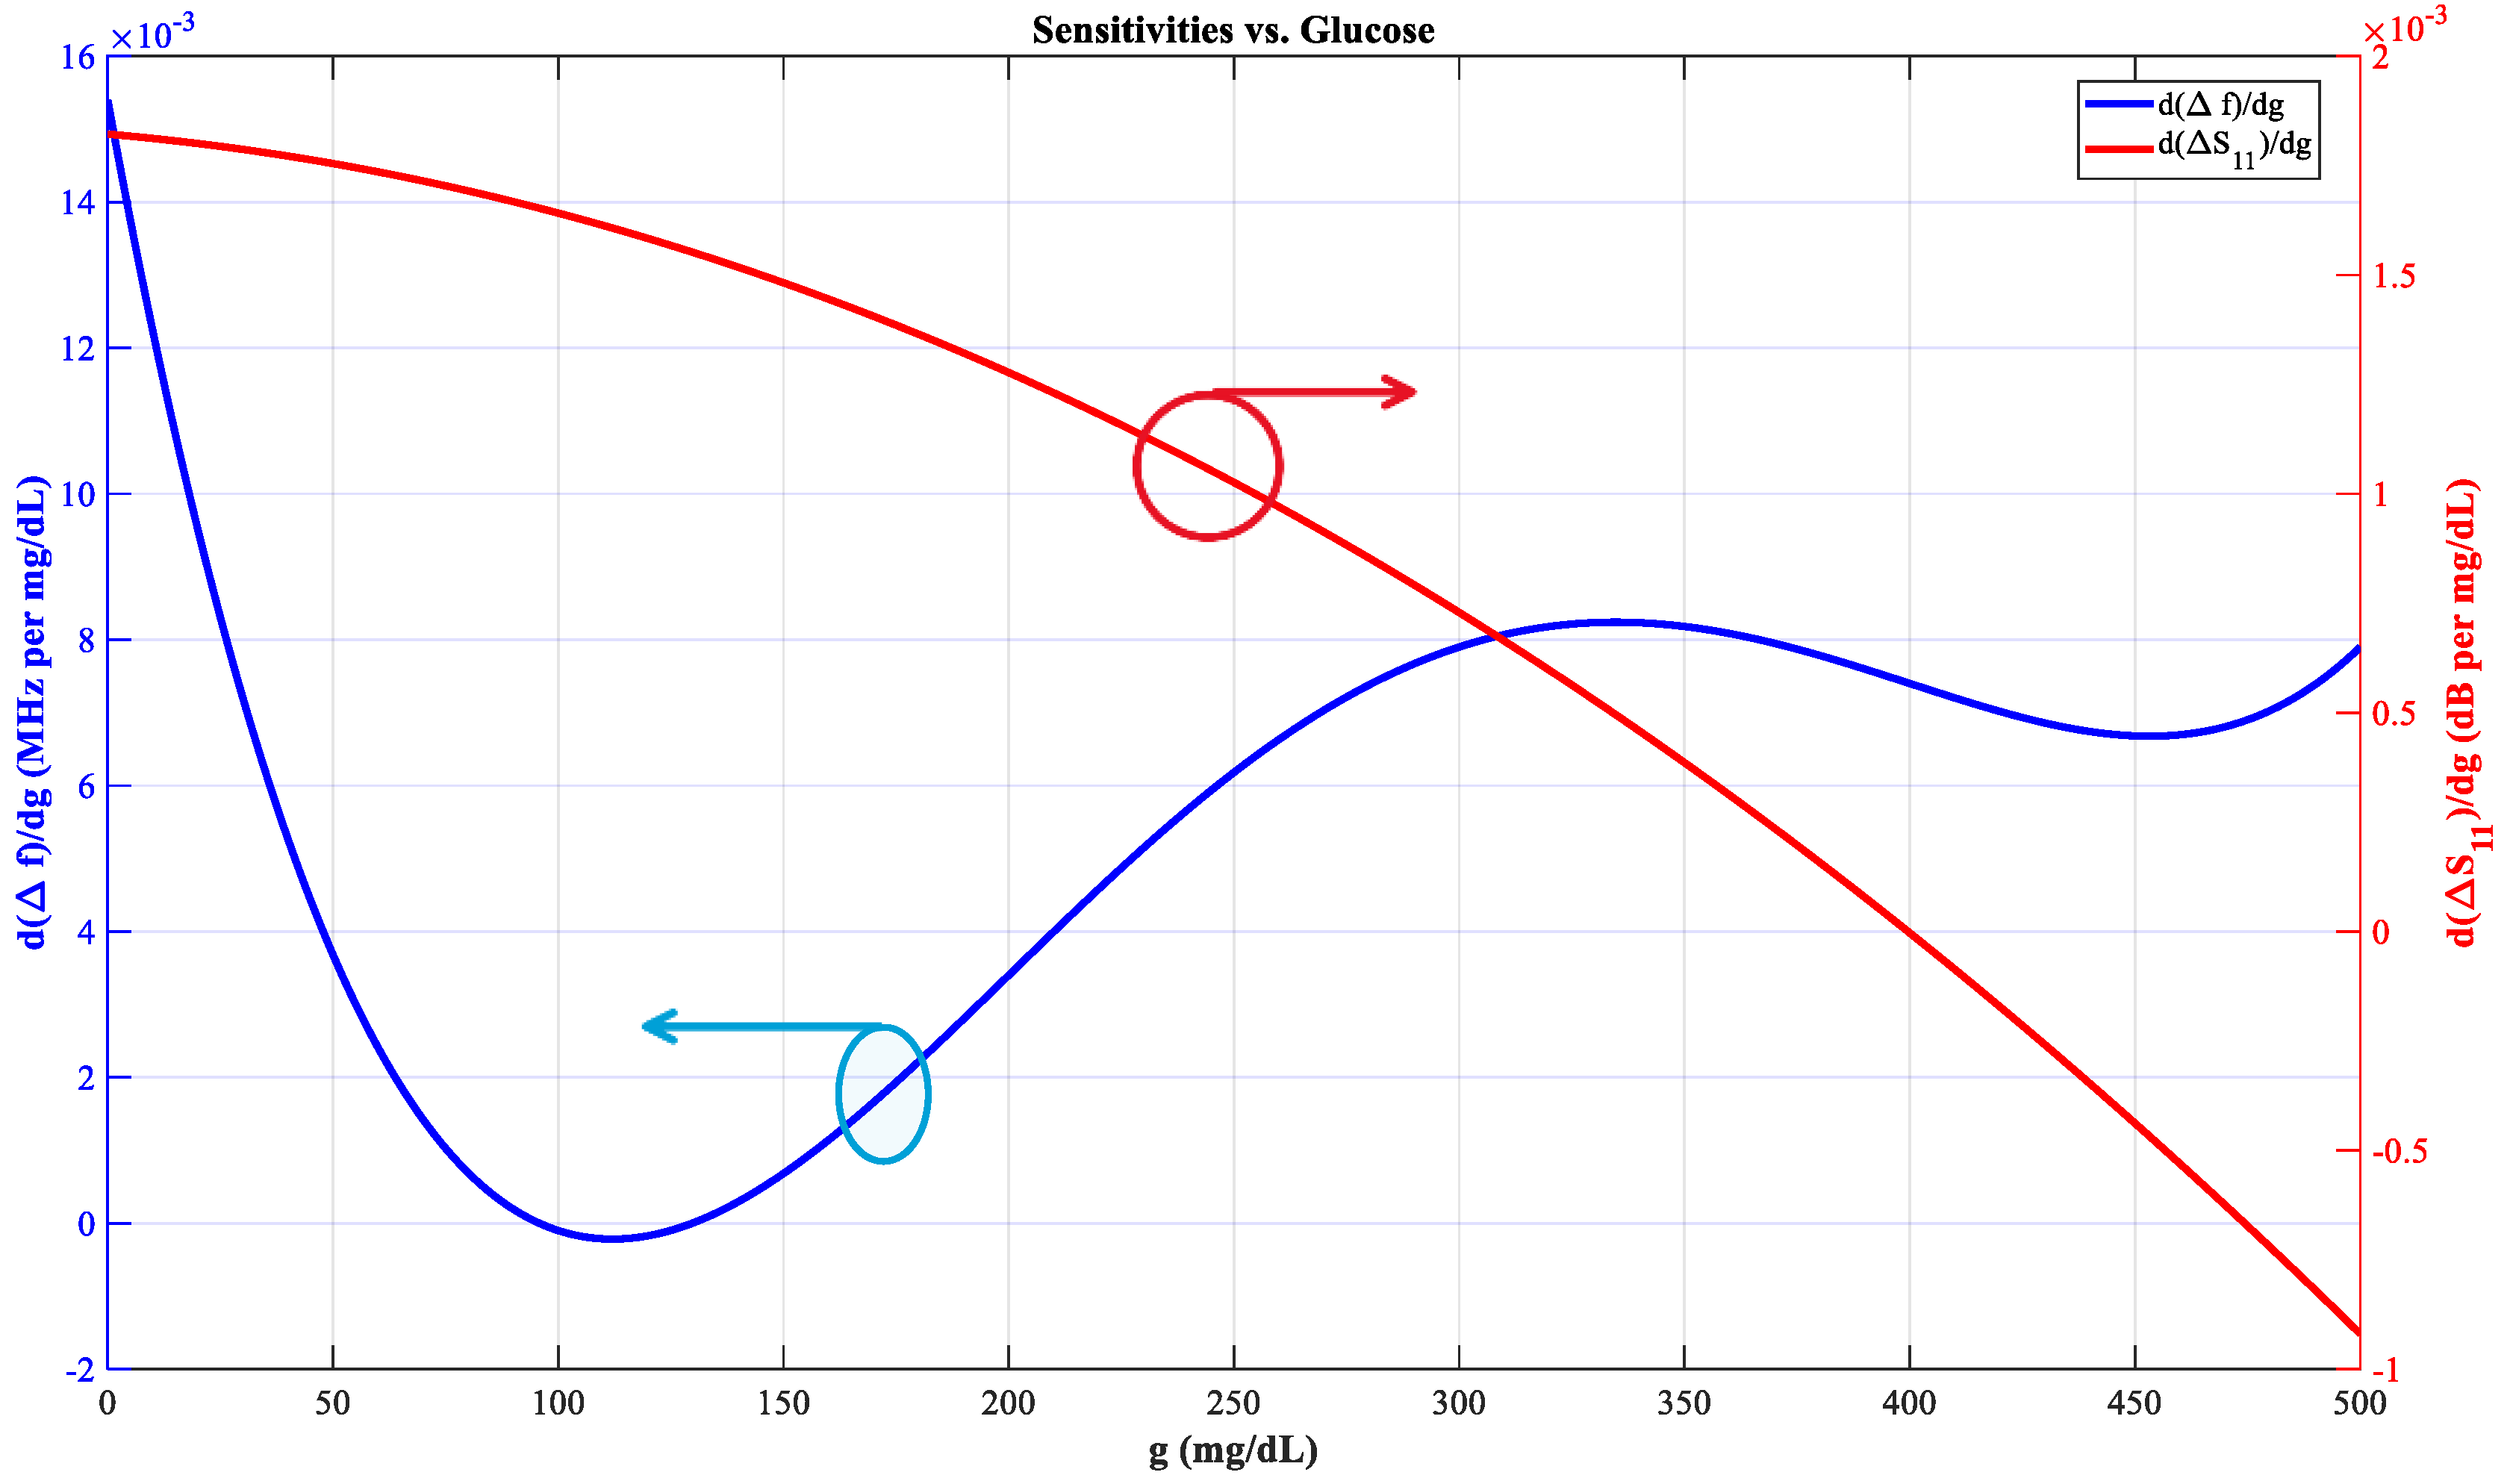
Figure 13 illustrates the performance of the proposed sensor when exposed to different glucose concentrations ranging from 0 to 500 mg/dL. Two sensing metrics are presented simultaneously: The blue curve on the left axis shows the frequency shift (Δf) in MHz. It shows a nearly monotonic increase as glucose concentration rises, indicating that the resonant frequency of the sensor is highly sensitive to dielectric property variations induced by glucose. The shift reaches about 2.7 MHz at 500 mg/dL, reflecting a clear frequency detuning trend. The red curve (right axis) corresponds to the reflection coefficient change (ΔS11) in dB. This parameter increases sharply at lower concentrations (up to ~200 mg/dL), then saturates and stabilizes with only slight changes beyond 300 mg/dL. This behavior highlights that ΔS11 is most effective in distinguishing lower-to-moderate glucose levels. In general, the figure shows that both Δf and ΔS11 are useful for measuring changes in glucose levels. The frequency shift gives a wide range of responses, while the reflection magnitude change makes the sensor more sensitive in the lower concentration range. Together, they validate the sensor’s effectiveness for non-invasive glucose monitoring. Figure 14 presents the sensitivity trends of the sensor against glucose concentration. The blue curve represents the derivative of frequency shift d(Δf)/dg, showing how the rate of resonance frequency shift varies with glucose level. The red curve corresponds to the derivative of the reflection response, d(ΔS11)/dg, indicating the variation rate of the reflection magnitude. The results show that the sensor is most sensitive to low-to-medium glucose levels and that its sensitivity decreases or oscillates as the concentration increases. Figure 14 illustrates the maximum sensitivity reached at about 0.015 MHz/mg·dL−1 for the frequency shift and 0.0016 dB/mg·dL−1 for the reflection coefficient change (ΔS11) at low glucose concentrations.
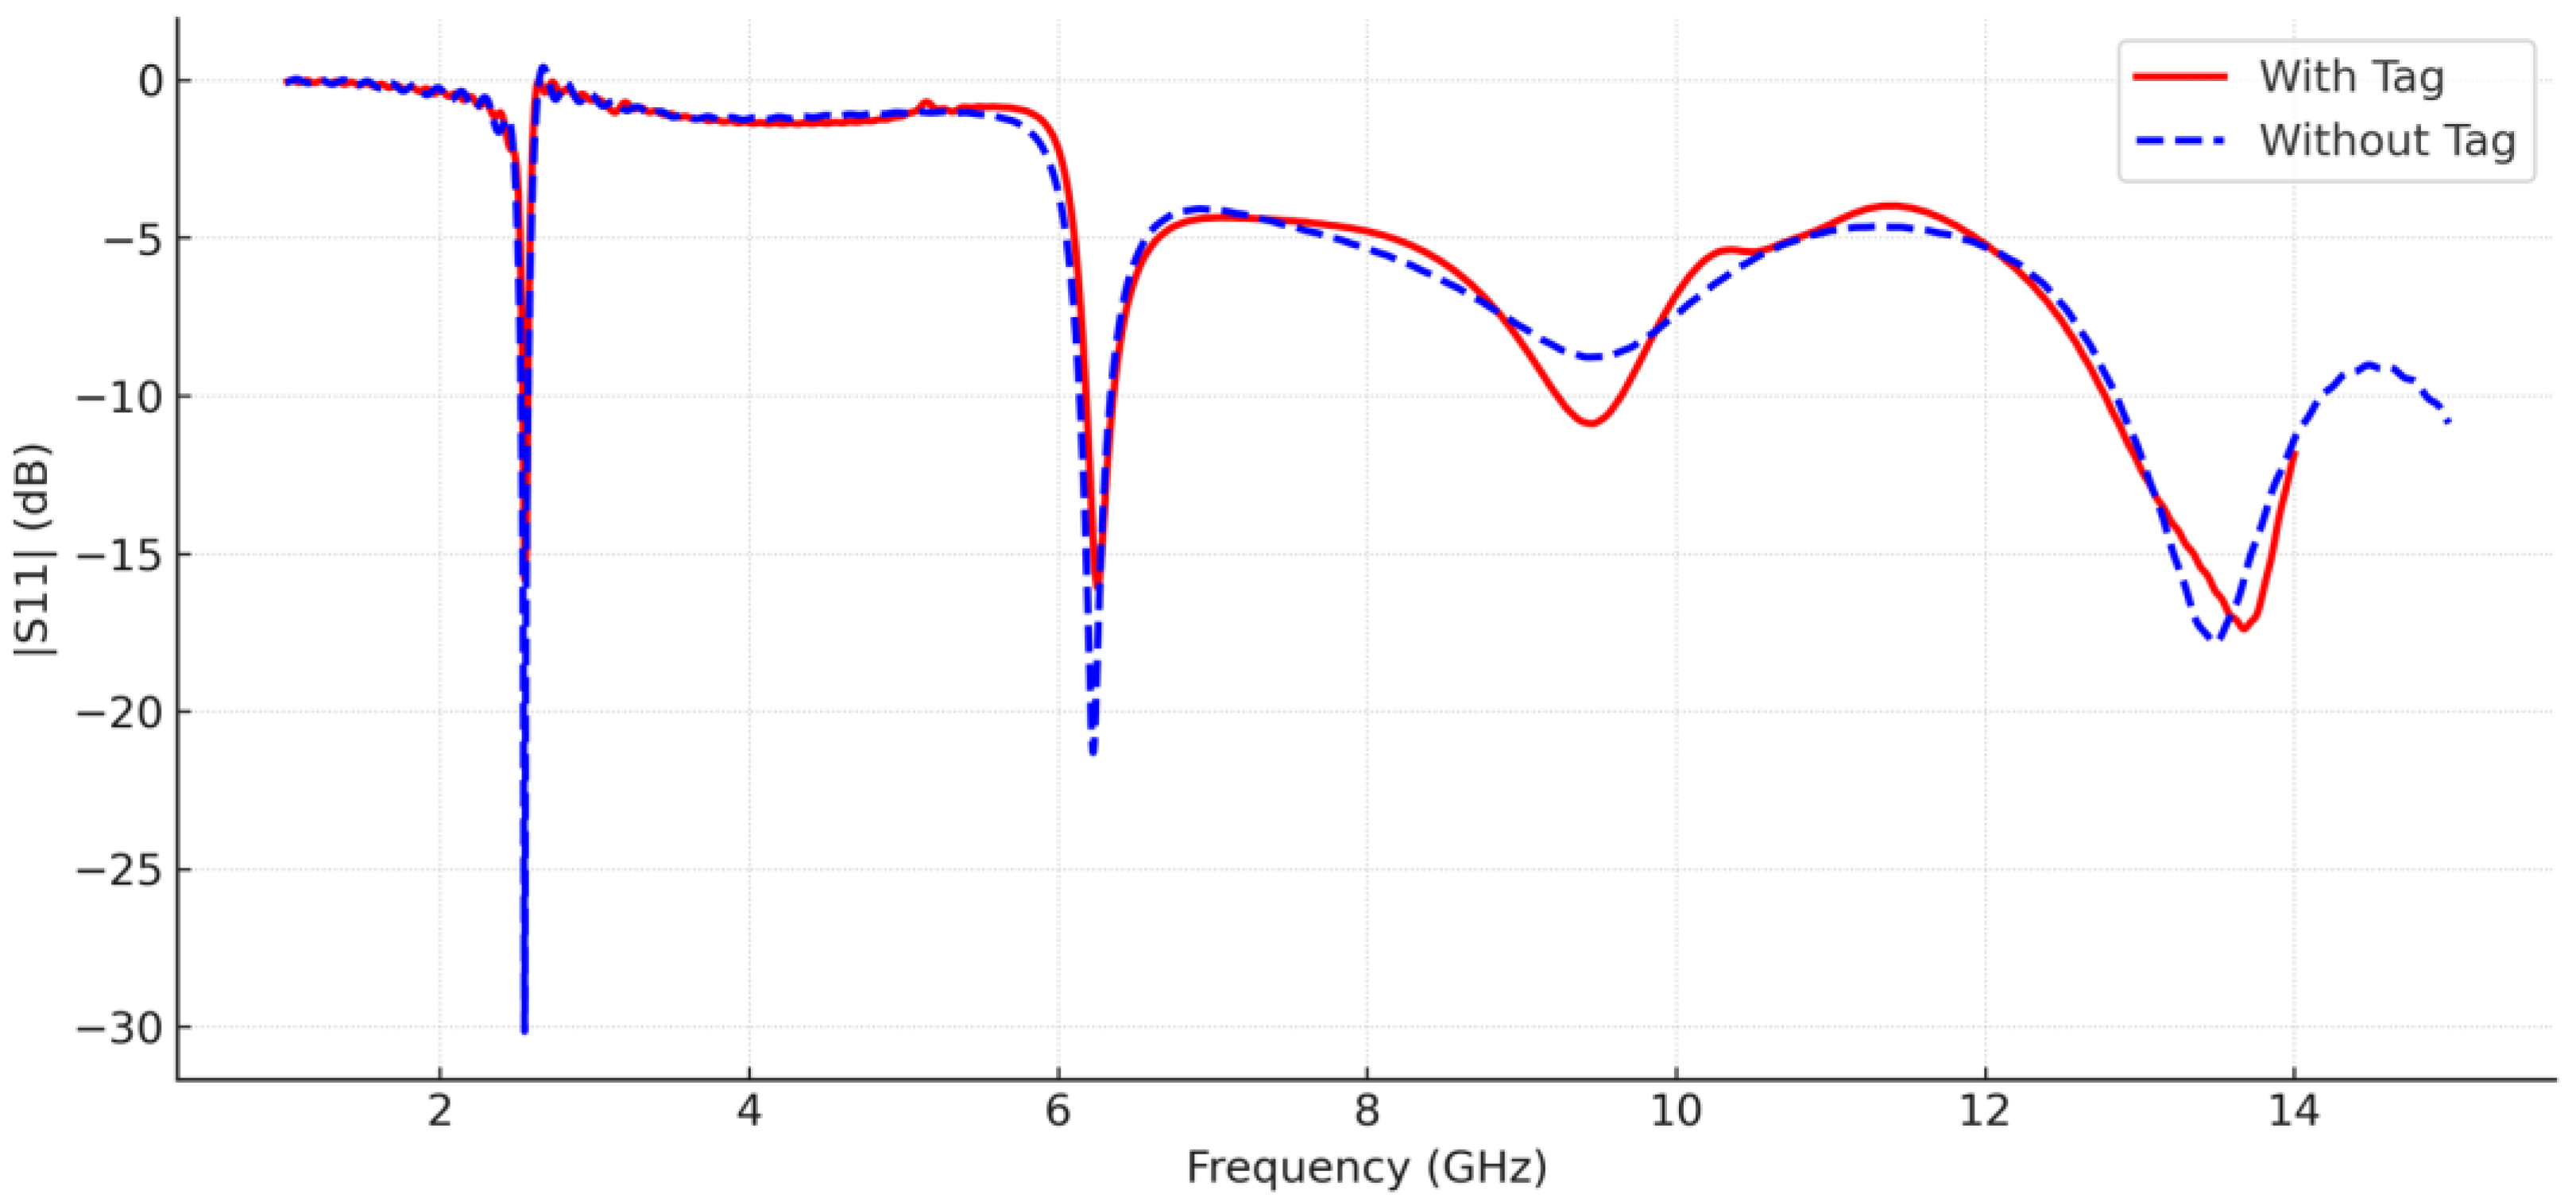
The glucose concentrations present in the loaded samples between 0 mg/dL and 500 mg/dL are detected by analyzing the entire sensor structure with the CSRR tag unit. When different glucose samples are placed next to the passive CSRR cells, it has been demonstrated that the CSRR tag is sensitive to changes in their dielectric properties. Through the EM coupling between the dipole and the passive tag, this sensitivity to glucose dielectric contrast is converted into variations in the antenna reflection coefficient. The performance of the integrated sensor is compared to that of the antenna unit only, without the tag unit, prior to loading any glucose sample. The simulated reflection coefficients |S11| (return loss) for the three different scenarios are shown in Figure 15, spanning the frequency range of 1–14 GHz.
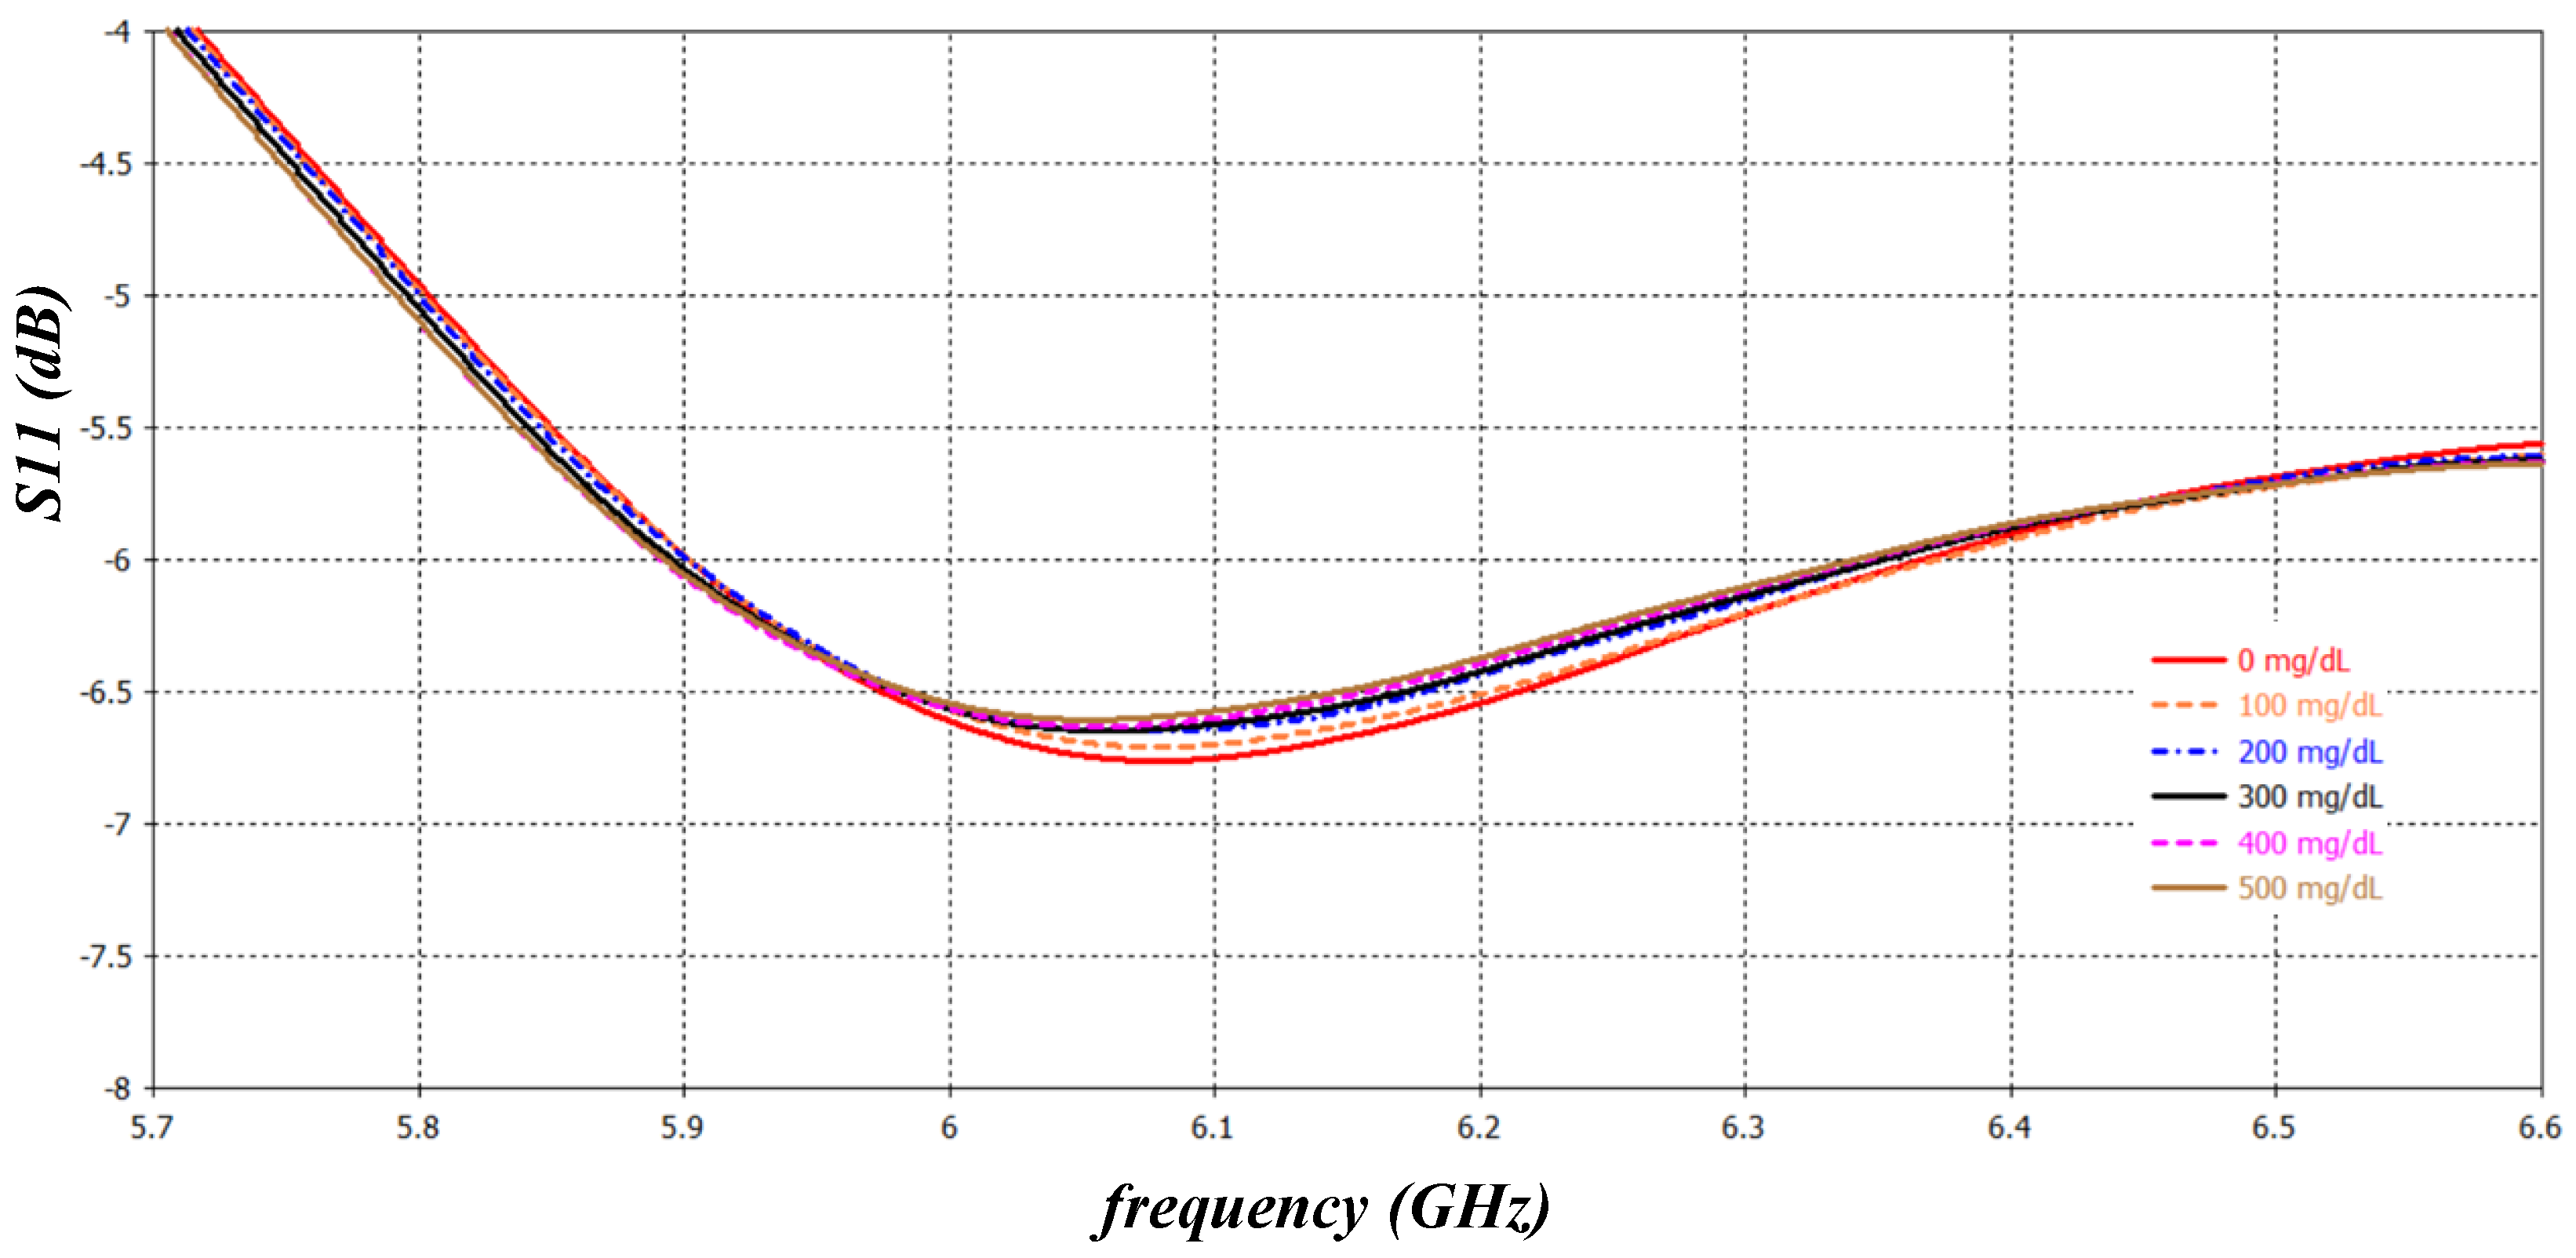
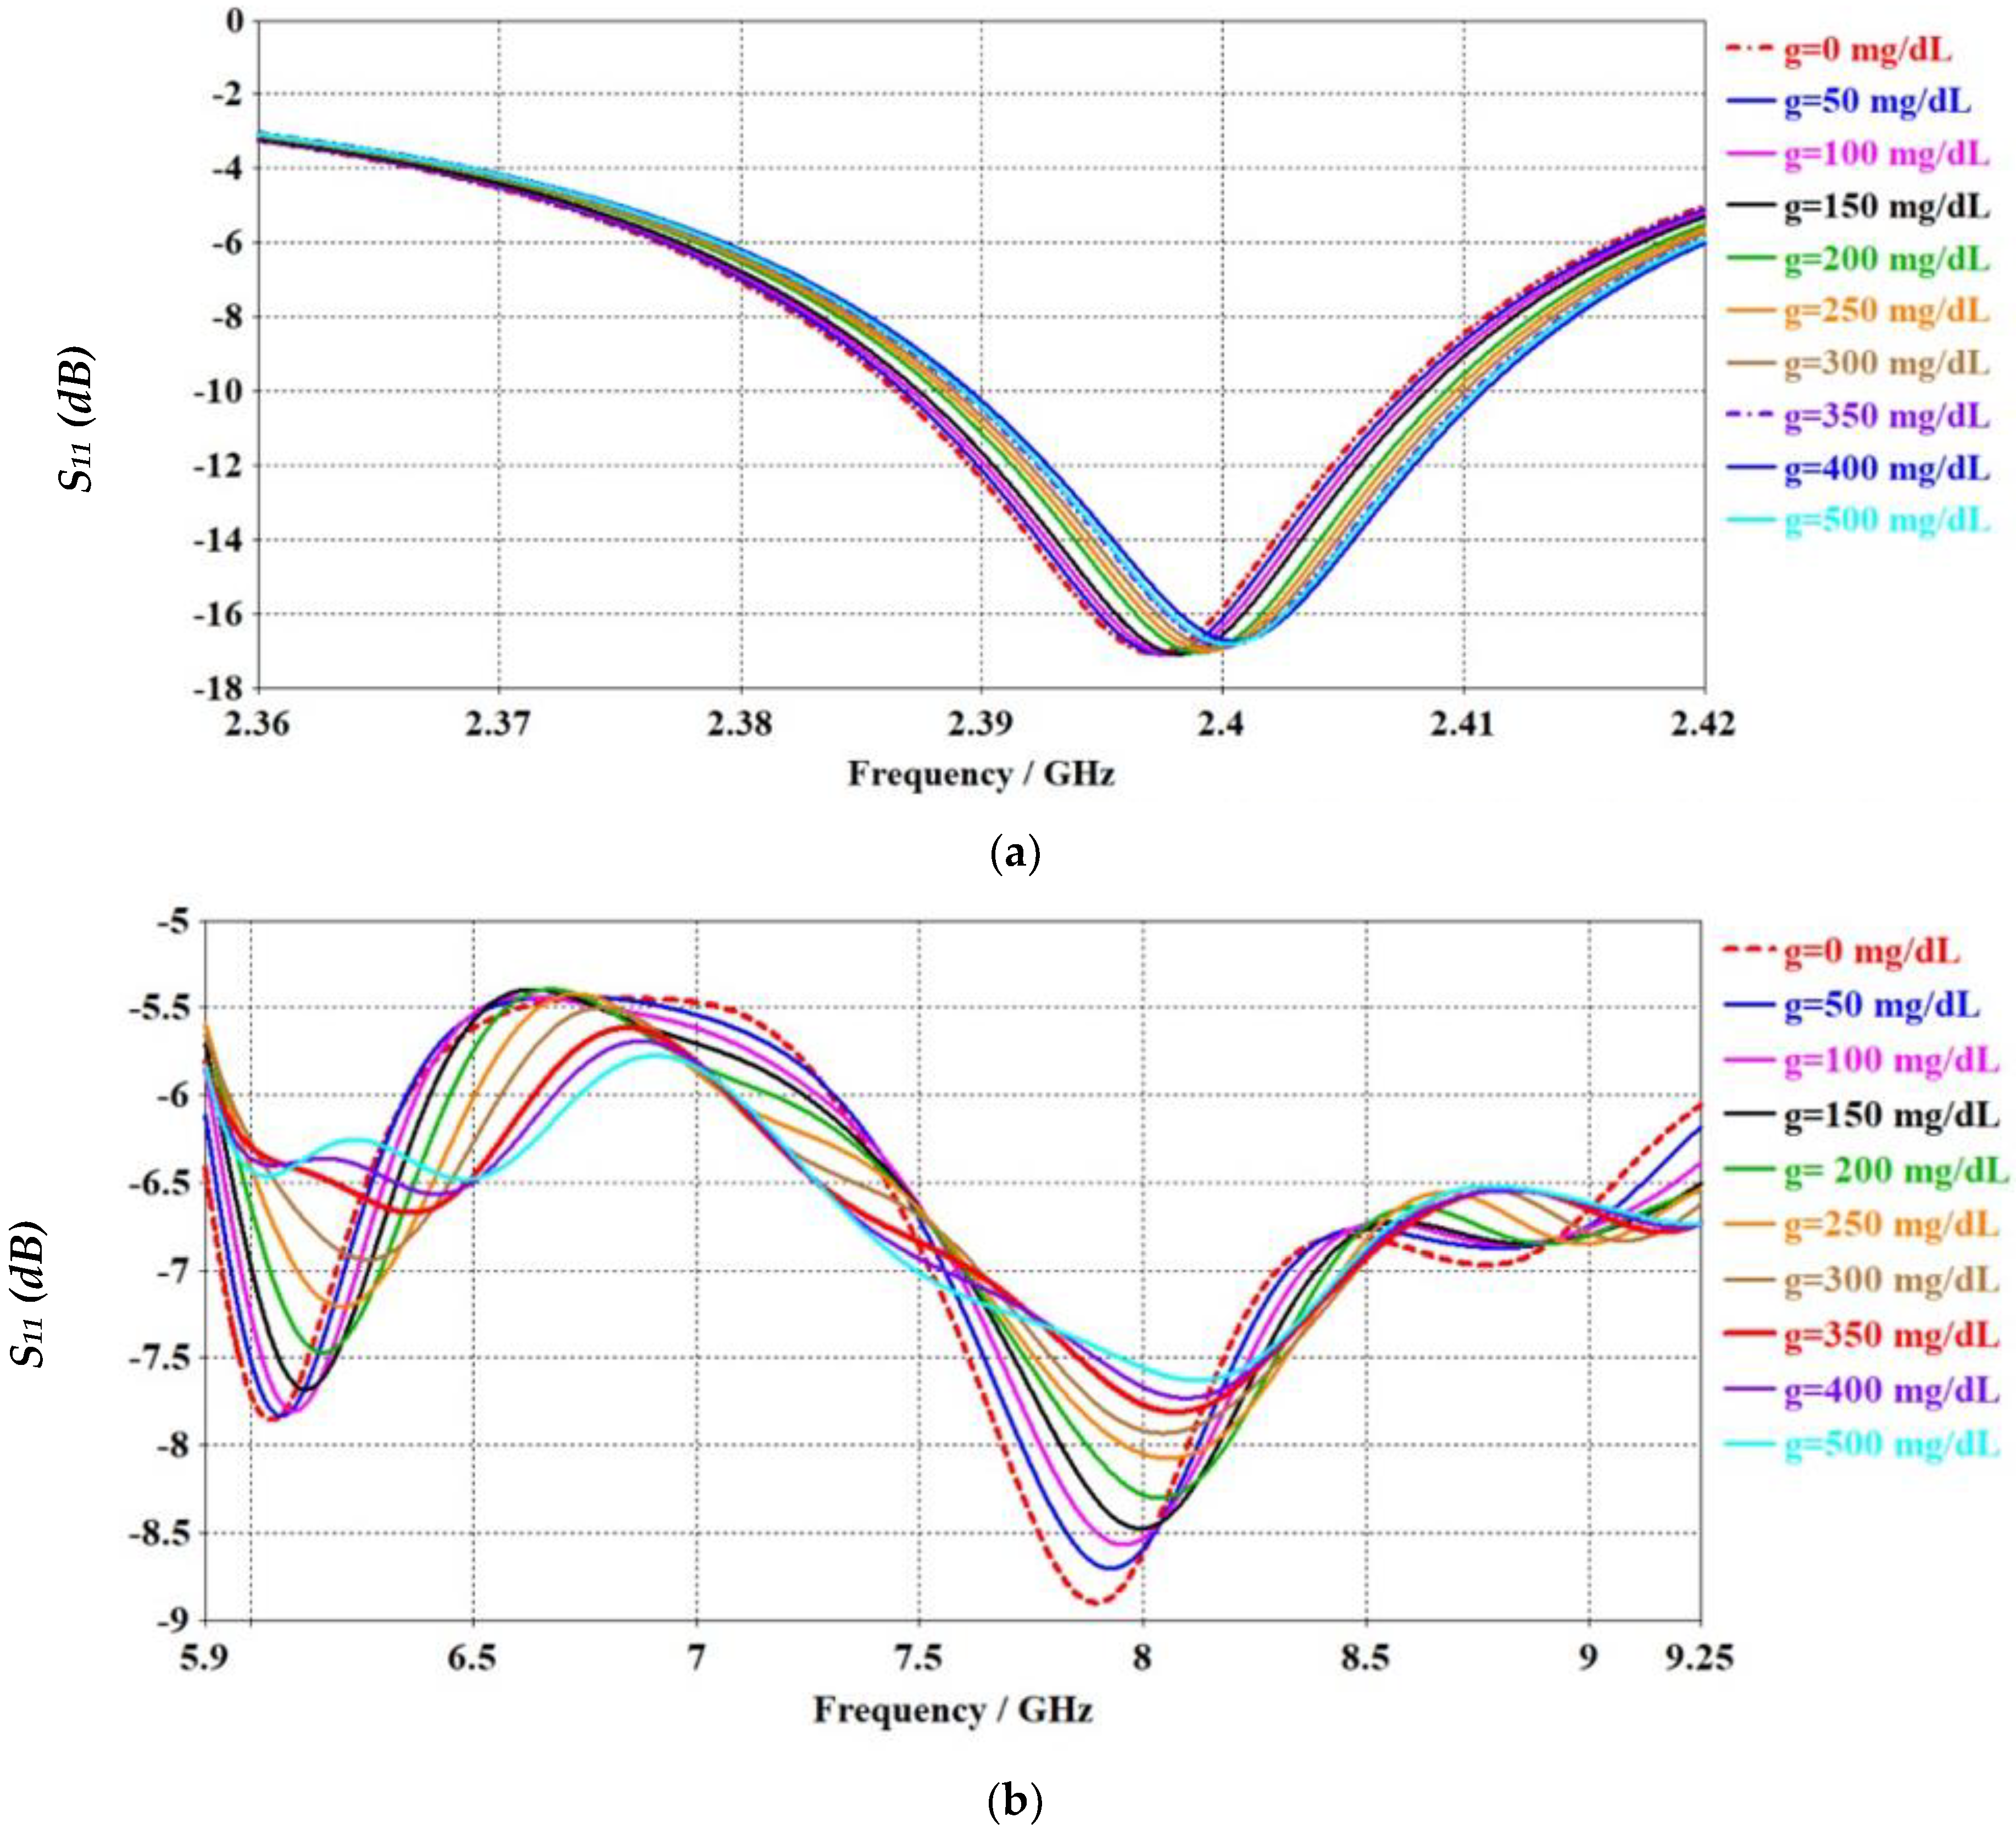
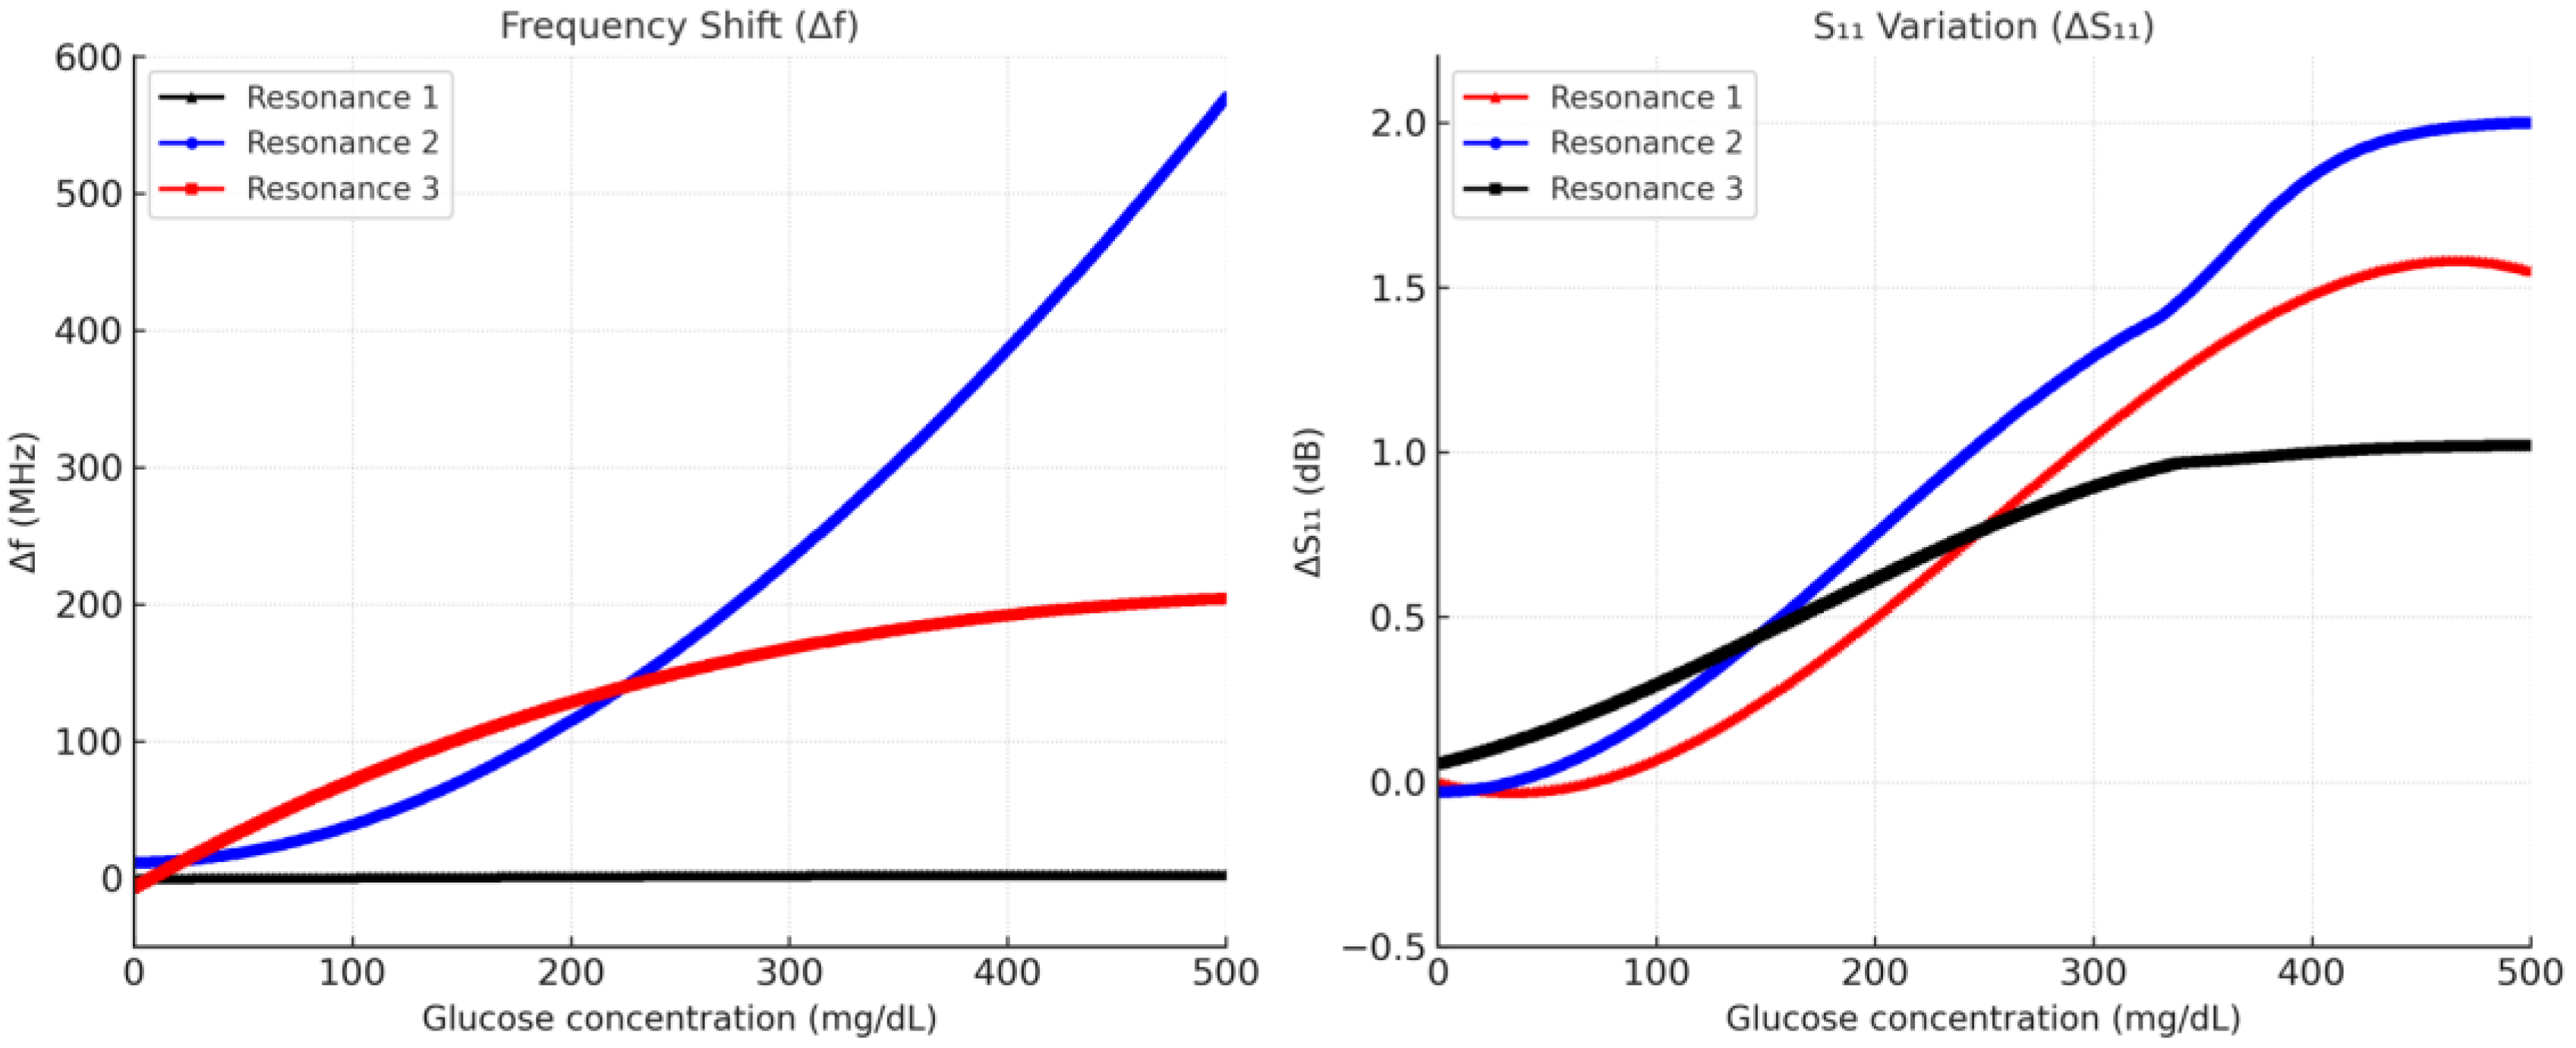
The sensor performance is analyzed when the glucose concentrations of interest are introduced in the sensing area on top of the tag, as shown in Figure 1. The sensing parameters that are used for monitoring the glucose level variations are the frequency shift as well as the reflection coefficient |S11|. Figure 16a,b shows the simulated reflection coefficient |S11| of the integrated antenna sensor in the frequency range 2.36–2.42 GHz (Figure 16a) and 5.9–7.25 GHz (Figure 16b) when the CSRR tag is placed at d = 12 mm. Three resonances are observed at f = 2.4 GHz, f = 6 GHz, and f = 7.895 GHz (at zero glucose level). The resonant frequency, as well as the amplitude at these bands, varies in response to glucose concentration changes from 0 mg/dL to 500 mg/dL, as depicted in Figure 17. However, higher resolution is recorded at the integrated resonator antenna with the CSRR tag. The integrated structure is shown to be more sensitive to glucose level variations. The sensor resolution recorded in the 1st, 2nd, and 3rd bands is [0.0076 MHz/mg/dL–0.0041 dB/mg/dL], [0.5 MHz/mg/dL–0.003 dB/mg/dL], and [1.14 MHz/mg/dL, 0.0026 dB/mg/dL]. The sensitivity analysis of the proposed sensor in terms of the derivative of frequency shift with respect to glucose concentration is calculated for the three resonances. Resonance 2 exhibits the highest and steadily increasing sensitivity, reaching nearly 2 MHz/mg·dL−1, while Resonance 3 shows a decreasing trend with increasing glucose concentration, indicating its dominant response in the lower concentration range. Resonance 1 demonstrates relatively low sensitivity compared to the other two modes. To emphasize this behavior, an inset plot separately highlights the sensitivity of Resonance 1, showing a mild peak around intermediate glucose levels before a gradual decline. These results confirm that the sensor provides multi-resonance operation with complementary sensitivity characteristics, where Resonance 2 ensures strong performance at higher glucose levels, and Resonance 3 is more effective in detecting low concentrations.

5. Physics-Informed Residual Deep Learning for Glucose Estimation

5.1. Methodology: Physics-Informed Residual Deep Learning (PI-Residual DL)

  • Overview
We estimate capillary glucose g (mg/dL) from two microwave features, frequency shift Δf and reflection coefficient change ΔS11, by combining a physics baseline with a compact residual neural network. The physical component provides a first-order estimate g p h y s ; the network learns only the unmodeled residual r = g g p h y s . The final prediction is:
g ^ = g p h y s + r ^ ,         r ^ = f θ x
which constrains learning, improves data efficiency, and reduces bias.
2.
Physics Baseline and Inversion (Simulation-Driven)
The forward relation g f ,   S 11 is obtained from EM/circuit simulations. We sample the simulated responses densely over g     0 ,   500 m g / d L to build lookup tables for each feature. After enforcing monotonicity (cumulative smoothing), we compute two inverse estimates via 1-D monotone interpolation:
g p h y s f = i n v _ l o o k u p f ,     g p h y s S 11 = i n v _ l o o k u p S 11
and fuse them with equal weights:
g p h y s = 1 2   g p h y s f +   1 2   g p h y s S 11
This physics anchor constrains the solution space and stabilizes learning.
3.
Residual Formulation and Inputs
We regress the residual r = g g p h y s rather than g directly. The input vector is:
x = f ,   S 11 ,   f 2 ,   S 11 2 ,   f S 11
Features are standardized using the training fold’s mean and standard deviation. Mild outliers in 50–100 mg/dL are removed with a robust z-score filter ∣z∣ < 3.
4.
Network and Objective
A two-hidden-layer MLP (64, 32 units; ReLU) with a linear output models the residual. We minimize mean-squared error with L2 weight decay (Adam, learning rate 10−3; mini-batch 128; L2 = 10−4; 500 epochs). The small capacity is adequate because the physics baseline already explains most variance.
5.
Data and Noise (Simulation-Consistent)
Reference glucose trajectories (0–500 mg/dL) are paired with simulated (Δf, ΔS11) and corrupted by zero-mean Gaussian noise that is slightly higher below 250 mg/dL and smaller above 250 mg/dL, reflecting expected sensor behavior. The same noise model is used when forming a balanced evaluation set.
6.
Evaluation Protocol
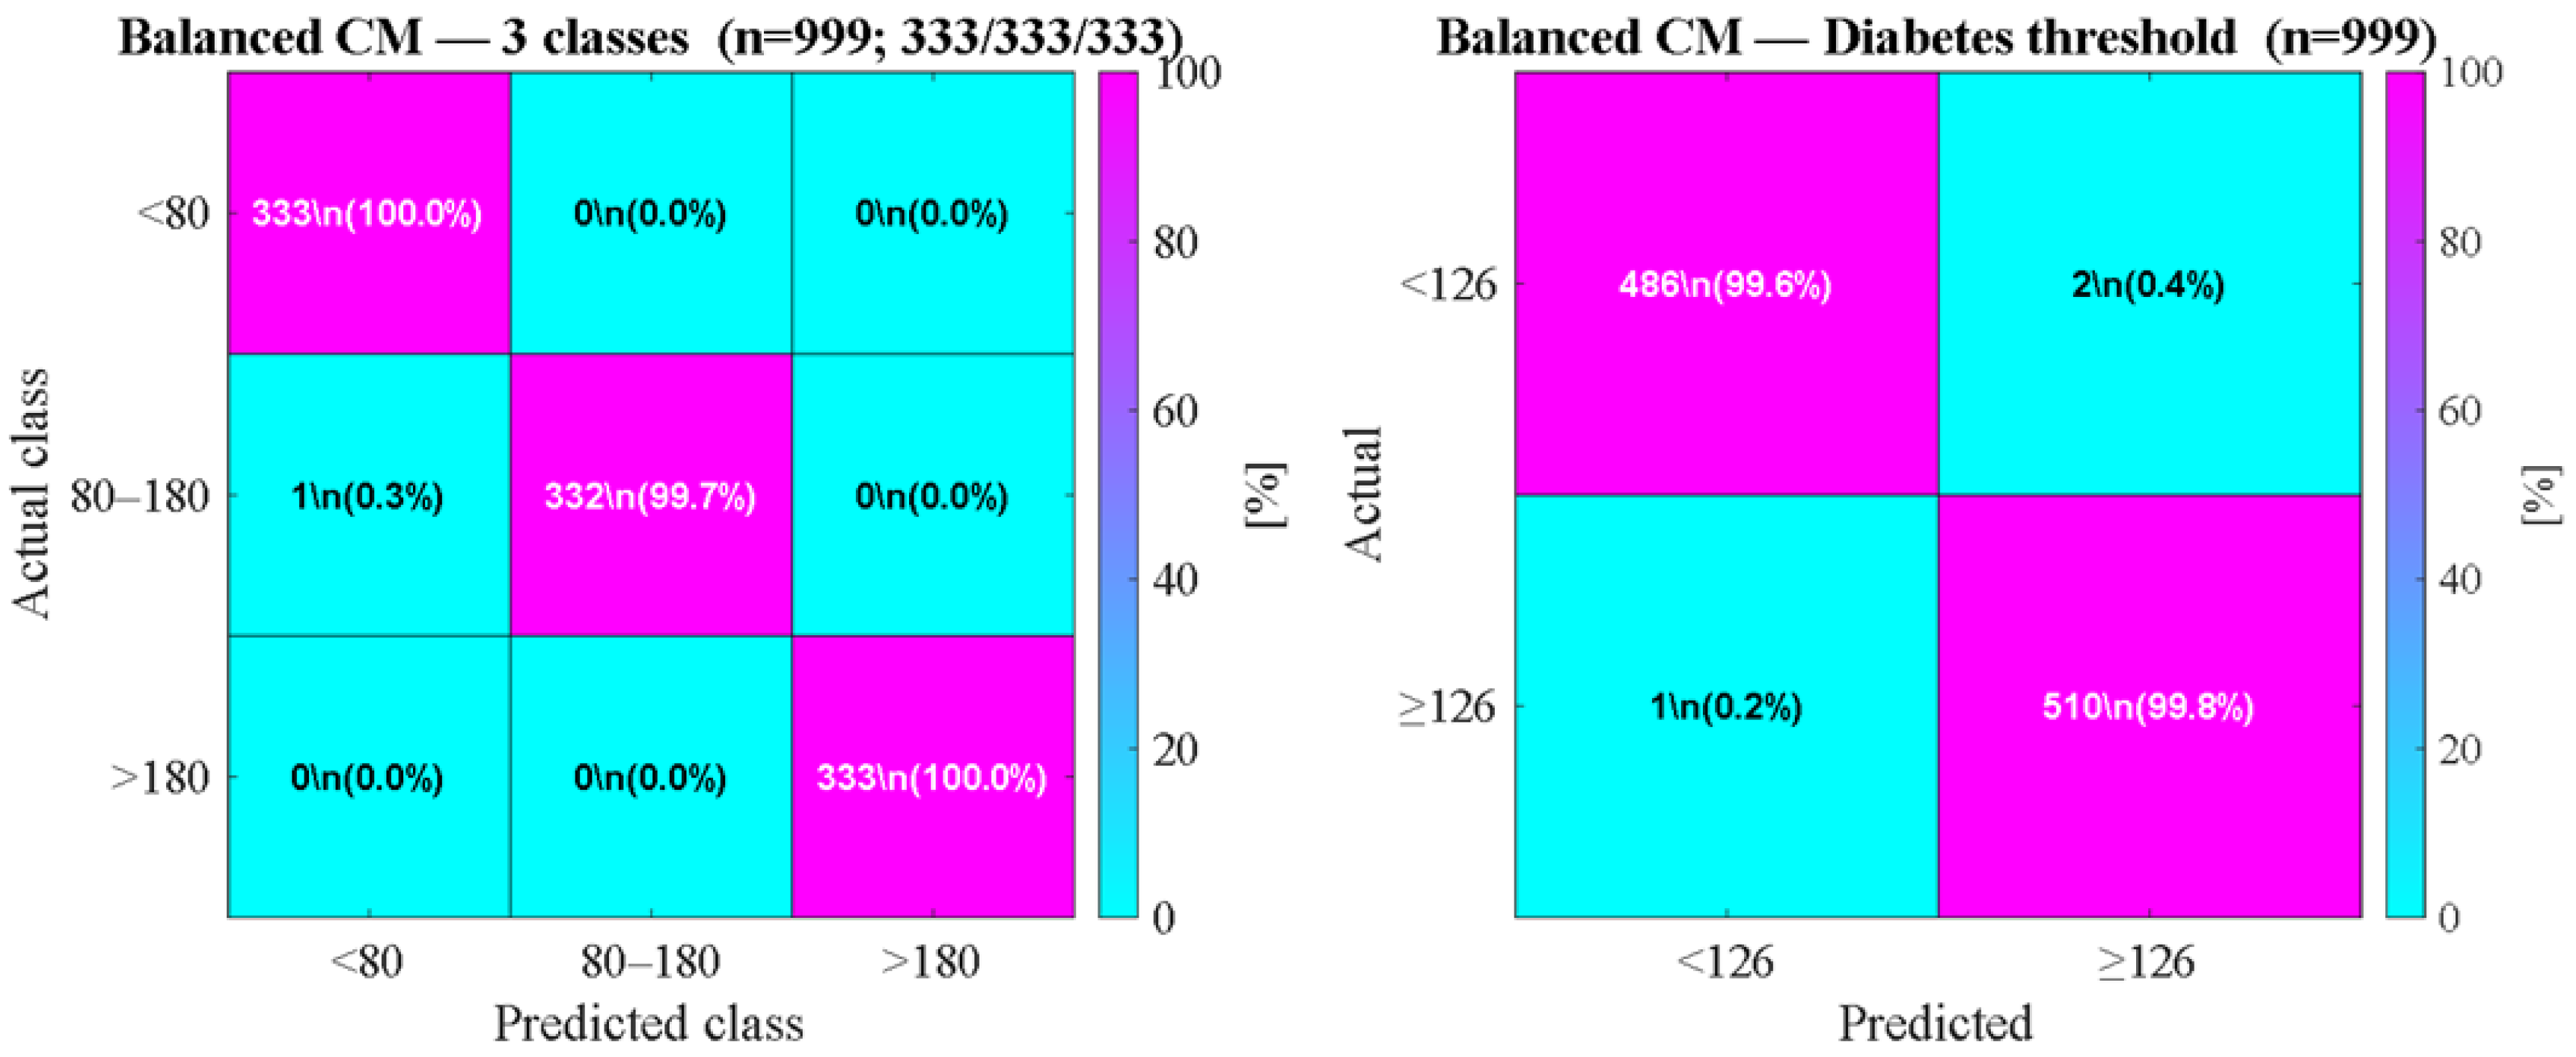
We use an 80/20 holdout split for primary testing and 5-fold cross-validation to generate out-of-fold predictions for time-series and SEG analyses. We report RMSE/MAE/MAD/Bias (mg/dL), R2, MARD (%), and RMS% (classic and ISO-like), plus SEG-like risk maps and confusion matrices for clinical bands (<80, 80–180, >180 mg/dL) and the diabetes threshold (≥126 mg/dL). A separate balanced set (999 samples; 333 per class) provides class-fair confusion matrices.

5.2. Physics-Informed Residual Deep Learning

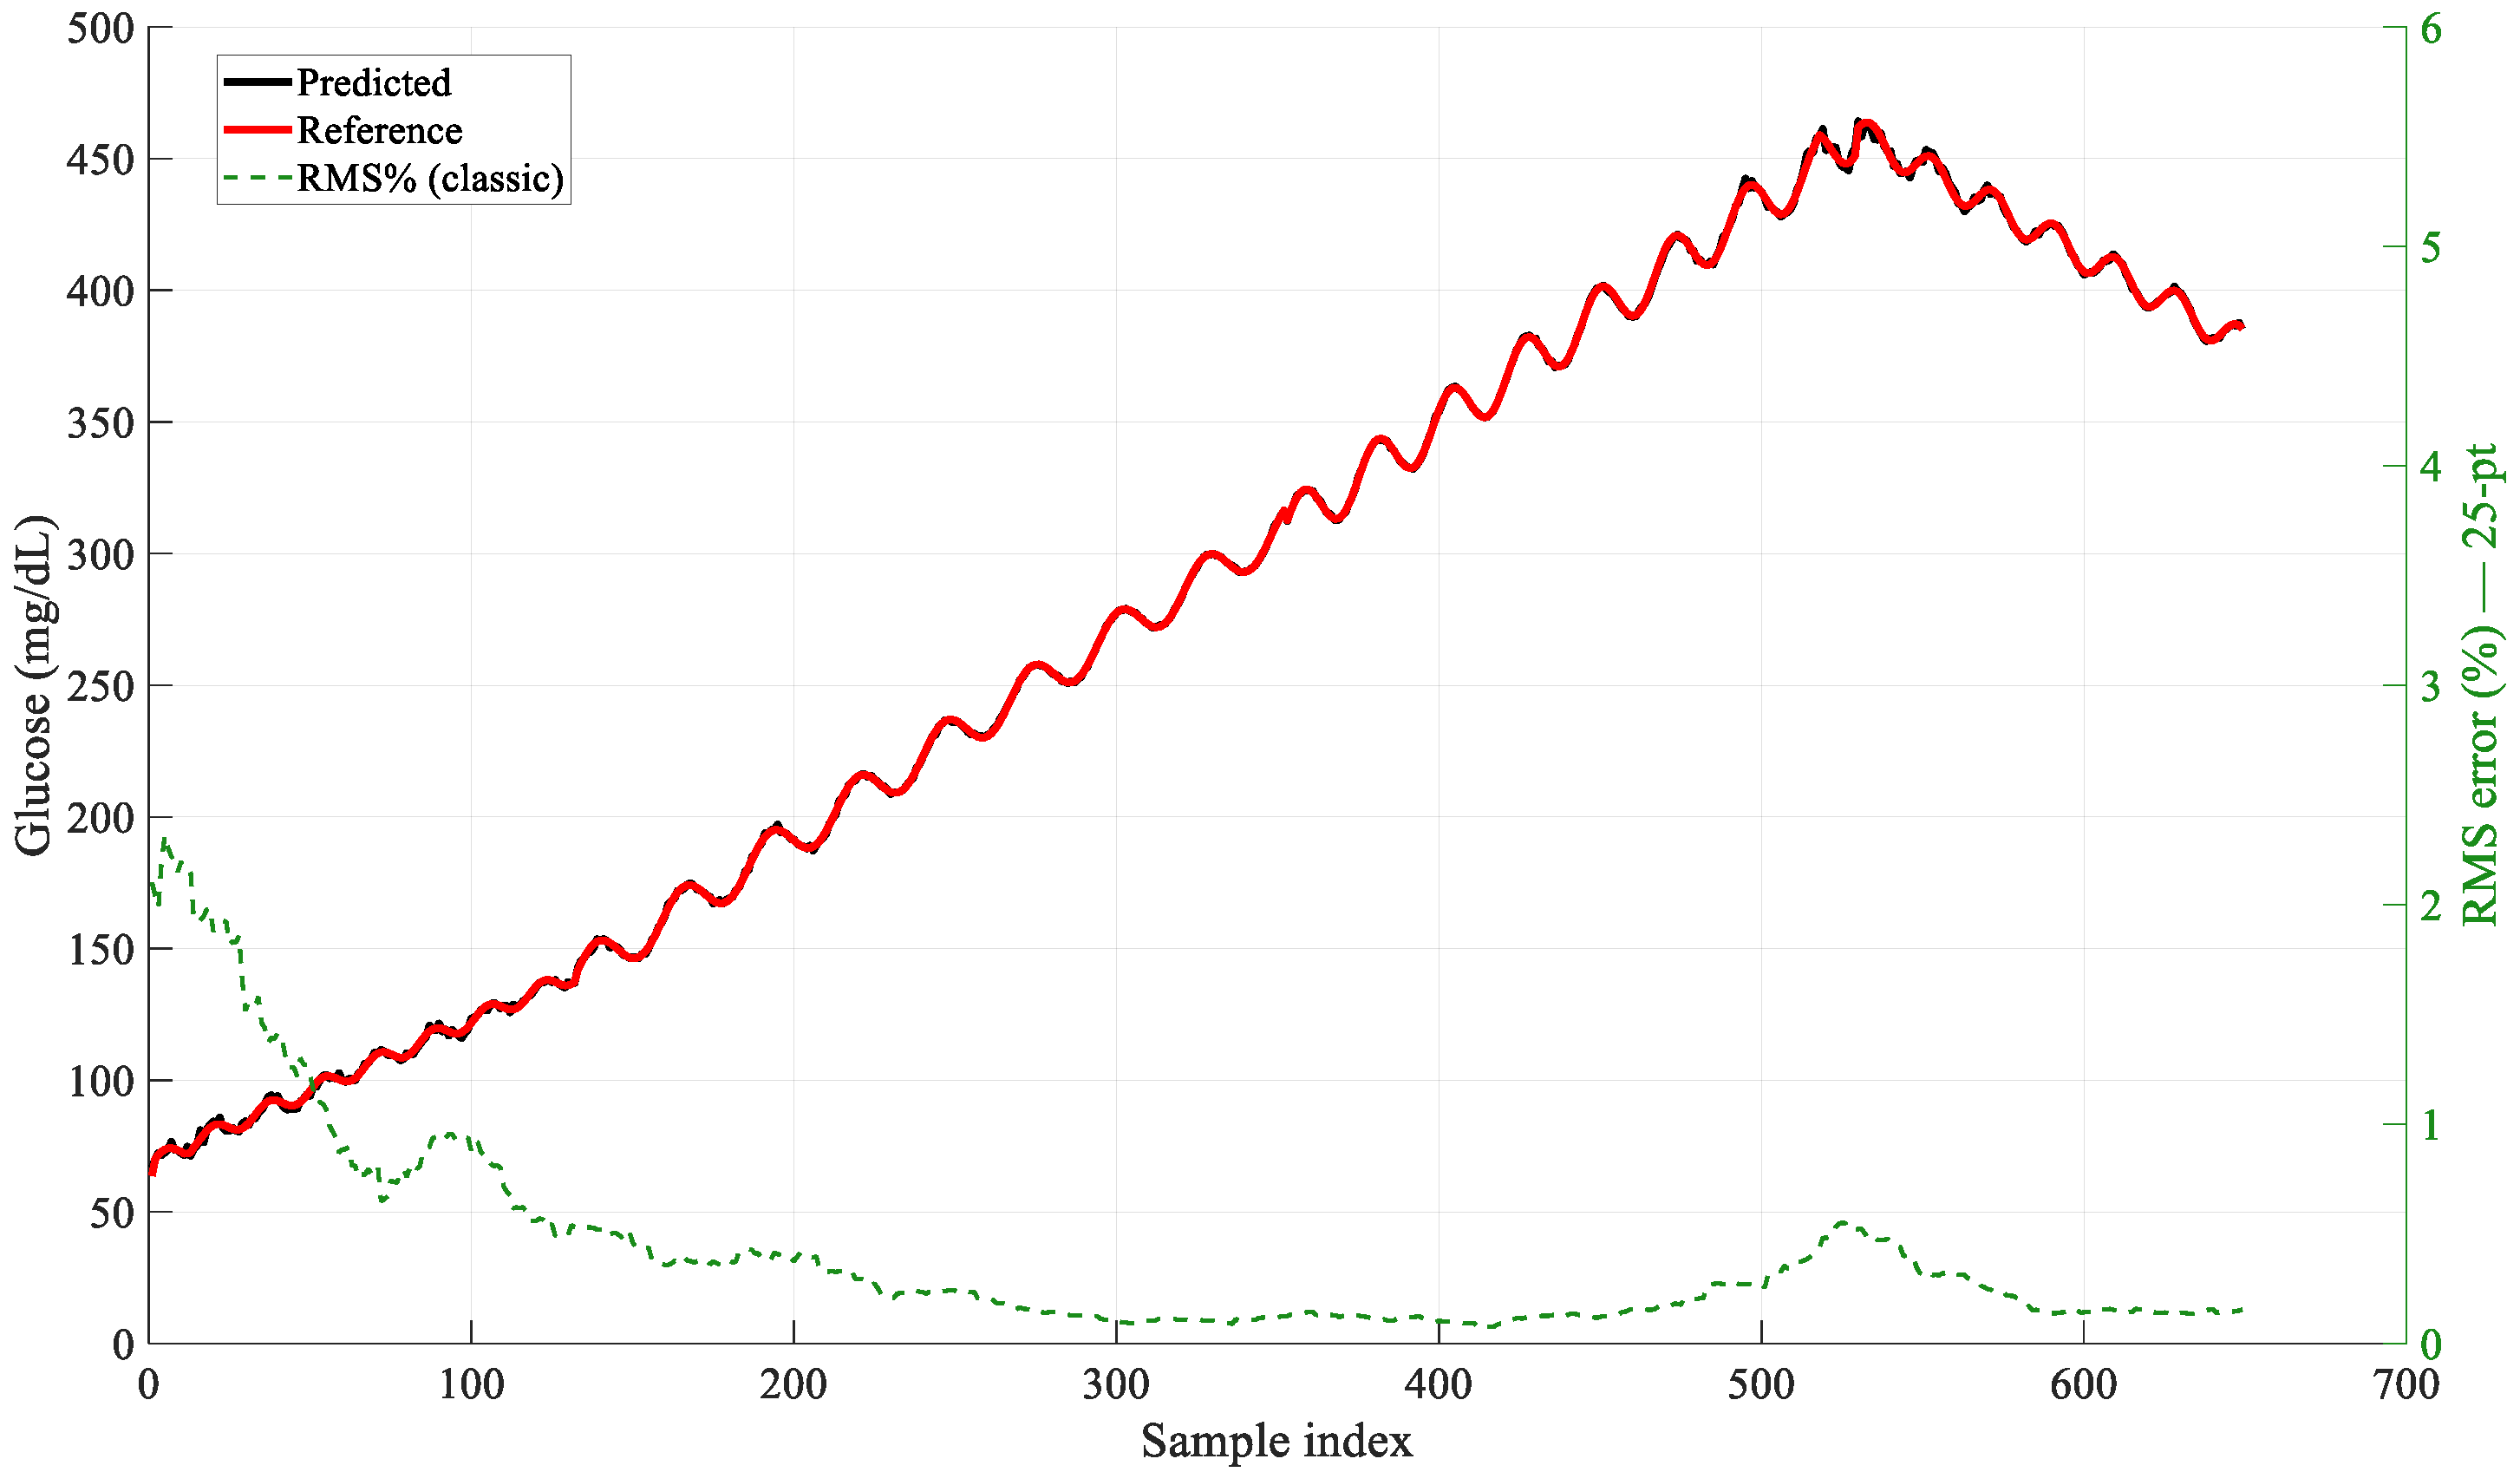
We evaluated the physics-informed residual model (PI-Residual DL) using 5-fold cross-validated, out-of-fold (OOF) predictions and a held-out test subset. Performance is reported with absolute (mg/dL) and relative (% metrics and with band-wise analysis using clinically meaningful glucose ranges: <80, 80–180, and >180 mg/dL. Figure 18 represents the time-series fidelity and stability; the predicted glucose closely tracks the reference trace across the full trajectory, while the right axis shows a 25-point moving RMS%. The RMS% remains <2% over the sequence and drops to <1% after the initial segment, evidence that residual learning effectively suppresses heteroscedastic noise and model mismatch across operating ranges.
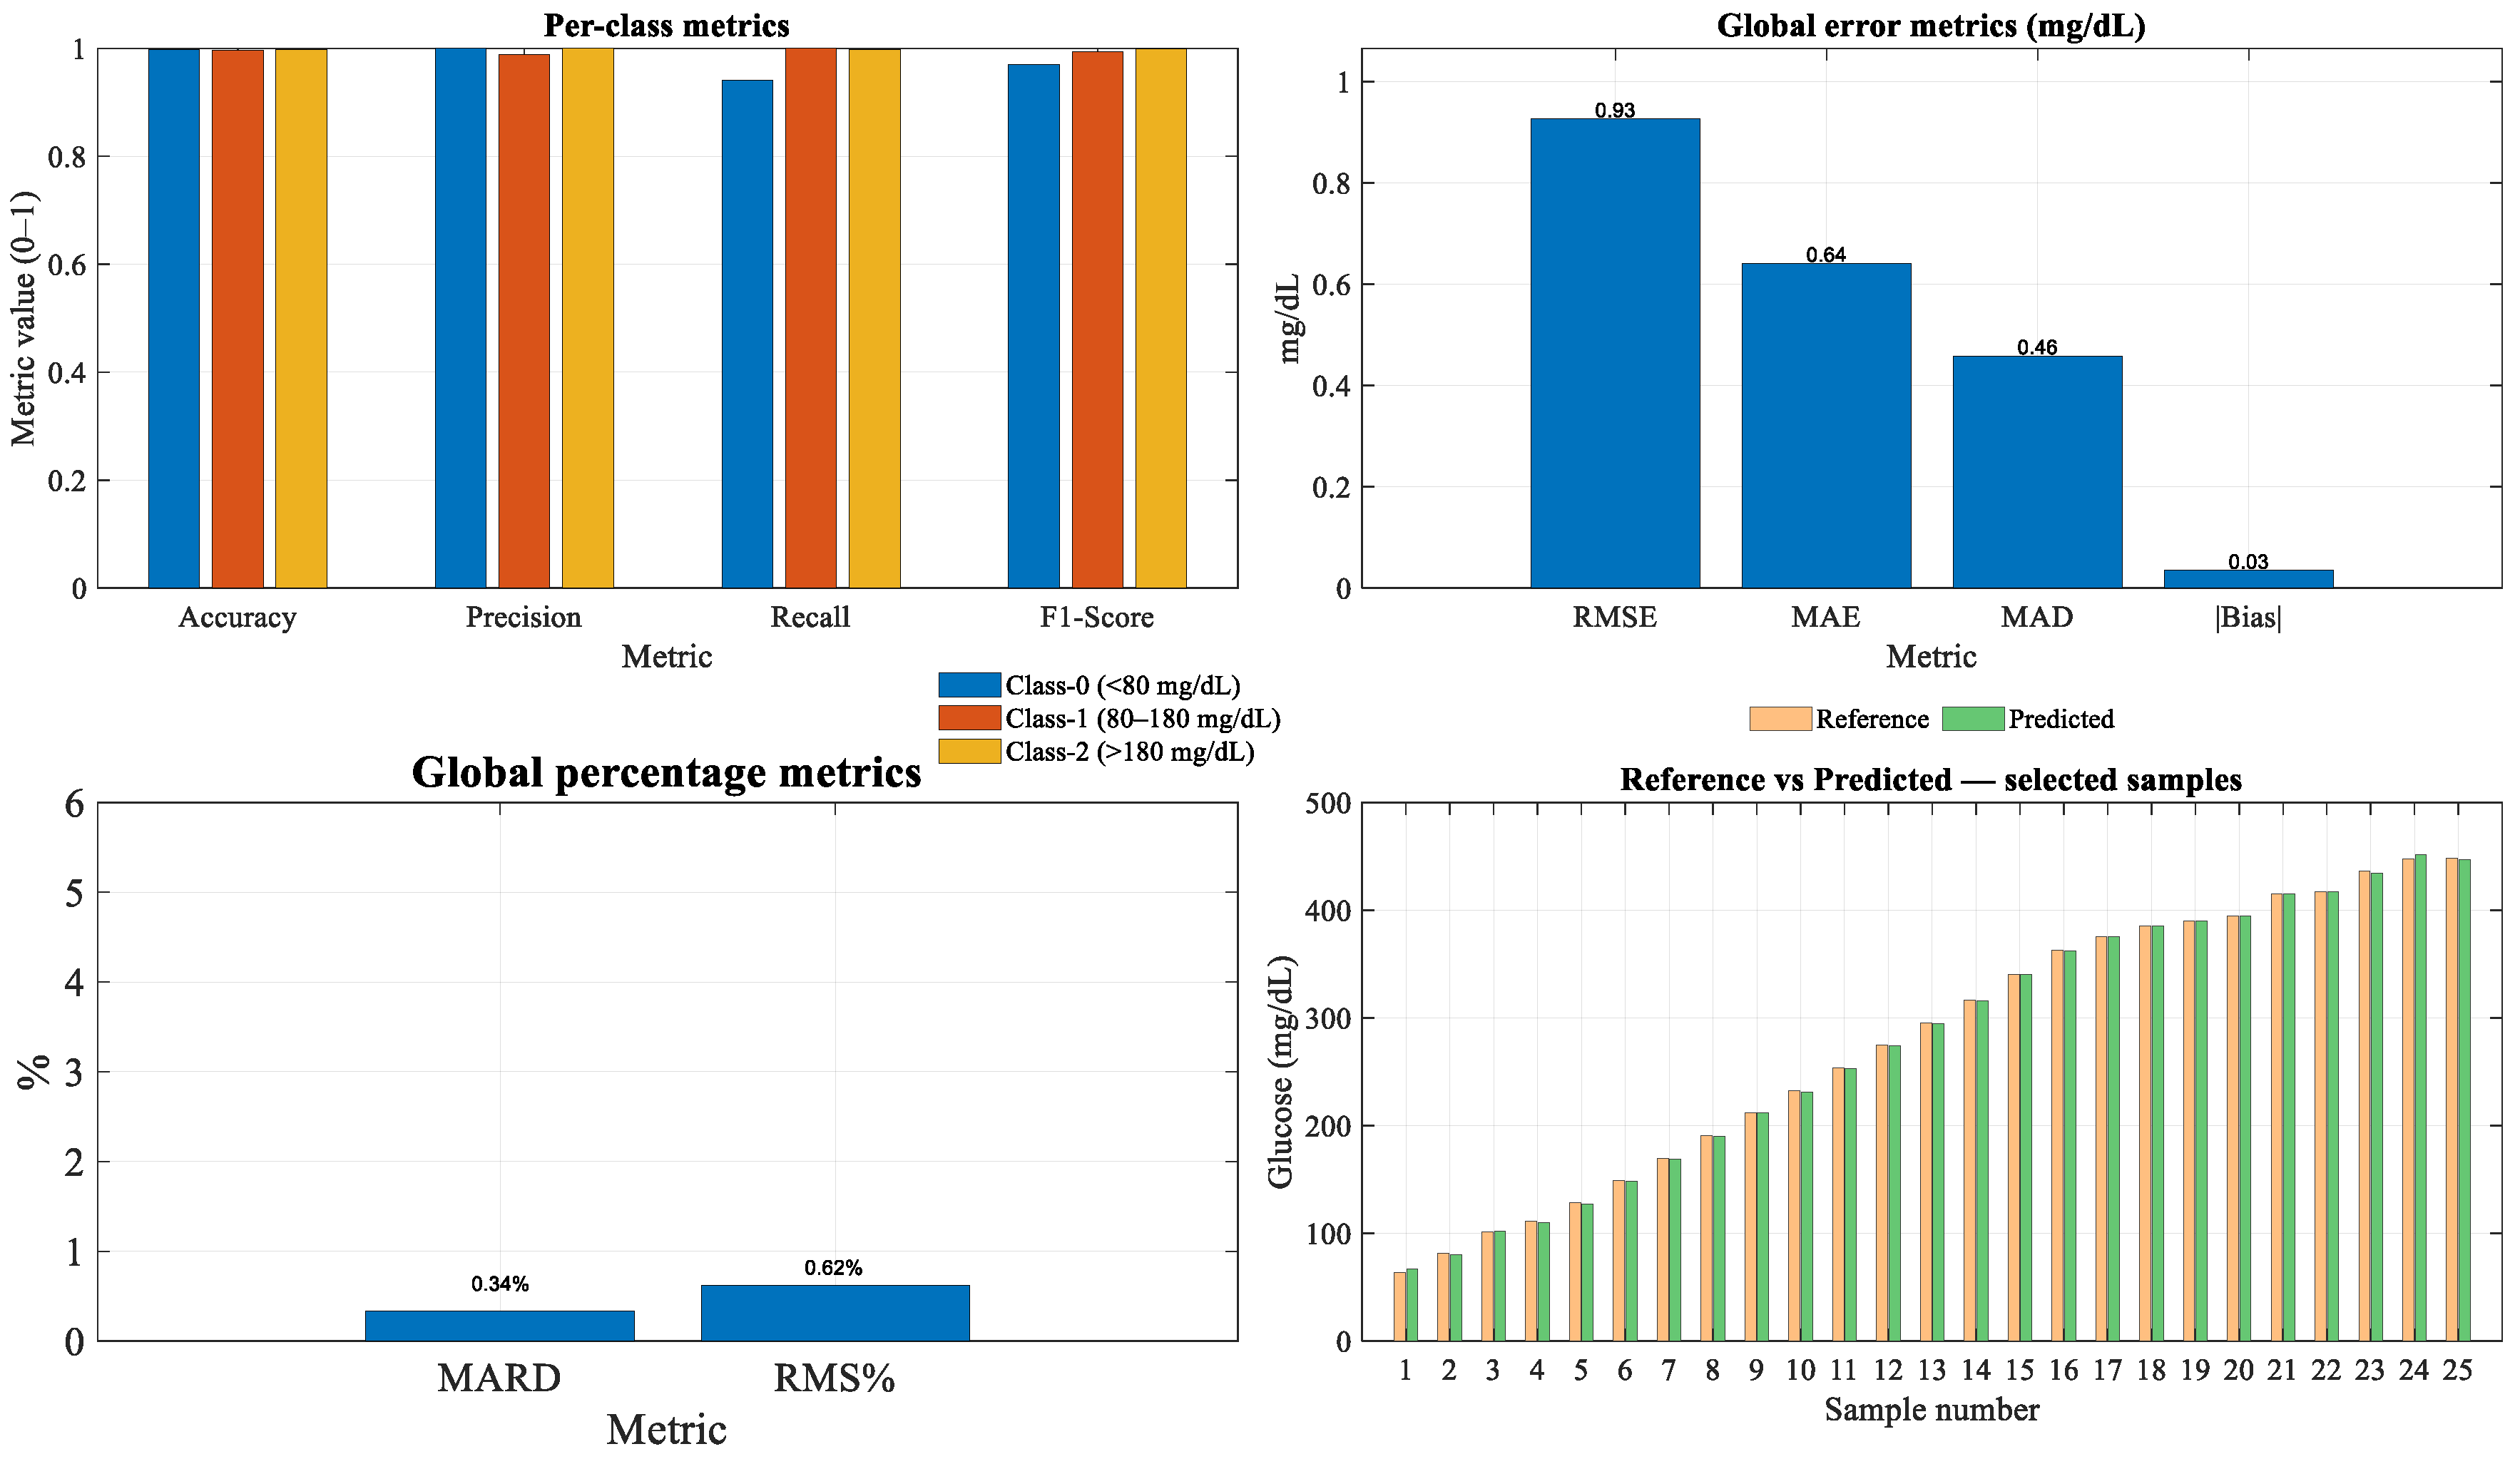
Figure 19 represents the performance. Metrics, including per-class metrics like accuracy, precision, recall, and F1 for the three clinical bands, are all ≥0.95 (near-unity bars), indicating balanced performance in hypoglycemic, euglycemic, and hyperglycemic ranges. Figure 16b represents the global absolute errors, including: Aggregate errors are small: RMSE ≈ 0.93 mg/dL, MAE ≈ 0.64 mg/dL, MAD ≈ 0.46 mg/dL, with |Bias| ≈ 0.03 mg/dL, confirming negligible systematic offset. Figure 18 represents the global percentage errors, including: Relative metrics remain sub-percent: MARD ≈ 0.34% and RMS% ≈ 0.62%, consistent with the low moving RMS% observed in Figure 18. Figure 18 represents the sample-wise agreement. The grouped bars for representative samples (spanning ~60–450 mg/dL) show near-overlap of reference and prediction, illustrating tight local agreement across the dynamic range. The PI-Residual DL delivers sub-mg/dL absolute error and sub-percent relative error with minimal bias, demonstrating the value of learning the residual on top of the physics inversion, rather than replacing it.
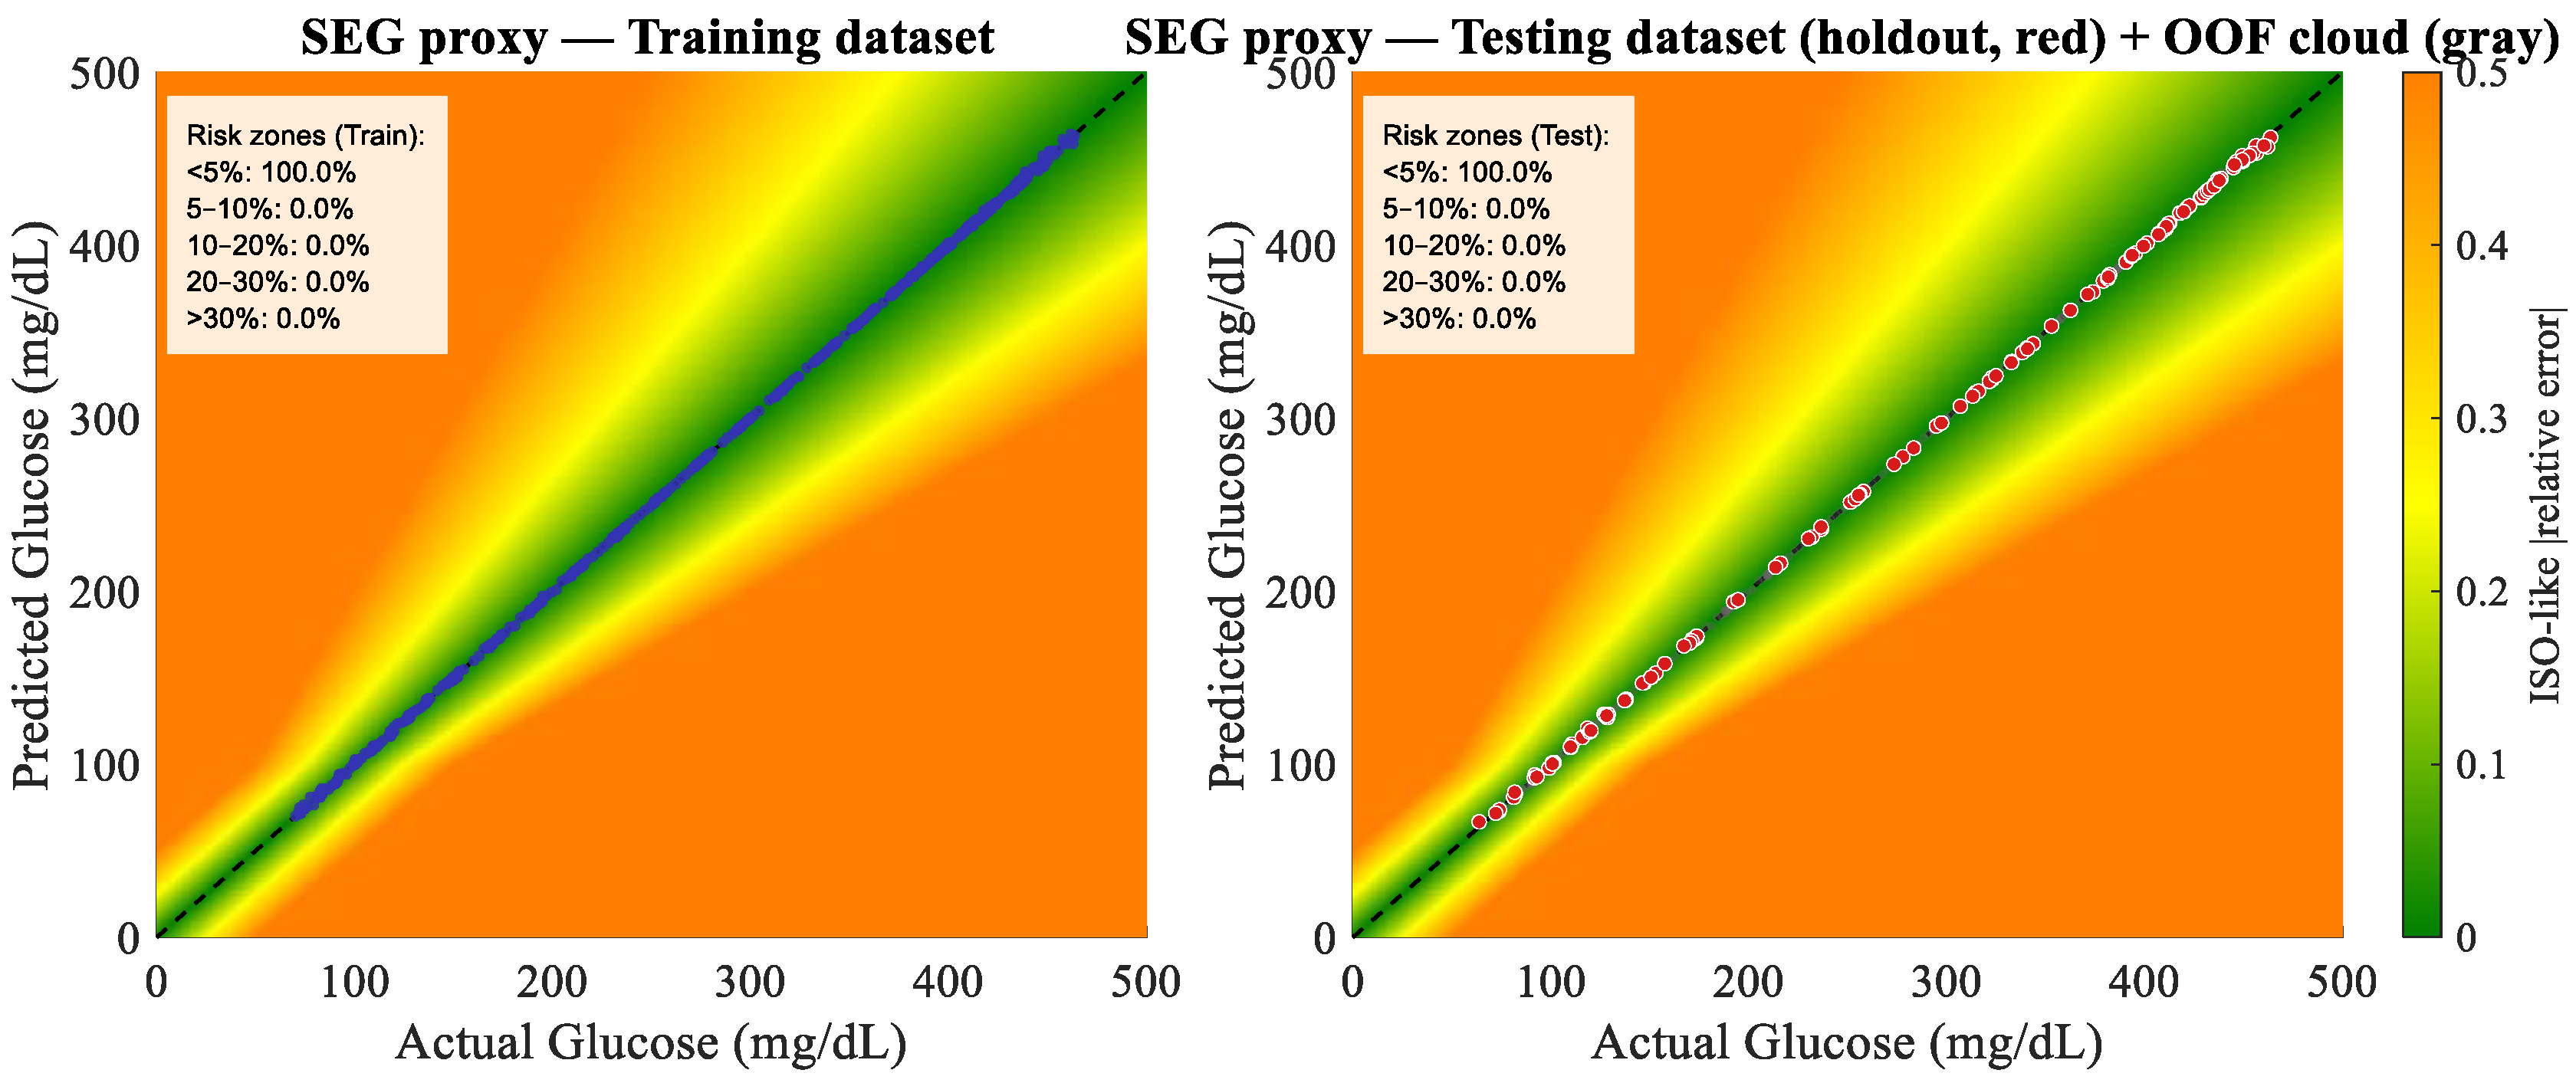
These characteristics are aligned with safety-oriented objectives (e.g., keeping errors within low-risk zones on SEG-like analyses). The SEG plot analysis in Figure 20 demonstrates that the PI-Residual DL model maintains uniformly low error across the operating range. Predictions adhere closely to the identity line from ~60 to ~460 mg/dL without visible bias or fan-out at the extremes. On the held-out test set, 100% of samples remain in the <5% error band, mirroring the training behavior; the OOF cloud exhibits the same tight concentration. These findings indicate effective correction of systematic model mismatch and robustness to heteroscedastic noise, yielding a risk profile consistent with low clinical risk under SEG-style evaluation.
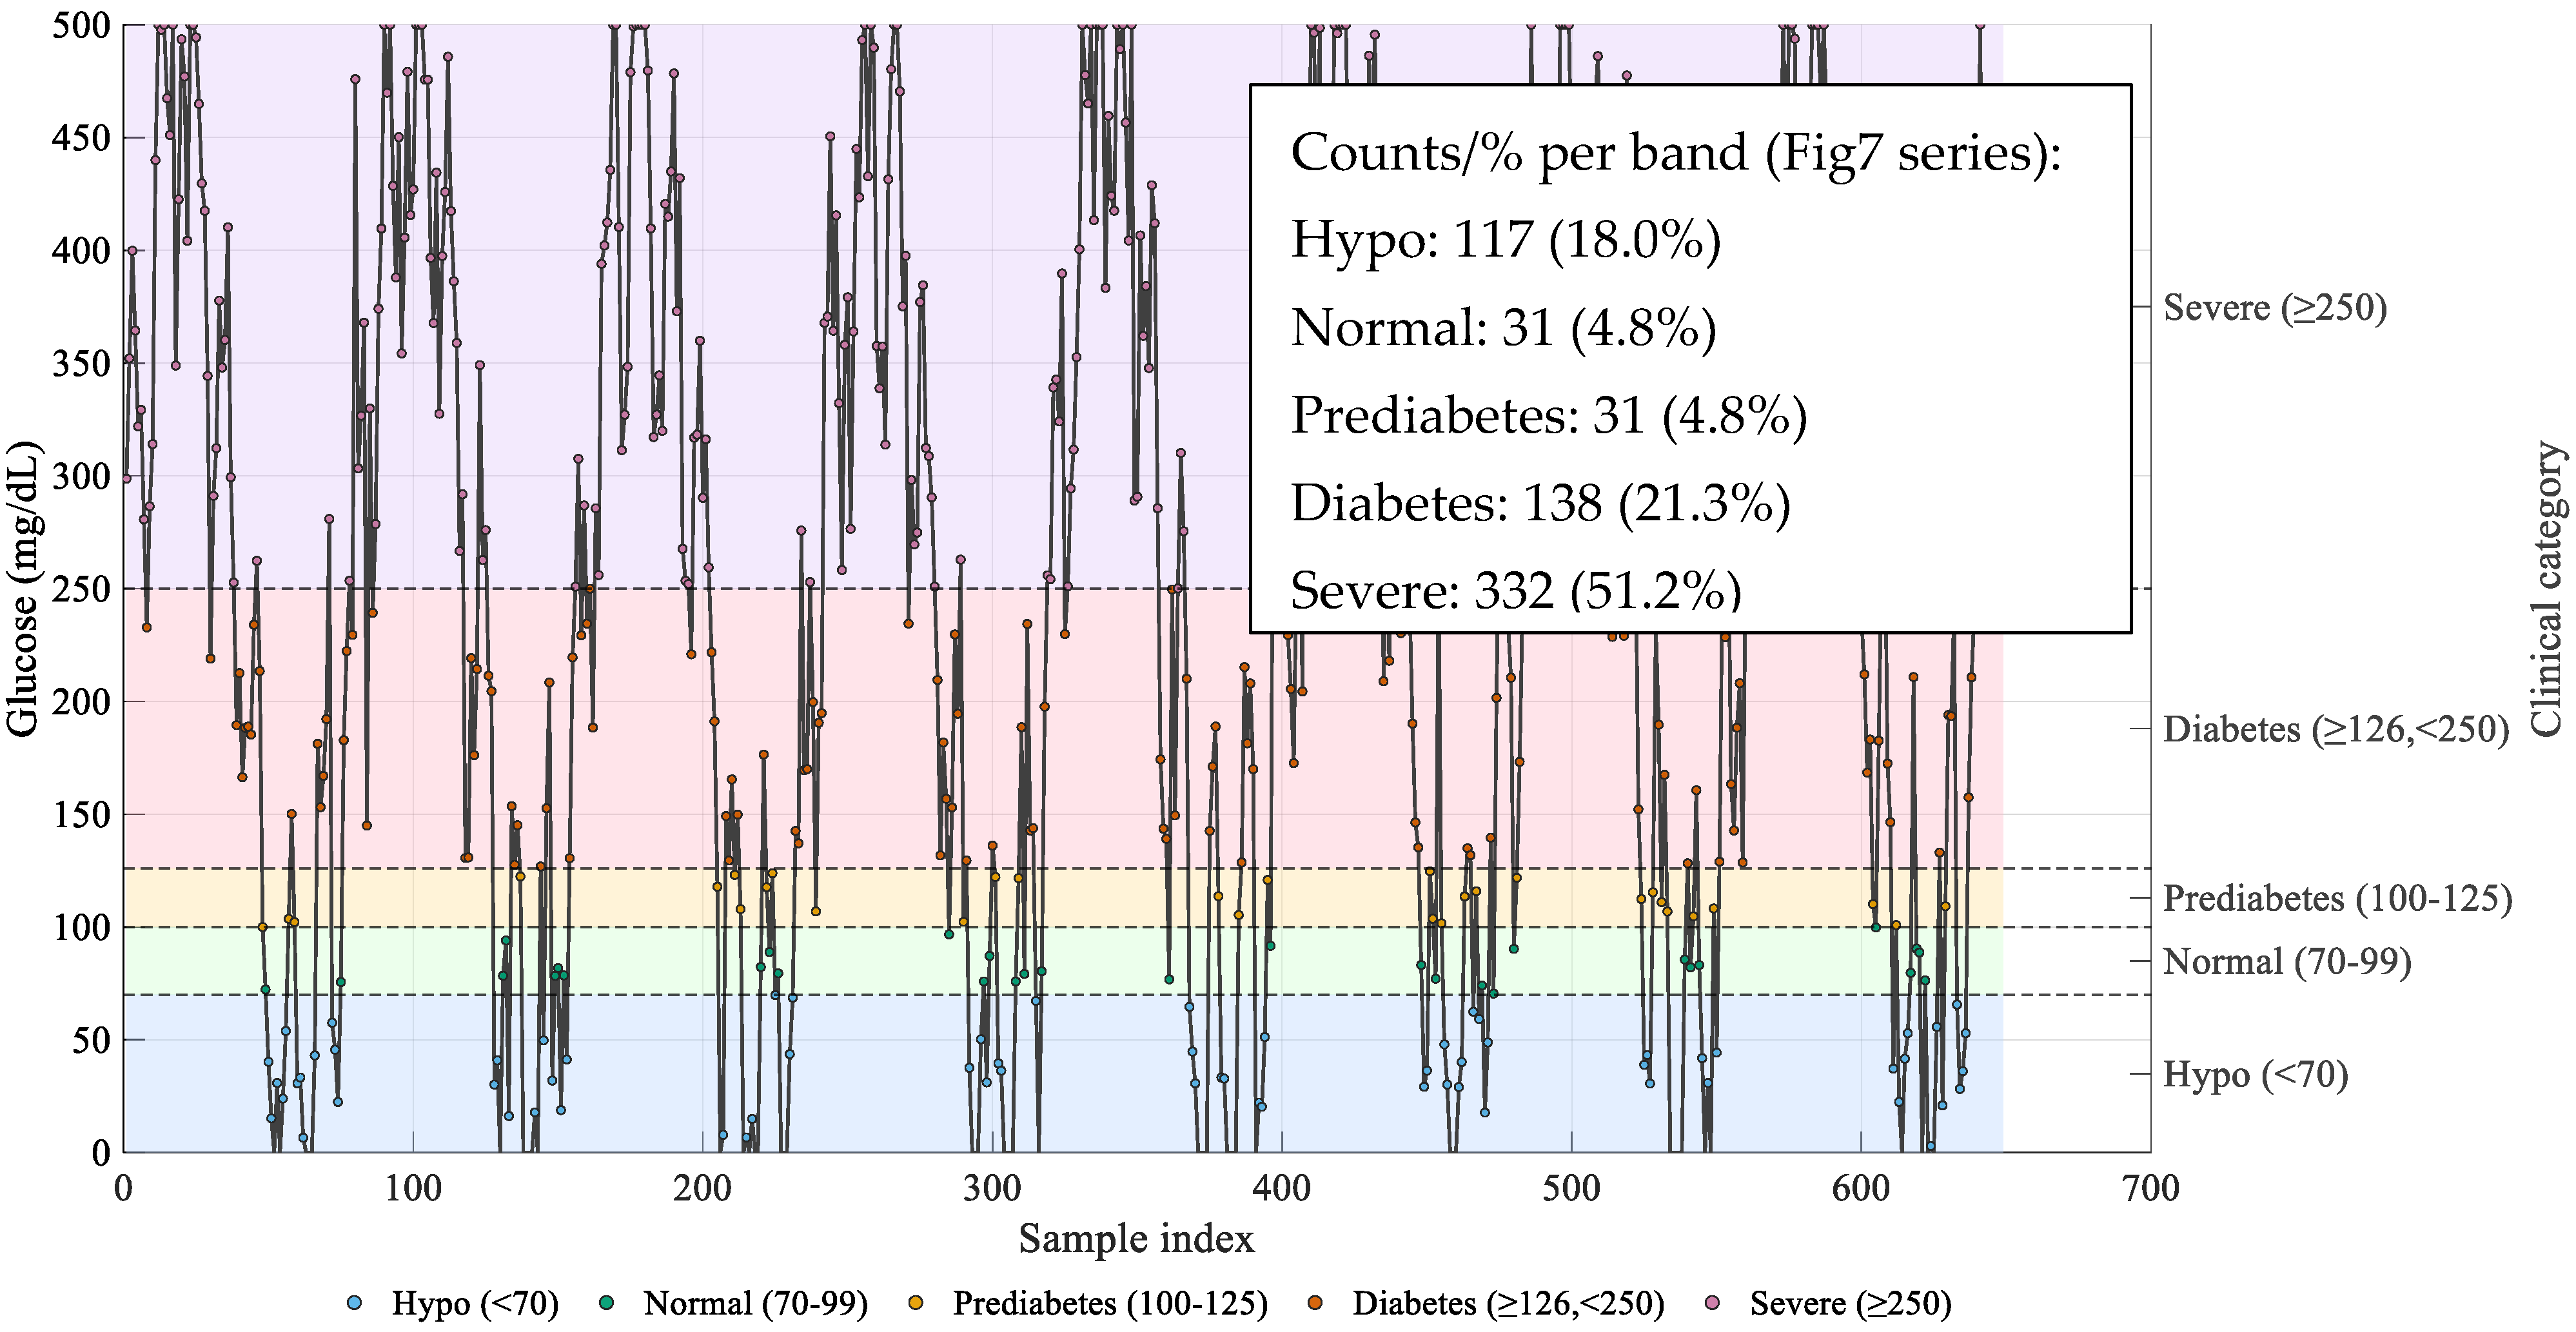
Figure 21 depicts a stress-test glucose trajectory projected onto five clinical bands using fixed thresholds at 70/100/126/250 mg/dL. The black polyline is the time series; colored markers indicate the band assigned to each sample within the shaded regions (hypoglycemia < 70, normal 70–99, prediabetes 100–125, diabetes ≥ 126 and <250, and severe ≥250 mg/dL). The series deliberately spans the full dynamic range, with band occupancy of 18.0% hypoglycemia, 4.8% normal, 4.8% prediabetes, 21.3% diabetes, and 51.2% severe. This stratification provides an immediate clinical reading of the sequence and supplies the discrete labels used in subsequent classification analyses (per-class metrics and confusion matrices). Figure 19 presents the full set of reference glucose measurements as a time series over the sample index, with each point color-coded by clinical category. The shaded background and dashed thresholds mark the standard bands: Hypo (<70 mg/dL, blue), Normal (70–99 mg/dL, green), Prediabetes (100–125 mg/dL, yellow), Diabetes (126–249 mg/dL, orange), and Severe (≥250 mg/dL, violet). The main diagonal in both confusion matrices is shown in magenta (pink). A polyline connects successive samples to highlight the large intra-record variability. The inset reports the class counts and percentages, indicating a pronounced imbalance: most samples lie in the Severe and Diabetes bands, while Normal and Prediabetes are underrepresented, with a non-negligible Hypo portion.
Overall, Figure 22 summarizes the dataset distribution (0–500 mg/dL on the y-axis) and justifies band-aware evaluation and class-balancing strategies used in the analysis.

6. Comparison with Previous Studies

Table 5 compares the specifications and performance of the proposed microwave sensor with other sensors that are currently in use. A comparison of some of the sensors suggested in the most recent literature is shown in Table 5. The sensor exhibits a better frequency shift of 570 MHz with respect to the glucose variation range (0–500 mg/dL) compared to other referenced sensors, as can be seen. It is also evident from the table that the developed sensor has enhanced sensitivity compared to other sensors that are mentioned. The various sensors in the comparison employ distinct measurement techniques to determine sensitivity according to the characteristics of the reflection coefficient and the amount of glucose concentration, respectively. This table shows that two definitions of sensitivity have been employed by researchers. There are two types: ∆f in MHz/mg/dL and S 11 in dB/mg/dL.
Furthermore, compared with traditional resonator-based sensors (such as active SRR, Hilbert-shaped, and corona-shaped structures), the proposed dual-component system consisting of a crescent-loaded elliptical patch antenna coupled with a groundless CSRR tag achieves a remarkable resonant frequency shift of 1.14 MHz/mg/dL and a reflection-based sensitivity of 0.015 dB/mg/dL. These values are substantially higher than those obtained in comparable studies conducted at similar frequency ranges (1–10 GHz).
Another distinctive advantage lies in the integration of physics-informed deep learning (PI-DL), which enables accurate glucose estimation even under noisy conditions, bridging the gap between electromagnetic modeling and data-driven prediction. This hybrid approach not only enhances accuracy (MAE < 1 mg/dL) but also improves robustness against measurement variability, a factor rarely addressed in prior works.
Overall, the proposed sensor achieves a balanced combination of high sensitivity, low complexity, and enhanced practical feasibility, positioning it as a promising candidate for the next generation of non-invasive, wearable microwave glucose sensors. Numerically, previous CSRR-based glucose sensors reported sensitivity values of about 0.062 dB/(mg/dL) for the triple-pole CSRR and operated only within a narrow glucose range of 70–150 mg/dL. The four-cell hexagonal CSRR exhibited detectable frequency shifts only in the 70–120 mg/dL range. Moreover, none of these prior works incorporated artificial intelligence or deep-learning-based prediction models. In contrast, our inductive-stub-coupled CSRR achieves a much wider glucose range of 0–500 mg/dL, offers higher amplitude and frequency sensitivity under identical measurement conditions, and is further enhanced by an integrated deep-learning/AI-based prediction framework, providing superior accuracy and reliability.

7. Conclusions

This work presented the design, fabrication, and experimental validation of a novel non-invasive microwave glucose sensor enhanced with a complementary split-ring resonator (CSRR) tag unit. The integration of the tag significantly improved field confinement, electromagnetic coupling, and sensing sensitivity, enabling the sensor to outperform many conventional microwave glucose sensors reported in the literature, particularly in terms of detection resolution and measurement stability. The multi-resonant operation, broad dielectric characterization capability, and compact wearable design make the proposed sensor a strong candidate for next-generation non-invasive monitoring systems. Beyond the hardware innovation, a physics-informed deep learning (PI-DL) framework was developed and trained on experimental S-parameter data to predict blood glucose concentration under realistic noisy conditions. Unlike many existing machine learning approaches that require large datasets and often degrade under measurement noise, the proposed PI-DL model leverages the underlying electromagnetic physics to maintain enhanced robustness and accuracy. The model achieved superior predictive performance, with a mean absolute error below 1 mg/dL even in the presence of measurement uncertainty and environmental fluctuations. The synergy between advanced sensor engineering, enhanced by the CSRR tag unit, and the noise-resilient deep learning model demonstrates a significant advancement over prior art. Together, these contributions establish a comprehensive and practical framework for accurate, non-invasive, and wearable glucose monitoring, paving the way for reliable long-term diabetes management technologies.

Author Contributions

Z.A.A.H.—Conceptualization and simulation; M.J.F.—Supervision and review; T.A.E.—Experimental implementation; I.A.M.—Experimental validation and writing. All authors have read and agreed to the published version of the manuscript.

Funding

This research received no external funding.

Informed Consent Statement

This research was funded by International Applied and Theoretical Research Center.

Data Availability Statement

The data presented in this study are available within the article.

Conflicts of Interest

The authors declare that they have no conflicts of interest in this work.

References

  1. World Health Organization. World Health Day 2016: WHO Calls for Global Action to Halt Rise in and Improve Care for People with Diabetes; World Health Organization: Geneva, Switzerland, 2016; Available online: https://www.who.int/news/item/06-04-2016-world-health-day-2016-who-calls-for-global-action-to-halt-rise-in-and-improve-care-for-people-with-diabetes (accessed on 6 April 2016).
  2. Whiting, D.R.; Guariguata, L.; Weil, C.; Shaw, J. IDF diabetes atlas: Global estimates of the prevalence of diabetes for 2011 and 2030. Diabetes Res. Clin. Pract. 2011, 94, 311–321. [Google Scholar] [CrossRef] [Scilit]
  3. Saurabh, R.; Shivesh, T.; Gaurav, U.; Shiv, S.; Vijay, S. An electromagnetic band gap-based complementary split ring resonator loaded patch antenna for glucose level measurement. IEEE Sens. J. 2021, 21, 22679–22687. [Google Scholar]
  4. American Diabetes Association. Diagnosis and classification of diabetes mellitus. Diabetes Care 2014, 37, S81–S90. [Google Scholar] [CrossRef] [Scilit]
  5. Holt, R.; Cockram, A.F.C.; Goldstein, B. Textbook of Diabetes; John Wiley & Sons: New York, NY, USA, 2011. [Google Scholar]
  6. American Diabetes Association. Glycemic targets: Standards of medical care in diabetes. Diabetes Care 2019, 42, S61–S70. [Google Scholar] [CrossRef] [Scilit]
  7. Burt, M.; Roberts, G.; Aguilar-Loza, N.; Stranks, S. Comparison of continuous glucose monitoring and finger-prick blood glucose levels in hospitalized patients administered basal–bolus insulin. Diabetes Technol. Ther. 2013, 15, 241–245. [Google Scholar] [CrossRef] [Scilit] [PubMed]
  8. Gonzales, W.; Mobashsher, A.; Abbosh, A. The progress of glucose monitoring—A review of invasive to minimally and non-invasive techniques, devices and sensors. Sensors 2019, 19, 800. [Google Scholar] [CrossRef] [Scilit]
  9. Lin, T.; Gal, A.; Mayzel, Y.; Horman, K.; Bahartan, K. Non-invasive glucose monitoring: A review of challenges and recent advances. Curr. Trends Biomed. Eng. Biosci. 2017, 6, 1–8. [Google Scholar] [CrossRef] [Scilit]
  10. Bruen, D.; Delaney, C.; Florea, L.; Diamond, D. Glucose sensing for diabetes monitoring: Recent developments. Sensors 2017, 17, 1866. [Google Scholar] [CrossRef] [Scilit]
  11. Kandwal, A.; Liu, L.W.; Igbe, T.; Li, J.; Liu, Y.; Das, R.; Kanaujia, B.K.; Wang, L.; Nie, Z. A novel method of using bifilar spiral resonator for designing thin robust flexible glucose sensors. IEEE Trans. Instrum. Meas. 2021, 70, 1–10. [Google Scholar] [CrossRef] [Scilit]
  12. Kandwal, A.; Li, J.; Igbe, T.; Liu, Y.; Das, R.; Kanaujia, B.K.; Nie, Z. Young’s double slit method-based higher order mode surface plasmon microwave antenna sensor: Modeling, measurements and application. IEEE Trans. Instrum. Meas. 2022, 71, 8006711. [Google Scholar] [CrossRef] [Scilit]
  13. Navaei, M.; Rezaei, P.; Kiani, S. Measurement of low-loss aqueous solutions permittivity with high detection accuracy by a contact and free-label resonance microwave sensor. Int. J. Commun. Syst. 2023, 36, e5417. [Google Scholar] [CrossRef] [Scilit]
  14. Kim, J.; Babajanyan, A.; Hovsepyan, A.; Lee, K.; Friedman, B. Microwave dielectric resonator biosensor for aqueous glucose solution. Rev. Sci. Instrum. 2008, 79, 2–5. [Google Scholar] [CrossRef] [Scilit]
  15. Dobson, R.; Wu, R.; Callaghan, P. Blood glucose monitoring using microwave cavity perturbation. Electron. Lett. 2012, 48, 905–906. [Google Scholar] [CrossRef] [Scilit]
  16. Wiwatwithaya, S.; Phasukkit, P.; Tungjitkusolmun, S.; Wongtrairat, W. Real-time monitoring glucose by using microwave antenna applied to biosensor. In Proceedings of the 4th 2011 Biomedical Engineering International Conference, Chiang Mai, Thailand, 29–31 January 2012. [Google Scholar]
  17. Hofmann, M.; Bloss, M.; Weigel, R.; Fischer, G.; Kissinger, D. Non-invasive glucose monitoring using open electromagnetic waveguides. In Proceedings of the 2012 42nd European Microwave Conference, Amsterdam, The Netherlands, 29 October–1 November 2012. [Google Scholar]
  18. Govind, G.; Akhtar, M.J. Metamaterial-inspired microwave microfluidic sensor for glucose monitoring in aqueous solutions. IEEE Sens. J. 2019, 19, 11900–11907. [Google Scholar] [CrossRef] [Scilit]
  19. Zhou, Z.; Wei, Z.; Tang, Z.; Yin, Y. Design and analysis of a wideband multiple-microstrip dipole antenna with high isolation. IEEE Antennas Wirel. Propag. Lett. 2019, 18, 722–726. [Google Scholar] [CrossRef] [Scilit]
  20. Kamil, R.A.; Alsabti, S.M.B.; Abdulsattar, R.K.; Mohammed, A.H.; Elwi, T.A. On the Enhancement Anomaly Detection for RF Bio-Sensors by Computing Artificial Networks Using Machine Learning Techniques. Infocommun. J. 2025, XVII, 89–95. [Google Scholar] [CrossRef] [Scilit]
  21. Kim, S.; Melikyan, H.; Kim, J.; Babajanyan, A.; Lee, J.-H.; Enkhtur, L.; Friedman, B.; Lee, K. Noninvasive in vitro measurement of pig-blood D-glucose by using a microwave cavity sensor. Diabetes Res. Clin. Pract. 2012, 96, 379–384. [Google Scholar] [CrossRef] [Scilit]
  22. Costanzo, S.; Cuccaro, A.; Dell’Aversano, A.; Buonanno, G.; Solimene, R. Microwave biomedical sensors with stable response: Basic idea and preliminary numerical assessments for blood glucose monitoring. IEEE Access 2023, 11, 99058–99069. [Google Scholar] [CrossRef] [Scilit]
  23. AbdulSattar, R.K.; Alibakhshikenari, M.; Elwi, T.A.; Kouhalvandi, L.; Hassain, Z.A.A.; Virdee, B.S.; Soruri, M.; Tokan, N.T.; Parchin, N.O.; See, C.H.; et al. Metamaterial Based Sensor Using Fractal Hilbert Structure for Liquid Characterization. In Proceedings of the 2023 International Conference on Electromagnetics in Advanced Applications (ICEAA), Venice, Italy, 9–13 October 2023; pp. 480–483. [Google Scholar] [CrossRef] [Scilit]
  24. Abdulsattar; Khalid, R.; Muqdad, S.; Hassain, A.; Zaid, A.; Muhsin; Yousif, M. Artificial Neural Network Approach for Estimation of Moisture Content in Crude Oil by Using a Microwave Sensor. Int. J. Microw. Opt. Technol. 2023, 18, 511. [Google Scholar]
  25. Alsultani, A.B.; Kovács, K.; Chase, J.; Benyó, B. Advances in Invasive and Non-Invasive Glucose Monitoring: A Review of Microwave-Based Sensors. Sens. Actuators Rep. 2025, 9, 100332. [Google Scholar] [CrossRef] [Scilit]
  26. Kiani, M.; Mir, Z.H.; Ghahramani, B.; Sadr, A.M.; Gholami, M. Improved Fully 3D-Printed SIW-Based Sensor for Non-Invasive Glucose Measurement. Sensors 2025, 25, 2382. [Google Scholar]
  27. Juan, C.G.; Grenier, K.; Zarifi, M.H.; Ebrahimi, A.; Martín, F. Planar Microwave Sensors: State of the Art and Applications. IEEE Access 2025, 13, 143985–144038. [Google Scholar] [CrossRef] [Scilit]
  28. Singh, T.; Mishra, P.K.; Pal, A.; Tripathi, V.S. A Planar Microwave Sensor for Noninvasive Detection of Glucose Concentration Using Regression Analysis. Int. J. Microw. Wirel. Technol. 2023, 15, 1343–1353. [Google Scholar] [CrossRef] [Scilit]
  29. Gupta, M.; Mathur, V. Multiband multiple elliptical microstrip patch antenna with circular polarization. Wirel. Pers. Commun. 2018, 102, 355–368. [Google Scholar] [CrossRef] [Scilit]
  30. Jose, J.V.; Rekh, A.S.; Jose, M.J. Design techniques for elliptical microstrip patch antenna and their effects on antenna performance. Int. J. Innov. Technol. Explor. Eng. 2019, 8, 2317–2320. [Google Scholar] [CrossRef] [Scilit]
  31. Costanzo, S.; Cioffi, V.; Raffo, A. Complex permittivity effect on the performances of non-invasive microwave blood glucose sensing: Enhanced model and preliminary results. In Proceedings of the World Conference on Information Systems and Technologies, Naples, Italy, 27–29 March 2018; Springer: Cham, Switzerland. [Google Scholar]
  32. Gabriel, C.; Gabriel, S.; Corthout, E. The dielectric properties of biological tissues: III. Parametric models for the dielectric spectrum. Phys. Med. Biol. 1996, 41, 2271–2293. [Google Scholar] [CrossRef] [Scilit]
  33. Morshidi, W.H.W.; Zaharudin, Z.; Khan, S.; Nordin, A.N.; Shaikh, F.A.; Adam, I. Inter-digital sensor for non-invasive blood glucose monitoring. In Proceedings of the 2018 IEEE International Conference on Innovative Research and Development (ICIRD), Bangkok, Thailand, 11–12 May 2018. [Google Scholar]
  34. Venkataraman, J.; Freer, B. Feasibility of non-invasive blood glucose monitoring: In-Vitro measurements and phantom models. In Proceedings of the 2011 IEEE International Symposium on Antennas and Propagation (APSURSI), Spokane, WA, USA, 3–8 July 2011; IEEE: New York, NY, USA; pp. 603–606. [Google Scholar]
  35. Abdolrazzaghi, M.; Katchinskiy, N.; Elezzabi, A.Y.; Light, P.E.; Daneshmand, M. Noninvasive glucose sensing in aqueous solutions using an active split-ring resonator. IEEE Sens. J. 2021, 21, 18742–18755. [Google Scholar] [CrossRef] [Scilit]
  36. Hasan, M.N.; Tamanna, S.; Singh, P.; Nadeem, M.D.; Rudramuni, M. Cylindrical dielectric resonator antenna sensor for non-invasive glucose sensing application. In Proceedings of the 2019 6th International Conference on Signal Processing and Integrated Networks (SPIN), Noida, India, 7–8 March 2019. [Google Scholar]
  37. Mondal, D.; Tiwari, N.K.; Akhtar, M.J. Microwave assisted non-invasive microfluidic biosensor for monitoring glucose concentration. In Proceedings of the IEEE Sensors, New Delhi, India, 28–31 October 2018. [Google Scholar]
  38. Kumar, A.; Wang, C.; Meng, F.-Y.; Zhou, Z.-L.; Zhao, M.; Yan, G.-F.; Kim, E.-S.; Kim, N.-Y. High-sensitivity, quantified, linear and mediator-free resonator-based microwave biosensor for glucose detection. Sensors 2020, 20, 4024. [Google Scholar] [CrossRef] [Scilit]
  39. Cebedio, M.C.; Rabioglio, L.A.; Gelosi, I.E.; Ribas, R.A.; Uriz, A.J.; Moreira, J.C. Analysis and design of a microwave coplanar sensor for non-invasive blood glucose measurements. IEEE Sens. J. 2020, 20, 10572–10581. [Google Scholar] [CrossRef] [Scilit]
  40. Jang, C.; Park, J.K.; Lee, H.J.; Yun, G.H.; Yook, J.G. Temperature-corrected fluidic glucose sensor based on microwave resonator. Sensors 2018, 18, 3850. [Google Scholar] [CrossRef] [Scilit]
  41. Ebrahimi, A.; Scott, J.; Ghorbani, K. Microwave reflective biosensor for glucose level detection in aqueous solutions. Sens. Actuators A Phys. 2020, 301, 111662. [Google Scholar] [CrossRef] [Scilit]
  42. Odabashyan, L.; Babajanyan, A.; Baghdasaryan, Z.; Kim, S.; Kim, J.; Friedman, B.; Lee, J.-H.; Lee, K. Real-time noninvasive measurement of glucose concentration using a modified Hilbert shaped microwave sensor. Sensors 2019, 19, 5525. [Google Scholar] [CrossRef] [Scilit]
  43. Huang, S.Y.; Omkar; Yoshida, Y.; Inda, A.J.G.; Xavier, C.X.; Mu, W.C. Microstrip line-based glucose sensor for noninvasive continuous monitoring using the main field for sensing and multivariable crosschecking. IEEE Sens. J. 2019, 19, 535–547. [Google Scholar] [CrossRef] [Scilit]
  44. Saha, S.; Cano-Garcia, H.; Sotiriou, I.; Lipscombe, O.; Gouzouasis, I.; Koutsoupidou, M.; Palikaras, G.; Mackenzie, R.; Reeve, T.; Kosmas, P.; et al. A glucose sensing system based on transmission measurements at millimeter waves using microstrip patch antennas. Sci. Rep. 2017, 7, 6855. [Google Scholar] [CrossRef] [Scilit] [PubMed]
  45. Abdulkarim, Y.I.; Muhammadsharif, F.F.; Bakır, M.; Awl, H.N.; Karaaslan, M.; Deng, L.; Huang, S. Hypersensitized metamaterials based on a corona-shaped resonator for efficient detection of glucose. Appl. Sci. 2020, 11, 103. [Google Scholar] [CrossRef] [Scilit]
  46. Hassan, R.S. Wireless and battery-free biosensor based on parallel resonators for monitoring a wide range of biosignals. IEEE Trans. Microw. Theory Tech. 2022, 70, 4566–4578. [Google Scholar] [CrossRef] [Scilit]
  47. Omer, A.E.; Shaker, G.; Safavi-Naeini, S.; Ngo, K.; Shubair, R.M.; Alquié, G.; Deshours, F.; Kokabi, H. Multiple-Cell microfluidic dielectric resonator for liquid sensing applications. IEEE Sens. J. 2021, 21, 6094–6104. [Google Scholar] [CrossRef] [Scilit]
  48. Omer, A.E.; Shaker, G.; Safavi-Naeini, S.; Alquié, G.; Deshours, F.; Kokabi, H.; Shubair, R.M. Non-invasive real-time monitoring of glucose level using novel microwave biosensor based on triple-pole CSRR. IEEE Trans. Biomed. Circuits Syst. 2020, 14, 1407–1420. [Google Scholar] [CrossRef] [Scilit]
  49. Omer, A.E.; Shaker, G.; Safavi-Naeini, S.; Kokabi, H.; Alquié, G.; Deshours, F.; Shubair, R.M. Low-cost portable microwave sensor for non-invasive monitoring of blood glucose level: Novel design utilizing a four-cell CSRR hexagonal configuration. Sci. Rep. 2021, 11, 15200. [Google Scholar] [CrossRef] [Scilit]
Figure 1. (a) Structured system design—schematic representation, (b) proposed sensor structure.
Electronics 15 00072 g001
Figure 2. Geometry and equivalent circuit of the proposed triple-CSRR tag unit: (a) single CSRR element, (b) equivalent lumped-element circuit model, and (c) overall three-cell CSRR tag configuration.
Electronics 15 00072 g002
Figure 3. Geometrical Layout of The Proposed Microstrip Feed Patch Antenna (a) Top view, (b) Back View.
Electronics 15 00072 g003
Figure 4. Evolution of Proposed Patch Antenna (A) Fundamental Elliptical Patch Antenna_1 (B) Elliptical Slotted Patch Antenna_2, (C) Elliptical Slotted Patch Antenna Loaded Crescent Antenna _3.
Electronics 15 00072 g004
Figure 5. Surface current distributions for observed resonant modes: (a) TM20 and (b) TM40.
Electronics 15 00072 g005
Figure 6. Simulated reflection coefficient (S11) for the Three-Antenna Structure Design.
Electronics 15 00072 g006
Figure 7. Three-Dimensional Radiation Pattern for the Three Resonance Frequencies.
Electronics 15 00072 g007
Figure 8. Fabricated microwave resonator sensor and measurement setup for S-parameter characterization.
Electronics 15 00072 g008
Figure 9. Comparison between simulated and measured S11 responses of the proposed.
Electronics 15 00072 g009
Figure 10. (a) Cross-sectional anatomy of the index finger showing skin, fat, muscle, blood vessels, bone, and nail layers. (b) Simulated interaction between the fingertip and the sensor.
Electronics 15 00072 g010
Figure 11. The Dielectric Properties of the Four Tissues: (a) Skin, (b) Fat, (c) Muscle and (d) Bone.
Electronics 15 00072 g011
Figure 12. Reflection Responses of Various Glucose Samples.
Electronics 15 00072 g012
Figure 13. Sensor performance characteristics: frequency shift (Δf) and reflection response (ΔS11) versus glucose concentration (without tag unit).
Electronics 15 00072 g013
Figure 14. Sensor sensitivity analysis: derivatives of frequency shift (dΔf/dg) and reflection change (dΔS11/dg) with respect to glucose concentration.
Electronics 15 00072 g014
Figure 15. Comparison of the simulated reflection coefficient response of the integrated sensor to that of the antenna unit only.
Electronics 15 00072 g015
Figure 16. Reflection Responses of Various Glucose Samples for the Integrated Sensor with CSRR Tag: (a) for the first frequency band of interest and (b) for the second frequency band of interest.
Electronics 15 00072 g016
Figure 17. Sensor performance characteristics: frequency shift (Δf) and reflection response (ΔS11) versus glucose concentration.
Electronics 15 00072 g017
Figure 18. Glucose Trajectory with Moving RMS% (Cross-Validated).
Electronics 15 00072 g018
Figure 19. Performance Metrics Overview: Per-Class, Global, and Reference vs. Predicted.
Electronics 15 00072 g019
Figure 20. SEG Analysis: Train vs. Test with ISO-like Error Bands.
Electronics 15 00072 g020
Figure 21. Confusion Matrices for Balanced Clinical Glucose Classification.
Electronics 15 00072 g021
Figure 22. Glucose variations across clinical bands with categorical classification.
Electronics 15 00072 g022
Table 1. Optimal dimensions of the Tag Unit.
Tag ParameterLtWtD1D2 X htgDt
Dimension (mm)45129770.81140.035
Table 2. The optimized values for the antenna parameters.
ParameterParameter DescriptionValue (mm)
hSubstrate height0.8
WsSubstrate width40
LsSubstrate length40
aSemi-major axis13.5
LfFeed line length15
WfFeed line width1.55
LgGround plane length18
eeccentricity of EMSA0.555
Table 3. Parameters of Cole–Cole model of the four biological tissue layers (skin, fat, muscle, and bone).
Tissue Type ε Δε1τ1 (ps) α1 Δε2τ2 (ns) α2 Δε3τ3
(µs)
α3 Δε4τ4 (ms) α4σ (S·m−1)
Bone2.510.013.20.218079.580.205.0 × 103159.150.20.015.9150.000.0200
Fat2.53.07.960.201515.920.103.3 × 104159.150.051077.9580.010.0100
Muscle4.050.07.230.17000353.60.101.2 × 106318.30.100.02.2740.000.2000
Skin4.039.07.960.128079.580.003.0 × 1041.5920.200.01.5920.200.0004
Table 4. Parameters of Equation (2) for Predicting Dielectric Properties of Human Blood.
ParameterSingle-PoleTwo-PoleThree-Pole
ε 4.723.587.15
ε 1 65.9564.1463.33
τ 1 P   s e c 12.211.5512.12
ε 2 4913.823632.92
τ 2   n   s e c 143.99172.98
ε 3 256744
τ 3   μ   s e c 156.74
σ i S m 1.020.880.28
Table 5. Performance comparison of proposed antenna with the literature.
ReferenceTechnologyFrequency (GHz)SensitivityNote
[35]Active Split-Ring Resonator1.13150.24 kHz/mMol/L ≈ 0.0043 MHz/mg/dLIn vitro measurement only; no experimental validation on tissue-mimicking phantoms
[36]Dielectric Resonator4.70.002 MHz/mg/dLCylindrical resonator design tested only in aqueous glucose solutions; lacks wearable integration
[37]Double-split-ring resonator1.43.287 kHz per mmol/L ≈ 0.0655 MHz/mg/dLMicrofluidic platform with good sensitivity but no in vivo or phantom testing reported.
[38]Linear and Mediator-Free Resonator1.50.0049 dB/mg/dLLinear response demonstrated; however, only in vitro testing performed without noise
[39]Invasive method by extracting fluids5.410.1 MHz/mg/dLNon-invasive concept proposed but not experimentally validated on real biological samples
[40]CSRR2.950.0003 dB/mg/mLTemperature-compensated sensor validated in solution phase only; limited biological relevance.
[41]open-ended microstrip transmission line loaded with CSRR2.50.005 dB/mg/mLReflective sensor tested in aqueous solutions; no deep learning or advanced data analysis included.
[42]Hilbert-Shaped Microwave Sensor6.10.0000156 dB/mg/mLModified Hilbert structure demonstrated but lacks machine learning integration or noise analysis.
[43]Microstrip Line-based1.48(1.8–6.6) × 10−3 dB/mg/dLContinuous monitoring concept introduced but tested in controlled lab conditions without phantoms.
[44]Millimeter Waves using Microstrip Patch Antennas600.65 × 10−3 dB/mg/dLPatch-based system for transmission sensing; evaluated only in vitro with no wearable demonstration.
[45]Corona-Shaped Resonator1.8 and 3.40.0002 MHz/mg/dLHigh sensitivity metamaterial sensor but no data-driven modeling or practical deployment reported.
[46]Battery-free Biosensor Based on Parallel Resonators2.8 GHz500 and 46 kHz/mg/dLWireless, battery-free sensor; tested on solution-level bio signals without deep learning integration.
[47]metamaterial technology, integrated with a microfluidic channel1.46 and 4.950.05 dB/mg/dLThree cells of circular complementary split-ring resonators (CSRRs) engraved on the ground plane, in vitro measurement only
[48]Triple-Pole CSRR coupled to a planar microstrip line3.15 and 5.250.062 dB/mg/dLReal-time monitoring of glucose level
[49]four-cell CSRR hexagonal configuration1.650.625 MHz/mg/dLIn vitro measurement only
This workWearable, Crescent-Loaded Elliptical Patch Antenna and CSRR Tag 9.41.14 MHz/mg/dL 0.01516 dB/mg/dL wearable implementation, and physics-informed deep learning for robust glucose prediction under noisy conditions.
Disclaimer/Publisher’s Note: The statements, opinions and data contained in all publications are solely those of the individual author(s) and contributor(s) and not of MDPI and/or the editor(s). MDPI and/or the editor(s) disclaim responsibility for any injury to people or property resulting from any ideas, methods, instructions or products referred to in the content.