Article

Dynamic Task Planning for Heterogeneous Platforms via Spatio-Temporal and Capability Dual-Driven Framework


1
CETC Key Laboratory of Aerospace Information Applications, Shijiazhuang 050081, China
2
School of Electrical and Information Engineering, Tianjin University, Tianjin 300072, China
*
Author to whom correspondence should be addressed.
Electronics 2026, 15(1), 202; https://doi.org/10.3390/electronics15010202
Submission received: 5 December 2025 / Revised: 28 December 2025 / Accepted: 30 December 2025 / Published: 1 January 2026
(This article belongs to the Section Artificial Intelligence)

Abstract

Dynamic task planning for heterogeneous platforms across land, sea, air, and space is essential for achieving integrated situational awareness, yet current systems suffer from limited spatiotemporal coverage and inefficient resource scheduling. To address these challenges, we propose a novel mission planning method that integrates spatiotemporal segmentation with Deep Reinforcement Learning (DRL). The approach establishes a multidimensional spatiotemporal decomposition model to break down complex observation scenarios into manageable subtasks, while incorporating a unified accessibility–visibility computation framework that accounts for Earth curvature, platform dynamics, and sensor constraints. Using a Spatio-Temporal Adaptive Scheduling Network (STAS-Net) algorithm optimized with a multi-objective reward function covering mission completion rate, temporal coordination, and residual detection capacity, the method enables intelligent coordination of heterogeneous platforms. Experimental results across small-, medium-, and large-scale scenarios demonstrate that the proposed framework consistently achieves high target coverage (up to 98.4% in small-scale and 89.7% in large-scale tasks), with a reduction in coverage loss that is only about half of that exhibited by greedy and genetic algorithms as task scale expands. Moreover, STAS-Net maintains low planning time (as low as 9.5 s in small-scale and only 18.3 s in large-scale scenarios) and high resource utilization (reaching 86.8% under large-scale settings), substantially outperforming both baseline methods in scalability and scheduling efficiency. The framework not only establishes a solid theoretical foundation but also provides a practical and feasible solution for enhancing the overall performance of multi-platform cooperative observation systems.

1. Introduction

Integrated collaborative observation across land, sea, air, and space platforms serves as the cornerstone for establishing comprehensive situational awareness systems, with demonstrated strategic value in national defense, disaster management, and maritime surveillance. Nevertheless, contemporary observation systems worldwide achieve merely less than 70% average coverage for dynamic targets while suffering from mission planning delays extending to minute-level durations, substantially undermining real-time decision-making effectiveness [1]. These limitations fundamentally stem from platform heterogeneity: orbital assets operate under strict Keplerian constraints preventing real-time maneuverability; air platforms face stringent endurance limitations (typical operational range < 100 km); and maritime and terrestrial systems exhibit order-of-magnitude differences in mobility profiles (sea platform < 30 knots versus land platform < 120 km/h) [2]. More critically, the Earth’s curvature introduces non-linear distortions in detection boundaries—empirical evidence confirms that at 1000 m altitude, atmospheric refraction reduces theoretical radar line of sight by 12–15% [3]. This intricate coupling of spatio-temporal factors and capability disparities renders conventional single-domain scheduling approaches fundamentally inadequate, necessitating novel collaborative optimization frameworks. These challenges impose three critical requirements for advanced observation systems [1]:
  • Spatio-Temporal Coverage Integrity: Maximizing continuous coverage duration for both stationary and dynamic targets represents a fundamental objective.
  • Real-Time Performance Constraints: Minimizing computational overhead in large-scale mission scheduling remains imperative.
  • Resource Elasticity and Reconfiguration: Supporting dynamic strategy adaptation and priority reassignment for emergent high-value targets is essential.
Inspired by the paradigm of multi-agent collaborative decision-making in autonomous driving (discuss in Section 2.3), we aim to migrate and adapt its core principles to address the even more complex challenge of cross-domain, heterogeneous platform coordination. To this end, we propose a spatio-temporal and capability dual-driven framework for dynamic task planning in heterogeneous platform environments. The methodology specifically targets the critical gaps in coverage completeness, response latency, and environmental adaptability through three integrated components: a multi-granularity task decomposition mechanism incorporating platform dynamics, a curvature-compensated accessibility–visibility assessment model, and computationally efficient planning optimization algorithms. Collectively, these contributions aim to deliver enhanced mission coverage performance and superior planning responsiveness, establishing both theoretical foundations and practical implementations for next-generation all-domain observation systems. The main contributions can be summarized as follows:
  • A multi-granularity task decomposition algorithm architecture incorporating platform dynamics is designed, enabling adaptive task allocation for heterogeneous platforms.
  • A curvature-compensated accessibility–visibility joint evaluation algorithm is proposed, significantly improving detection accuracy in complex environments.
  • A multi-objective optimized DRL algorithm module is constructed, achieving coordinated optimization of task coverage and planning efficiency.
  • A simulation environment and task dataset for land–sea–air–space heterogeneous platform cooperative observation have been established, designed with three distinct scenarios to validate the algorithm’s effectiveness across small-, medium- and large-scale targets.

2. Related Work

In recent years, the integration of DRL and Multi-Agent Systems (MAS) has provided revolutionary ideas for solving scheduling and planning problems in complex and dynamic environments. This section reviews the related research progress from two dimensions: Multi-Agent DRL Scheduling Methods and Heterogeneous Platform Task Planning. The aim is to clarify the current research landscape and position the contribution and distinction of this work within existing studies.

2.1. Research Progress on Multi-Agent DRL Scheduling Methods

Multi-Agent DRL provides a natural solution for distributed, highly dynamic scheduling problems by simulating the interaction and learning of multiple autonomous agents in a shared environment [4]. Its research progress is mainly reflected in the evolution of methodological architectures, the deepening of technical tools, and the expansion of application domains.
In terms of methodological architecture, the paradigm of Centralized Training with Decentralized Execution (CLDE) has become mainstream. This paradigm leverages global information for coordinated learning and credit assignment during the training phase, while allowing each agent to make fast, independent decisions based on local observations during execution, effectively balancing global coordination with distributed robustness. For instance, Jing et al. designed a CLDE architecture based on Graph Convolutional Network (GCN) for the Flexible Job Shop Scheduling Problem (FJSP), modeling the interaction between jobs and machines as a process of topological graph prediction, significantly improving scheduling performance in complex scenarios [5]. Similarly, Pu et al. constructed a Distributed Multi-Agent Scheduling Architecture (DMASA), encoding workshop states using a Graph Embedding–Heterogeneous Graph Neural Network (GE-HetGNN), and achieved green dynamic scheduling via a Multi-Agent Proximal Policy Optimization (MAPPO) algorithm [6].
Regarding technological innovation, alongside the deep integration of Graph Neural Networks (GNN) with DRL, Multi-Task Learning has emerged as another important direction, aiming to enable a single agent to collaboratively optimize multiple interrelated decision sub-problems. Zhu et al., addressing the real-time scheduling of a dual-resource flexible job shop with robots [7,8,9], proposed a multi-task multi-agent reinforcement learning framework. In this framework, each agent must simultaneously complete three decision-making tasks: job sequencing, machine selection, and process planning. The researchers introduced an attention mechanism into the policy network to facilitate information sharing among multiple tasks and decomposed global and local rewards into sub-rewards corresponding to each task, thereby guiding the agents to accomplish complex multi-objective decisions collaboratively [6,7,10]. This approach complements the technical path of Zhao et al., who employed hierarchical graph neural networks to achieve topology-aware cluster scheduling [11], jointly advancing the capability of multi-agent DRL to handle high-dimensional, strongly correlated complex scheduling problems.
In the application domain, multi-agent DRL has rapidly expanded from traditional manufacturing scheduling to complex systems such as energy management, smart grids, and cloud computing [12,13,14]. In the field of energy scheduling, the research focus lies in coordinating prosumers, aggregators, and distributed energy resources. Jung et al. proposed a cloud-assisted joint charging scheduling and energy management framework for Unmanned Aerial Vehicle (UAV) networks, where energy sharing among charging towers is realized through multi-agent DRL [12]. Zhang et al. and Kaewdornhan et al., targeting energy hub clusters and smart home microgrids respectively, utilized multi-agent DRL to handle the uncertainty of renewable energy and real-time electricity pricing, optimizing economic costs while considering data privacy protection and guiding user consumption behavior [15,16]. These studies demonstrate the potential of multi-agent DRL in managing resource scheduling problems characterized by high uncertainty, multiple stakeholders, and complex constraints.

2.2. Research Progress on Heterogeneous Platform Task Planning

The core challenge of heterogeneous platform task planning lies in coordinating resources that differ fundamentally in capabilities (e.g., mobility, payload, field of view), dynamic constraints, and operational domains to collaboratively accomplish complex spatio-temporal coverage tasks. Current research primarily revolves around satellite constellations, unmanned system clusters, and cross-domain collaboration, showing a trend of development from static optimization towards dynamic real-time response [11,14,17].
For task planning of single platform types, research is relatively mature. UAV cooperative mission planning refers to the development of detailed execution plans including platform allocation, task mapping, execution schedules, and mission routes. Its core is to efficiently complete tasks such as reconnaissance and surveillance under battlefield environment constraints and possess adjustment capabilities to cope with uncertainties [18,19]. Research on satellite mission planning algorithms has a longer history. Early work primarily focused on large-scale Earth observation systems, employing classical optimization techniques such as heuristic methods and branch-and-bound to generate feasible work plans [20,21]. With the emergence of Agile Earth Observing Satellites (AEOS), research shifted towards heuristic methods combined with dynamic constraints [21] and metaheuristic algorithms such as Ant Colony Optimization [22] and Tabu Search [23] to address higher scheduling flexibility and complexity.
In recent years, intelligent methods represented by DRL have provided new avenues for solving large-scale, dynamic satellite mission planning. Wang et al., addressing the periodic earth observation problem for AEOS constellations, proposed a DRL algorithm based on an encoder–decoder architecture and attention mechanism, significantly improving computational efficiency while ensuring scheduling quality [24]. Li et al., targeting dynamic task scheduling for distributed satellite systems, designed a Rolling-Horizon-based Multi-Agent Proximal Policy Optimization (RH-MAPPO) algorithm. By adjusting strategies in real-time within a rolling window, it effectively adapts to changes in task priorities and resource constraints, outperforming traditional algorithms in both scheduling time and task completion rate [25].
However, when the research scope extends to cross-domain heterogeneous platform collaboration encompassing land, sea, air, and space, existing methods face severe challenges, with three technical bottlenecks requiring urgent resolution [26]: First, the limitations of task-resource decoupling, where prevailing decomposition methods (e.g., Voronoi partitioning) often disregard platform kinetic constraints, resulting in infeasible plans for range-constrained aerial platforms. Second, inaccuracies in environmental perception modeling, where existing visibility models inadequately compensate for factors like terrain occlusion and multipath effects, leading to significant discrepancies between theoretical and empirical detection ranges. Finally, deficiencies in optimization real-time performance, where metaheuristic approaches exhibit prohibitive convergence times for large-scale platform coordination and lack dynamic priority adaptation mechanisms. Although DRL shows promise, inherent issues such as multi-agent credit assignment limit the achievable upper bound of collaborative efficiency.
Although scholars have advanced research on heterogeneous platform cooperative planning from multiple dimensions such as multi-objective optimization [1,21], energy efficiency and real-time performance [2,20], and uncertainty handling [18,22], most work remains confined to specific domains (e.g., UAV clusters [1,20,22]), lacking a universal modeling framework capable of uniformly describing and scheduling cross-domain heterogeneous platforms across land, sea, air, and space. Furthermore, there is generally insufficient integration capability for realistic constraints such as Earth’s curvature and complex physical environments [18,22].
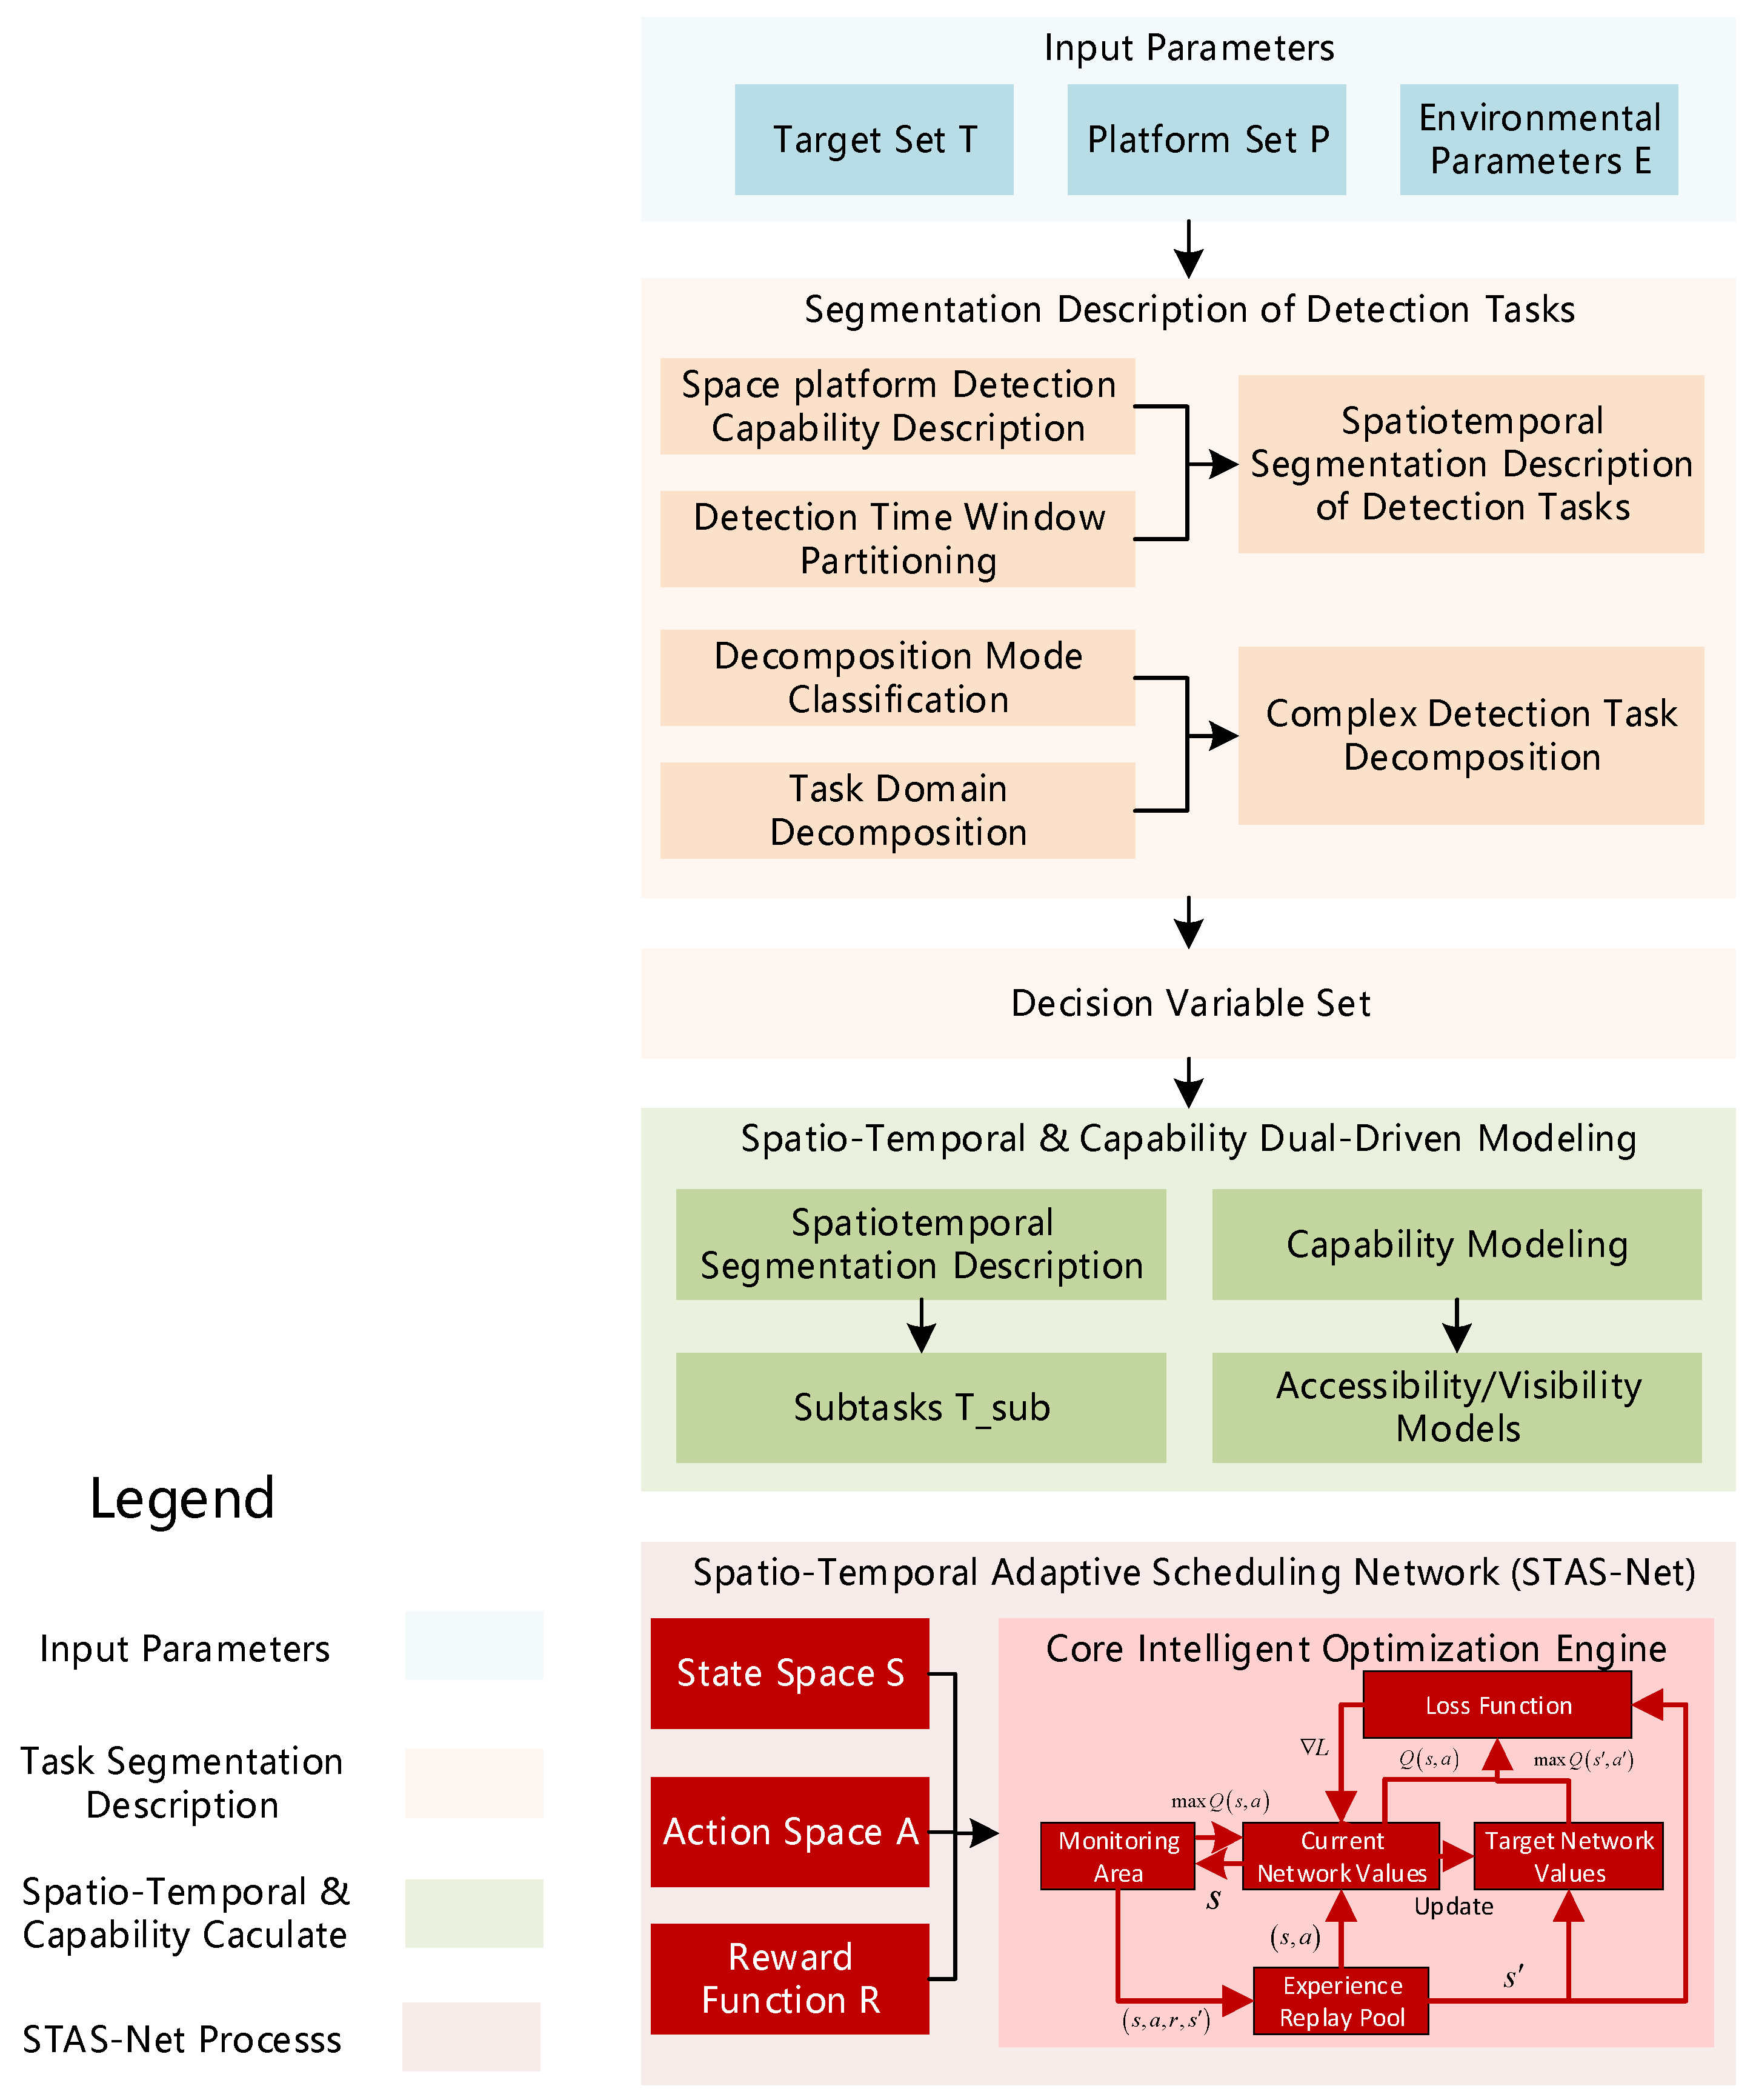
In summary, while current research has yielded fruitful results in multi-agent DRL scheduling frameworks and applications, and demonstrated superiority in task planning for single-domain platforms (particularly satellites), core challenges remain for integrated land-sea-air-space heterogeneous platform collaborative dynamic task planning. These include the absence of a unified modeling framework, inadequate integration of cross-scale physical constraints, and a scarcity of real-time, high-performance optimization algorithms. As shown in Figure 1, the “spatio-temporal and capability dual-driven” framework proposed in this research is designed to address these challenges systematically. By accurately modeling cross-domain heterogeneous constraints through multi-dimensional spatio-temporal decomposition and a unified accessibility–visibility joint computation, and by designing a dedicated Spatio-Temporal Adaptive Scheduling Network (STAS-Net) for efficient optimization, we aim to contribute to this frontier direction.

2.3. Autonomous Collaborative Mission Planning: Real-World Motivation for the Proposed Model

The methodological advances in multi-agent DRL (Section 2.1) and the unresolved challenges in cross-domain platform coordination (Section 2.2) are not merely academic pursuits; they are increasingly mirrored and amplified in critical real-world cyber-physical systems. A prime and compelling exemplar is found in the domain of autonomous vehicles. The core challenges addressed in our research—dynamic, collaborative task planning for heterogeneous platforms—are highly isomorphic to those faced by cutting-edge autonomous vehicle technology. Autonomous vehicles are not a single technology but an integrated system encompassing environmental perception, planning and decision-making, and collaborative control. Their goal is to achieve efficient, safe, and autonomous cooperative operation of multiple agents (vehicles) within a shared space [8]. This objective aligns fundamentally with the vision of integrated joint observation across land, sea, air, and space by heterogeneous platforms. Both ultimately point to the core problem of “collaborative decision-making optimization for multiple agents in highly constrained, dynamic environments.”
A significant frontier in recent autonomous driving research is the realization of vehicle platooning and other advanced cooperative modes. As discussed by Wiseman (2020) in the Encyclopedia of Information Science and Technology, autonomous vehicle platoons leverage real-time vehicle-to-vehicle (V2V) and vehicle-to-everything (V2X) communication to enable close-proximity, highly reliable cooperative driving, thereby greatly enhancing road traffic efficiency and safety [27]. The extreme demands for such cooperativity, real-time performance, and reliability constitute a key real-world motivation for the model design. To achieve platooning or more extensive regional vehicle coordinated scheduling, the system must address the following critical challenges, which highly overlap with those of cross-domain heterogeneous platform scheduling:
  • Unified Description of Heterogeneous Resources: A vehicle fleet may comprise vehicles from different brands, with varying sensor configurations and performance capabilities (acceleration, braking), analogous to the capability diversity of land, sea, air, and space platforms.
  • Modeling of Spatio-Temporally Coupled Constraints: Vehicle movement must strictly adhere to dynamic constraints (speed, acceleration), traffic rules (routes, signals), and spatio-temporal relationships (collision avoidance, platoon formation maintenance). This necessitates a refined spatio-temporal and capability model similar to the one established in Section 3.2.1.
  • Dynamic Real-Time Decision-Making: In the face of dynamic events such as sudden road conditions, pedestrian interference, or vehicle failures, the cooperative system must possess millisecond-level real-time re-planning and re-scheduling capabilities. This is precisely the shortcoming of traditional meta-heuristic algorithms (e.g., Genetic Algorithm, Ant Colony Optimization) and forms the fundamental reason for introducing the DRL.
In summary, autonomous vehicles, particularly the development of their collaborative platooning capabilities, provide a highly contemporary and urgent application context and problem archetype. The “spatio-temporal and capability dual-driven” framework and the STAS-Net algorithm proposed in this research represent a theoretical transfer and methodological innovation. They combine the stringent requirements for high-dynamic collaborative decision-making from the autonomous driving domain with the significant potential demonstrated by multi-agent DRL in solving complex optimization problems. Our model not only aims to address the academic challenge of cross-domain observation but also offers methodological insights that could theoretically inform future large-scale, high-density intelligent transportation coordinated scheduling.

3. Materials and Methods

3.1. Dynamic Task Preprocessing Design for Heterogeneous Platforms in Complex Application Scenarios

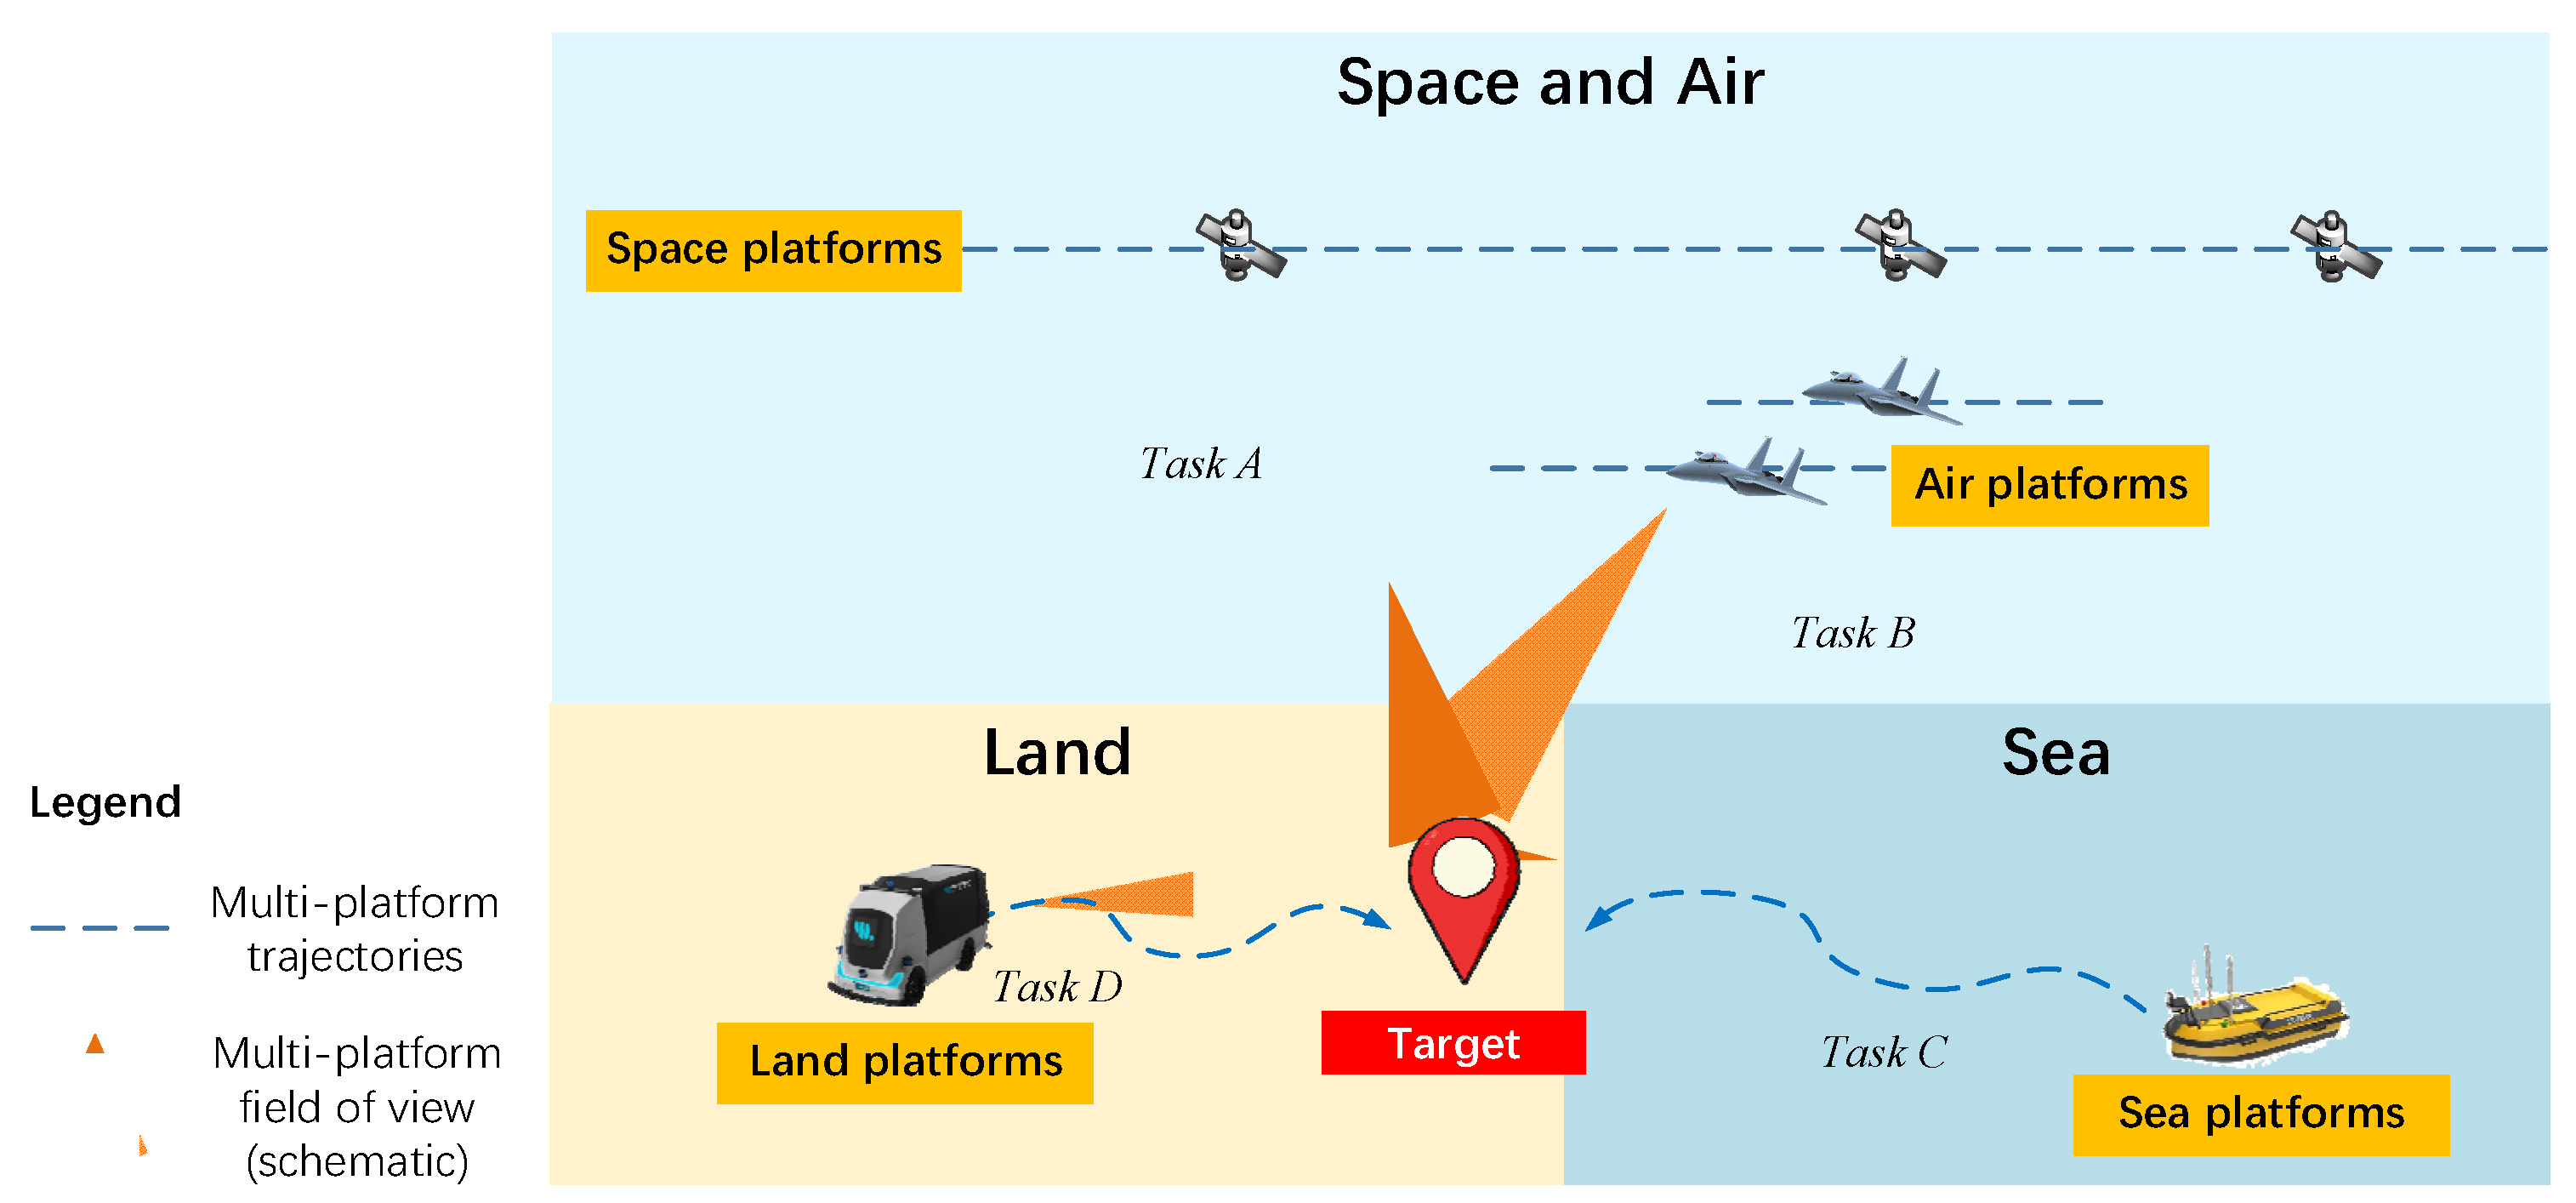
We address the challenge of effectively utilizing diverse detection equipment mounted on land, sea, air, and space platforms to achieve collaborative detection of targets within a surveillance area as shown in Figure 2. The key issue lies in leveraging the mobility capabilities of different detection platforms to accomplish effective detection of both moving and stationary targets within specified timeframes and through varied detection methods across the operational area.
Since space-based (satellite) detection is constrained by orbital mechanics and typically does not involve orbital or attitude adjustments, the scheduling algorithm design adopts the following principles for optimal resource coordination:
  • First, identify detection tasks executable by satellites;
  • Second, rationally allocate tasks that cannot be completed by satellites.
To effectively utilize detection resources across different platforms and achieve coordinated detection of various tasks within the operational area, multiple factors must be considered. These include: the payloads carried by each platform, platform mobility capabilities, operational range limitations, payload detection capacities, time windows for effective detection, and the impact of Earth’s curvature [28]. This constitutes a typical nonlinear optimization problem. Simple application of optimization algorithms would lead to combinatorial explosion, compromising both planning speed and optimality.
To address these challenges, an effective approach involves high-level partitioning of detection tasks and resources according to platform capabilities and task requirements. Subsequent optimization of allocated tasks and resources can significantly reduce planning complexity while improving efficiency and solution optimality.

3.1.1. Spatiotemporal Segmentation Description of Detection Tasks

Detection task description involves expressing required target detection tasks through definitive mathematical models, providing optimizable formulations for subsequent collaborative detection scheduling.
As previously mentioned, since different detection platforms must collaboratively detect various target types, tasks require segmentation in both temporal and spatial dimensions. Tasks are then allocated according to platform mobility and payload characteristics.
Task segmentation refers to the division of detection tasks in space and time, fully considering effective coordination among different detection platforms.
Specific segmentation methods:
  • Space platform Detection Capability Description
Based on given space platform orbital information, determine all time windows during which each space platform can effectively detect specified targets.
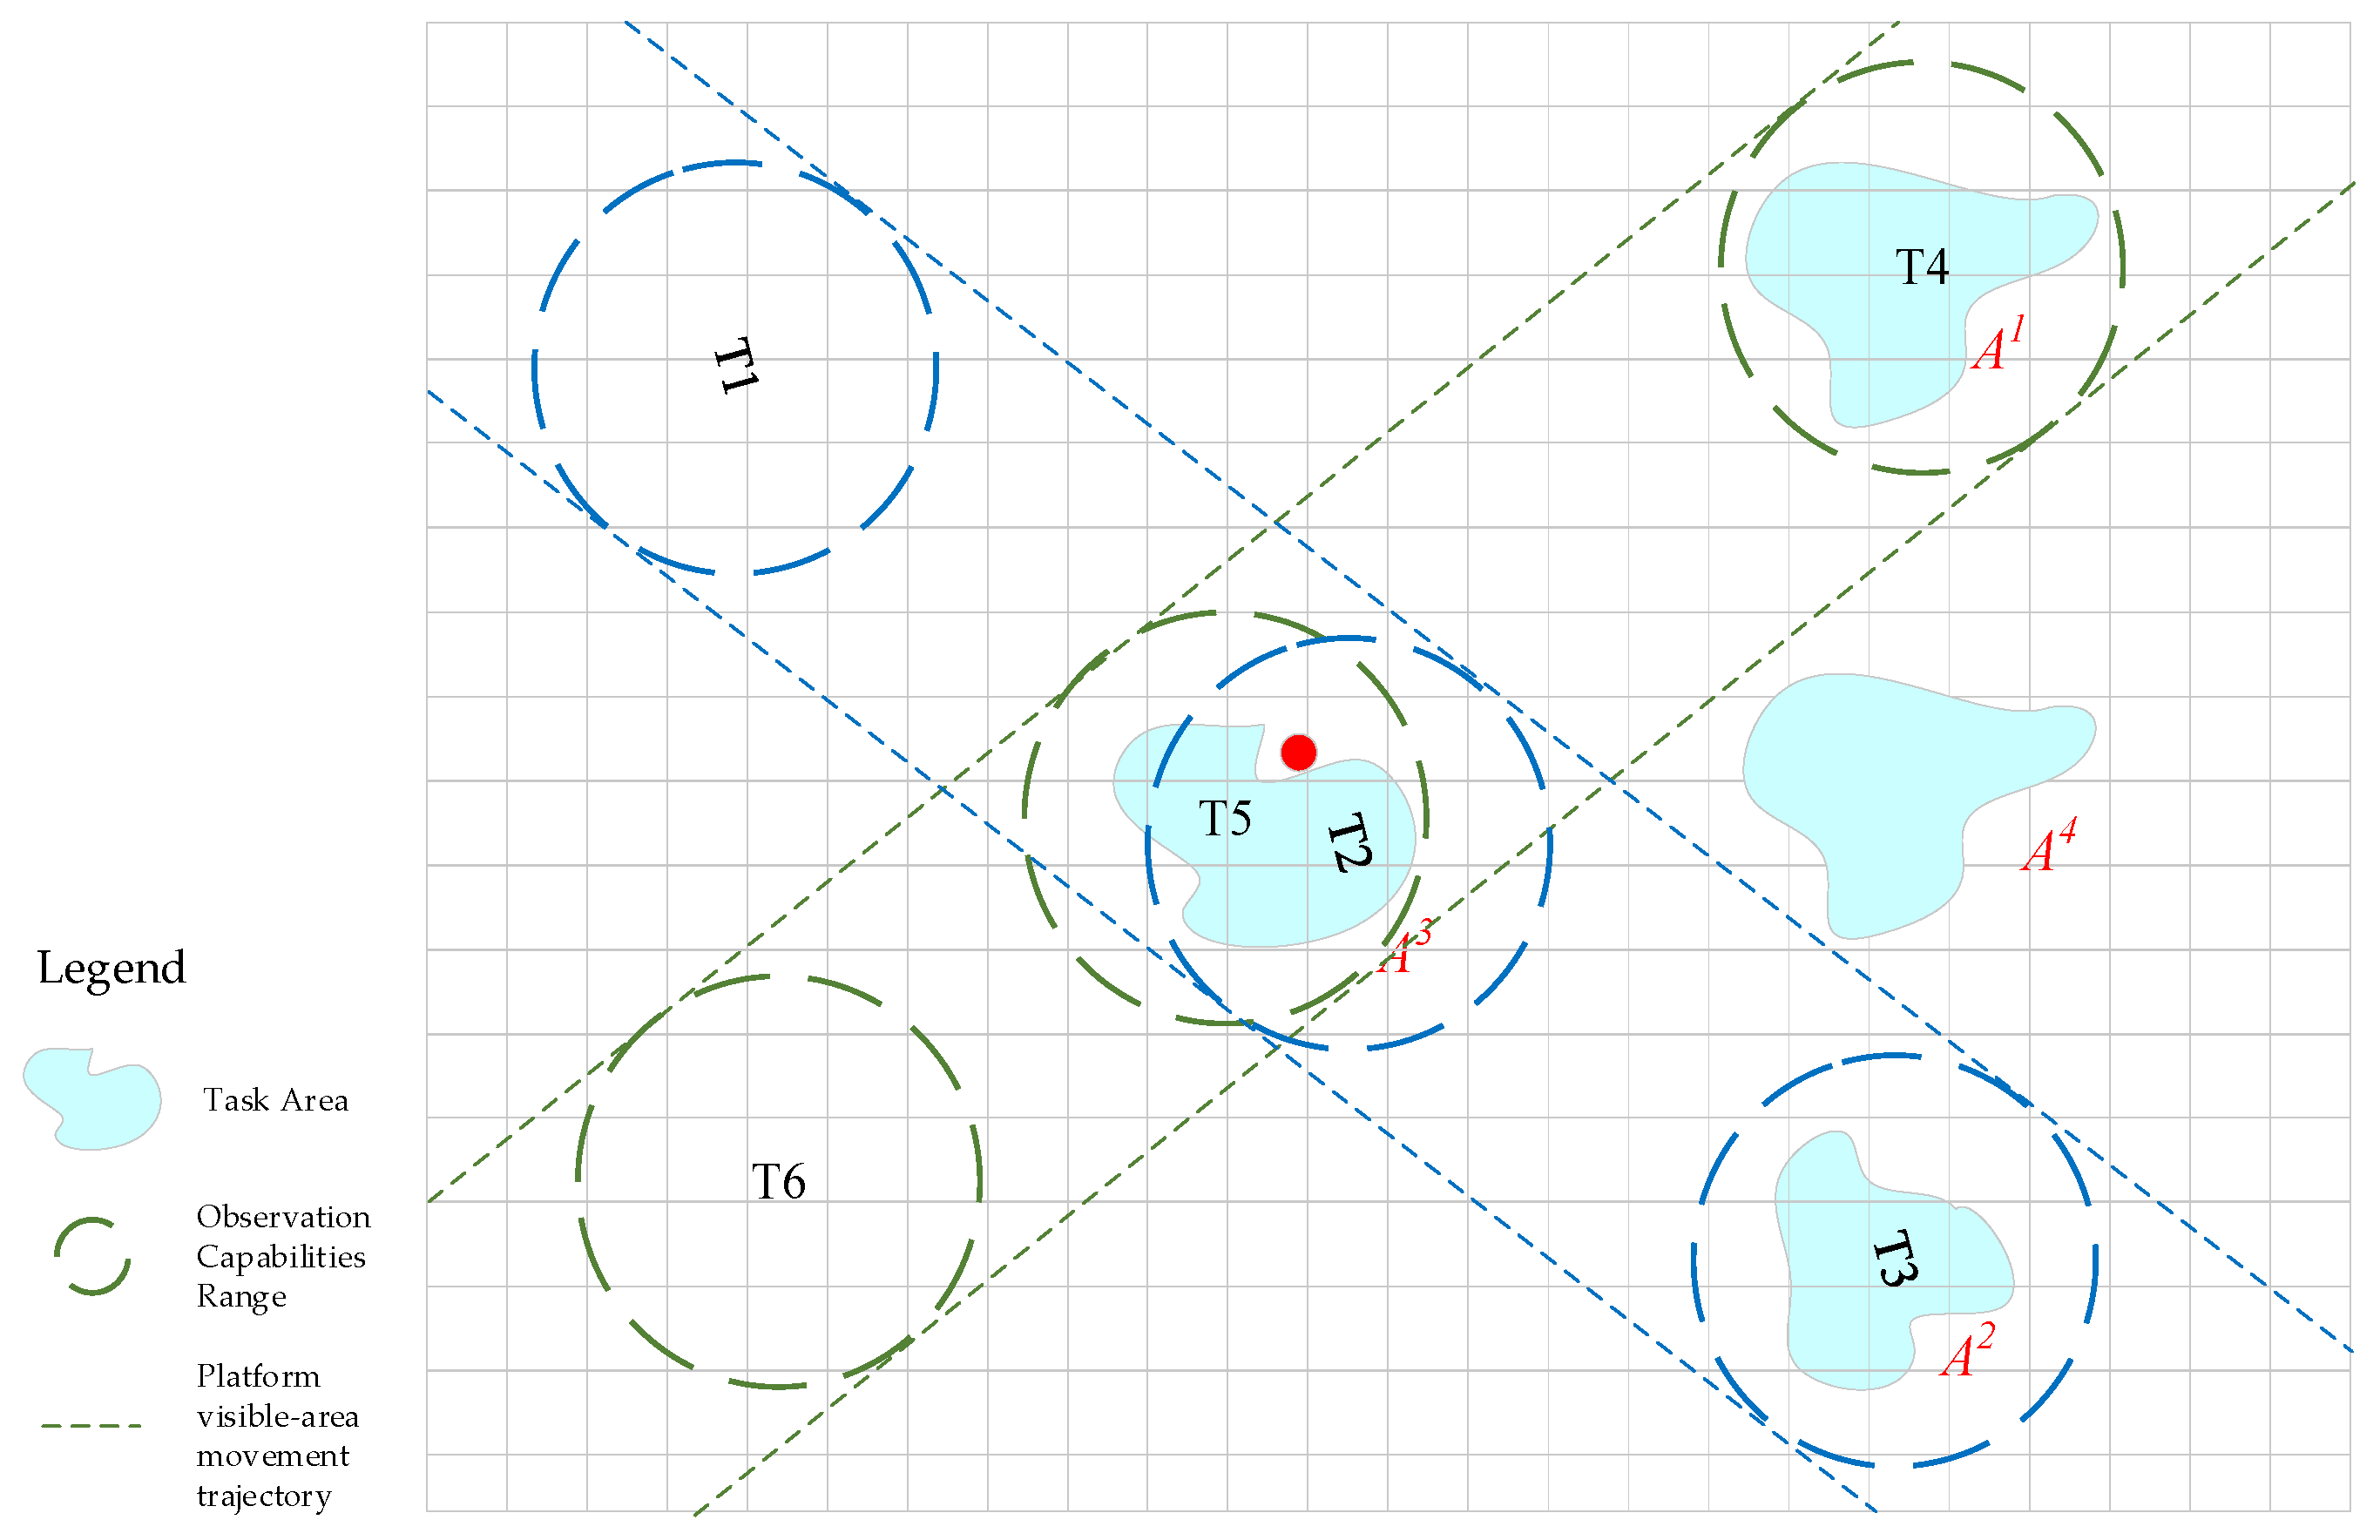
As shown in Figure 3, the surveillance area is A 1 ~ A 4 . Two space platforms (green and blue line) pass through the task A 1 ~ A 3 area, providing observation capabilities at times T2, T3, T4, and T5. However, these space platforms cannot observe target A 4 .
2.
Detection Time Window Partitioning
Given specific time requirements for target detection, the feasibility of space platform detection times must be verified. When space platform observation times fall outside required windows, the space platform is considered incapable of detecting that target. Time window partitioning method:
  • Treat time windows detectable by space platforms as independent detection periods;
  • Consider discontinuous periods within required detection time ranges, segmented by space platform-available windows, as separate independent periods;
  • Regard periodic or intermittent measurement periods as independent segments.

3.1.2. Complex Detection Task Decomposition

Building upon the spatiotemporal segmentation description of detection tasks, decomposing complex tasks into manageable subtasks is crucial for reducing complexity in multi-target, multi-platform collaborative detection [29]. The following decomposition scheme is proposed:
  • Decomposition Mode Classification
Task decomposition involves rational allocation of detection resources according to task requirements, enabling different detection units to operate within relatively fixed subareas. Distributed collaborative detection across large areas through optimal unit distribution significantly reduces optimization complexity and enhances system adaptability to unforeseen detection needs. The core concepts of task decomposition include:
  • Pre-decomposition Oriented to Task Feasibility
This involves grouping detection resources based on historical task requirements, considering accessibility, visibility, and operational modes of detection equipment. This establishes predefined responsibility zones for each group as detection scheduling contingency plan.
  • Task Decomposition Adapted to Actual Situations
In practical scenarios, detection unit positions are influenced by previous tasks, altering their accessibility to desired locations. Therefore, predefined decomposition schemes cannot be mechanically applied. However, decomposition should still consider the ability to restore configurations after unit deployment, ensuring better statistical response to target activity randomness.
2.
Task Domain Decomposition Algorithm Design
The objective of task domain decomposition is to meet given target detection requirements while maintaining capability for unknown tasks and minimizing comprehensive resource utilization costs.
Specific principles for pre-decomposition consider detection unit arrival time, detection range, and operational modes. The detailed processing method follows:
  • Grid Partitioning of Surveillance Area
Divide the surveillance area into grid cubes. The grid size references the minimum detection distance of different detection units. The grid side length l c u b e is calculated as:
l c u b e = α · min D 1 , D i , , D N t y p e
where N t y p e represents the category of detection unit, D i is the maximum detection distance of the i-th category, and α is a proportionality coefficient (typically 1/3). Vertically, considering Earth’s curvature, intervals from 200 m to 2 km are used based on practical conditions. Thus, the surveillance area partition is determined.
  • Calculation of Effective Detection Positions
Since detection units are mounted on different platforms with varying speeds, pre-allocation requires separate processing for each platform type. For each detection unit, calculate the distance from the base to the detection boundary considering Earth’s curvature, establishing the platform’s arrival distance.

3.2. Spatiotemporal-Capability Dual-Driven Accessibility–Visibility Characterization for Heterogeneous Platforms

To enable optimized task planning computations, it is essential to develop effective modeling of key factors including tasks, detection unit capabilities, and detection platform performance. This provides parameterized models with quantifiable processing for optimization problem-solving [30].

3.2.1. Detection Performance Characterization Model Design

A detection unit represents an integrated system of detection equipment and mobile platforms. The combination of different detection devices with various motion platforms determines the unit’s overall capabilities.
Detection equipment varies in type, model, and performance specifications. As shown in Table 1, different platforms carry distinct detection units, making accurate characterization of detection devices fundamental to describing platform detection capabilities. Effectively extracting universal performance indicators for detection equipment forms the basis for establishing platform detection capacity models.
Given the diversity in detection principles across different unit types, universal performance characterization requires strong compatibility. The table below presents a performance description approach oriented toward scheduling task optimization.
Detection equipment is mounted on different mobile platforms; therefore, the performance of detection units is closely related to the performance of the motion platforms. Key performance descriptions of the motion platforms are provided in Table 2.
In task scheduling optimization, the platform serves as the top-level optimization object. Based on the specific detection equipment carried by the platform and target conditions, relevant calculations are performed to complete the design of a quantified optimal scheduling scheme.
Accurate description of task requirements is a critical factor in achieving optimal scheduling of detection resources. For target detection needs that may arise in practical applications, descriptions are provided through parameters such as target type, task location, detection mode, task start time, and task end time in Table 3.

3.2.2. Accessibility Calculation for Heterogeneous Platforms

Visibility refers to the detectability of a target by detection equipment, defined by detection capability under various factors including transmission power, receiver sensitivity, and Earth’s curvature effects [31]. Accessibility denotes the ability of land, sea, air, and space platforms carrying detection equipment to reach positions where effective detection of designated targets can be achieved, based on the equipment’s visibility.
Visibility and accessibility analyses form the foundation for multi-platform collaborative detection task planning across domains. In practical applications, detection platforms serve as the objects of task scheduling. Furthermore, whether detecting moving target trajectories or area targets, visibility and accessibility are not computed for single spatial points. Therefore, beyond the fundamental definitions, practical mission planning problems are established based on feasible detection boundaries and optimal path calculations.
  • Feasible Detection Boundary Calculation
The feasible detection boundary refers to the furthest boundary from a target’s position or trajectory that can be determined according to the detection unit’s capabilities. When the detection unit moves along this boundary, it achieves complete coverage detection of the target trajectory.
For land and surface detection units, the feasible detection boundary is a curve along the ground or water surface, where the area between this curve and the ground/water surface projection of the target trajectory constitutes the detectable zone. For aerial detection platforms, the detectable boundary manifests as a three-dimensional spatial surface.
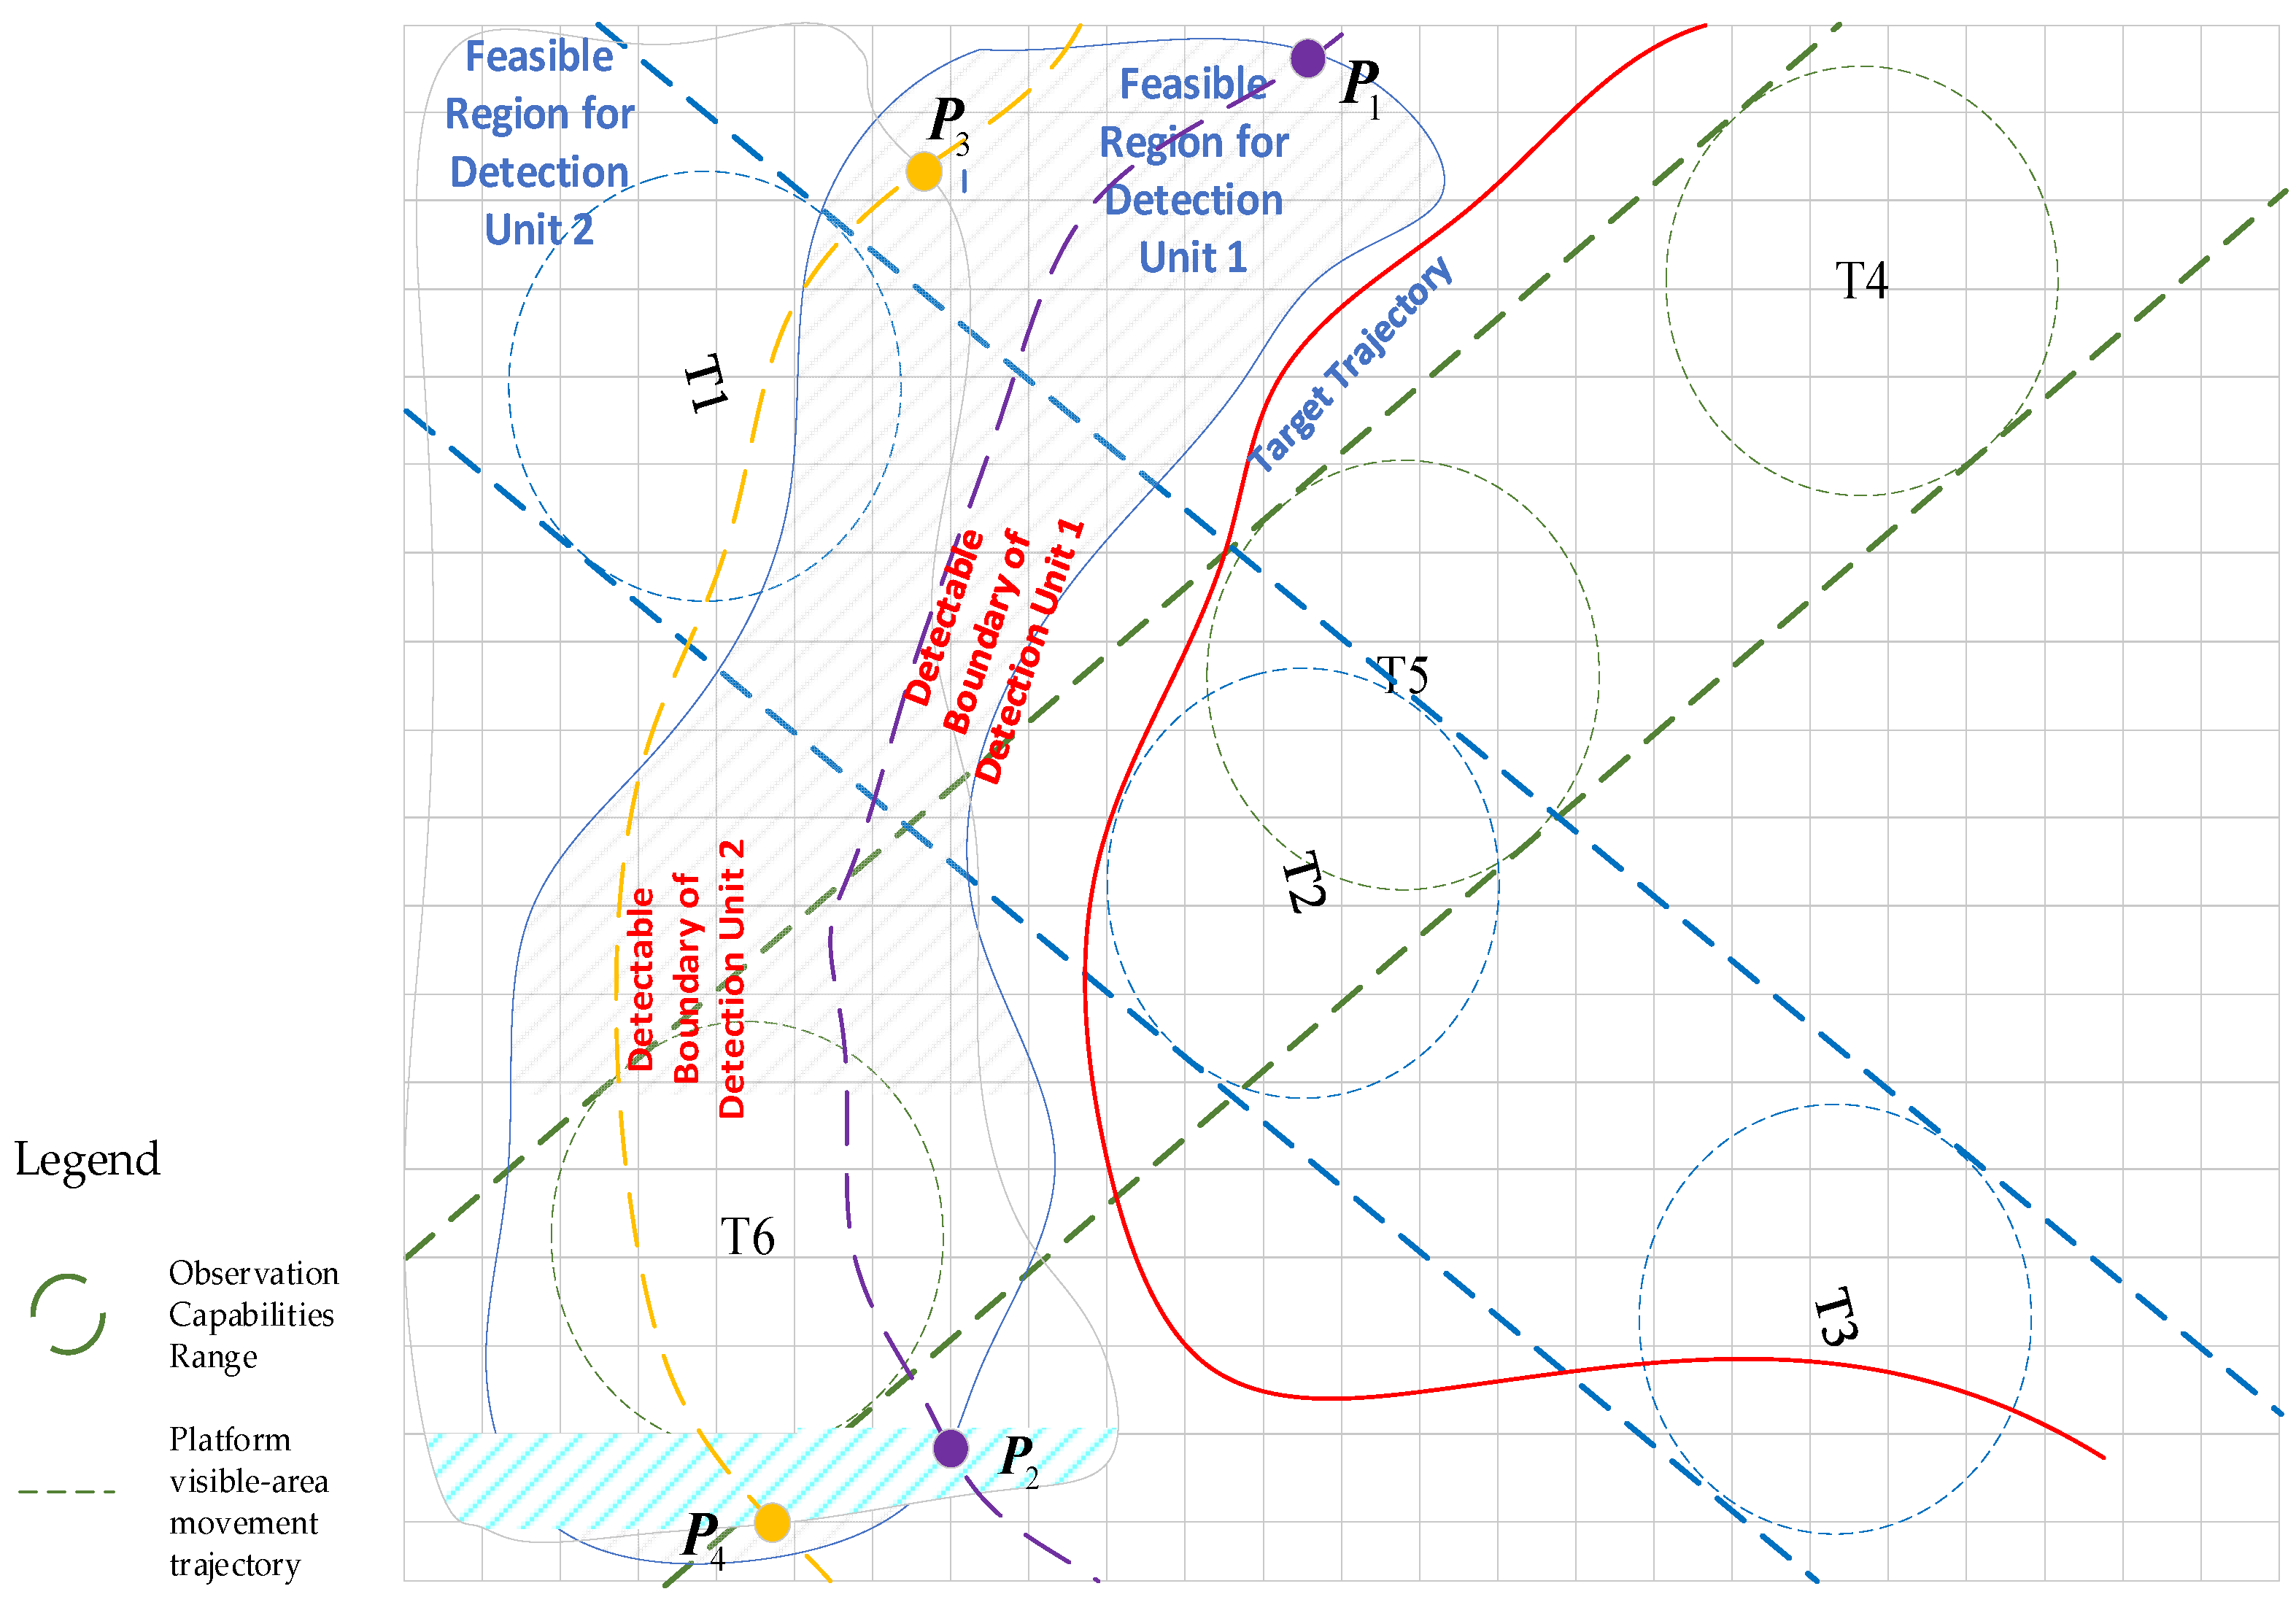
Figure 4 shows the horizontal projection of the feasible detection boundary. The target trajectory is indicated by the red line, while Feasible Region 1 and Feasible Region 2 represent the deployable areas for Detection Unit 1 and Detection Unit 2, respectively. Curve P 1 P 2 denotes the detectable boundary of Detection Unit 1 with respect to the target trajectory within its feasible region, and Curve P 3 P 4 represents the detectable boundary of Detection Unit 2 for the target trajectory. T 1 ~ T 6 indicate the observable regions of two space platforms at different time instances.
  • Detection Boundary Calculation for Land and sea platforms
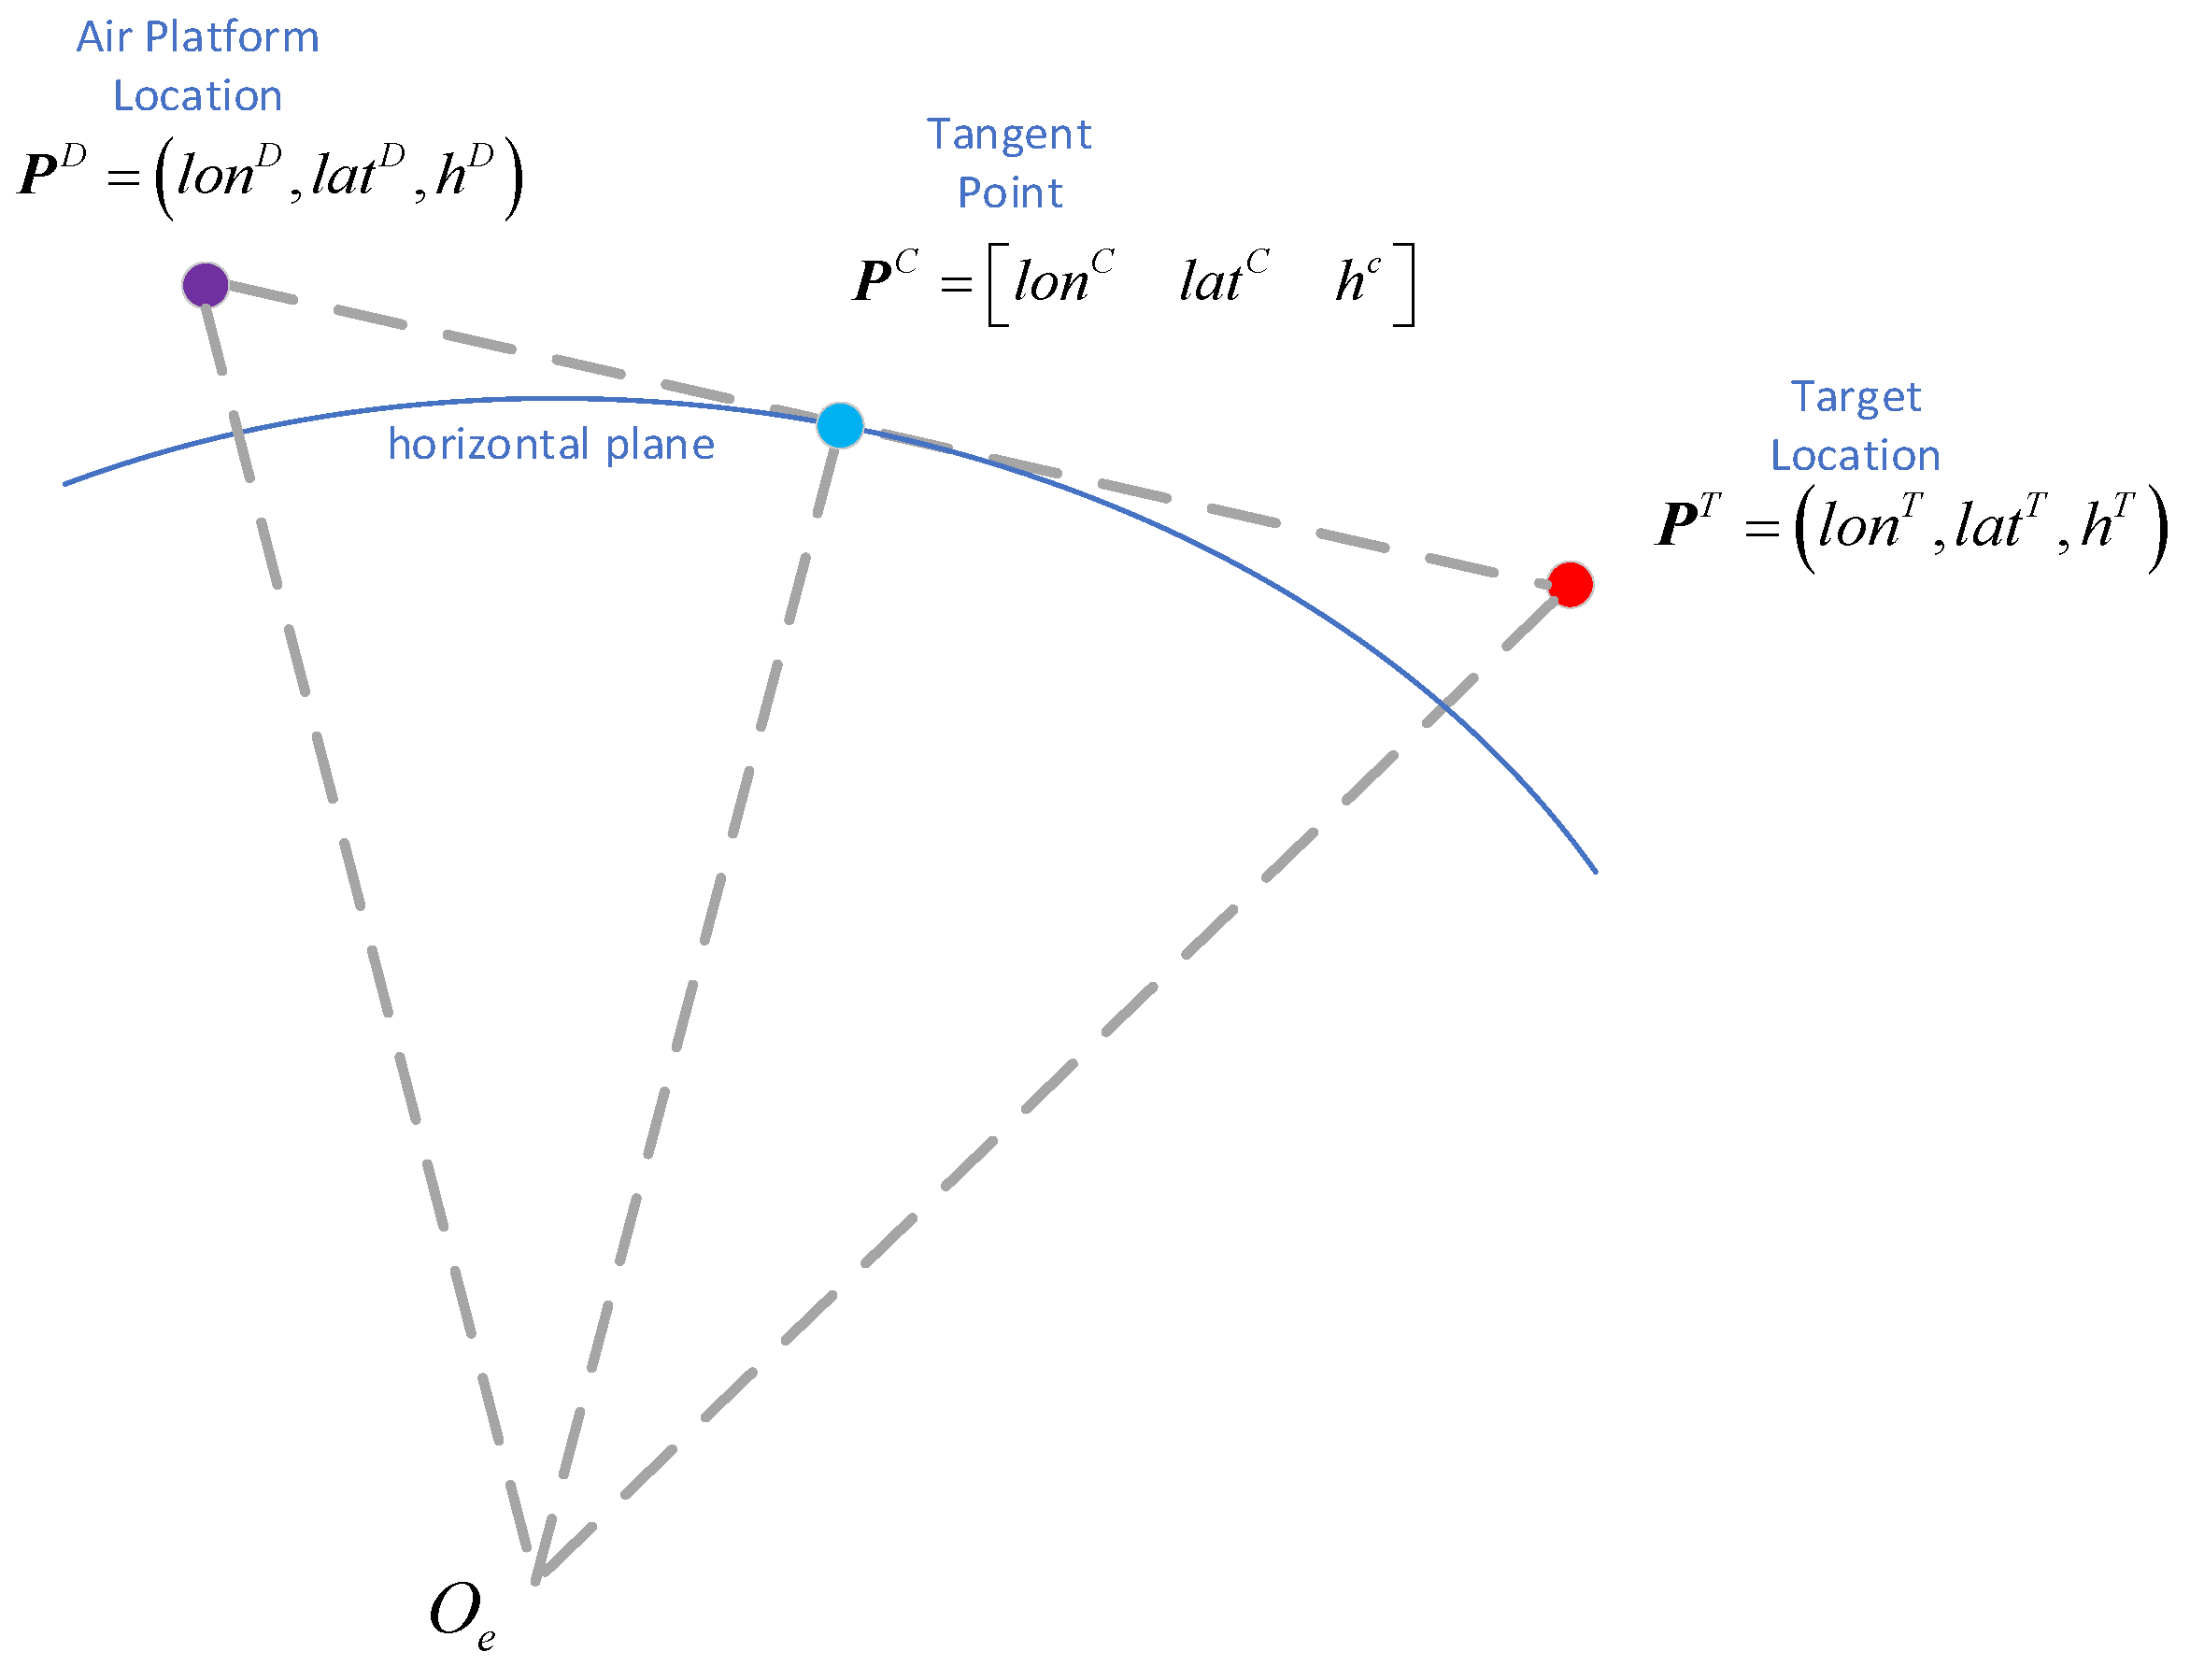
For detection units at a given altitude, considering terrain influences, as illustrated in Figure 5, the determination of Land and sea platforms line-of-sight visibility accounts for the varying altitudes of the detection unit and the target. The specific calculation method is as follows.
Establish the plane defined by detection unit P D , target P T , and Earth’s center O e , with the straight-line direction being P T P D . The following conditions are derived:
O e P D P T = a r c cos O e P D · P T P D O e P D 2 P T P D 2
The distance d from the Earth’s center O e to the line P D P T is
d = O e P D 2 2 O e P D 2 O e P D · P T P D O e P D 2 P T P D 2 2
When the effects of ground clutter and terrain are not considered, the comparison between the distance d and the Earth’s radius can serve as the criterion for determining target detectability by radar. However, this method fails to effectively account for the influence of terrain.
P C is the tangent point on the Earth’s horizontal plane P D P T O e within the plane passing through detection unit P D , satisfying:
O e P D P C 0 = arcsin R e R e + h D
The angle O e P D P C 0 represents the value considering only the Earth’s sea level. In practical applications, the maximum terrain elevation along P D P C affecting the detectable line-of-sight will be determined and used as O e P D P C .
When accounting for ground clutter effects, the detectability criterion for a given detection unit P D and target P T is defined as follows:
1 , O e P D P T > O e P D P C + Δ θ g r o u n d 0 , O e P D P T O e P D P C + Δ θ g r o u n d
where Δ θ g r o u n d is a given threshold angle for ground clutter interference.
When the detection unit and the detected target are land platform or sea platform, only the altitude of their respective positions needs to be considered.
  • Detection Boundary Calculation for Air Platforms
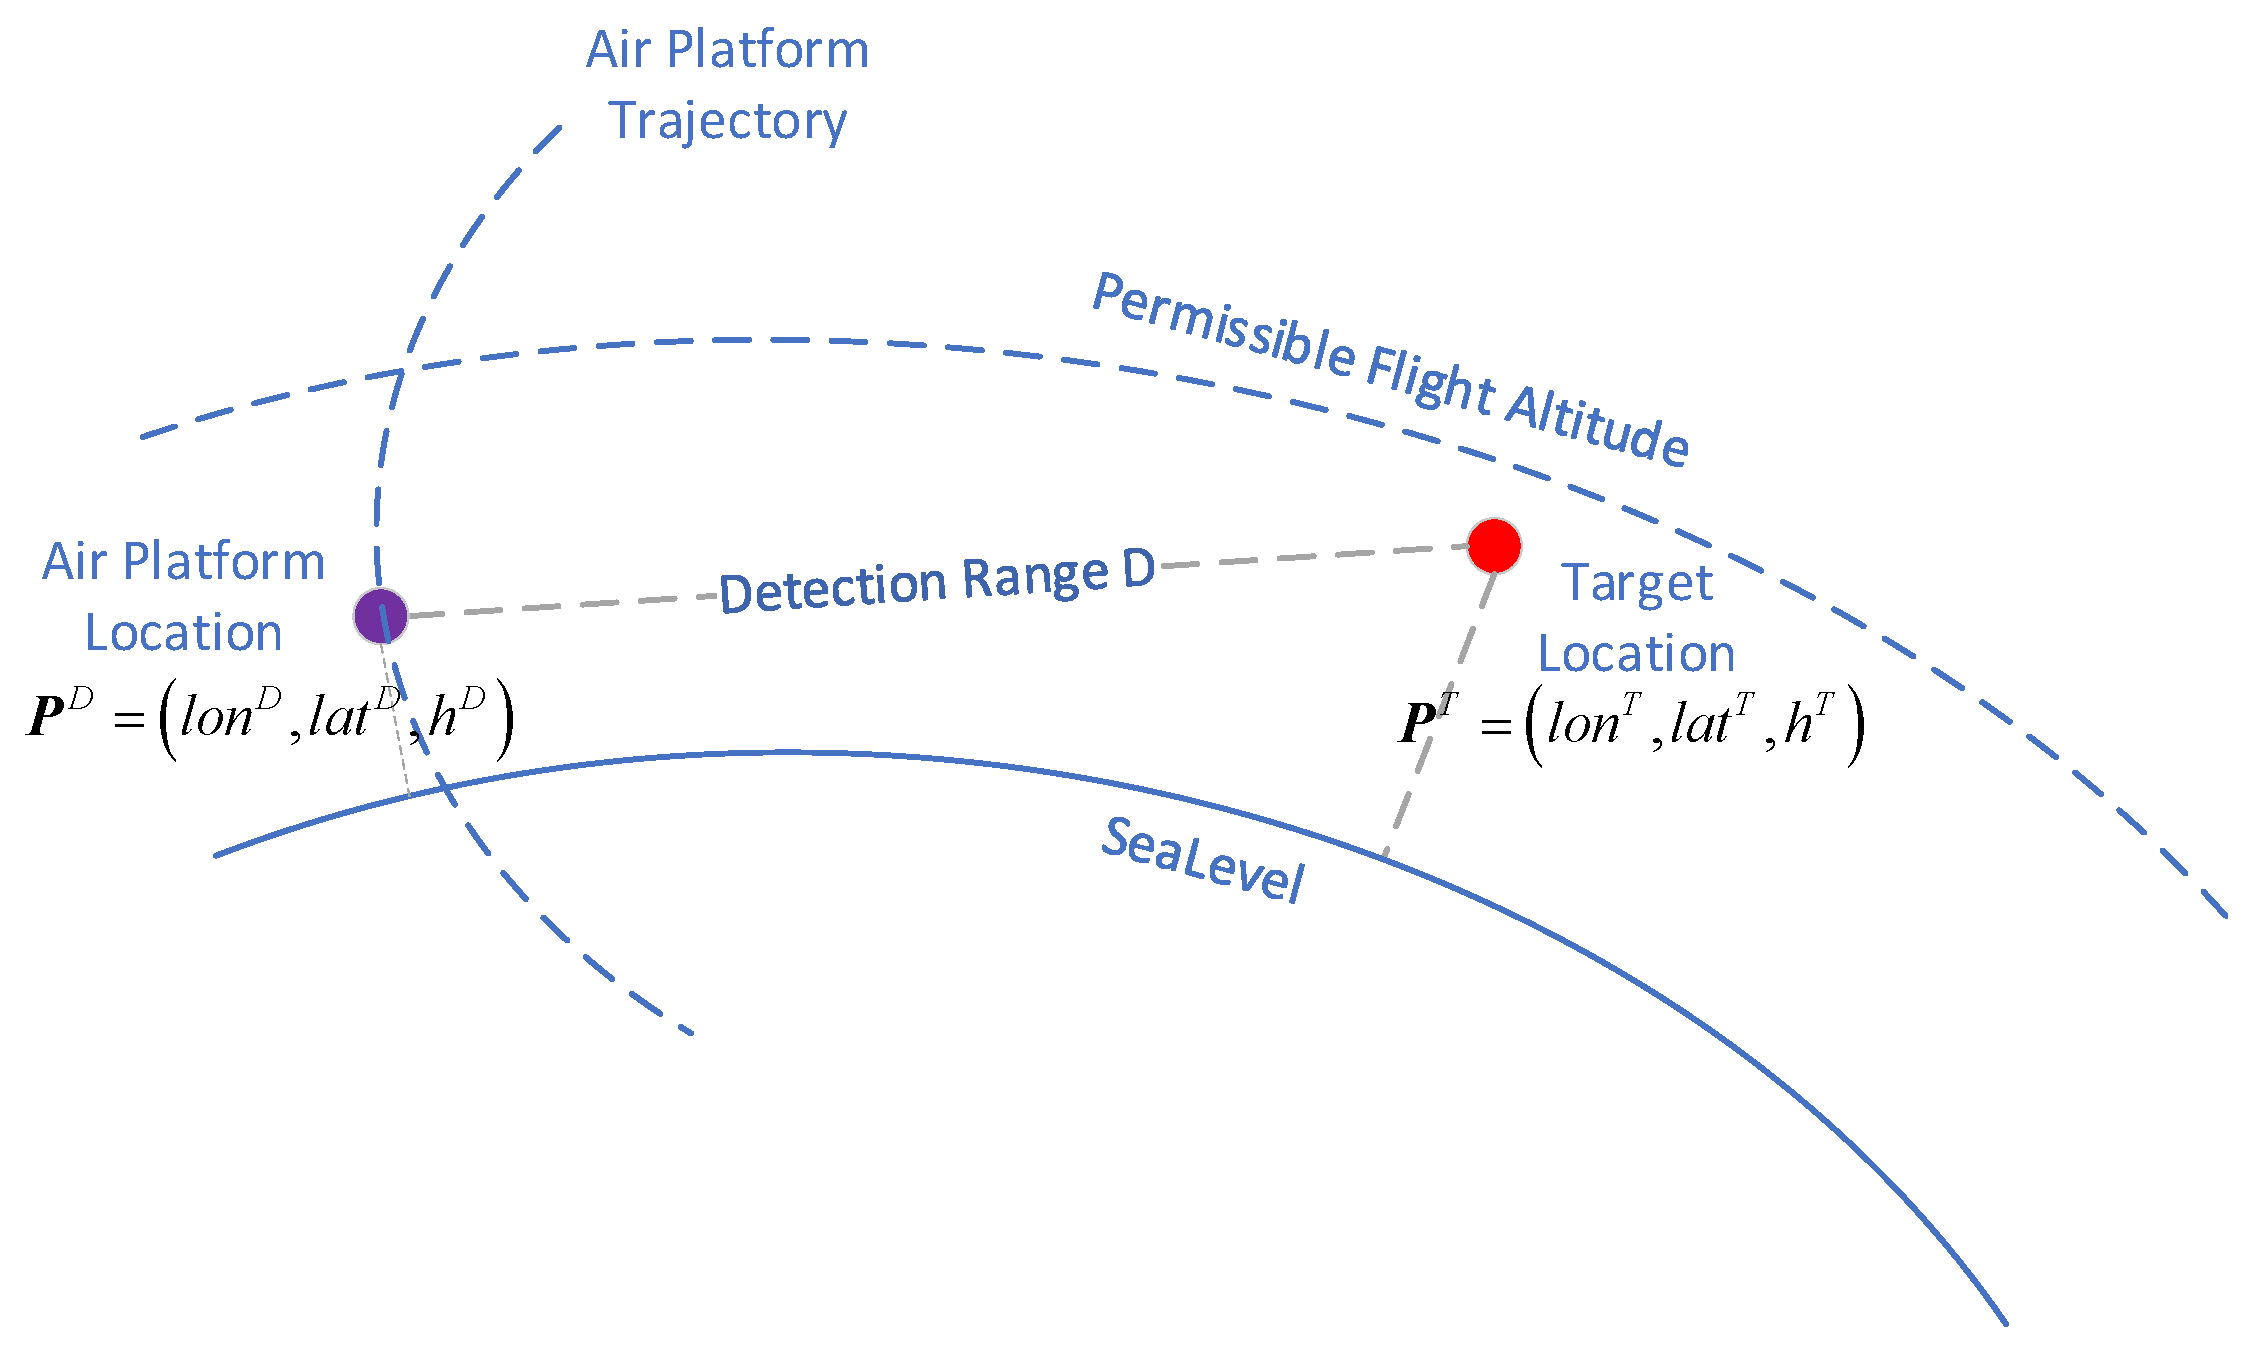
When the target line-of-sight is above the horizon, the detectable range D is approximated as a constant value based on the target detection capability. As shown in Figure 6, the airspace within the detectable range D that meets the flight altitude requirements constitutes the feasible operational zone for the air platform. The specific calculation method is consistent with that used for ground and surface radar detection boundaries and will not be reiterated here.
  • Calculation of Detection Range
When the detection of a target by the detection unit is unaffected by Earth’s curvature, the detectable range of the detection unit is determined based on the echo power for detection radar.
p r = p t G t G r σ λ 2 4 π 3 R 4
where p r is the echo power, p t is the transmission power, G t is the antenna gain in the given direction, G r is the receiving antenna gain, σ is the target scattering cross-sectional area, λ is the radar wavelength, and R is the distance between the radar and the target.
The maximum detection range is determined based on the receiver sensitivity, and its calculation formula is as follows:
R max 4 = p t G t G r σ λ 2 4 π 3 k t 0 B F L S N R o _ min
where k is Boltzmann’s constant, t 0 is room temperature, B is the receiver bandwidth, F is the receiver noise figure, and S N R 0 is the output signal-to-noise ratio of the receiver.
Equation (7) provides the calculation formula for the maximum radar detection range under ideal conditions. To account for factors such as parameter stability and uncertain interference in practical applications, the actual measured maximum detection range can be used for conversion. For example, if the radar antenna gain and receiver noise figure remain unchanged, the maximum detection range is calculated as follows:
R max 4 = B r σ B r λ 2 B σ r λ r 2 R r _ max 4
where R r _ max is the reference measured maximum detection range, σ r is the scattering cross-sectional area of the reference target, λ r is the reference detection wavelength, and B r is the reference detection bandwidth.
The above method is applied to ultra-short wave and microwave radar detection, while for electronic reconnaissance, the given maximum detection distance is directly used.
  • Optimal Path Calculation
The primary objective of target detection task scheduling is to rationally select and command detection units to reach optimal detection positions based on their current distribution and mission requirements, while fully leveraging their mobility to achieve maximum possible coverage of target activity areas and movement trajectories.
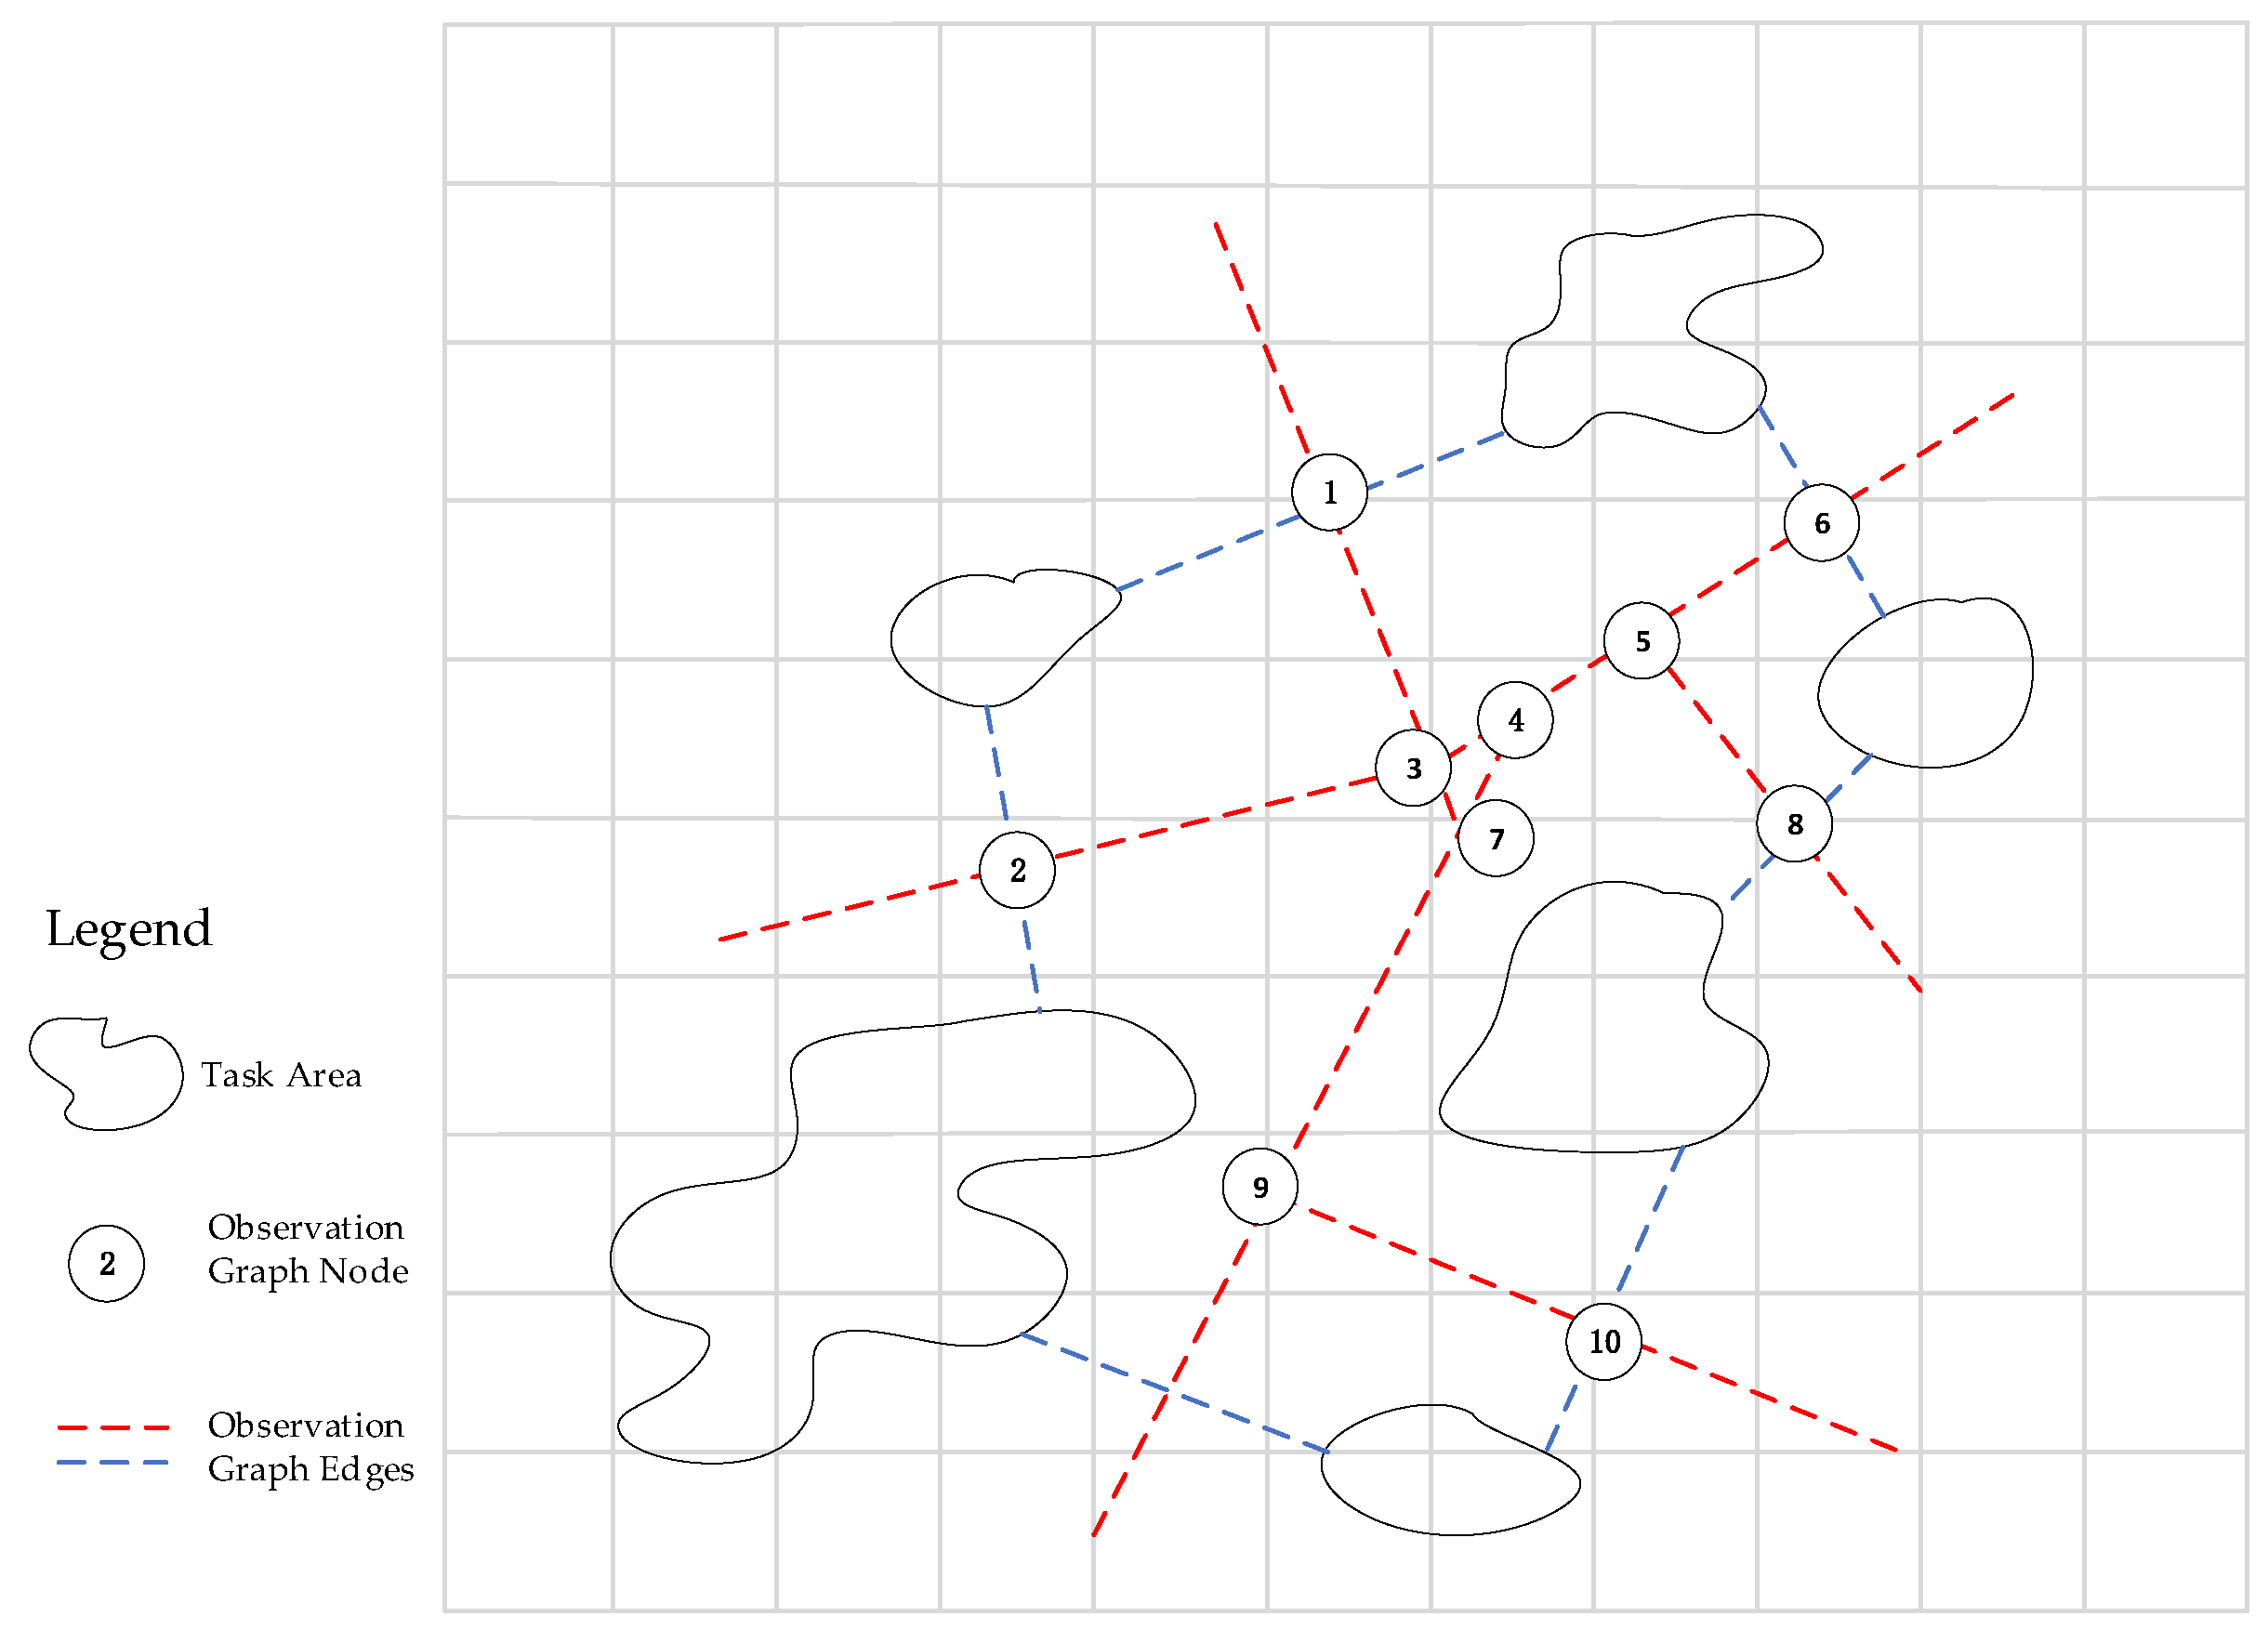
Evidently, whether detection units can reach ideal positions within specified timeframes is a critical optimization factor. Thus, determining the optimal path for different detection units to reach task locations is a key component of algorithm design. Optimal path planning involves obtaining the minimum-time route between given start and end points, considering constraints such as feasible movement areas and obstacles. For land and sea platforms, path optimization must account for obstacles and road/waterway networks, while for air platform, only airspace availability needs to be considered. Figure 7 illustrates the generation of complex paths for sea platform.
To accelerate mission planning speed, a pre-optimized path planning approach for known regions is adopted. Specifically, in the absence of targets, optimal paths from the current positions of land and sea platforms to potential target locations are precomputed. Typical paths are stored and retrieved when targets appear, or slightly modified based on actual requirements to achieve rapid optimization.
The Dijkstra algorithm [32] is employed for optimal path selection. This algorithm calculates the shortest paths from one vertex to all other vertices in a graph. Unlike intelligent algorithms such as Ant Colony Optimization (ACO), Dijkstra is a deterministic algorithm. Heuristic searches like ACO can quickly generate satisfactory results but do not guarantee global optimality. While ACO excels in solving complex problems like the Traveling Salesman Problem (TSP), it offers no distinct advantage for simple point-to-point shortest path problems. In contrast, Dijkstra consistently produces optimal solutions for any given graph in such scenarios, albeit with slower computational speed. The use of Dijkstra serves two purposes: to verify whether ACO falls into local optima and to determine which algorithm performs better under varying problem scales. Efforts are made to combine both algorithms to leverage their respective strengths.
The core of Dijkstra’s algorithm is a greedy strategy, always selecting the current best choice from a local optimum. Its principle states that if the shortest path from node a* to node b* passes through node c* (i.e., the path is {a*, a2, a3, …c*, …b*}), then the segment {a*, a2, a3, …c*} is also the shortest path from a* to c*. The algorithm iteratively finds the closest node to the starting point and expands outward until all nodes are visited, ultimately obtaining the shortest paths from the start to all other nodes. To record the nodes traversed in the shortest paths, the basic algorithm steps are as follows:
All vertices are numbered, and an adjacency matrix mindis is constructed based on road segment data (storing direct distances between points, with infinity representing unconnected points). Three vectors are defined: book, Pset, and mindis. The flag vector book, with a size equal to the number of nodes, indicates whether the shortest path for a node has been determined.
b o o k i = 1 , I f   t h e   s h o r t e s t   p a t h   t o   n o d e   i   h a s   b e e n   d e t e r m i n e d 0 , e l s e
P s e t stores the starting point number and represents the set of vertices for which the shortest path has been determined. Let Z s e t be the set of unvisited points (i.e., points corresponding to zero elements in the book vector, used here only for algorithmic explanation). mindis stores the distances from the starting point to all other points: directly reachable points are assigned their respective distances, while unreachable points are marked as infinity.
mindis j = dis s , j
R s e t stores the sequence of nodes traversed from the starting point to each node recorded in the book vector, initially empty. Let s be the starting point, and k be the count of nodes for which the shortest path has been determined. P s e t [ k ] denotes the k-th node for which the shortest path is found, with P s e t initialized as a zero vector.
From the set Z s e t , identify all nodes j directly connected to s based on the adjacency matrix. Determine whether the current distance from the starting point to j in mindis is greater than the sum of the distance from the starting point to s in mindis and the direct distance from s to j. If so, update the distance from the starting point to j in mindis to the latter value, and modify the path sequence in R s e t for the starting point to j by appending s to the path sequence from the starting point to s. This step is referred to as “relaxation.”
mindis j = mindis j , mindis j < mindis s + d i s s , j mindis s + d i s s , j , mindis j > mindis s + d i s s , j
Check whether the distance from the starting point to j in the mindis table is less than infinity. If so, further determine whether the distance from the starting point to j is shorter than the distances from the starting point to all other points in Z s e t that have been searched so far. If this condition is met, mark j. That is,
mindis j = mindis j , mindis j < mindis s + d i s s , j mindis s + d i s s , j , mindis j > mindis s + d i s s , j R s e t j = R s e t s j
Check whether all points in Z s e t directly connected to s have been searched. If yes, proceed to the next step; otherwise, return to the second step.
Select the point P s e t [ k ] in Z s e t that is closest to the starting point and add it to P s e t (removing P s e t [ k ] from Z s e t ). P s e t [ k ] corresponds to the last marked j. This gives
book P k = 1
If P s e t [ k ] is the target destination, terminate the algorithm. If no such point exists (i.e., the remaining points are unreachable), also terminate the algorithm.
Check whether all elements in the book vector are 1. If yes, terminate the algorithm; otherwise, set s = P s e t [ k ] and return to the second step.
Finally, mindis stores the shortest distances from the starting point to all other points, and R s e t stores the corresponding routes for these shortest distances.
By replacing distances with weights of road segments, the algorithm can be applied to weighted graphs. However, Dijkstra’s algorithm requires all weights to be non-negative. Since the maps involved generally do not contain directed segments, there is no need to consider issues related to negative cycles. If Z s e t is stored as a linked list, the time complexity of Dijkstra’s algorithm is approximately n 2 , where n is the number of vertices.

3.3. Design of a Spatiotemporal-Capability Dual-Driven Dynamic Task Planning Algorithm for Heterogeneous Platforms

Multi-platform task planning involves coordinating different types of detection targets with varying spatial and temporal monitoring requirements. Despite pre-allocation of tasks, devising an optimized scheme for multi-platform collaborative detection remains highly complex, especially when considering limitations in the number of platforms, diversity of detection units, and the need to account for target detection redundancy and responsiveness to potential unknown tasks [33]. Therefore, selecting and appropriately applying optimization algorithms to enhance the rationality and processing speed of task planning is of significant importance [34].
To achieve effective scheduling of detection resources for concurrent and diverse detection tasks while maintaining support capability for future uncertain tasks, an optimization algorithm must be designed to minimize resource usage while ensuring task completion. As the design of optimization algorithms relies on quantitative descriptions of optimization effects and costs, the objective function directly influences the direction of optimization. Accordingly, the objective function is designed as follows:
  • Task Allocation Completion Rate
r M = i = 1 N M w i M i N M , M i = 0 , assigned M i = 1 , not   assigned
where N M is the total number of various detection tasks; M i represents the i -th task, which can correspond to different types of tasks. When a task is assigned to a detection platform, M i = 1 , otherwise M i = 0 ; w i is the weight value of task M i , with w i = 1 .
  • Task Time Overlap Rate
r T = i = 1 N M w i T d i T e i T s i N M , T d i = 0 , T d s i > T e i T d i = T e i T d s i , T e i > T d s i > T s i , T d s i > T e i
T s i and T e i represent the start and end detection times of the i -th area, respectively, while T d i and T d i denote the start and end times of the detection unit’s operation in the i -th area.
  • Residual Detection Capability
After scheduling detection platforms according to current detection requirements, the detection capability of both scheduled and unscheduled platforms for the predefined complete detection area and other areas is defined as residual detection capability. Its calculation includes the following two components:
Current Detection Platform Coverage Rate:
r A d M T k = A d 1 A d 2 A d N M A A d i = A d i j P T A j P d i D i , j A l l   D e t e c t i o n   Z o n e   G r i d   I n d i c e s
Here, A represents the total area of the surveillance region; M T k denotes the k -th type of detection task; T A j is the set of grid indices of the area effectively covered by the i -th detection unit d i , where each grid corresponds to a three-dimensional subspace within the detection area; A d i j refers to the three-dimensional grid with index j that can be effectively detected by the i -th detection unit d i ; P T A j is the positional center of the j -th target area; p d i is the location of the i -th detection platform, and all different types of detection units within the platform use this position. When calculating the coverage ratio, duplicate coverage grids must be excluded.
In scenarios involving multiple types of detection tasks simultaneously, the coverage rate must be calculated for all types of detection tasks.
r A d = k = 1 N M T w k M T r A d M T k
Detection Capability for Uncovered Areas:
To assess the system’s capacity to execute current tasks while simultaneously accommodating new tasks, the detection capability for uncovered areas is defined. It is calculated as follows:
A l e f t = A j A j A A d 1 A d 2 A d N M A c a n = A j A j A l e f t , M j = 1 r c a n = A c a n A
A l e f t represents the areas not covered by the currently assigned detection platforms, represented by grid indices; A c a n denotes the area that can be covered by unused platforms. When no remaining platforms are available, A c a n = 0 . r c a n represents the proportion of the total detection area that can be effectively covered by unallocated resources.
  • Design of Comprehensive Optimization Metric Function
The task completion rate, time overlap rate, and residual detection capability mentioned above are all additive metrics. Therefore, a comprehensive optimization metric can be constructed in the following form:
I r = w r M r M + w r T r T + w r A d r A d + w r c a n r c a n
  • Implementation of Task Planning Strategy (Priority Handling)
This project requires the algorithm design to possess the capability of handling different task priorities. The specified priority processing strategies include: key target prioritization, target priority-level prioritization, target quantity prioritization, and multi-method collaboration prioritization. The differentiation of priorities is achieved through weight assignment. In Equations (14) and (15), different weights are allocated to different tasks. Therefore, in practical applications, varying weights can be assigned to corresponding detection tasks based on the aforementioned priority requirements to achieve the implementation of different processing strategies.

3.4. Design of Task Planning Optimization Algorithm Based on DPL

Given the complexity of the optimization scheduling problem, a reinforcement learning optimization approach is adopted [35], building upon a rationally designed objective function.
The reinforcement learning framework primarily consists of two components: the Agent and the Environment. The Agent interacts with the Environment through signals: State, Action, and Reward. The framework of a standard reinforcement learning system is illustrated in the referenced figure [36]. The Agent takes actions based on the current state of the environment, receives an immediate reward value, and the environment subsequently transitions to the next state, providing the obtained reward as feedback to the Agent. The Agent then adjusts its own strategy based on this environmental feedback.
The fundamental principle of reinforcement learning is as follows: if an action policy taken by the Agent receives positive feedback from the environment, the probability of the Agent selecting this action policy in the future increases. Conversely, if an action policy results in negative environmental feedback, the probability of generating this action policy decreases until the tendency to select it diminishes [9].
The multi-agent coverage problem can be defined as: agents traverse the target area through physical contact or sensor-based perception while optimizing detectable probability and regional coverage performance [37].
Let the set N = 1 , 2 ,   , n represent detection units. The potential location of a detected target is l a t i t u d e m , l o n g i t u d e m , h e i g h t m , while the possible location of a detection unit is X i , Y i , H i .
The target area covered by detection units is divided into M × N × K cells, and the deployable region is divided into W × L × H cells. The set of coverage indicator variables for the detection units is defined such that when cell i is covered, the indicator variable c i j k = 1 ; otherwise, it is 0. Assuming the initial position of a detection unit is u l a t i t u d e 0 , u l o n g i t u d e 0 , u h e i g h t 0 , its position at time T is u l a t i t u d e T , u l o n g i t u d e T , u h e i g h t T .
An optimal deployment strategy is sought to enable detection units to move from their initial positions to target locations with minimal energy consumption while satisfying coverage and accuracy requirements. DRL integrates the perceptual capabilities of deep learning with the decision-making abilities of reinforcement learning, continuously interacting with the environment through trial and error to derive optimal strategies by maximizing cumulative rewards. STAS-Net is employed to solve the deployment problem of detection units, where the value network explores various actions under current observations and interacts with the environment in real time. States, actions, and rewards are stored in a replay memory unit, and the Q-learning algorithm is used to iteratively train the value network, ultimately selecting the deployment of detection units that yields the maximum value. The STAS-Net model is represented as s , a , R set, as described below:
  • State s T (at time T )
The state s t comprises six components: u l a t i t u d e T , u l o n g i t u d e T , u h e i g h t T , u l a t i t u d e 0 , u l o n g i t u d e 0 , u h e i g h t 0 represents the initial position of the detection unit and its position at time T ; χ denotes the expected detectable probability of the area; β denotes the expected coverage performance of the area; η denotes the expected positioning accuracy; and μ denotes the fixed movement distance per step for each detection unit.
Thus, let s T = u k l a t i t u d e T , u k l o n g i t u d e T , u k h e i g h t T , u k l a t i t u d e 0 , u k l o n g i t u d e 0 , u k h e i g h t 0 , χ , β , η , μ . Assuming the number of detection units is N , the total number of elements is 6 × N + 4 . By defining the state in this manner, the DRL agent can make decisions based on the requirements of detectable probability, area coverage performance, and positioning accuracy.
  • Action a T (at time T )
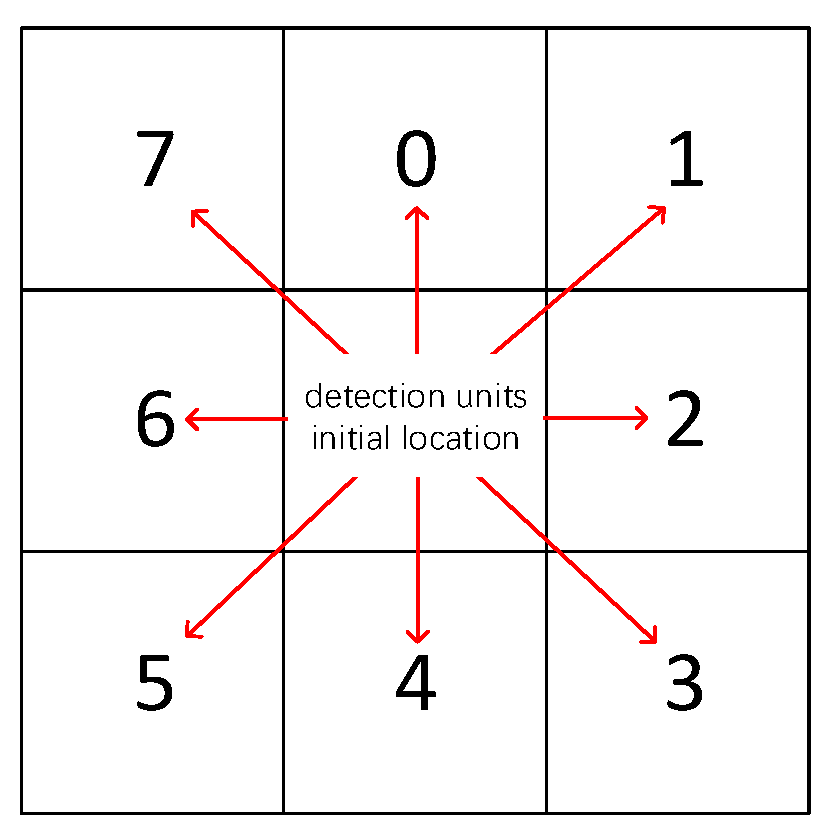
The actions of detection units are discretized into 27 predefined movements, as illustrated in the corresponding figure. The horizontal movement directions are defined with 8 possible actions(shown in Figure 8), while spatial movements include 16 directions. Additionally, hovering and two vertical movements (up and down) are included, resulting in a total of 27 actions. Each action corresponds to a fixed displacement distance for the detection unit. Based on environmental feedback, if a detection unit does not reach an optimal position after executing an action, it will continue to take corresponding actions until it achieves optimal positioning, thereby completing autonomous deployment. The overall action space is defined as a 0 , a 1 , , a 26 . When an action is selected, its value is set to 1, while all other action values are set to 0.
The a i action space for an agent is defined as the set of all possible actions it can take. However, when an agent is located at the edge of the deployable area, its available action space becomes a subset of the full 27 actions. For example, if an agent is positioned at the top-right edge, its actionable options are limited to a i subset of the original action space.
  • Reward Function (at time T )
The reward function is defined using the objective function specified in Equation (19).
  • DRL under Sufficient Computational Resources
When computational resources are adequate, the reinforcement learning algorithm approaches can be employed to solve the problem [38].
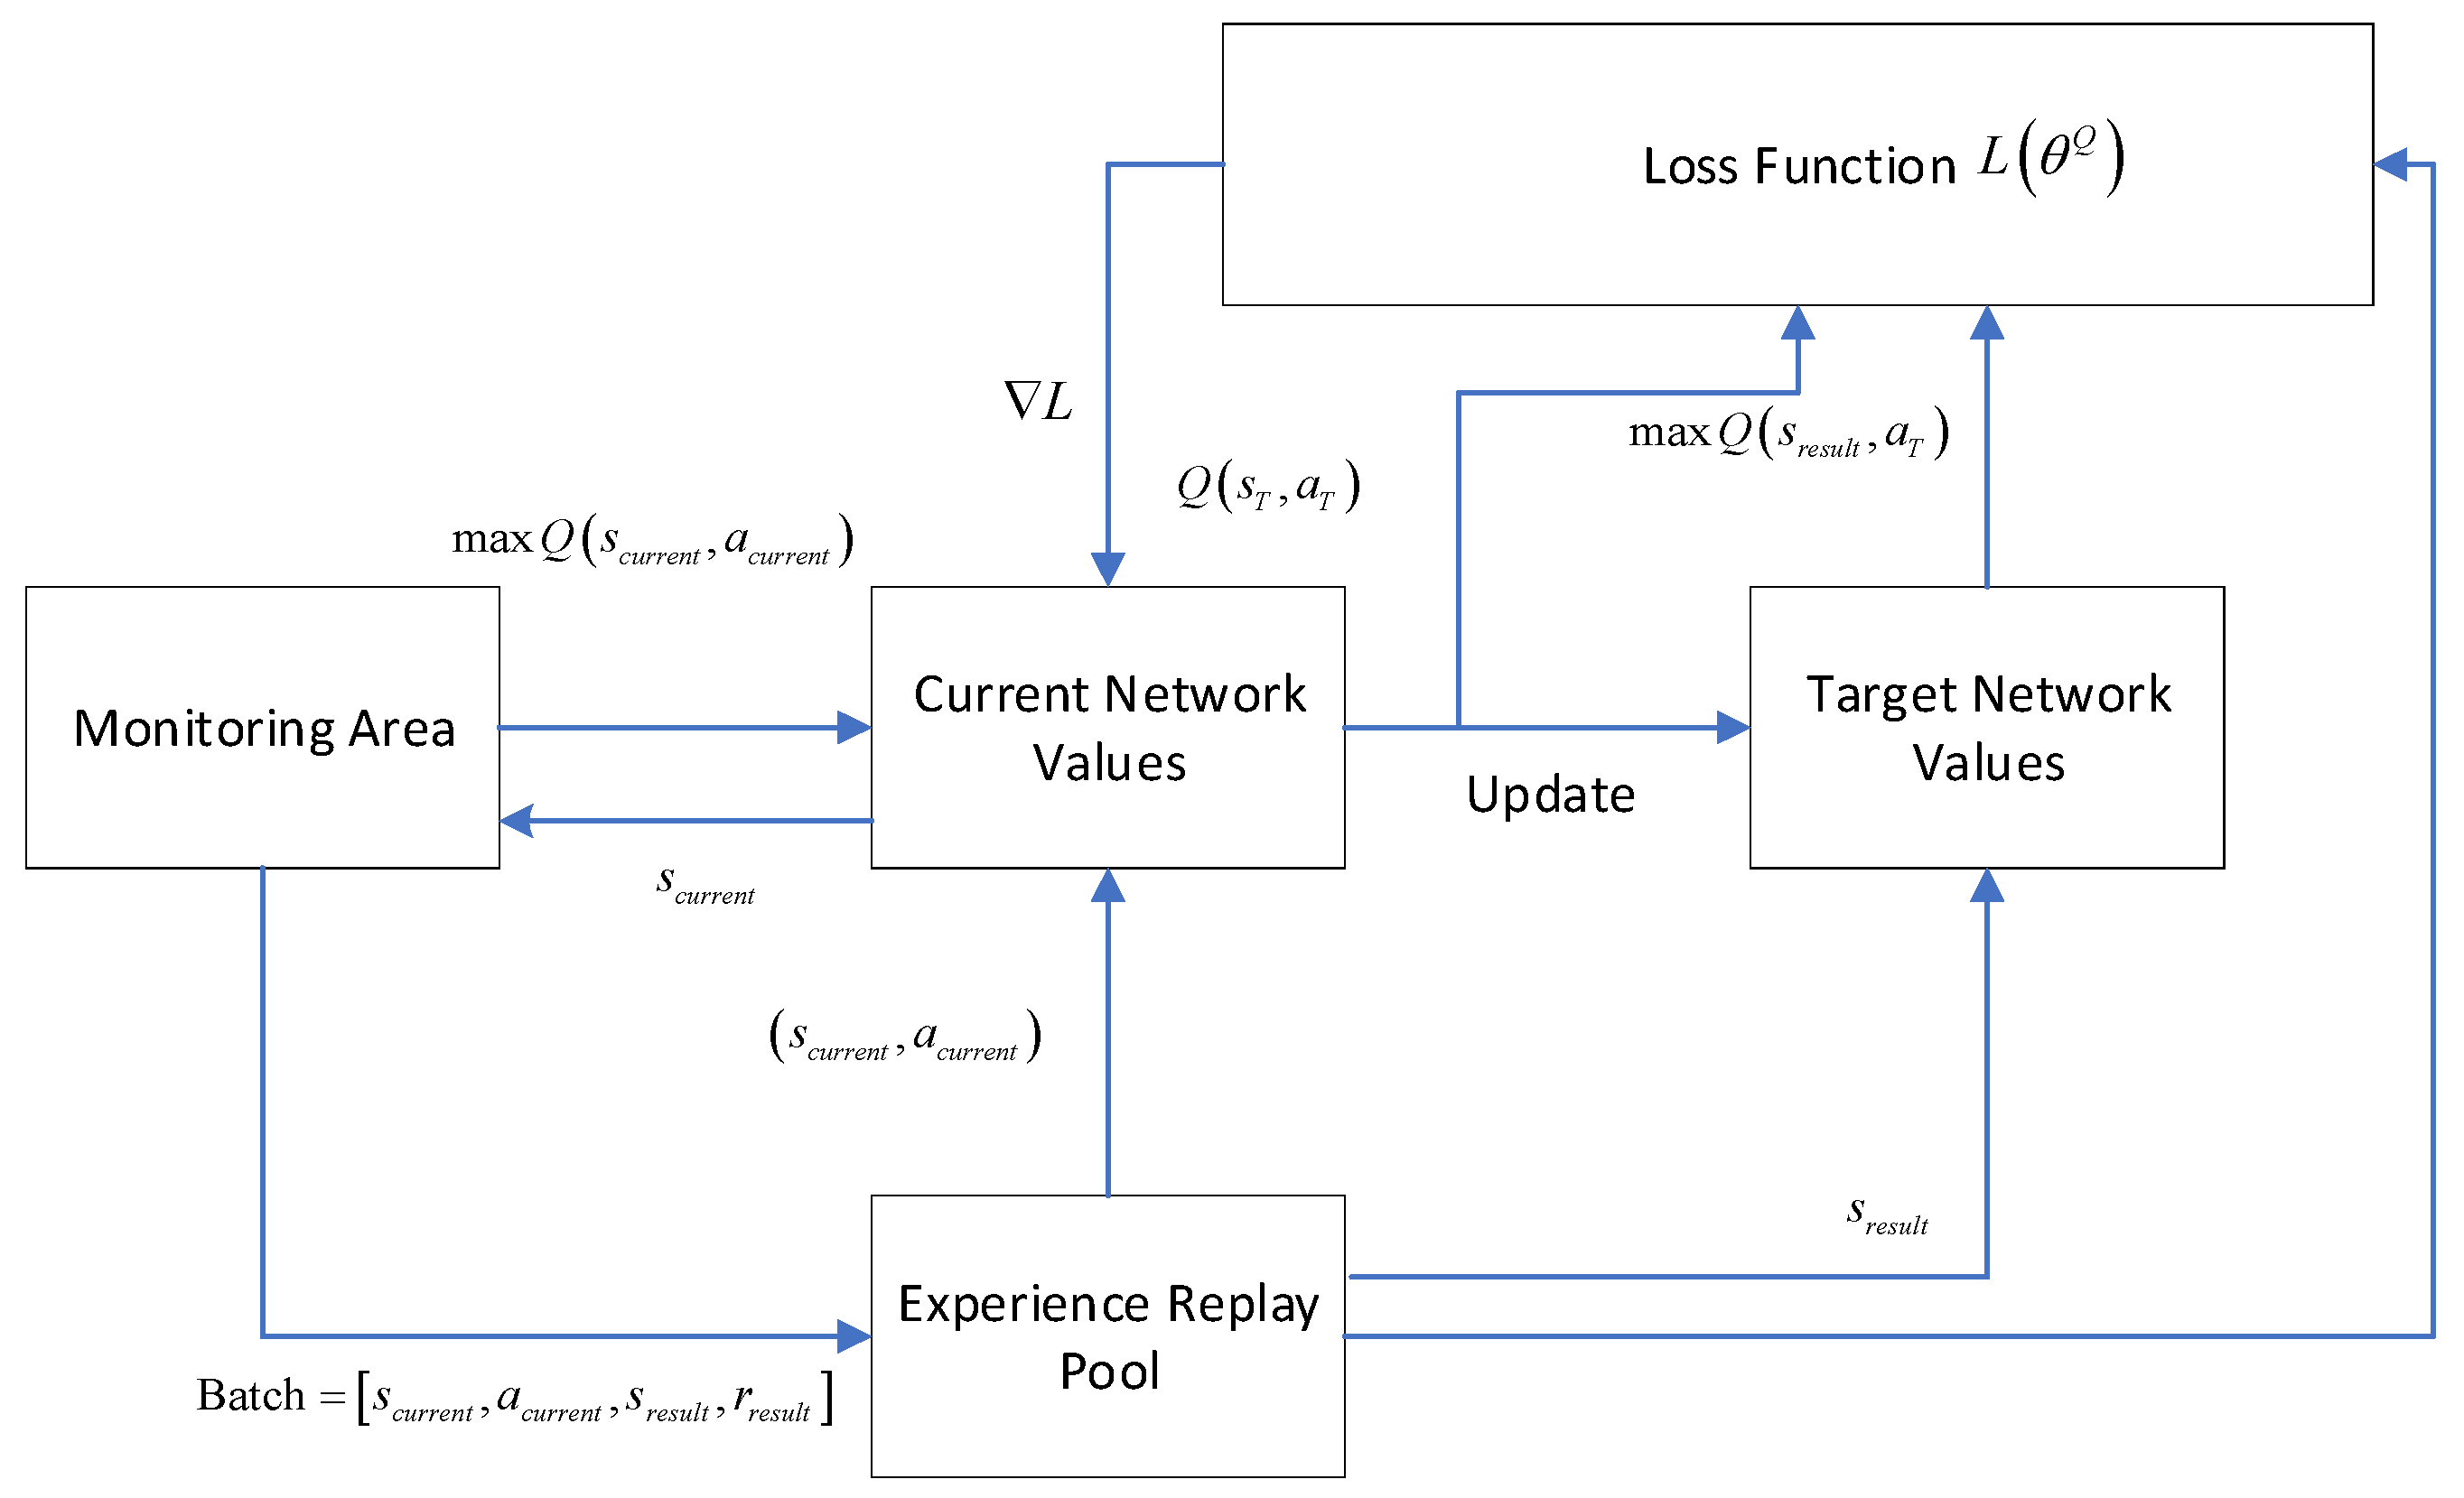
The Core intelligent Optimization Engine of STAS-NET model primarily consists of a Convolutional Neural Network (ConvNet) and a Q-learning-based decision model. The structure of the core engine is illustrated in Figure 9.
Let s c u r r e n t represent the current state of the agent, a c u r r e n t the current action taken by the agent, s r e s u l t the resulting state after the agent executes action a c u r r e n t in state s c u r r e n t , a r e s u l t the available actions in state s r e s u l t , and r r e s u l t the immediate reward received after the agent selects action a c u r r e n t .
The experience replay pool is used to store historical samples of state-action pairs and their corresponding rewards. Each sample in the pool can be represented as:
Batch = s c u r r e n t , a c u r r e n t , s r e s u l t , r r e s u l t
As training progresses, the system leverages the ConvNet to accelerate the learning speed of the Q-learning module. Similarly to Q-learning, STAS-NET updates the Q-function for each state-action pair, which represents the expected long-term discounted reward over n time steps for state s T and action a T . The Q-function is defined as follows:
Q s T , a T = E s r e s u l t R s + γ max Q s r e s u l t , a T } | s T , a T
Here, R s denotes the reward function, and the discount factor γ quantifies the relative importance of future rewards in the Q-function. The Q-function is approximated using a ConvNet with adjustable weight parameters, serving as a nonlinear approximator for each action. However, due to the dynamic nature of the network, the ConvNet model requires retraining to adapt to the deployment positions of the different platform.

4. Result

To comprehensively validate the effectiveness of the proposed algorithm, we constructed a collaborative observation simulation environment incorporating multiple platforms across land, sea, air, and space. This environment integrates multiple physical constraints, including Earth curvature effects and atmospheric refraction. The simulation system is configured with 6 low-orbit remote sensing satellites equipped with side-swing capabilities, orbiting at an altitude of 500 km; 4 high-altitude long-endurance UAVs with an endurance of 3 h and a maximum range of 1000 km; 3 marine monitoring vessels with a speed of 25 knots; and 5 mobile monitoring vehicles with a speed of 40 km per hour. The initial positions of these platforms are concentrated in coastal land areas.
To comprehensively evaluate the performance and scalability of the proposed framework across different task scales, we designed a multi-scenario test set. The task dataset is divided into three scenarios based on the number of targets: small-scale, medium-scale, and large-scale, with a unified mission planning cycle set to 6 h. All three scenarios maintain a target-type composition of 50% point, 20% area, and 30% point (including Trajectory). The total number of small, medium, and large sets are20, 50, and 100.
To thoroughly evaluate the performance advantages of the proposed framework, greedy algorithms and genetic algorithms were selected as benchmark comparison methods. The greedy algorithm adopts an immediate optimal strategy, selecting the platform-task allocation scheme with the highest benefit at each decision point. The genetic algorithm is configured with a population size of 100, 200 evolutionary generations, crossover and mutation probabilities of 0.8 and 0.1, respectively, and seeks a globally optimal solution by simulating the natural evolutionary process. The evaluation system is designed around the core requirements of collaborative observation, including target coverage rate, planning time consumption, and resource utilization rate. The target coverage rate is defined as the ratio of the actual detected area to the required detection area, planning time consumption refers to the algorithm computation time, and resource utilization measures the proportion of effective working time of each platform.
The algorithm was executed on a ThinkStation P920, equipped with dual Intel Xeon Gold 6154 3.0 GHz processors, eight 32 GB DDR4 ECC memory modules, and an NVIDIA RTX A6000 professional graphics card, running the Windows 11 operating system.

5. Discussion

5.1. Analysis of Algorithm Results

  • Target Coverage Rate
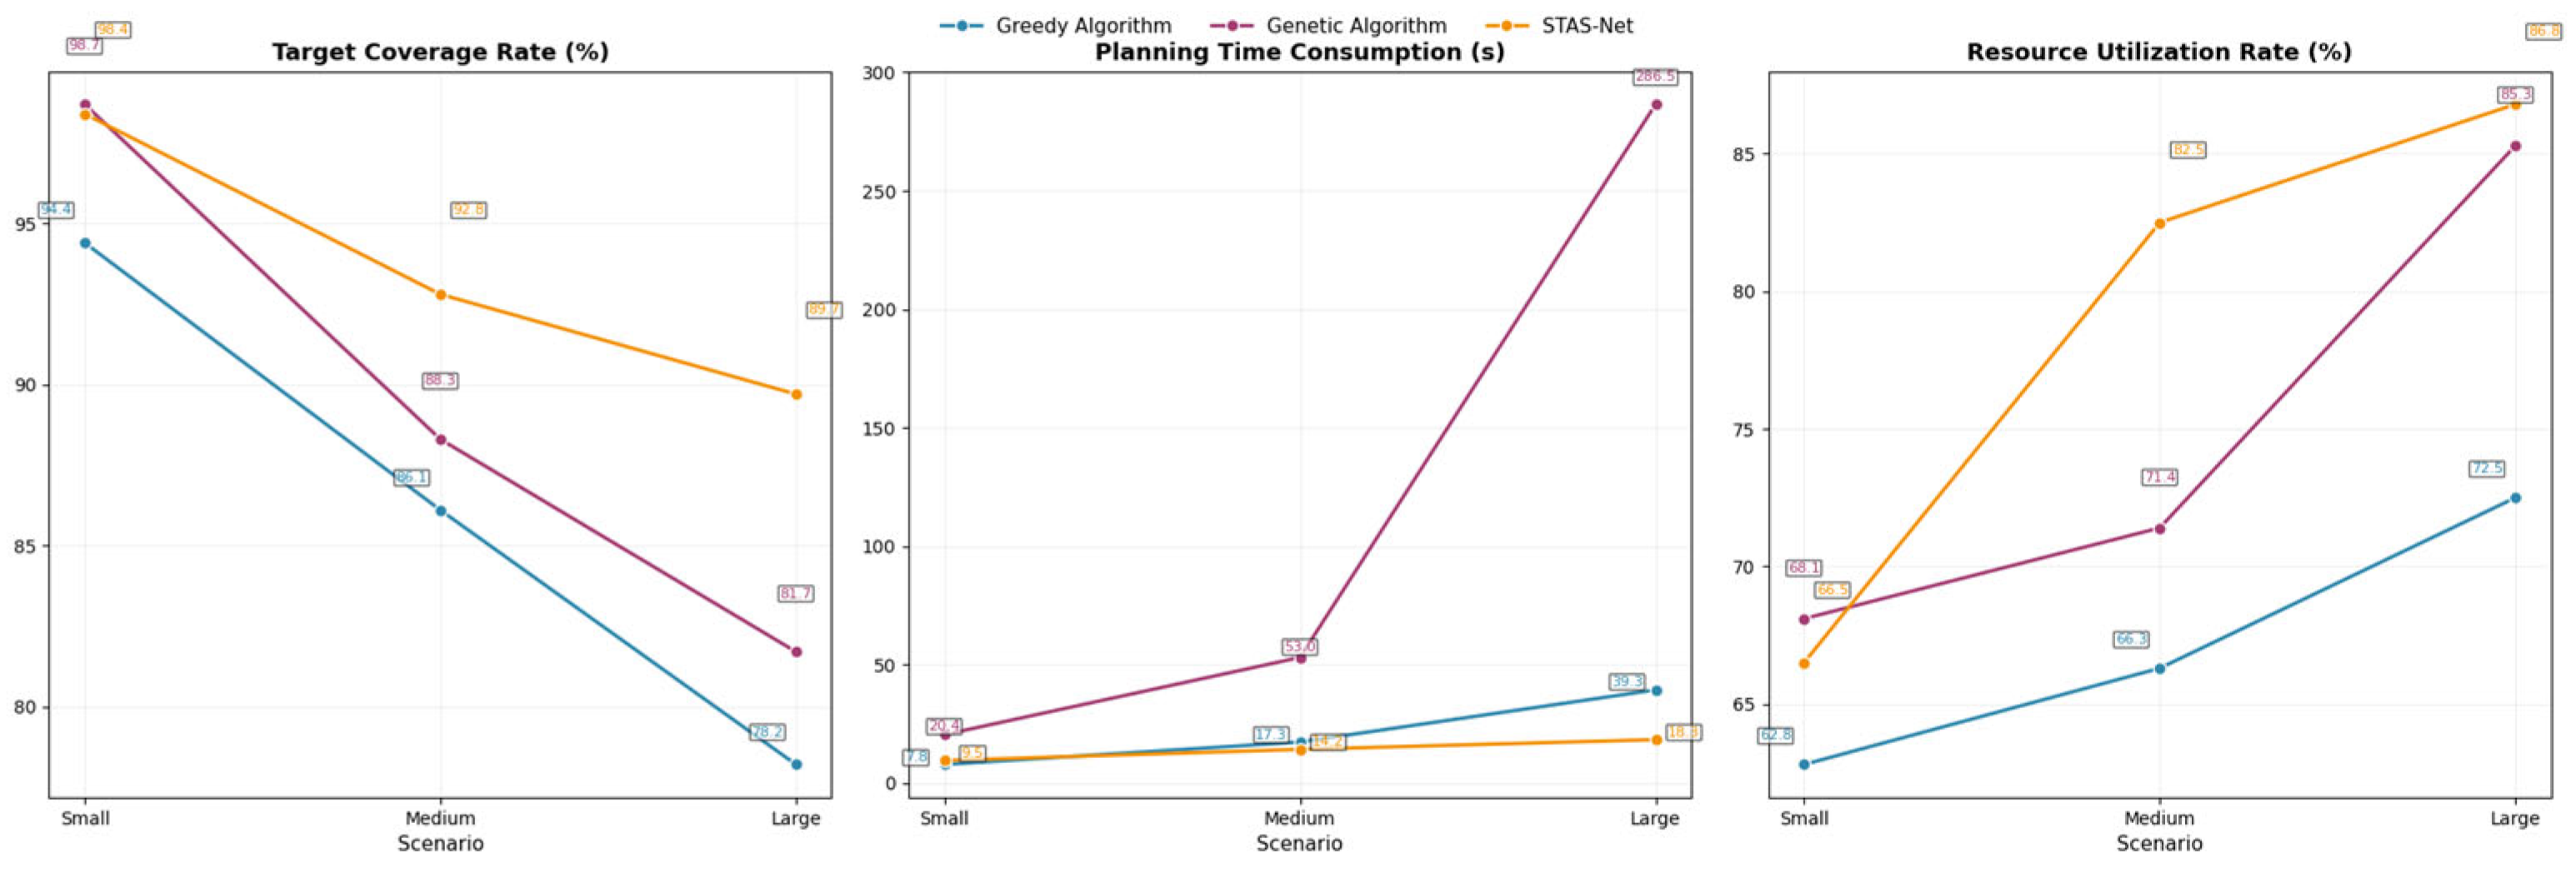
As shown in Figure 10, which is drawn based on Table 4., STAS-Net achieves a high coverage rate of 89.7% in the large-scale scenario (100 targets), leading the Greedy Algorithm (78.2%) and the Genetic Algorithm (81.7%) by 11.5 and 8.0 percentage points, respectively. Its scalability advantage is particularly prominent: when the number of targets increases from 20 to 100 (a fivefold expansion in scale), the coverage of the Greedy and Genetic Algorithms drops by 16.2 and 17.0 percentage points, respectively, while STAS-Net declines by only 8.7 percentage points—approximately half the reduction in traditional algorithms. This quantitative result indicates that STAS-Net possesses superior solution quality retention capability as the task scale expands. It is worth noting that in small-scale scenarios, the Genetic Algorithm, due to its ability to fully perform global crossover and mutation, slightly outperforms STAS-Net in coverage (98.7% vs. 98.4%). However, as the dimensionality of the solution space increases dramatically, the efficiency of its random search mechanism rapidly declines, and its advantage disappears.
  • Planning Time Consumption
In the large-scale scenario, STAS-Net requires only 18.3 s for planning, which is approximately 53% and 93.6% faster than the Greedy Algorithm (39.3 s) and the Genetic Algorithm (286.5 s), respectively. More importantly, the growth curve of its time consumption with respect to scale is extremely gentle: from 20 to 100 targets, its time increases by only 1.93 times, showing an approximately linear trend. In contrast, the Greedy and Genetic Algorithms increase by 5.04 and 14.04 times, exhibiting polynomial and exponential growth, respectively. In the large-scale scenario, STAS-Net’s time consumption is merely 6.4% of that of the Genetic Algorithm, demonstrating an order-of-magnitude efficiency advantage. This result stems directly from its “offline learning-online inference” architecture: complex strategies are embedded into the network via Deep Reinforcement Learning during the training phase, and only a single forward propagation is required during the online phase to output decisions, completely circumventing the iterative search overhead of traditional methods.
  • Resource Utilization Rate
STAS-Net achieves a resource utilization rate of 86.8% in the large-scale scenario, which is 14.3 and 1.5 percentage points higher than that of the Greedy Algorithm (72.5%) and the Genetic Algorithm (85.3%), respectively. Its scheduling advantage strengthens continuously as the task scale expands: in the medium-scale scenario, its utilization (82.5%) is already significantly higher than that of the Genetic Algorithm (71.4%) by 11.1 percentage points, reaching its peak in the large-scale scenario. This is attributed to the design of its reward function for multi-objective collaborative optimization. While pursuing high coverage and fast response, it explicitly incorporates optimization objectives such as task completion rate, time overlap rate, and residual detection capability of platforms, thereby guiding the agent to learn a globally coordinated resource scheduling strategy. In contrast, the Greedy Algorithm suffers from severely imbalanced resource allocation due to local optimal decisions. Although the Genetic Algorithm can occasionally approach better load distribution through random search, it lacks directed guidance towards the system-level goal of “balance,” making it difficult to achieve stable Pareto-optimal scheduling.

5.2. Analysis of Algorithm Principles

  • Greedy Algorithm: Rule-Driven Myopic Decision-Making Paradigm
The essence of this algorithm is to perform single-step optimal decisions based on deterministic local heuristic rules. It decouples the global optimization problem into a series of independent instantaneous choices, with its decision horizon limited to the static reward function at the current moment. It cannot model the dynamic coupling relationships among “platform selection—spatiotemporal reachability changes—task pool updates.” As the number of targets increases, local optimal traps in the solution space grow exponentially. Lacking a backtracking mechanism, the algorithm inevitably falls into suboptimal solutions, leading to a sharp decline in coverage as the scale expands. This reveals the inherent limitations of the rule-driven decision-making paradigm in handling high-dimensional spatiotemporal coupling problems.
  • Genetic Algorithm: Search-Driven Random Exploration Paradigm
This algorithm performs parallel exploration in the solution space through population-level random operations (selection, crossover, mutation). Although it possesses theoretical global convergence, its evolutionary operations belong to unguided, syntax-level transformations: crossover and mutation are executed blindly, easily disrupting the spatiotemporal logic and complex constraints embedded within solutions. Consequently, a large amount of computational resources is consumed exploring invalid regions. Therefore, when facing the “rugged solution space terrain” formed by large-scale problems, its search efficiency decays sharply, falling into the fundamental bottleneck where effectiveness and efficiency are difficult to balance.
  • STAS-Net: Learning-Driven Graph Reasoning Decision-Making Paradigm
The essence of this algorithm is a paradigm innovation combining “graph representation learning” and “reinforcement learning strategy optimization.” The ConvNet encodes heterogeneous platforms, multi-dimensional tasks, and their spatiotemporal relationships into a unified graph structure, explicitly modeling the high-order coupling relationships among “platform—task—spatiotemporal” elements. The DRL framework learns, through end-to-end training, an implicit decision function that maps the system state to a long-term optimal strategy. This means the algorithm no longer relies on local heuristic rules or random search. Instead, by leveraging abstract representation of complex relationships and explicit optimization of long-term rewards, it directly infers a global allocation scheme that balances immediate gains and future opportunities, thereby realizing a paradigm shift from “blind search” to “intelligent reasoning.”
STAS-Net demonstrates a quantifiably superior and comprehensive performance across all three evaluation metrics. When the task scale expands fivefold, its decline in coverage rate is only approximately half that of traditional algorithms; its increase in planning time is less than half to one-seventh of that observed in conventional methods; and it achieves the most substantial improvement in resource scheduling efficiency. These results provide statistically robust evidence that STAS-Net possesses significant and measurable advantages in maintaining solution quality, ensuring temporal scalability, and enhancing scheduling effectiveness when applied to large-scale, complex collaborative planning problems.

6. Conclusions

This research proposes a spatiotemporal-capability dual-driven dynamic task planning method for land–sea–air–space heterogeneous platforms, aiming to address the core challenges of inefficient resource scheduling and incomplete spatiotemporal coverage in cooperative observation systems. The method constructs a multi-dimensional spatiotemporal decoupling model that decomposes complex observation scenarios into independently processable subtask units. By integrating Earth’s curvature effects, platform mobility constraints, and payload detection characteristics, a unified “accessibility–visibility” computational framework is established. At the optimization level, a STAS-Net model is adopted, which incorporates a comprehensive objective function integrating multi-dimensional metrics such as task completion rate, temporal coincidence degree, and residual detection capability, thereby achieving intelligent optimization of cooperative scheduling strategies for heterogeneous platforms.
Quantitative results from multi-scenario experiments (with target scales of 20–100 and a planning cycle of 6 h) demonstrate that, within the tested setup (i.e., medium- to large-scale heterogeneous platform cooperative observation scenarios), the proposed method exhibits significant advantages: its reduction in coverage rate is only about 50% of that of traditional algorithms, its increase in planning time is less than 1/2 to 1/7 of that of traditional algorithms, and it achieves the greatest improvement in resource scheduling efficiency. These advantages remain consistent across pressure tests involving various scales and types of targets, validating the robustness of the method under similar complexities and constraints.
For future research, tasks and constraints can be refined based on more detailed geophysical models (such as standard atmospheric refraction and constant curvature) and platform kinematic models, covering a wider range of platform types (e.g., underwater robots, near-space vehicles), environmental conditions, and mission profiles. Meanwhile, since STAS-Net strictly follows an “offline pre-training + online real-time inference” paradigm—where offline training uses large-scale simulation data to enable the model to learn general strategies for heterogeneous platform cooperative scheduling—an optional online fine-tuning mechanism can be designed in the future. When platforms are updated or new platforms are introduced, this module would allow for local parameter adjustments to the pre-trained model based on a small amount of new scenario data, thereby enhancing the method’s ability to rapidly adapt to equipment iterations and environmental changes.

Author Contributions

Conceptualization, G.W. and G.Z.; methodology, W.F. and C.H.; formal analysis, G.Z.; writing—original draft, G.Z.; writing—review and editing, G.W., W.F. and C.H. All authors have read and agreed to the published version of the manuscript.

Funding

This research was supported by the National Natural Science Foundation of China under grant U22B2011.

Data Availability Statement

The original contributions presented in this research are included in the article. Further inquiries can be directed to the corresponding author.

Acknowledgments

The authors would like to thank the anonymous reviewers for their valuable comments and suggestions.

Conflicts of Interest

Author G. Z., G.W., W.F. and C.H. were employed by the CETC Key Laboratory of Aerospace Information Applications. The authors declare that the research was conducted in the absence of any commercial or financial relationships that could be construed as a potential conflict of interest.

Abbreviations

The following abbreviations are used in this manuscript.
Asurveillance area
AEOSAgile Earth Observing Satellites
A d i j three-dimensional grid with index j
a T Action parameter in STAS-Net model
B receiver bandwidth
bookflag vector, with a size equal to the number of nodes
CLDECentralized Training with Decentralized Execution
DRLDeep Reinforcement Learning
DMASADistributed Multi-Agent Scheduling Architecture
D i maximum detection distance of the i-th category
d i i -th detection unit
F receiver noise figure
FJSPFlexible Job Shop Scheduling Problem
GE-HetGNNGraph Embedding–Heterogeneous Graph Neural Network
GCNGraph Convolutional Network
GNNGraph Neural Networks
G t antenna gain in the given direction
G r receiving antenna gain
k Boltzmann’s constant
l c u b e grid side length
MAPPOMulti-Agent Proximal Policy Optimization
MASMulti-Agent Systems
M T k the k -th type of detection task
M i the i -th task, which can correspond to different types of tasks
mindisA set stores the distances from the starting point to all other points
N t y p e category of detection unit
N M total number of various detection tasks
O e Earth’s center
P D A location point of detection unit, including longitude, latitude and height
P T A location point of target, including longitude, latitude and height
P m P n detectable   boundary   of   P m   to   P n
P s e t set of vertices for which the shortest path has been determined
P T A j positional center of the j -th target area
p r echo power
p t transmission power
p d i location of the i -th detection platform
R distance between the radar and the target
R s e t stores the sequence of nodes traversed from the starting point
RH-MAPPORolling-Horizon-based Multi-Agent Proximal Policy Optimization
r A d Current Detection Platform Coverage Rate
r c a n proportion of the total detection area that can be effectively covered by unallocated resources
STAS-NetSpatio-Temporal Adaptive Scheduling Network
S N R 0 the output signal-to-noise ratio of the receiver
s T State parameter in STAS-Net model
Tobservation time
T A j set of grid indices of the area effectively covered by the i - th   detection   unit   d i
t temperature
UAVUnmanned Aerial Vehicle
V2Vvehicle-to-vehicle
V2Xvehicle-to-everything
Z s e t set of unvisited points
αa proportionality coefficient (typically 1/3)
β the expected coverage performance of the area
σ target scattering cross-sectional area
λ radar wavelength
w the weight value
χ expected detectable probability of the area
η expected positioning accuracy
μ the fixed movement distance per step for each detection unit
Δ θ g r o u n d a given threshold angle for ground clutter interference

References

  1. Feng, H.L. Research on Mission Planning Methods for Space-Air Cooperative Observation. Master’s Thesis, Harbin Engineering University, Harbin, China, 2022. [Google Scholar]
  2. Hou, R.; Cheng, Y.T.; Li, H. Intelligent Mission Planning Technology for Cooperative Monitoring of Marine Multi-Platform and Multi-Sensor. Mar. Inform. 2020, 35, 11–19. [Google Scholar]
  3. Huang, W.; Qin, Q. Mission Planning Method of Heterogeneous Reconnaissance System Based on Simulated Annealing Algorithm. J. Phys. Conf. Ser. 2024, 1290, 012034. [Google Scholar] [CrossRef]
  4. Park, K.; Moon, I. Multi-agent deep reinforcement learning approach for EV charging scheduling in a smart grid. Appl. Energy 2022, 328, 120111. [Google Scholar] [CrossRef]
  5. Jing, X.; Yao, X.; Liu, M.; Zhou, J. Multi-agent reinforcement learning based on graph convolutional network for flexible job shop scheduling. J. Intell. Manuf. 2024, 35, 75–93. [Google Scholar] [CrossRef]
  6. Pu, Y.; Li, F.; Rahimifard, S. Multi-Agent Reinforcement Learning for Job Shop Scheduling in Dynamic Environments. Sustainability 2024, 16, 3234. [Google Scholar] [CrossRef]
  7. Zhu, X.; Xu, J.; Ge, J.; Wang, Y.; Xie, Z. Multi-Task Multi-Agent Reinforcement Learning for Real-Time Scheduling of a Dual-Resource Flexible Job Shop with Robots. Processes 2023, 11, 267. [Google Scholar] [CrossRef]
  8. Zhao, R.; Tao, S.; Li, P. Safety-efficiency integrated assembly: The next-stage adaptive task allocation and planning framework for human–robot collaboration. Robot. Comput.-Integr. Manuf. 2025, 94, 102942. [Google Scholar] [CrossRef]
  9. Wang, Y.; Xiang, B.; Huang, S. SCRIMP: Scalable Communication for Reinforcement- and Imitation-Learning-Based Multi-Agent Pathfinding; IEEE: Detroit, MI, USA, 2023; pp. 9301–9308. [Google Scholar]
  10. Liu, R.; Piplani, R.; Toro, C. A deep multi-agent reinforcement learning approach to solve dynamic job shop scheduling problem. Comput. Oper. Res. 2023, 159, 106294. [Google Scholar] [CrossRef]
  11. Zhao, X.; Wu, C. Large-Scale Machine Learning Cluster Scheduling via Multi-Agent Graph Reinforcement Learning. IEEE Trans. Netw. Serv. Manag. 2022, 19, 4962–4974. [Google Scholar] [CrossRef]
  12. Jung, S.; Yun, W.J.; Shin, M.; Kim, J.; Kim, J.H. Orchestrated Scheduling and Multi-Agent Deep Reinforcement Learning for Cloud-Assisted Multi-UAV Charging Systems. IEEE Trans. Veh. Technol. 2021, 70, 5362–5377. [Google Scholar] [CrossRef]
  13. Jayanetti, A.; Halgamuge, S.; Buyya, R. Multi-agent deep reinforcement learning framework for renewable energy-aware workflow scheduling on distributed cloud data centers. IEEE Trans. Parallel Distrib. Syst. 2024, 35, 604–615. [Google Scholar] [CrossRef]
  14. Shen, W.; Lin, W.; Wu, W. Reinforcement learning-based task scheduling for heterogeneous computing in end-edge-cloud environment. Clust. Comput. 2025, 28, 179. [Google Scholar] [CrossRef]
  15. Zhang, X.; Wang, Q.; Yu, J.; Sun, Q.; Hu, H.; Liu, X. A Multi-Agent Deep-Reinforcement-Learning-Based Strategy for Safe Distributed Energy Resource Scheduling in Energy Hubs. Electronics 2023, 12, 4763. [Google Scholar] [CrossRef]
  16. Kaewdornhan, N.; Srithapon, C.; Liemthong, R.; Chatthaworn, R. Real-Time Multi-Home Energy Management with EV Charging Scheduling Using Multi-Agent Deep Reinforcement Learning Optimization. Energies 2023, 16, 2357. [Google Scholar] [CrossRef]
  17. Yang, H.Y. Research on Large-Scale Mission Planning Methods for Giant Remote Sensing LEO Satellite Clusters. Master’s Thesis, Harbin Engineering University, Harbin, China, 2024. [Google Scholar]
  18. Wang, J.F.; Jia, G.W.; Guo, Z. A Survey of Research on Multi-UAV Cooperative Mission Planning Methods. Syst. Eng. Electron. 2024, 46, 3437–3450. [Google Scholar]
  19. Liu, Y.; Cong, J.Y. Research Review on UAV Cooperative Mission Planning. Ship Electron. Eng. 2025, 45, 22–27. [Google Scholar]
  20. Hall, N.G.; Magazine, M.J. Maximizing the value of a space mission. Eur. J. Oper. Res. 1994, 78, 224–241. [Google Scholar] [CrossRef]
  21. Harrison, S.A.; Price, M.E.; Philpott, M.S. Task Scheduling for Satellite Based Imagery; Durham University: Durham, UK, 1999; pp. 64–78. [Google Scholar]
  22. Iacopino, C.; Palmer, P.; Brewer, A. EO Constellation MPS Based on Ant Colony Optimization Algorithms; IEEE: Istanbul, Turkey, 2013; pp. 159–164. [Google Scholar]
  23. He, R.J. Research on Scheduling Problems for Imaging Reconnaissance Satellites. Ph.D. Thesis, National University of Defense Technology, Changsha, China, 2005. [Google Scholar]
  24. Wang, X.; Zhao, F.; Shi, Z.; Jin, Z. Deep Reinforcement Learning-Based Periodic Earth Observation Scheduling for Agile Satellite Constellation. J. Aerosp. Inf. Syst. 2023, 20, 508–519. [Google Scholar] [CrossRef]
  25. Li, Z.; Zhu, X.; Liu, C.; Song, J.Y.; Liu, Y.; Yin, C. Dynamic task scheduling optimization by rolling horizon deep reinforcement learning for distributed satellite system. Expert Syst. Appl. 2025, 289, 128350. [Google Scholar] [CrossRef]
  26. Xue, P.; Pi, Y. Collaborative planning and control of heterogeneous multi-ground unmanned platforms. Eng. Appl. Artif. Intell. 2024, 136, 108968. [Google Scholar] [CrossRef]
  27. Wiseman, Y. Autonomous Vehicles. In Encyclopedia of Information Science and Technology; IGI Global Scientific Publishing: Hershey, PA, USA, 2020; Volume 1, pp. 1–11. [Google Scholar]
  28. Lu, J. Research on Multi-Platform Joint Mission Planning Method for Maritime Target Search. Master’s Thesis, National University of Defense Technology, Changsha, China, 2020. [Google Scholar]
  29. Liu, C.L.; Xu, J.F.; Peng, J.X. Construction of Space-Air Integrated Unmanned Intelligent Detection System and Its Technical Prospects. Natl. Def. Sci. Technol. 2025, 46, 89–95+142. [Google Scholar]
  30. Bai, S.; Jiang, N.; Qin, H. Research on Multi-Platform Cooperative Search Task Planning Method Based on Cuckoo Search Algorithm. Shipboard Electron. Countermeas. 2025, 48, 71–75+79. [Google Scholar]
  31. Zhao, W.D.; Wang, T.J. Research on New Technical Means of UAV Detection. Digit. Commun. World 2021, 15–16+24. [Google Scholar]
  32. Xu, C.; Tang, B. Digital Twin-Driven Collaborative Scheduling for Heterogeneous Task and Edge-End Resource via Multi-Agent Deep Reinforcement Learning. IEEE J. Sel. Areas Commun. 2023, 41, 3120–3135. [Google Scholar] [CrossRef]
  33. Hu, H.F.; Wu, A.D.; Han, B. Research on Intelligent Planning Algorithm for Arctic Optimal Routes Based on Deep Reinforcement Learning. J. Glaciol. Geocryol. 2025, 47, 587–598. [Google Scholar]
  34. Huang, G.Q. Implementation Scheme of Mission Planning Framework for Mobile Reconnaissance Platforms. In Proceedings of the 10th China Command and Control Conference, Beijing, China, 7–9 July 2022; Volume I, pp. 29–36. [Google Scholar]
  35. Zhao, D.M.; Xiong, J. A dynamic planning method for satellite imaging mission based on improved genetic algorithm. Appl. Math. Nonlinear Sci. 2024, 9, 20241526. [Google Scholar] [CrossRef]
  36. Liu, C.R. A Multi-Satellite Multi-Target Observation Task Planning and Replanning Method Based on DQN. Sensors 2025, 25, 1123. [Google Scholar]
  37. Hu, C. Research on Key Technologies of Multi-Agent Collaboration Based on Deep Reinforcement Learning. Ph.D. Thesis, Beijing University of Posts and Telecommunications, Beijing, China, 2025. [Google Scholar]
  38. Huang, C.L. Research on Networking Methods for Integrated Air-Ground Networks Based on Deep Reinforcement Learning. Ph.D. Thesis, Beijing University of Posts and Telecommunications, Beijing, China, 2025. [Google Scholar]
Figure 1. Flowchart of Dynamic Task Planning for Heterogeneous Platforms Based on Spatio-Temporal and Capability Dual-Driven Framework.
Electronics 15 00202 g001
Figure 2. Multi-Platform Collaborative Observation Diagram.
Electronics 15 00202 g002
Figure 3. Detectable Targets and Space platform Coverage Timeline.
Electronics 15 00202 g003
Figure 4. Two-Dimensional Schematic of the Feasible Detection Boundary.
Electronics 15 00202 g004
Figure 5. Determination of Detectable Zones for Land and Sea Platforms.
Electronics 15 00202 g005
Figure 6. Determination of Detectable Zones for Air platforms.
Electronics 15 00202 g006
Figure 7. Optimal Path Search.
Electronics 15 00202 g007
Figure 8. Schematic Diagram of Horizontal Position Movement of the Detection Unit.
Electronics 15 00202 g008
Figure 9. Schematic Diagram of the Core intelligent Optimization Engine STAS-NET Model.
Electronics 15 00202 g009
Figure 10. Algorithm Results.
Electronics 15 00202 g010
Table 1. Detection Equipment Performance Description.
No.ParameterDescription
1Detection TypeCategorizes detection units
2Operating ModeActive, passive, frequency band, mode, etc.
3Detection EnvelopeEnvelope shape of detectable area
4Transmission PowerUsed for calculating received signal power
5Antenna AreaReceiver sensitivity
6Detection CapabilityFor comprehensive assessment of platform detection performance
Table 2. Platform Performance Description.
No.ParameterDescription
1Platform TypeFour types: land, sea, air, and space platforms
2Operating AltitudeAltitude range within which the detection unit can operate effectively
3Operational AreaGround projection of the area where a given detection unit can operate, considering various constraints
4Mobility RangeManeuvering range of the detection unit
5Mobility SpeedMaximum speed at which the detection unit can move; 0 indicates no mobility capability
6Payload TypeTypes and quantities of detectable equipment that can be carried; a single carrier can accommodate different types of detection units
Table 3. Task Requirements Description.
No.ParameterDescription
1Target TypePoint, area, trajectory, and their combinations
2Task LocationEffective description of points, areas, or trajectories
3Detection Task ModeOperating modes such as passive, active, scanning, frequency monitoring, etc., supporting concurrent description of multiple tasks
4Detection Task ParametersSpecific parameters for the employed detection mode, such as frequency band, frequency point, period, etc.
5Task Weight
6Task Start Time
7Task End Time
Table 4. The Result of Three Scenarios.
ScenariosAlgorithmTarget Coverage RatePlanning Time Consumption (s)Resource Utilization Rate
SmallGreedy Algorithm94.4%7.862.8%
Genetic Algorithm98.7%20.468.1%
STAS-Net98.4%9.566.5%
MediumGreedy Algorithm86.1%17.366.3%
Genetic Algorithm88.3%53.071.4%
STAS-Net92.8%14.282.5%
LargeGreedy Algorithm78.2%39.372.5%
Genetic Algorithm81.7%286.585.3%
STAS-Net89.7%18.386.8%
Disclaimer/Publisher’s Note: The statements, opinions and data contained in all publications are solely those of the individual author(s) and contributor(s) and not of MDPI and/or the editor(s). MDPI and/or the editor(s) disclaim responsibility for any injury to people or property resulting from any ideas, methods, instructions or products referred to in the content.