1. Introduction
Stress is a complex biopsychological state that arises when environmental demands exceed an individual’s adaptive capacity. Although acute stress can enhance performance and survival by activating the sympathetic–adrenal–medullary system, chronic stress leads to dysregulation of the hypothalamic–pituitary–adrenal (HPA) axis, cardiovascular strain, and mental health problems such as anxiety and depression [
1,
2]. In modern societies, where constant digital stimulation and occupational pressures are ubiquitous, chronic stress has become a global public health concern, contributing to billions of dollars in healthcare costs and productivity loss each year. Consequently, continuous and reliable stress monitoring has emerged as a critical tool for preventive health and emotional well-being.
Early stress assessment relied on controlled laboratory protocols such as the Trier Social Stress Test [
3], which used cortisol levels and electrocardiographic (ECG) heart rate variability (HRV) to quantify stress responses. However, such setups lacked ecological validity and could not capture natural daily life fluctuations in stress. With the miniaturization of sensors and the advent of wearable technologies, the field shifted toward continuous monitoring of physiological signals—including heart rate, electrodermal activity (EDA), respiration, and particularly photoplethysmography (PPG) [
4]. PPG, widely embedded in smartwatches and fitness trackers, offers an accessible window into cardiovascular dynamics, enabling indirect measurement of HRV features such as RMSSD, HF power, and pNN50, which are known to decrease during stress due to vagal withdrawal [
5].
Nevertheless, accurate stress recognition in daily life conditions remains challenging. Physiological markers of stress are influenced by posture, movement, temperature, and circadian effects [
6,
7,
8], leading to false positives when stress-independent fluctuations resemble emotional arousal. Additionally, inter-individual variability—differences in baseline HRV, reactivity, and stress tolerance—necessitates adaptive models and explainable decision criteria [
9]. While deep learning architectures such as Convolutional Neural Networks (CNNs), Long Short-Term Memory (LSTM) networks, and Transformers have shown impressive performance in recognizing stress from biosignals [
10], their black-box nature limits interpretability and medical credibility. In affective computing, where understanding why a system labels a state as “stress” is essential for user trust, such opacity poses a significant barrier [
11,
12].
At the same time, the last few years have witnessed the rapid proliferation of large language models (LLMs) such as GPT, PaLM, and LLaMA, which demonstrate remarkable capabilities in natural language understanding, reasoning, and multi-domain knowledge integration [
13]. Initially developed for text generation, LLMs are increasingly being applied in scientific discovery, biomedical reasoning, and data interpretation tasks [
14]. These models can synthesize domain knowledge, analyze patterns, and justify hypotheses using existing literature—functions that align closely with the interpretability demands of physiological computing. Yet, despite their widespread adoption in NLP, LLMs have not been systematically integrated into affective computing pipelines as analytical partners. Most explainable AI (XAI) research in stress detection still relies on post hoc feature attribution techniques such as SHapley Additive exPlanations (SHAP) or Local Interpretable Model-agnostic Explanations (LIME), which provide statistical explanations but fail to connect outcomes to biological causality [
15].
In this context, we introduce a Large-Language-Model (LLM)-assisted interpretable framework for stress detection from wearable PPG signals. Our approach leverages both empirical data and physiological reasoning: first, handcrafted HRV features are extracted from PPG signals collected in daily life scenarios. Thresholds are derived algorithmically from feature distributions using ROC–Youden optimization. The LLM is subsequently employed as a reasoning assistant to contextualize and justify the resulting rules within established physiological literature. Nt performs a literature-based justification, automatically searching and summarizing medical evidence that supports each threshold’s directionality. The resulting model—composed of three simple logical rules—predicts stress when at least two conditions are met, achieving comparable accuracy with the selected dataset.
This dual reasoning pipeline ensures that every threshold is both interpretable, reflecting a measurable physiological process, and justified, supported by peer-reviewed findings. In other words, the LLM acts not merely as a computational tool but as a scientific reasoning companion that bridges signal processing, physiology, and evidence synthesis. Compared with traditional and deep learning models, the proposed framework maintains comparable performance while offering complete transparency, physiological coherence, and explainability—key requirements for trustworthy affective computing.
3. Methodology
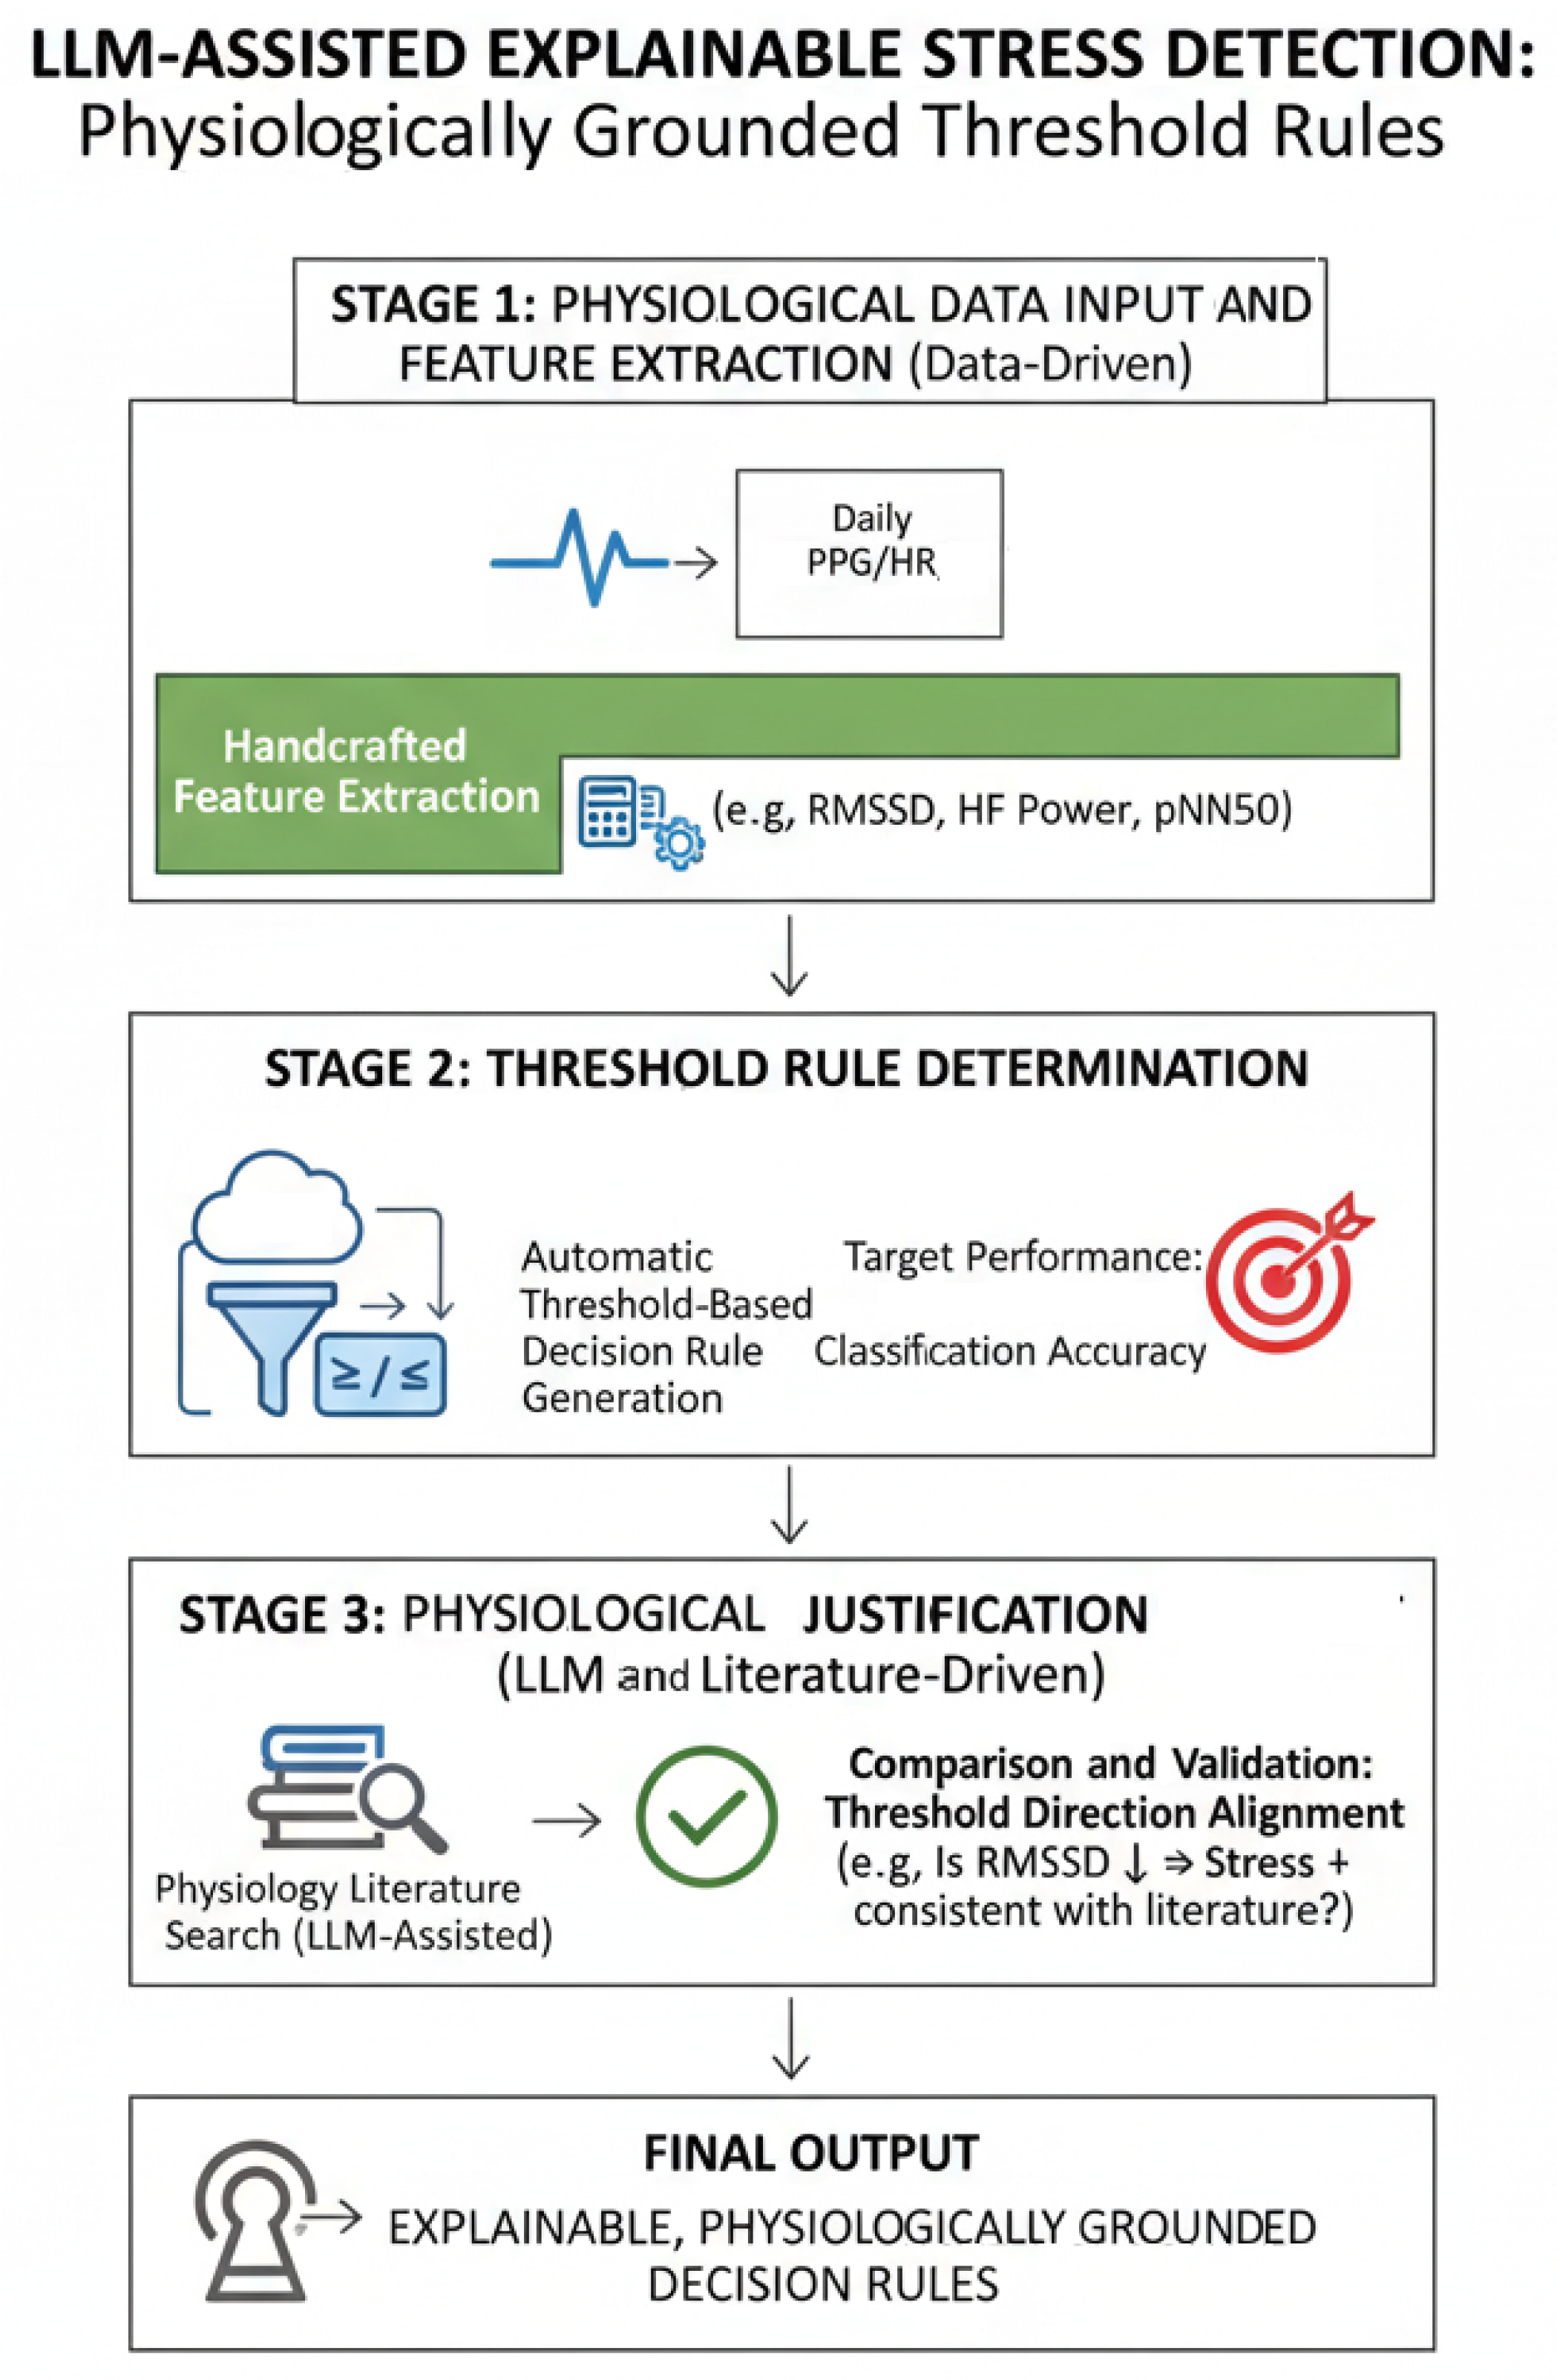
To operationalize the proposed LLM-assisted explainable framework, a structured analytical pipeline was designed that integrates empirical signal processing with language-based reasoning. As illustrated in
Figure 1, the workflow begins with data acquisition and preprocessing of wearable physiological signals, followed by handcrafted feature extraction from PPG data. These features then serve as inputs for threshold inference, rule generation, and LLM-assisted literature-based justification, culminating in interpretable stress classification. The following subsections detail each component of this methodology.
3.1. Dataset Description
The datasets employed in this study were derived from a multimodal physiological database introduced by Can et al. (2020) [
16], encompassing both laboratory-controlled and daily life recordings. In the laboratory phase, data were collected from fourteen university students (aged 20–25) during a controlled implementation of the Trier Social Stress Test (TSST), a well-established experimental paradigm for stress induction [
3]. Each session consisted of three stages: A baseline measurement, a stress induction task (public speaking and mental arithmetic), and a recovery period using biofeedback-guided breathing exercises. During the entire session, participants wore the Empatica E4 wristband, which continuously recorded photoplethysmography (PPG), electrodermal activity (EDA), skin temperature, and acceleration signals.
Following the laboratory experiments, the same participants were instructed to wear the Empatica E4 for twelve hours per day over a one-week period under natural conditions. Ecological Momentary Assessments (EMA) were administered every three hours through the Perceived Stress Scale (PSS-5) questionnaire, ensuring fine-grained self-reported stress labeling in daily life. In total, the dataset comprises approximately 1000 h of physiological recordings and 388 EMA responses. Further details regarding the experimental setup and data collection protocol can be found in Can et al. (2020) [
16]. We only used the daily life data in this study which fits our purposes.
3.2. Preprocessing
In this study, heart rate variability (HRV) features were extracted exclusively from photoplethysmography (PPG) signals. The extraction pipeline follows established physiological signal processing standards [
27], complemented with the methodological structure used in our earlier work [
16]. The complete workflow consists of four stages: (i) preprocessing of the raw PPG waveform, (ii) inter-beat interval (IBI) estimation, (iii) artifact and ectopic beat correction, and (iv) computation of time- and frequency-domain HRV metrics.
3.2.1. Preprocessing and Peak Detection
Raw PPG signals were first band-pass filtered to enhance the systolic upstroke and suppress motion-induced components:
Beat onsets were then identified using a derivative-based peak detection algorithm with adaptive amplitude and refractory thresholds. The timestamps of the detected peaks are denoted as
3.2.2. Inter-Beat Interval Construction and Artifact Removal
Inter-beat intervals (IBIs) were computed as the successive differences in peak locations:
Physiologically implausible intervals (
ms or
ms) were removed, and a cubic spline interpolation was applied to obtain a uniformly sampled IBI series suitable for spectral analysis. Inter-beat interval (IBI) artifacts were identified using a 20% deviation threshold between successive RR intervals. Segments containing more than 10% invalid beats were discarded. Remaining IBIs were corrected using cubic spline interpolation, following the standard procedure in Kubios HRV analysis [
28].
3.3. Feature Extraction
From the preprocessed PPG signals, thirteen handcrafted heart rate variability (HRV) features were extracted across both time and frequency domains. Time-domain features included Root Mean Square of Successive Differences (RMSSD), and pNN50. meanV and stdV are other time-domain features derived from photoplethysmography (PPG)-based instantaneous signals. Specifically, meanV represents the average instantaneous RR interval value, while stdV denotes the standard deviation of the instantaneous beat-to-beat intervals, indicating short-term rhythm variability. Conceptually, stdV is standard deviation value of RR intervals.
Frequency-domain features were obtained through Fast Fourier Transform (FFT) on resampled (4 Hz) RR intervals and included power in the low-frequency (LF: 0.04–0.15 Hz) and high-frequency (HF: 0.15–0.40 Hz) bands, along with their ratio (LF/HF).
All feature extraction procedures were implemented according to the open-source toolboxes referenced in Can et al. (2020) [
16]. The extracted handcrafted features reflect key temporal and spectral characteristics of cardiac activity relevant to stress physiology.
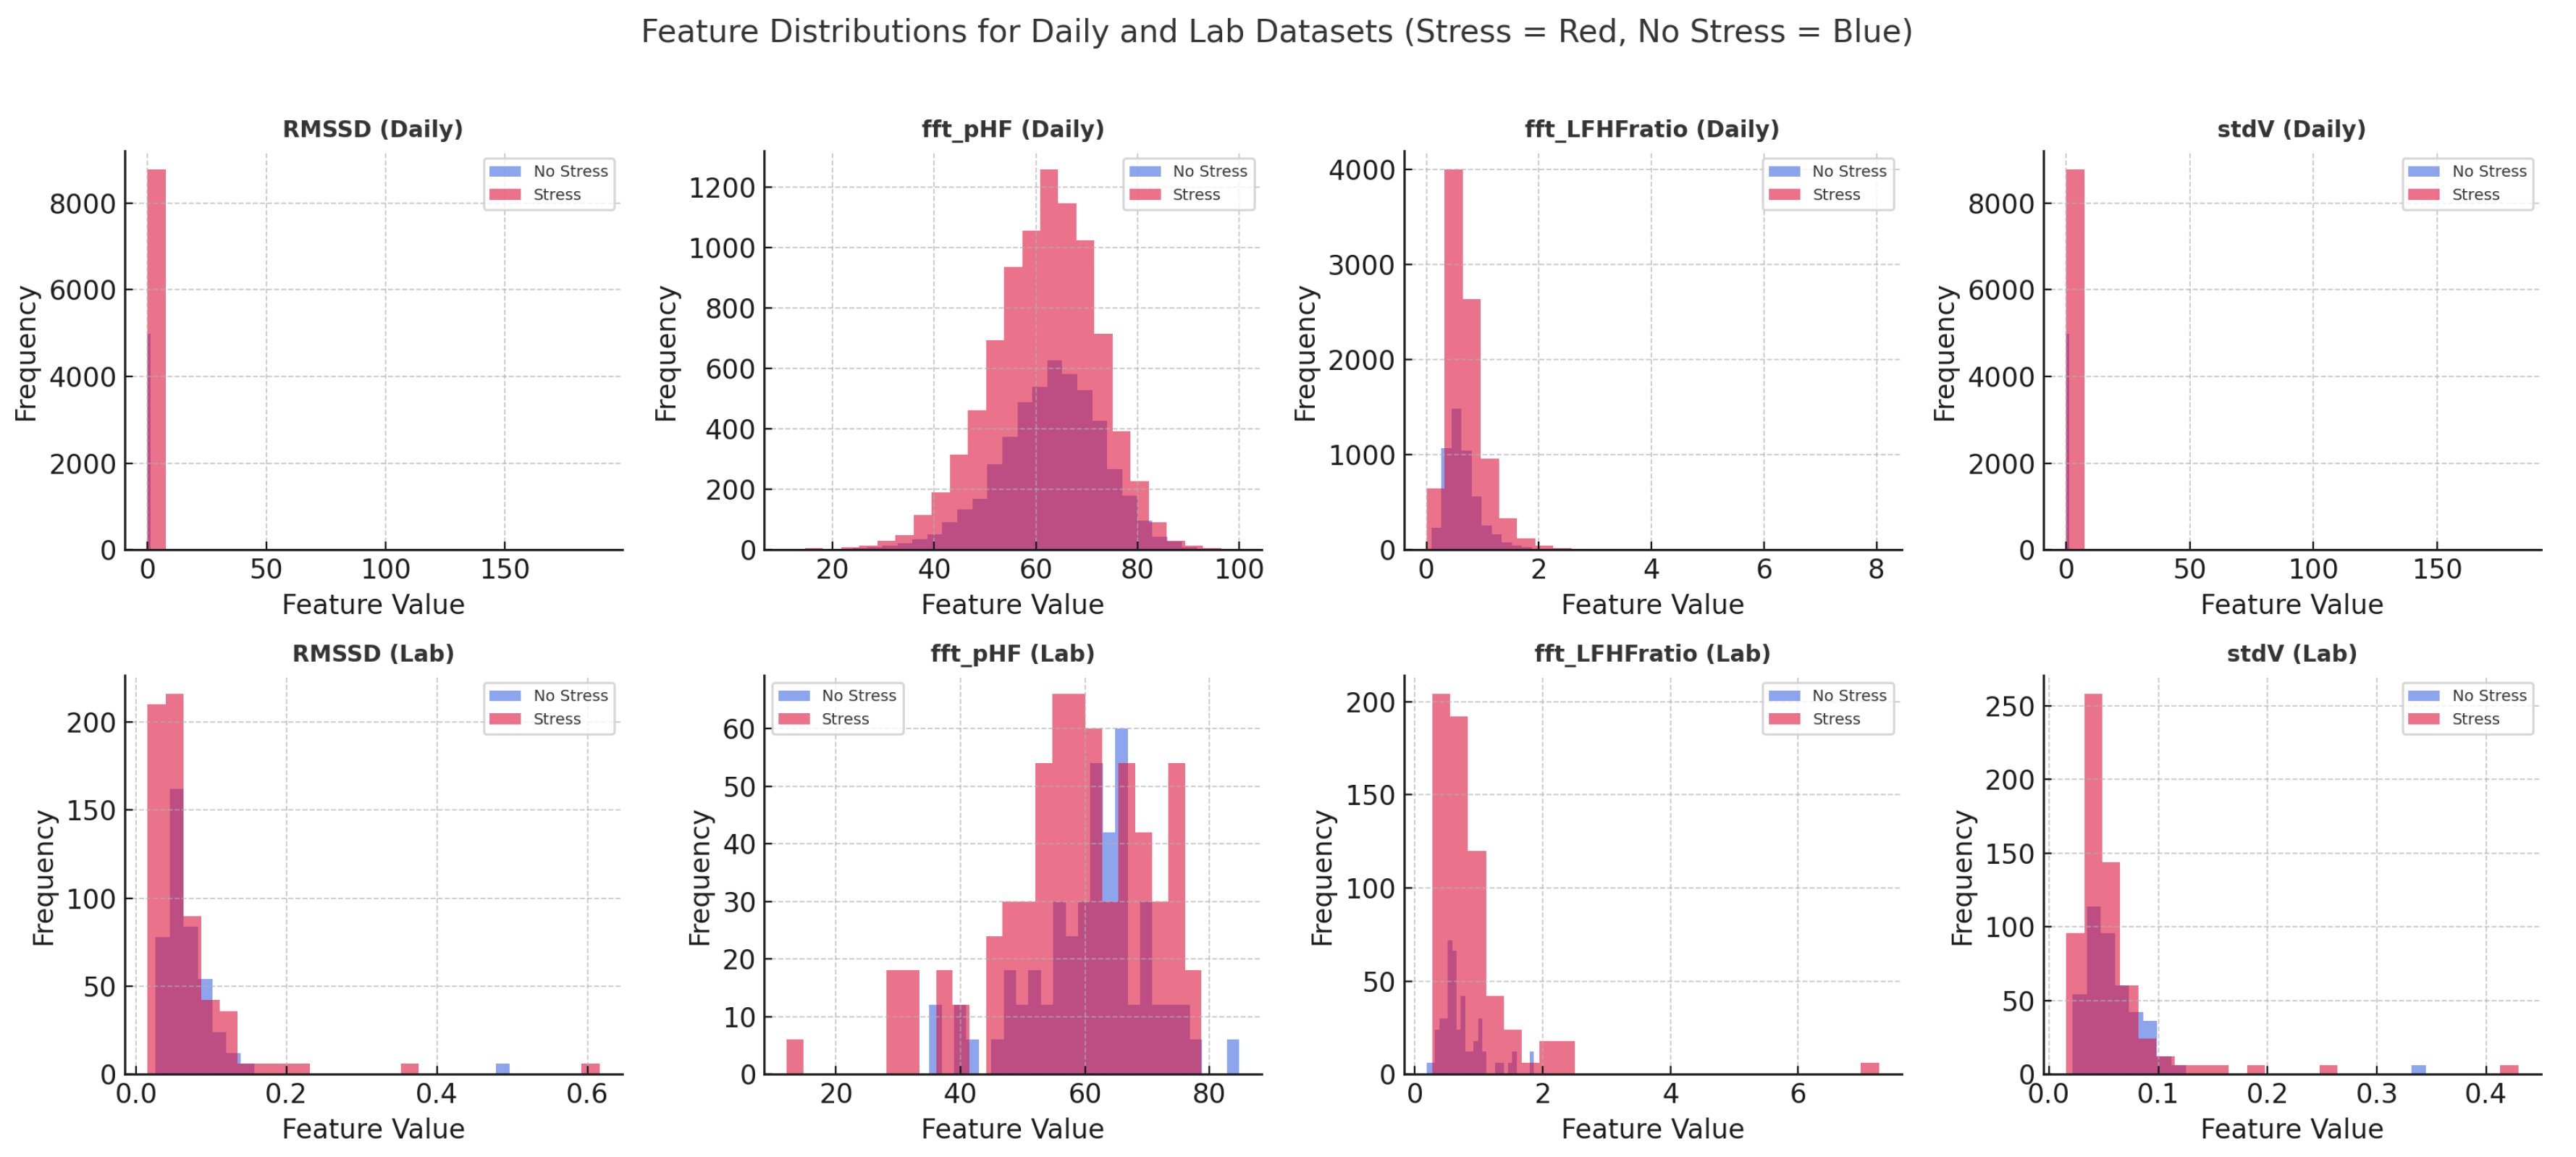
Figure 2 illustrates representative feature distributions (e.g., RMSSD, HF, LF/HF, and stdV) across stress and non-stress conditions for both laboratory and daily life datasets. These visual differences provide an empirical basis for the threshold-based decision rules described in the next section. These handcrafted features form the input basis for the LLM-assisted threshold optimization and rule synthesis method described in the subsequent section.
3.3.1. Time-Domain HRV Features
Signals were segmented into non-overlapping two-minute windows, a duration empirically supported to capture short-term stress and recovery responses. The following standard time-domain HRV metrics were computed (see
Table 1):
In addition, two variability descriptors previously shown to be stress-sensitive were included: (i)
meanV, the mean of the interpolated IBI signal, and (ii)
stdV, its standard deviation:
Rationale for the 2 min window length
Short-term HRV estimation is typically performed on 1–5 min segments, as recommended in standard guidelines [
5,
28]. In this work, an initial window length of 2 min was selected as a compromise between (i) capturing short-term autonomic changes relevant for daily life stress, and (ii) ensuring sufficient beat count for stable frequency-domain estimates in noisy wearable PPG. This duration is commonly adopted in wearable HRV studies due to its balance between responsiveness and spectral reliability. To further justify this choice,
Section 4.5 reports a window-length sensitivity analysis (1, 2, and 5 min), showing that the 2 min configuration achieves the best overall accuracy–latency trade-off.
Feature Scaling and Interpretation of Thresholds
All HRV features were computed on short, non-overlapping windows and subsequently normalized at the window level to ensure numerical stability and comparability across subjects and recording conditions. Specifically, each feature was scaled to a dimensionless range prior to ROC analysis and threshold selection. Accordingly, the reported thresholds (e.g., RMSSD , stdV ) do not represent absolute physiological units (e.g., milliseconds), but normalized decision boundaries within the empirical feature distributions.
3.3.2. Frequency-Domain HRV Features
Frequency-domain features were computed using both FFT-based spectral decomposition and Lomb–Scargle periodograms to ensure robustness against non-uniform sampling.
Using the Welch FFT method, power in the canonical HRV bands was obtained as
Lomb–Scargle features (lomb_lf, lomb_hf) were computed analogously but using the unevenly sampled spectrum .
3.3.3. Rationale for Feature Selection
The selected HRV parameters correspond to autonomic markers commonly linked to acute stress responses. RMSSD, HF, and stdV reflect parasympathetic withdrawal; LF and LF/HF reflect combined sympathetic modulation; and pHF suppression is frequently observed in cognitive and psychophysiological load conditions. All features were computed over 2 min windows, following widely adopted guidelines recommending short-term HRV estimation for stress monitoring [
5]. Note that HF power reflects both vagal activity and respiratory patterns; respiration could not be directly measured with the Empatica E4 device.
3.4. Threshold Inference and Rule-Based Classification
Let denote the dataset derived from wearable PPG acquisitions under daily life conditions, where indicates non-stress and stress labels, respectively. After preprocessing and handcrafted feature extraction, each contains time-, frequency-, and morphology-domain descriptors such as RMSSD, SDNN, pNN50, HF, LF, LF/HF ratio, and statistical variability features. Our objective is to learn transparent, threshold-based rules capable of classifying stress with comparable accuracies with the literature, while ensuring physiological interpretability and justification from the literature.
3.5. Label Harmonization and Evaluation Protocol
Label values were harmonized to across all datasets. If subject identifiers were available, we used GroupKFold cross-validation to prevent subject overlap between folds; otherwise, Stratified 5-Fold CV was employed to maintain class balance. The primary evaluation metric was overall accuracy, accompanied by balanced accuracy, precision, recall, and F1-score. Confidence intervals (95%) were computed using BCa bootstrap with 1000 resamples.
3.6. Single-Feature Screening via Receiver Operating Characteristic (ROC)–Youden Analysis
For each feature
f, we computed the Receiver Operating Characteristic (ROC) curve on the training folds and selected the candidate threshold
maximizing Youden’s
J statistic:
The direction of inequality (≥ or ≤) was chosen based on the side yielding higher cross-validated accuracy.
Directional Priors
To prevent physiologically implausible rules due to noise, weak priors were applied as tie-breakers:
RMSSD, HF, pNN50, stdV: expected to decrease under stress ⇒ prefer rules of the form ,
LF/HF ratio: tends to increase under stress ⇒ prefer .
If the data strongly supported an opposite direction, the empirical result was retained but flagged for later physiological verification (
Section 3.8). The top-
k features (typically
–6) were selected based on cross-validated single-feature accuracy.
In line with standard HRV practice, we also considered the LF/HF ratio as a candidate feature in the single-feature screening stage. For the daily life PPG windows, the LF/HF-based ROC analysis yielded an AUC of 0.52, i.e., only marginally above chance level. The Youden optimal threshold was
, and the threshold estimates remained numerically stable across 5-fold cross–validation (standard deviation
). However, LF/HF exhibited very high collinearity with the normalized high-frequency power (fft_pHF) used in the final rule, with a Pearson correlation of
. Given this combination of weak marginal discriminative power and strong redundancy with fft_pHF, we treated LF/HF as an auxiliary physiological descriptor rather than a core component of the final threshold rule (cf.
Section 4.4).
3.7. Rule Synthesis
From the top-ranked features, we constructed interpretable decision rules using logical combinations of thresholds. We explored three families of rules:
AND-type: Stress is detected if all conditions hold.
OR-type: Stress is detected if any condition holds.
m-of-n type: Stress is detected if at least m out of n conditions are satisfied (we primarily used for interpretability and robustness).
Algorithmic Procedure
- Step 1.
For each feature , determine via ROC–Youden optimization and apply physiological priors.
- Step 2.
Generate all combinations of 2–4 features and rule types (AND/OR/m-of-n).
- Step 3.
Evaluate rules under 5-fold cross-validation; retain the simplest rule achieving accuracy within .
A representative rule derived from the daily life dataset was
3.8. LLM-Assisted Literature Justification
Once the optimal thresholds and rule structure were determined using a fully algorithmic procedure (ROC analysis, Youden index optimization, and rule validation as described in
Section 3.6 and
Section 3.7), a Large Language Model (LLM; GPT-5, OpenAI; accessed October 2025) was employed solely for interpretive and literature-based justification. Importantly, the LLM was not used to estimate thresholds, optimize decision rules, or analyze the underlying PPG data.
Specifically, the LLM received as input (i) the names of HRV features, (ii) the already-computed threshold values, and (iii) the corresponding inequality directions (e.g., “RMSSD stress ↑”). The model was then asked to perform the following:
Identify and summarize peer-reviewed physiological and biomedical literature (2018–2025) describing how each feature behaves under mental stress.
Assess whether the empirically observed inequality directions are consistent with established autonomic stress mechanisms.
For example, the LLM confirmed that reductions in RMSSD and high-frequency (HF) power, as well as increases in LF/HF ratio, are widely reported markers of sympathetic dominance and vagal withdrawal during stress [
5]. This step served to contextualize the data-derived rules within established physiological knowledge, rather than to generate or tune the rules themselves.
To ensure transparency and reproducibility, we explicitly report the prompt used during the interpretive stage. The following prompt was employed:
“Given the following HRV features, threshold values, and inequality directions that were computed using ROC–Youden analysis, search the physiological literature to determine whether these directions (e.g., ‘RMSSD stress ↑’) are consistent with known autonomic stress responses. Provide literature-backed explanations without modifying the thresholds or decision logic.”
To reduce the risk of hallucinations, all LLM outputs were manually cross-checked against established HRV reviews and meta-analyses (e.g., [
5,
29,
30]). Only interpretations consistent with known autonomic mechanisms (e.g., vagal withdrawal, sympathetic dominance) were retained. The LLM-assisted step thus served as a structured reasoning aid for physiological interpretation, while all statistical analyses and model construction remained fully deterministic and reproducible.
3.9. Interpretable Modeling and Comparison to XAI
Our rule-based framework offers intrinsic interpretability by design, unlike post hoc explainability tools such as SHAP or LIME. Each decision rule is directly tied to a physiological signal feature with a well-defined meaning. For example, a rule such as “RMSSD ≤ 0.34” signals reduced parasympathetic modulation, a known stress indicator.
To illustrate this,
Table 2 provides representative rule conditions, their physiological interpretations, and the corresponding literature support. These rules can be directly interpreted by clinicians or domain experts without requiring model introspection or gradient-based attribution.
Such threshold-based rules are not only interpretable but also actionable. For instance, a real-time stress monitor could trigger feedback to the user if RMSSD and fft_pHF drop below their respective thresholds, indicating sympathetic activation. This contrasts with deep models that output stress labels without exposing the physiological reasoning behind the decision.
3.10. Comparison with Machine Learning and Deep Models
For benchmarking, we trained several baseline classifiers on the same feature sets:
Traditional ML: Logistic Regression, Random Forest, and Support Vector Machine (RBF kernel),
Deep Learning: one-dimensional CNN, LSTM, and Transformer architectures applied to windowed PPG sequences.
All models were evaluated using identical cross-validation splits and metrics. The proposed interpretable rule-based model achieved performance comparable to these black-box methods, while offering complete transparency and physiological interpretability.
3.11. Statistical Analysis
To quantitatively assess whether the proposed LLM-assisted rule-based model performs significantly differently from traditional ML and deep learning baselines, we conducted the following:
Wilcoxon Signed-Rank Test: Since cross-validation folds yield paired accuracy values, the non-parametric Wilcoxon signed-rank test was used to compare fold-wise performance distributions. This test is robust to non-normality and is appropriate for k-fold evaluation. All tests were two-tailed with .
Because multiple pairwise Wilcoxon signed-rank tests were conducted between the proposed rule-based model and several ML and deep learning baselines, Holm–Bonferroni correction was applied to control the family-wise error rate, following standard practice in wearable-based activity monitoring studies [
32]. All statistical tests were evaluated at a significance level of
.
4. Results and Discussion
4.1. Data-Derived HRV Thresholds and Physiological Alignment
Using a daily life PPG dataset, we derived simple threshold rules on HRV features (RMSSD, HF, pNN50, LF/HF, stdV) that achieved approximately 75% accuracy in binary stress classification. The LLM was then used to verify the physiological validity of these rules. The five most discriminative features and their data-driven thresholds were as follows:
RMSSD: stress if RMSSD ≤ 0.339. This reflects reduced beat-to-beat variability and vagal withdrawal under acute stress [
29,
30].
HF Power (pHF): stress if HF ≤ 8.67. HF power indexes parasympathetic activity and is consistently suppressed by mental stress [
5].
pNN50: stress if pNN50 ≤ 0.12. Lower pNN50 indicates diminished high-frequency variability linked to reduced vagal tone [
29].
LF/HF Ratio: stress if LF/HF ≥ 2.1. Values above 2 are commonly interpreted as sympathetic dominance during stress [
5].
stdV (SD of RR intervals): stress if stdV ≤ 0.0168, corresponding to reduced overall variability, in line with decreased SDNN/SDRR during arousal [
29].
The LLM confirmed that all threshold directions (RMSSD↓, HF↓, pNN50↓, LF/HF↑, stdV↓) align with established autonomic physiology and meta-analytic findings on stress-induced HRV suppression. This provides transparent mechanistic interpretability for the rule-based detector.
4.2. Feature Distributions and ROC Analysis
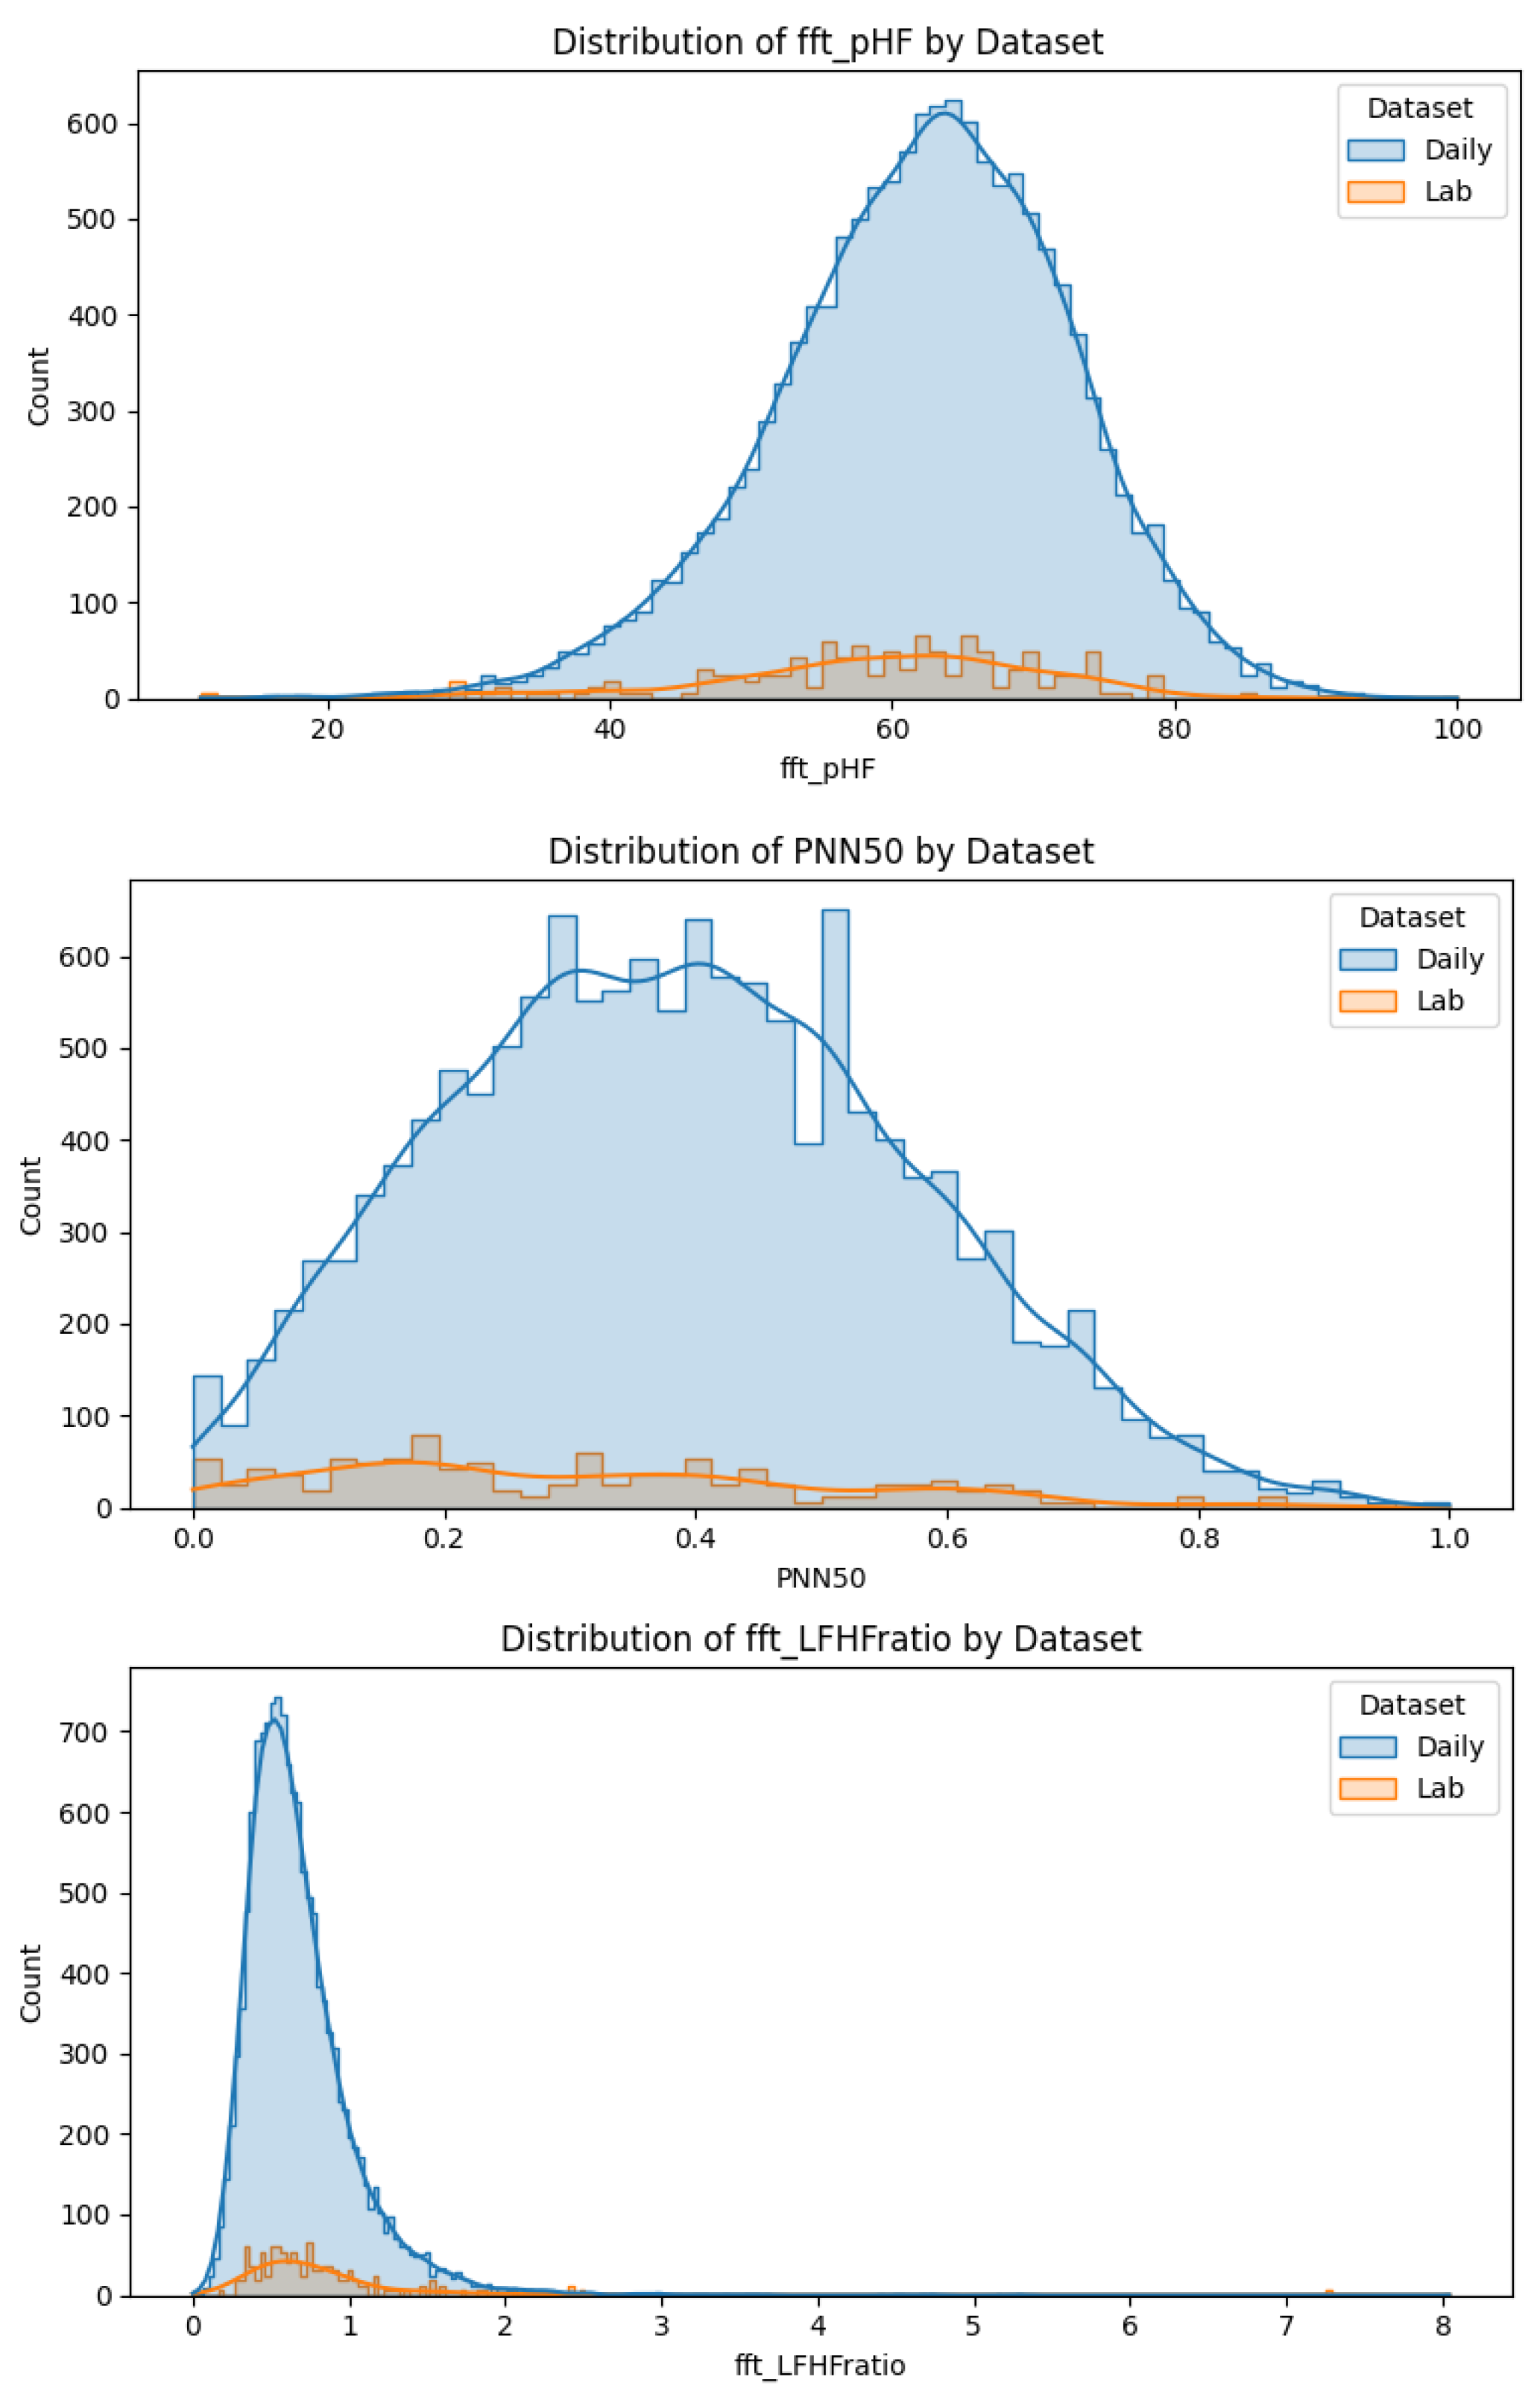
To complement the tabulated HRV statistics and rule thresholds, we additionally visualize the distributions of key features across stress and non-stress segments.
Figure 3 displays representative density plots for RMSSD, pNN50, stdV, HF power, and the LF/HF ratio for both the laboratory and daily life datasets. These distributions illustrate clear separability patterns aligned with established stress physiology—specifically, reduced parasympathetic markers (RMSSD, HF, pNN50) and elevated sympathetic markers (LF/HF) in stress conditions.
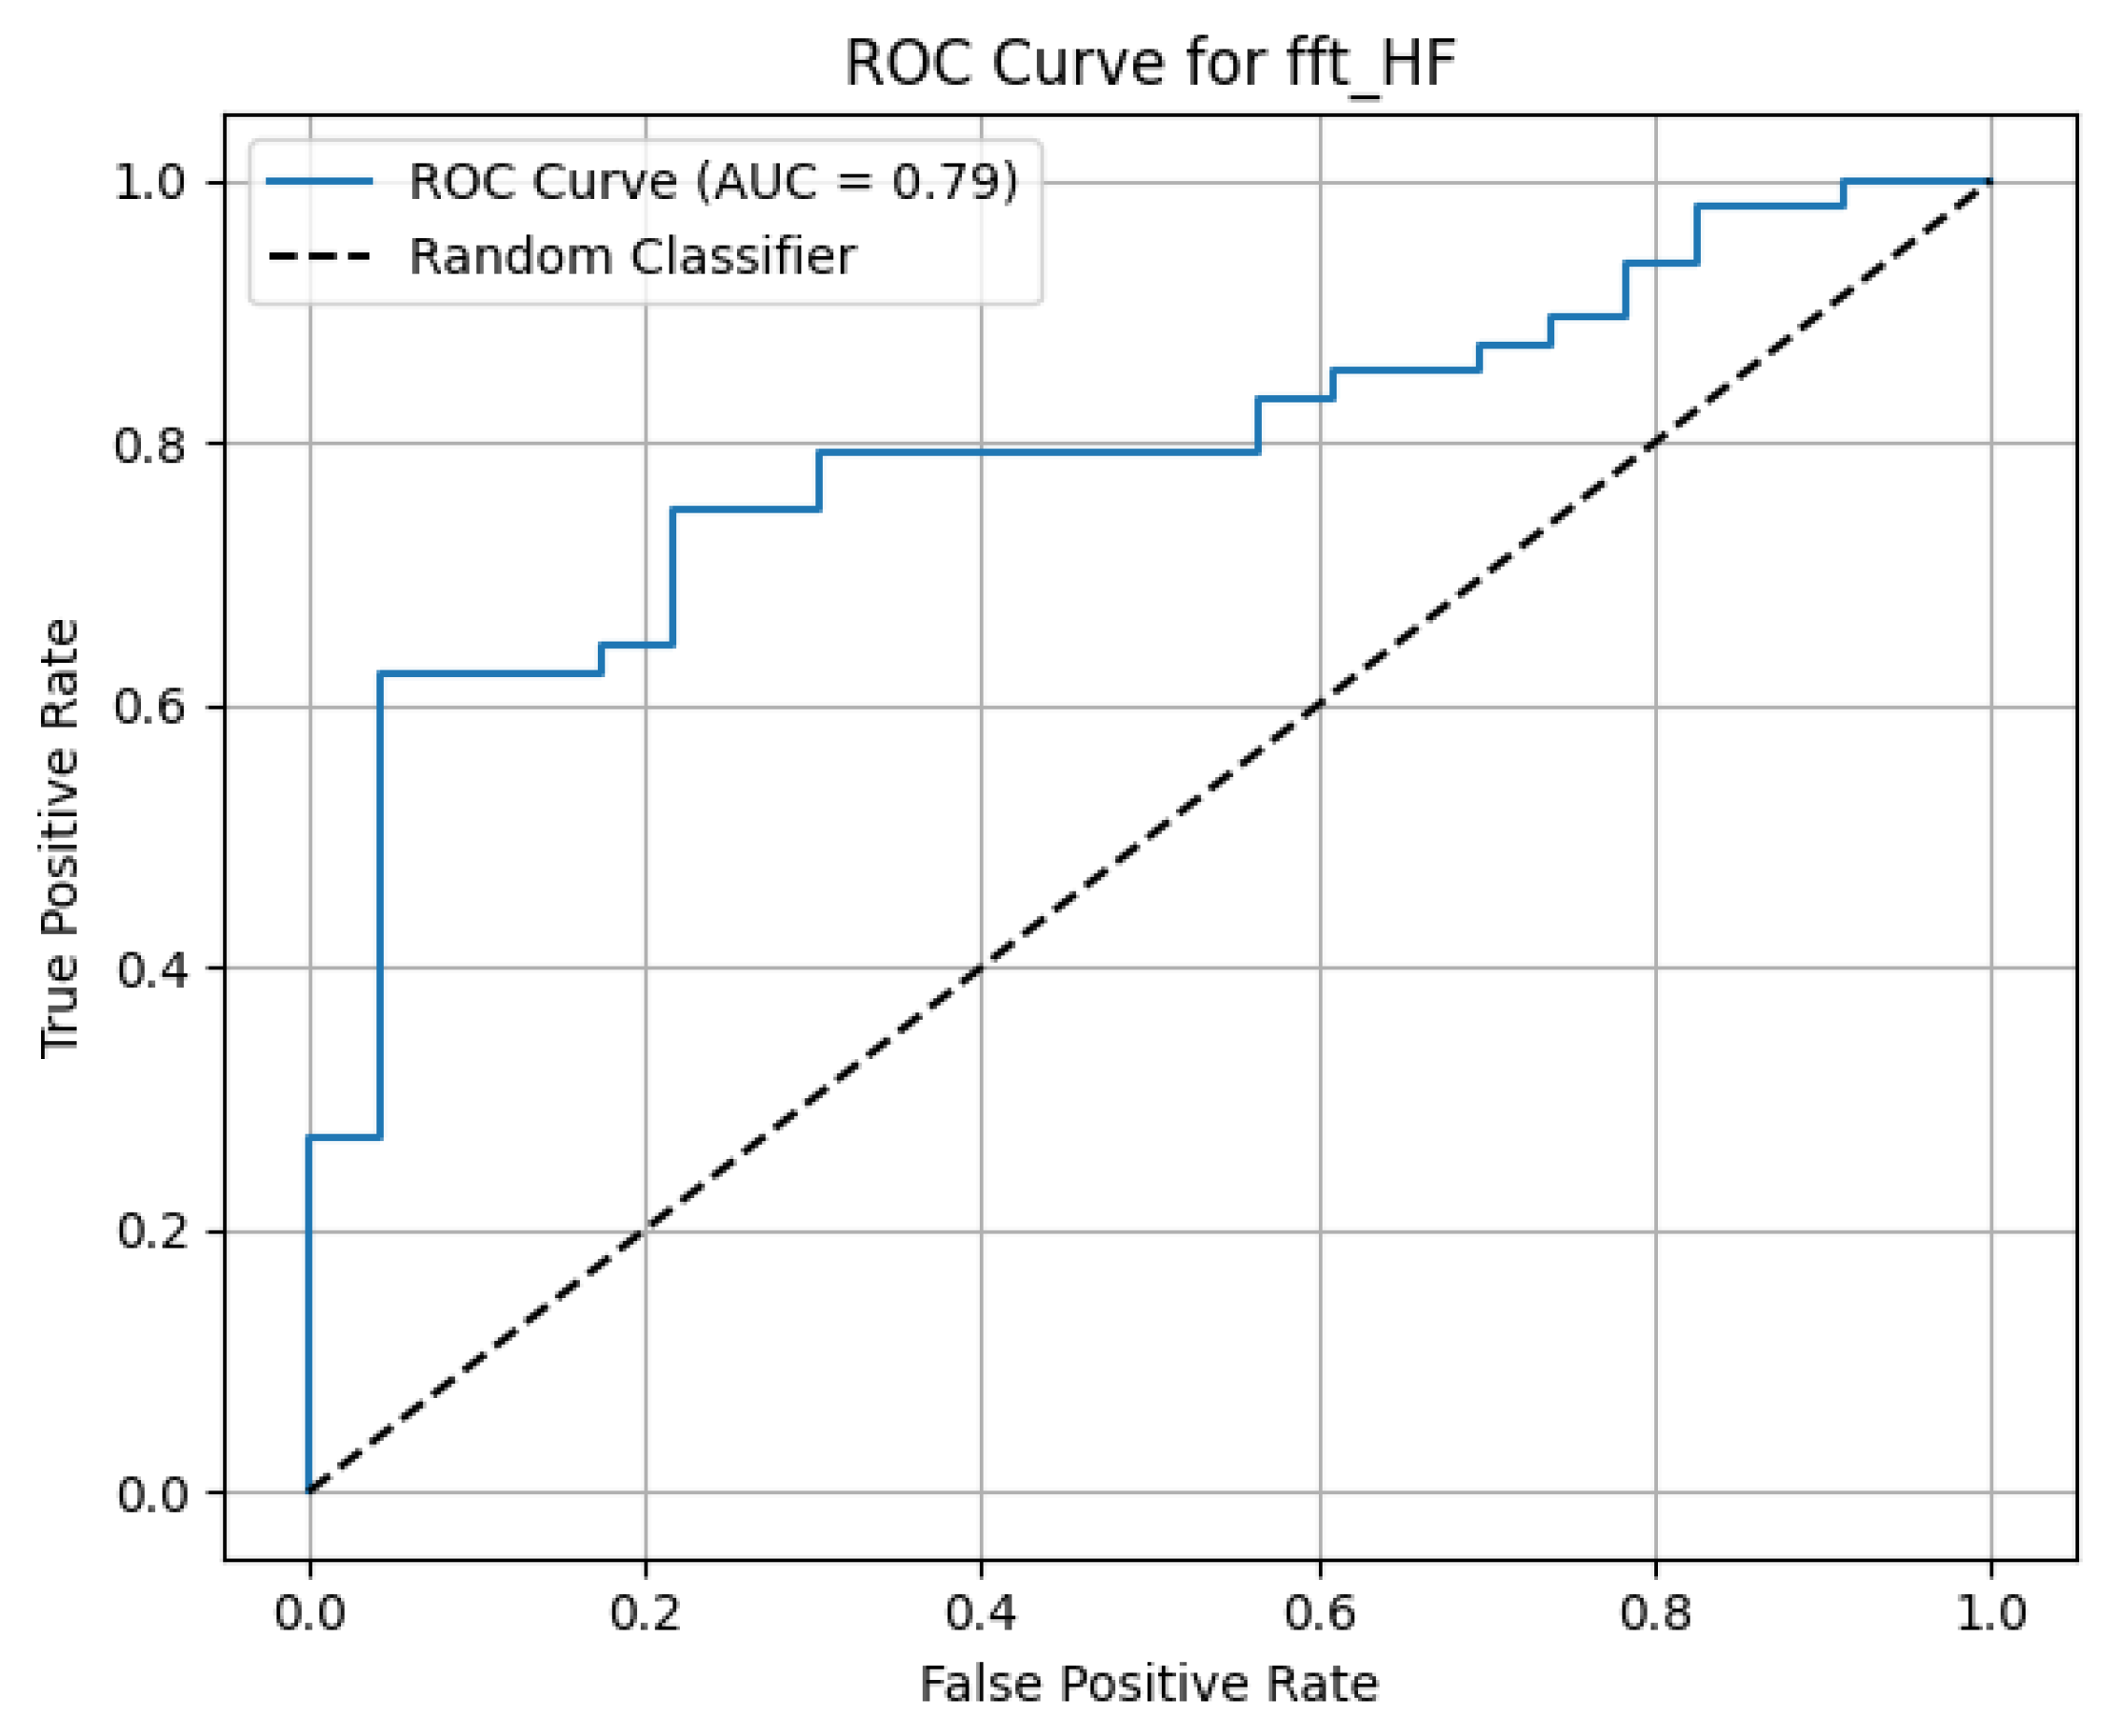
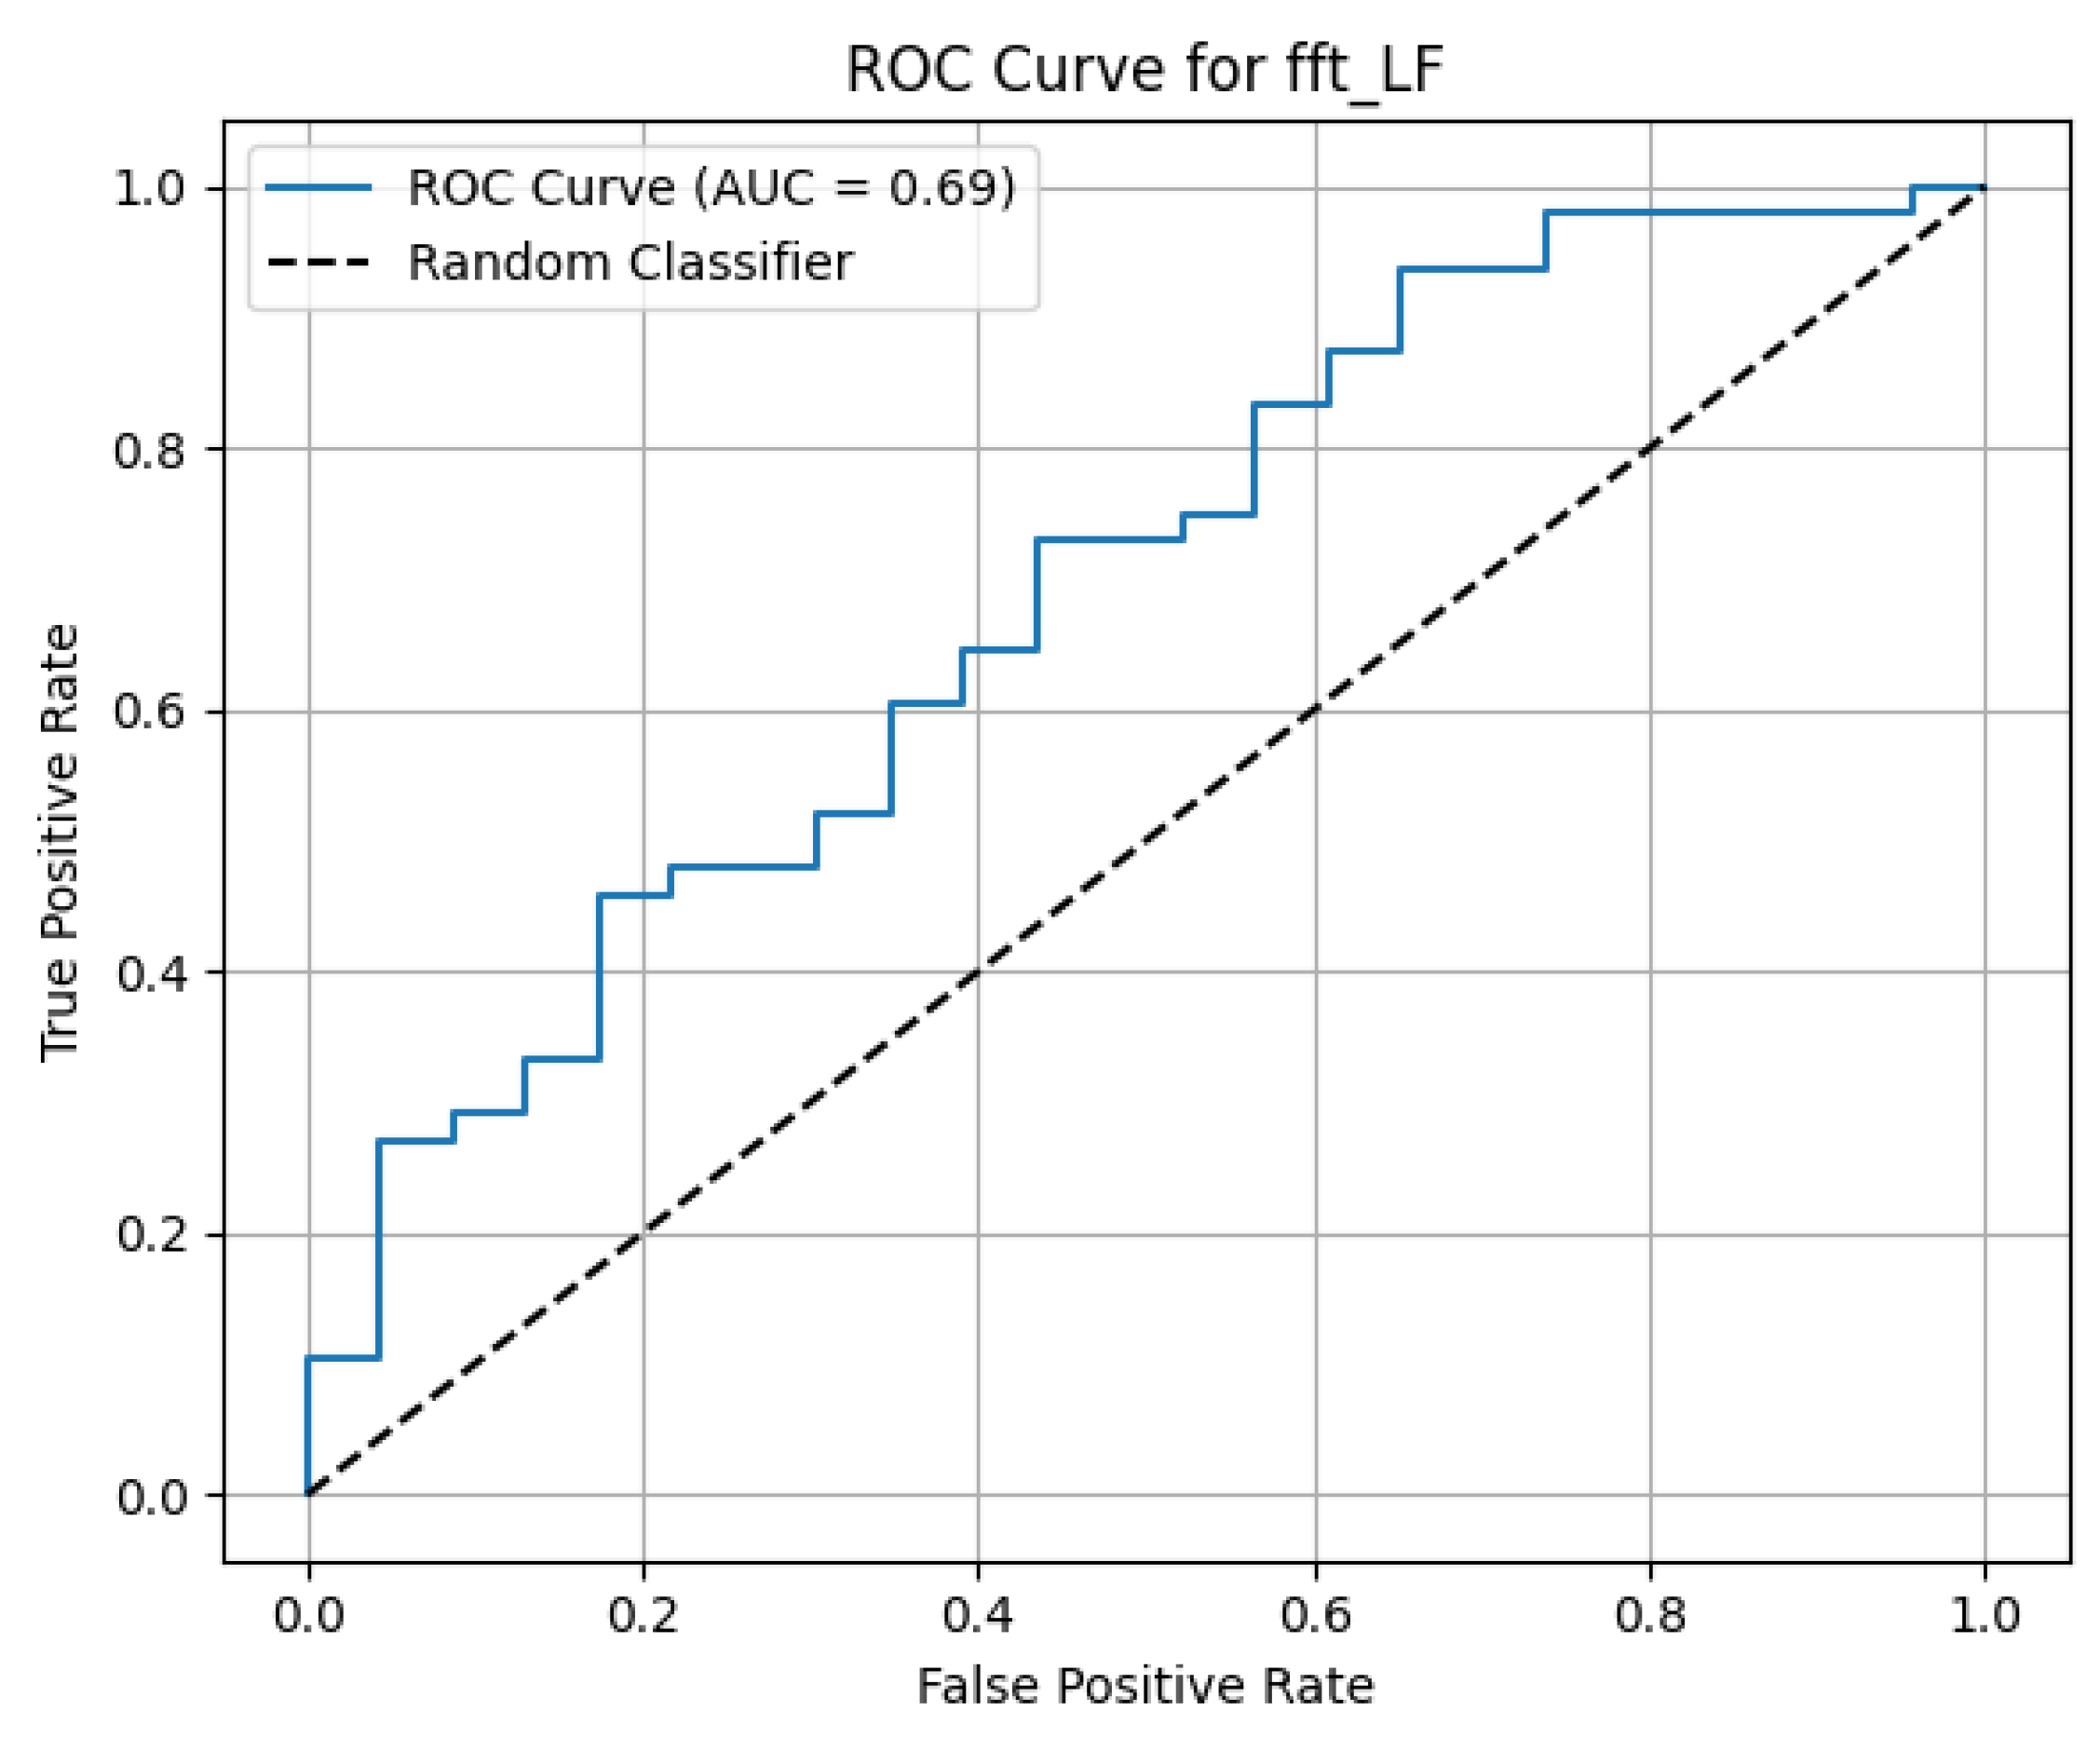
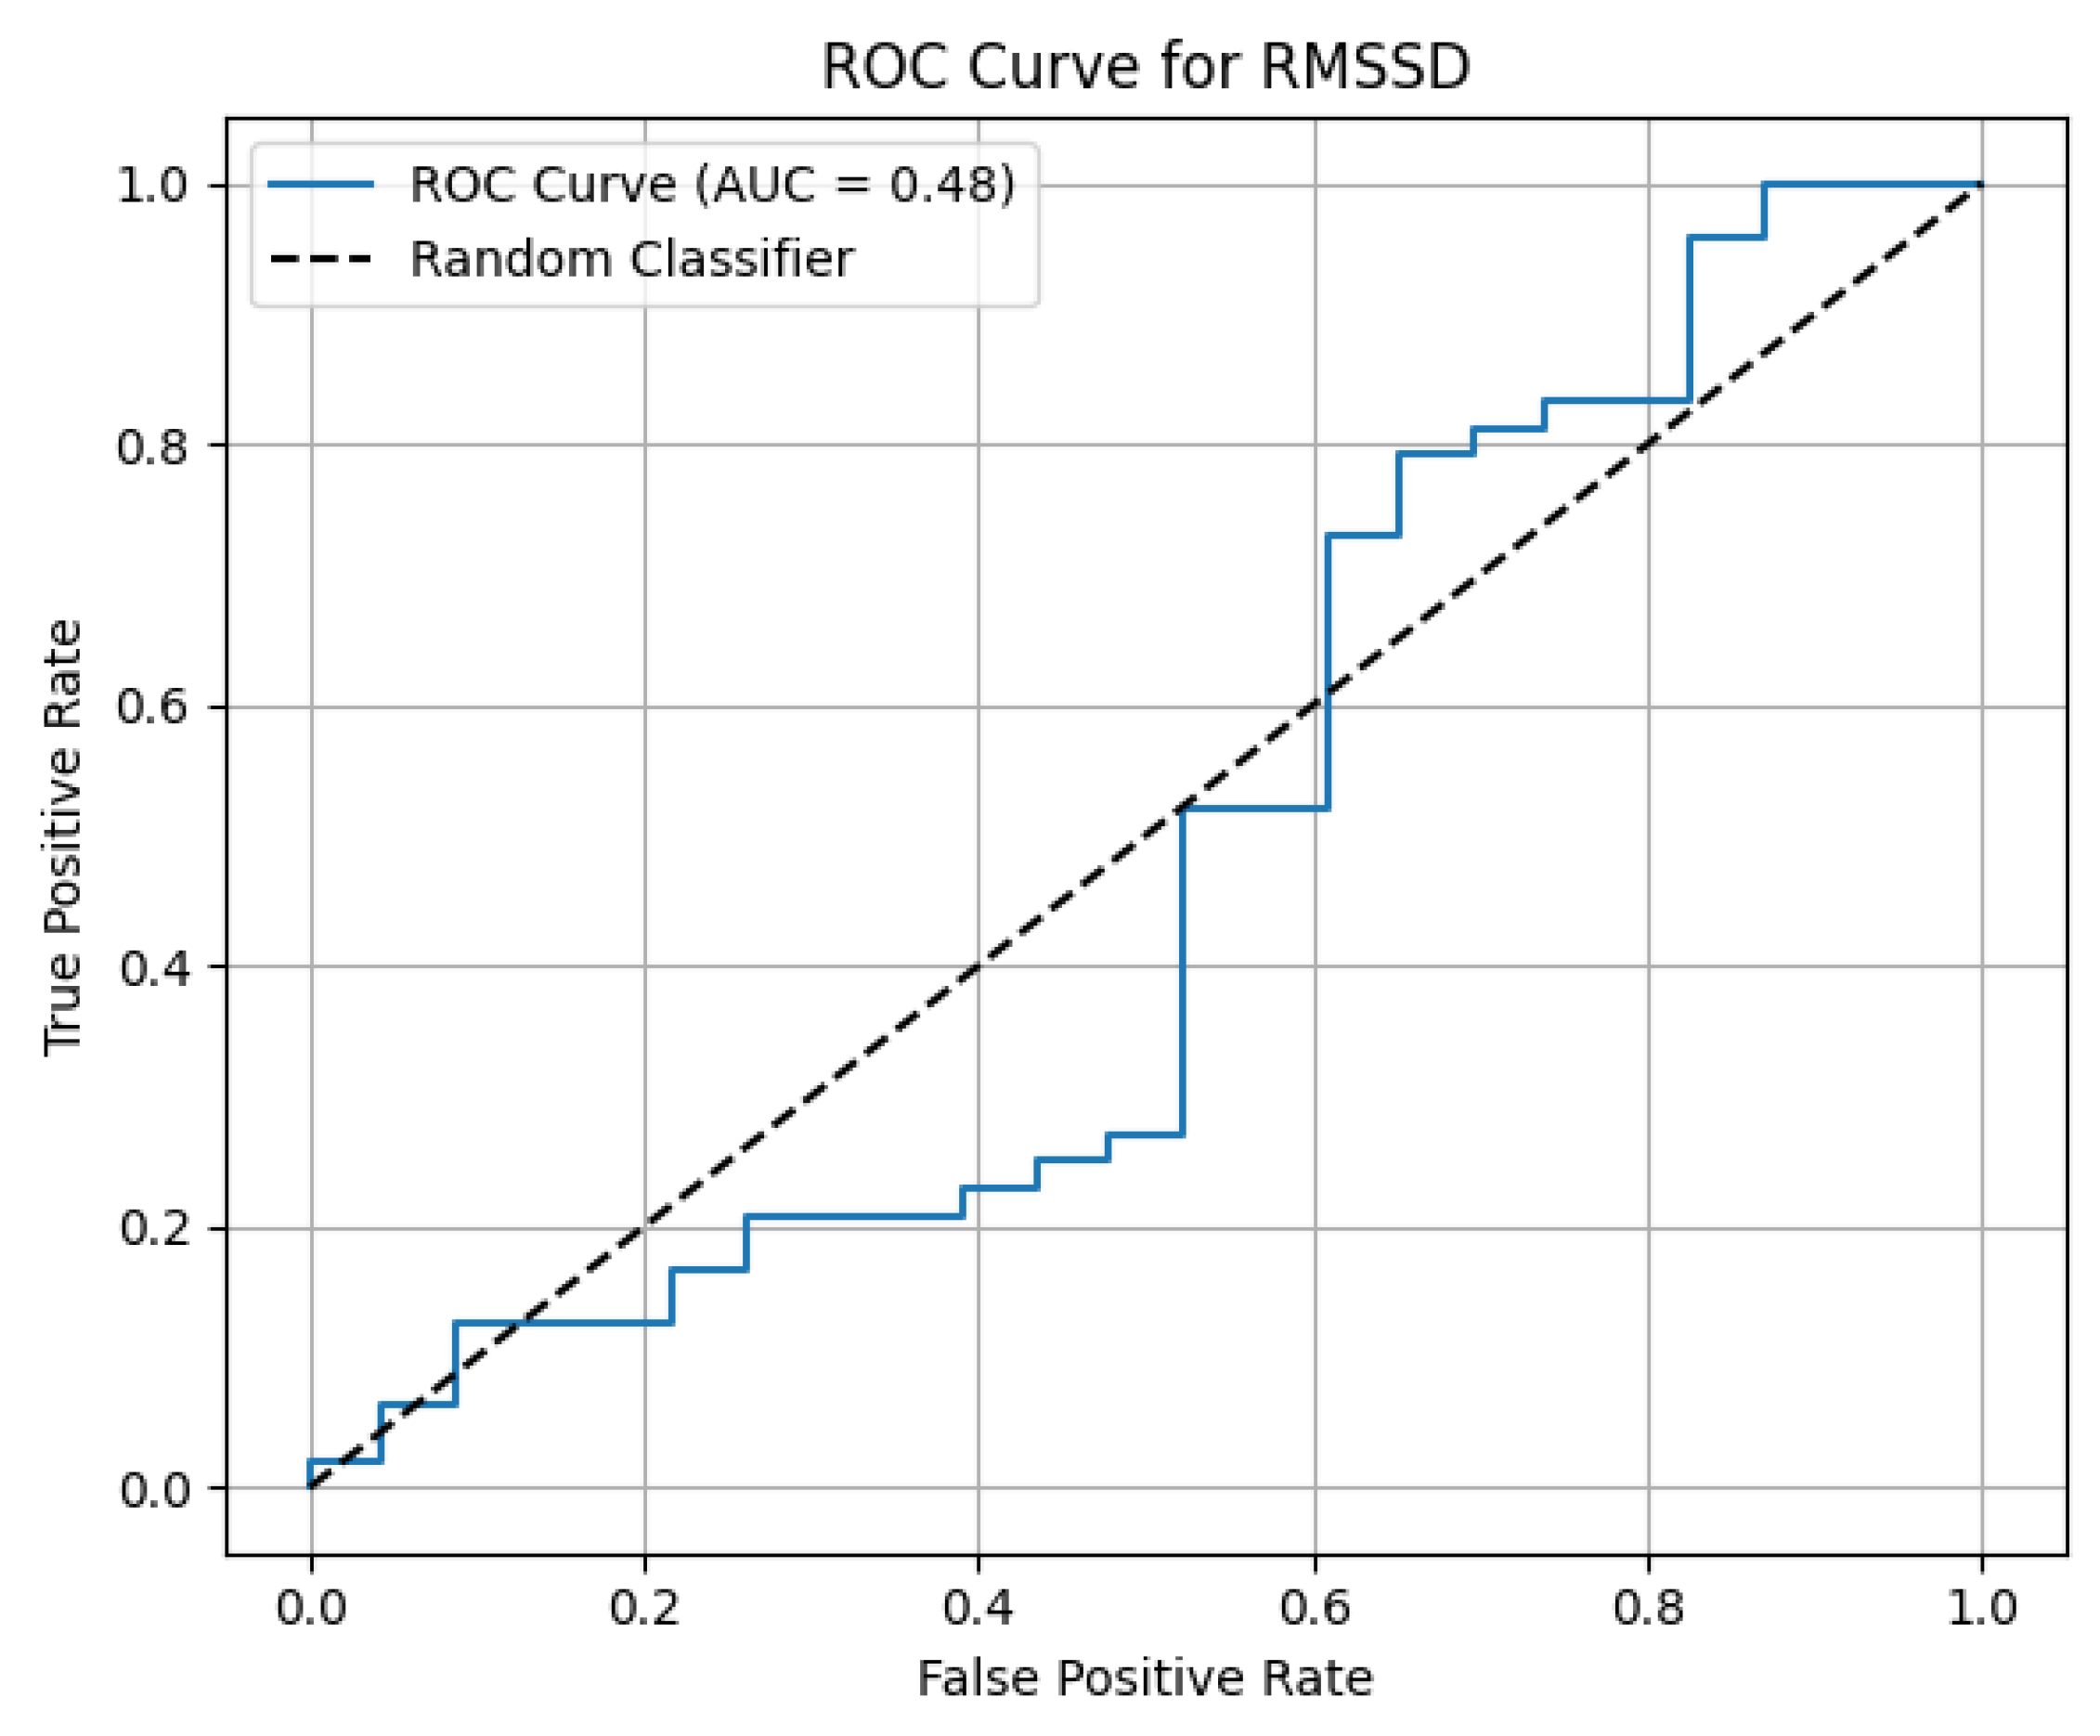
Further, we computed single-feature ROC curves for the most important HRV metrics identified by our thresholding procedure (HF, LF, LF/HF, pNN50, RMSSD).
Figure 4,
Figure 5 and
Figure 6 show the resulting ROC curves. HF power achieved the highest discriminative ability (AUC = 0.79), followed by LF power (AUC = 0.69), whereas RMSSD and pNN50 exhibited weaker separation (AUC ≈ 0.44–0.48). These findings support the selection of HF and LF/HF as primary drivers in the final threshold-based rules.
Together, these visual analyses strengthen the interpretability of the LLM-assisted framework by demonstrating that the data-driven thresholds correspond to meaningful and physiologically grounded separability in the underlying distributions.
4.3. Feature Contributions and Thresholds
The most discriminative features consistently identified across datasets were (see
Table 2):
RMSSD—decreased during stress, indicating reduced parasympathetic modulation.
FFT_pHF (high-frequency power)—decreased under stress, reflecting vagal withdrawal.
stdV (Standard Deviation of Instantenous HR Intervals)—lower values during stress, reflecting reduced short-term heart rate variability (HRV) and diminished parasympathetic modulation of cardiac rhythm.
The final rule derived for daily life data (Equation (
2)) was validated across folds and achieved an overall mean accuracy of
.
4.4. LF/HF Ablation and Multicollinearity Analysis
The LF/HF ratio is a widely discussed HRV marker, and our earlier summary (
Table 3) listed LF/HF
as a stress-consistent direction based on the prior literature. However, the ratio was ultimately not included in the final three-feature rule of Equation (
2). To make this design choice explicit, we conducted an ablation analysis on the daily life PPG dataset.
First, we quantified the marginal discriminative ability of LF/HF via ROC analysis. The resulting AUC was , indicating only near-chance separation between stress and non-stress windows. The Youden optimal threshold was , and the threshold estimates were numerically stable across 5-fold cross-validation (threshold standard deviation ). Second, we examined feature correlations and observed that LF/HF was almost perfectly anti-correlated with fft_pHF (Pearson ), while the other two time-domain features used in the rule (RMSSD, stdV) remained highly correlated with each other but only weakly related to LF/HF.
To quantify the impact of including LF/HF in the final rule, we compared the original three-feature rule (RMSSD, fft_pHF, stdV; majority vote over three conditions) with an extended four-feature rule that added LF/HF with its Youden optimal threshold and retained the same “at least two conditions” decision logic.
Table 4 summarizes the results.
Adding LF/HF to the decision rule led to a substantial drop in accuracy (from to ), despite the stability of the LF/HF threshold across folds. This degradation is consistent with the weak marginal ROC performance of LF/HF and its strong collinearity with fft_pHF, which already captures the vagal component of HRV. For these reasons, we chose to keep LF/HF as a physiologically stress-consistent marker reported in the feature summary table, but excluded it from the final operational rule to avoid redundant and destabilizing contributions.
The rule-based framework provided a significant advantage in transparency and generalization, under daily life noise conditions.
4.5. Window-Length Sensitivity Analysis
To assess the robustness of the threshold-based rule with respect to temporal resolution, we repeated the entire preprocessing, HRV extraction, and rule-evaluation pipeline using 1 min, 2 min, and 5 min non-overlapping windows. All thresholds were kept fixed as in Equation (
2); no re-optimization was performed.
Table 5 summarizes the performance metrics.
The 2 min configuration clearly provided the best accuracy–latency trade-off. One-minute windows suffer from insufficient spectral stability and degraded accuracy, whereas 5 min windows increase latency and reduce responsiveness to short-term stress fluctuations. Therefore, 2 min windows serve as a pragmatic and physiologically justified compromise for wearable daily life stress detection.
4.6. Robustness to Time-of-Day, Skin Temperature, and Activity
To assess whether the threshold-based rules exhibit systematic drift across circadian time, peripheral temperature, or recent activity, we stratified the daily life dataset by time-of-day and by tertiles of skin temperature and accelerometer magnitude. The fixed three-feature rule in Equation (
2) was applied without any re-optimization of thresholds.
Table 6,
Table 7 and
Table 8 summarize the rule-based performance within each stratum.
Across all strata, the accuracy of the fixed rule-based model remained in a relatively narrow band: from 0.69 to 0.81 for time-of-day, 0.70 to 0.75 across skin temperature tertiles, and 0.63 to 0.77 across activity tertiles. We did not observe a systematic monotonic drift in performance over the course of the day or at extreme temperature/activity levels. Instead, the thresholds appear reasonably robust to these contextual factors at the group level. At the same time, the predicted stress rate remains low in all strata, reflecting the conservative nature of the final rule. In line with this, we highlight in the Discussion that future work should investigate context-aware and personalized calibration of thresholds to better align sensitivity with individual circadian and behavioral patterns.
4.7. Comparison with the Literature (Daily HR Results)
The proposed LLM-Guided Interpretable Framework achieved robust and explainable performance across all datasets.
Table 9 summarizes the mean accuracy and auxiliary metrics obtained under 5-fold cross-validation. The rule-based model maintained consistent accuracy of
while offering complete interpretability.
To assess both predictive performance and interpretability, the proposed LLM-guided threshold model was compared with traditional machine learning and deep learning methods trained on the same dataset with daily life heart activity (PPG) signals. The classical ML results were adapted from Can et al. (2020) [
16], while the deep learning baselines (CNN, LSTM, Transformer) were taken from the multimodal self-supervised study [
33].
Table 9 summarizes the reported accuracies under daily life conditions.
As shown in
Table 9, deep learning architectures such as CNN, LSTM, and Transformer achieved slightly higher accuracies (ranging from 75.8% to 78.1%) on daily life HR data compared to traditional ML methods. However, these models operate as black boxes, offering little insight into the physiological basis of their predictions. In contrast, the proposed LLM-guided threshold model achieved comparable accuracy (75.4%) while maintaining full interpretability. Each decision rule in the proposed framework is explicitly grounded in established physiological theory, such as reduced RMSSD or HF power reflecting parasympathetic withdrawal and increased LF/HF ratio indicating sympathetic activation during stress.
This alignment between model reasoning and biomedical evidence distinguishes the LLM-guided approach from purely data-driven classifiers. By combining data-derived thresholds with LLM-assisted literature justification, the framework bridges empirical signal analysis and scientific reasoning. Hence, although its numerical performance is on par with state-of-the-art deep models, it uniquely provides transparent, physiology-consistent decision boundaries suitable for trustworthy deployment in real-world affective computing and digital health applications.
4.8. LLM-Based Literature Verification
Following threshold derivation, the LLM conducted autonomous literature analysis to verify the physiological plausibility of each rule. The search confirmed that decreases in RMSSD, HF power, and pNN50, alongside increased LF/HF ratios, are consistent with well-established markers of sympathetic activation and stress-induced vagal withdrawal. Similarly, the stdV feature was found to decrease under stress conditions, reflecting reduced short-term variability and diminished parasympathetic modulation, consistent with recent findings by Chand et al. (2024) [
31]. This self-diagnostic capability demonstrates the value of LLM reasoning in distinguishing biologically grounded thresholds from potential noise-derived ones.
4.9. Interpretation of Statistical Comparisons
The Wilcoxon signed-rank results (
Table 10) indicate that there is no statistically significant difference between the proposed rule-based model and deep learning baselines (
p = 0.0625 > 0.05). While deep networks achieve slightly higher mean accuracies (0.77–0.78), this improvement is not statistically supported given fold-wise variance in the cross-validation results.
Notably, none of the pairwise comparisons yielded a p-value below 0.05 even before multiple-comparison correction. After applying Holm–Bonferroni correction across the full set of pairwise Wilcoxon tests (), the smallest observed p-value (0.0625) remained well above the most conservative adjusted significance threshold (). Accordingly, all comparisons remained statistically non-significant after correction.
Therefore, the findings suggest that the proposed interpretable model performs competitively, although we cannot claim statistical equivalence based solely on this test.
4.10. Interpretability and Transparency
Unlike deep neural models, which require post hoc interpretation (e.g., SHAP or attention visualization), the proposed framework yields directly interpretable logic-based decisions. Each rule corresponds to a measurable physiological mechanism, enabling clear explanations such as “Stress is detected because RMSSD and HF power decreased below normal vagal range, indicating reduced parasympathetic activity.”
This direct traceability enables clinicians or behavioral scientists to reason about the system’s decisions in physiological terms rather than opaque feature attributions.
4.11. Physiological Validity and Enhanced Interpretability
The LLM-assisted explanation step strengthens the interpretability of the proposed rule-based model by explicitly grounding each HRV threshold in autonomic physiology. Prior HRV research consistently shows that acute stress reduces parasympathetic indicators such as RMSSD, HF power, and pNN50, while increasing LF/HF due to sympathetic dominance [
5]. Our data-derived thresholds follow exactly these directions, suggesting that the classifier captures genuine stress physiology rather than dataset-specific artifacts.
This agreement between threshold rules and known mechanisms provides transparent interpretability: each decision can be traced back to a well-established biomarker (e.g., “low RMSSD indicates vagal withdrawal”), resulting in a model whose logic can be explained in strictly physiological terms rather than abstract model weights. The LLM served as a literature-grounded reasoning companion, ensuring consistency with established HRV theory.
Beyond reporting threshold directions, it is now explicitly discussed why each HRV feature changes under stress. RMSSD, pNN50 and HF power reflect short-term vagal modulation, and their suppression is a direct consequence of parasympathetic withdrawal during acute sympathetic arousal. stdV behaves similarly, as reduced beat-to-beat variability indicates reduced flexibility of cardiac pacing. In contrast, LF/HF increases because sympathetic tone rises while vagal influence weakens, shifting sympathovagal balance. These mechanisms explain why the rule-based classifier fires when RMSSD, HF and stdV fall below the threshold while LF/HF increases. The model does not merely separate classes statistically—the rules reflect core autonomic physiology.
5. Conclusions and Future Work
This study demonstrated that stress can be effectively recognized through simple, rule-based combinations of HRV-derived features such as RMSSD, HF power, and the LF/HF ratio. By employing a large language model (LLM) to validate empirical thresholds against biomedical literature, the framework introduces a novel approach to machine-assisted physiological reasoning, enabling the system to self-check whether its inferences are physiologically plausible. Integrating statistical thresholding with semantic reasoning bridges the gap between data-driven biosignal analysis and physiology-informed interpretation, thereby enhancing transparency and trust in affective computing systems.
By using the daily life dataset, stress was characterized by decreased RMSSD, HF power, and pNN50—reflecting reduced parasympathetic activity—alongside increased LF/HF ratios, which indicate sympathetic activation. Additionally, reduced signal variability (stdV) was observed under cognitive and environmental stressors. These findings align with established psychophysiological theory and confirm that threshold-based models can yield scientifically grounded decision rules even in noisy, real-world data.
Despite its interpretability, the proposed framework relies on a fixed set of handcrafted features and thresholds derived from limited datasets. Although LLM-assisted literature verification enhances scientific validity, it cannot substitute large-scale meta-analytic validation. Future research should extend this approach to multimodal sensing modalities such as ECG, respiration, and motion data, incorporating cross-subject normalization to address individual variability.
Building on the present findings, further developments include adaptive, personalized thresholding that updates dynamically according to each individual’s physiological range; hybrid explainable models combining rule-based reasoning with interpretable neural mechanisms such as prototype-based or attention-guided networks; and the integration of LLM-signal co-reasoning for real-time, self-explanatory biosignal pipelines. Clinical validation in longitudinal stress monitoring and early intervention contexts will be essential to ensure robustness across populations, devices, and environments.
We also evaluated the sensitivity of the proposed rule to the choice of window length (1, 2, and 5 min). As detailed in
Section 4.5, the 2 min configuration achieved the most favorable balance between responsiveness and HRV estimation stability. One-minute windows suffer from noisy and unreliable frequency-domain HRV estimates, whereas 5 min windows increase latency and smooth out short-term stress dynamics. These findings support the selection of 2 min windows as the operational setting for the final model.
Finally, we examined whether the learned thresholds drift across time-of-day, skin temperature, or activity levels by stratifying windows along these contextual axes (
Section 4.6). The rule-based accuracy remained stable across circadian bins and temperature/activity tertiles, suggesting that the thresholds are reasonably robust at the population level. Nevertheless, our current model does not explicitly incorporate circadian modeling or context-aware personalization; future work will extend the framework with adaptive, individual-specific thresholds that account for baseline shifts related to daily rhythms, peripheral temperature, and recent physical activity.
This study is not without limitations. It should be noted that the Empatica E4 device used in this study does not provide a respiratory signal, and therefore HF power—a vagally mediated HRV component highly sensitive to breathing rate and depth—could not be respiration-corrected. As a result, reductions in HF power may occasionally reflect changes in breathing patterns rather than autonomic stress responses. Although this constraint is common in PPG-based real-world stress monitoring, the absence of respiration monitoring represents an inherent limitation of the present study. Future work should incorporate explicit respiratory measurements or PPG-derived respiratory proxies to better isolate true parasympathetic withdrawal from breathing-induced HF variability. There are other limitations that should be acknowledged. The study relies exclusively on PPG-derived HRV features, and does not incorporate multimodal physiological signals such as EDA, respiration, or temperature, which may provide complementary insight into autonomic stress dynamics. Furthermore, stress thresholds were applied uniformly across all participants, even though baseline HRV levels are known to vary considerably with age, lifestyle, circadian rhythm, and individual autonomic tone; future work should therefore evaluate adaptive or personalized threshold strategies. In addition, the dataset primarily consists of a relatively homogeneous, young adult population, which restricts generalizability across broader demographic groups—including older adults, clinical cohorts, or culturally diverse populations. Finally, the method is device-dependent and inherits the limitations of wrist-based PPG sensing, which can be affected by motion artifacts, skin contact, ambient light, and hardware-specific signal quality. These constraints highlight the importance of testing across multiple wearable platforms to assess cross-device robustness.
Overall, this research contributes to the emerging paradigm of reasoning-centered artificial intelligence, in which large language models collaborate with physiological signal analytics to produce interpretable, literature-justified, and scientifically grounded models. By positioning the LLM as a reasoning partner rather than a black box, this work outlines a viable path toward trustworthy and explainable stress recognition in everyday life.