Article

Synchronization of Inhalation/Exhalation Ratio and Heart Rate Variability During Spontaneous Breathing

1
Innovation Center for Semiconductor and Digital Future, Mie University, Tsu City 514-8507, Japan
2
Department of Management Science and Technology, Graduate School of Engineering, Tohoku University, Sendai 980-8579, Japan
3
Faculty of Engineering, Mie University, Tsu City 514-8507, Japan
4
School of Design & Architecture, Nagoya City University, Nagoya 464-0083, Japan
*
Author to whom correspondence should be addressed.
Electronics 2025, 14(9), 1903; https://doi.org/10.3390/electronics14091903
Submission received: 20 April 2025 / Revised: 3 May 2025 / Accepted: 6 May 2025 / Published: 7 May 2025

Abstract

:
In this study, we investigate the relationship between breathing patterns and cardiac autonomic nervous activity during spontaneous breathing. Electrocardiograms and respiratory signals were simultaneously monitored in six subjects for 5 min while in a seated position. The inhalation/exhalation ratio (i/e) was calculated, and its variance was compared with the heart rate variability index. The results showed that inhalation time tended to be longer than exhalation time, with the inhalation-to-exhalation ratio ranging from 1.074 to 1.423. Additionally, one subject exhibited an unusually slow respiratory cycle. The inhalation/exhalation ratio was partly associated with changes in the low-frequency to high-frequency ratio (LF/HF) of heart rate variability, indicating individual differences. These findings suggest that while breathing patterns play a role in autonomic nervous system regulation and may have applications in stress and respiratory health management, there are limitations to these associations.

1. Introduction

A respiratory curve is a wave-shaped representation of respiratory movements, providing insights into breathing depth, respiratory rate, and ventilation status. Respiratory pattern analysis has long been utilized for screening respiratory diseases, enabling clinicians to assess and monitor lung function and airflow. In particular, measuring respiratory timing—especially the inspiratory and expiratory phases—is crucial for identifying obstructive airway diseases such as asthma and chronic obstructive pulmonary disease (COPD). These conditions often exhibit characteristic changes in respiratory timing, which can be captured in the flow-volume curve (FVC) and used as a diagnostic indicator. FVC is a test that measures how quickly air can be exhaled after maximum inhalation, allowing the evaluation of airway and bronchial patency and the severity of obstructive ventilation impairment [1,2,3]. The peak flow, or maximum expiratory flow rate, refers to the highest speed of air exhaled forcefully and is particularly useful for asthma management [4,5]. In individuals with asthma, airway narrowing and increased sputum viscosity slow exhalation, resulting in a reduced peak flow value [6,7,8,9]. One contributing factor is “shallow breathing”, often caused by a lack of physical activity and stress [10].
Beyond its clinical applications in diagnosing respiratory disorders, breathing balance measurement has gained attention in autonomic nervous system (ANS) regulation [11,12,13,14]. The ANS, which controls involuntary physiological functions, is influenced by various factors [12,15], including breathing patterns. In recent years, slow, controlled breathing techniques have been widely adopted for autonomic regulation, particularly in managing over-arousal and stress [11,12,15,16,17]. Techniques such as diaphragmatic breathing and paced breathing are used clinically to promote relaxation and reduce stress. These methods enhance parasympathetic nervous activity, lowering heart rate and improving heart rate variability (HRV), which is associated with relaxation and mental calmness. As a result, slow breathing is often recommended for managing anxiety, stress, and other mental health conditions. Research related to anxiety has noted reduced breathing and HRV, and breathing regulation and HRV biofeedback have been shown to be effective in regulating emotions [18,19,20,21,22,23].
This study examines the relationship between the exhalation-to-inhalation ratio and autonomic nervous activity, focusing on individual differences in respiratory timing; the inhalation/exhalation ratio (i/e) was used as an index of respiratory regulation because it is closely related to autonomic nervous activity [24,25,26]. Specifically, it aims to address two key questions: (1) To what extent do individual differences exist in the exhalation-to-inhalation ratio? (2) When exhalation time is significantly longer than inhalation time, does this balance correlate with heart rate variability measures, particularly the low-frequency to high-frequency ratio (LF/HF), which is commonly used to assess stress and relaxation levels? By exploring these relationships, this study seeks to enhance our understanding of how breathing patterns influence autonomic nervous system regulation [18,19] and stress management. The HF component reflects respiratory fluctuations and is sensitive to changes in breathing patterns [27]. In addition, HF tends to decrease under stress and is an important indicator of autonomic nervous activity and emotional changes; therefore, we focused on the LF/HF ratio [11,12,28]. We conducted the analysis of synchronization between the inhalation/exhalation ratio and heart rate variability during spontaneous breathing in this experiment because we did not yet know the nature of their relationship from previous research. The findings are expected to contribute to health monitoring and interventions aimed at improving respiratory and emotional well-being.

2. Materials and Methods

2.1. Participants

This study was conducted with six healthy adult participants (age 37.8 ± 12.8, 3 females), all of whom provided informed consent before participation. This is set as the minimum sample size required to detect significant changes in HRV indices, taking into account the balance between statistical power and feasibility.
The study protocol adhered to the ethical guidelines of the Declaration of Helsinki and was approved by the institutional ethics review board; it was conducted with the approval of the Ethics Committee of Nagoya City University Hospital (Approval No. 60-18-0211, approved on 22 March 2019).
Participants had no history of cardiovascular or respiratory diseases and were not taking any medications that could affect autonomic nervous system activity. In addition, subjects were excluded from the study based on the exclusion criteria mentioned below. It was verbally confirmed whether any exclusion criteria were met.
Exclusion Criteria for Participants:
  • Individuals with respiratory diseases
Diagnosed with chronic obstructive pulmonary disease (COPD), asthma, interstitial lung disease, or other respiratory conditions.
  • Individuals with cardiovascular diseases
Suffering from heart failure, arrhythmias (especially those affecting respiration), or severe hypertension.
  • Individuals with neurological or muscular disorders
Diagnosed with amyotrophic lateral sclerosis (ALS), myasthenia gravis, Parkinson’s disease, or other conditions that may impact respiratory function.
  • Individuals diagnosed with sleep apnea syndrome (SAS)
Particularly those with moderate to severe sleep apnea.
  • Individuals regularly taking medications that suppress respiration
Long-term users of sleeping pills, opioid analgesics, benzodiazepines, or other drugs that may affect breathing patterns.
  • Individuals who have consumed caffeine or alcohol within the past three hours
As these substances may influence respiratory rhythm and autonomic nervous system activity.
  • Smokers who have smoked within the past six hours
Due to the potential acute effects on airway constriction and ventilation capacity.
  • Individuals with severe obesity (BMI ≥ 35)
As significant changes in respiratory patterns may occur.
  • Pregnant or lactating individuals
Due to hormonal and physiological changes that may affect breathing.
  • Other cases deemed inappropriate by the principal investigator
If participation poses safety risks or may compromise the reliability of the data.

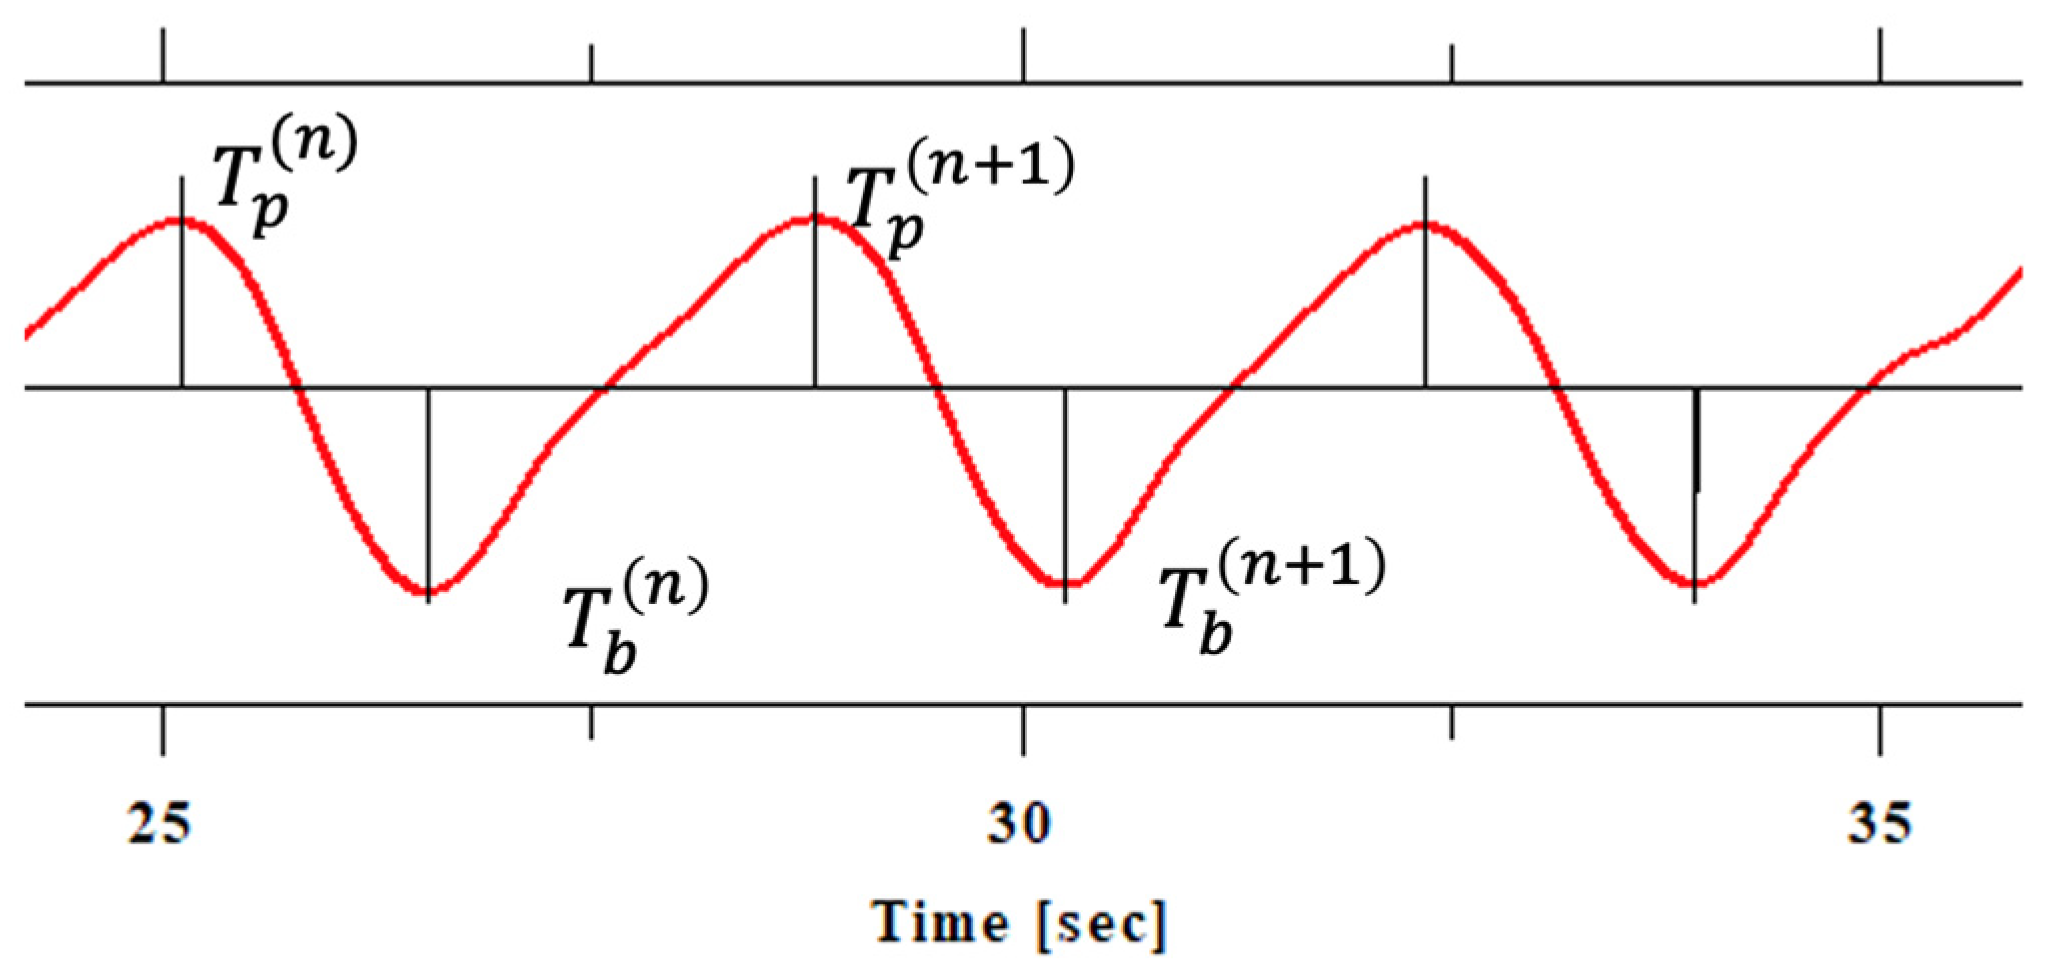
2.2. Measurement of Respiratory and Cardiac Signals

Respiratory patterns were recorded using a Dymedix sensor, a highly sensitive respiratory effort sensor designed to capture respiratory waveforms with minimal signal distortion (Triple Play Airflow Sensor II, PVDF, manufactured by Miyuki Giken Co., Ltd., Tokyo, Japan). This sensor is a type of thermistor, a semiconductor resistor whose resistance changes significantly with temperature. It can be used to detect breathing activity by sensing temperature variations near the nostrils. When a person exhales, warm and humid air passes through the nose, causing a rise in local temperature. The thermistor detects this change, and its resistance decreases accordingly. This resistance change is converted into a temperature reading and displayed over time on a graph. The vertical axis (Y-axis) represents temperature (in °C or K), as measured by the thermistor. The horizontal axis (X-axis) represents time, showing the progression of breathing cycles. During exhalation, the temperature rises, indicating active breathing. During inhalation or breath-holding, the temperature drops. These temperature patterns reflect the depth, rate, and regularity of breathing. By analyzing the waveform of temperature changes, the presence or absence of breathing and various respiratory patterns can be non-invasively monitored in real time.
Simultaneously, electrocardiograms (ECGs) were recorded using a standard lead system to analyze HRV. All measurements were conducted while participants remained seated in a resting state to minimize movement artifacts. The recording duration for each participant was 5 min. Physiological signals, including ECG and respiratory waveforms, were recorded for each participant. The sampling frequency was set at 1 kHz. The ECG signal was measured using the three-lead method. Gel electrodes were placed on the upper chest below the right clavicle, below the left clavicle, and at the lower end of the left ribs, and these three electrodes formed the II lead to obtain the ECG waveform. The area below the clavicle has relatively little muscle mass, resulting in minimal noise (myoelectric activity) caused by muscle movement. Additionally, the area above the ribs is less affected by body movements. Lead II reflects the conduction of cardiac excitation from the right upper to the left lower region, making it suitable for capturing the R wave. Participants were instructed to remain seated in a resting state and breathe spontaneously to minimize external influences on autonomic function.
Respiratory waveforms were analyzed to determine the inhalation-to-exhalation (i/e) ratio and its variability. For each breathing cycle, the peak time (Tp) and bottom time (Tb) of the respiratory curve were identified, and inspiratory and expiratory times were calculated as follows. Inhalation is the period from the end of exhalation (bottom) to the end of inspiration (peak), and was calculated using the following formula:
T i = T p ( n ) T b ( n )
Ti indicates the inhalation time of the nth respiratory cycle, T(n)b indicates the time (bottom) of the end of exhalation (i.e., the start of inhalation) of the nth respiratory cycle, and T(n)p indicates the time (peak) of the end of inhalation of the nth respiratory cycle.
Exhalation is the period from the end of inspiration (peak) to the end of the next exhalation (bottom), and can be expressed by the following formula:
T e = T b ( n + 1 ) T p ( n )
Te indicates the expiratory time of the nth respiratory cycle, T(n+1)b indicates the time (bottom) of the end of exhalation (i.e., the start of inspiration) of the n + 1th respiratory cycle, and T(n)p indicates the time (peak) of the end of inspiration in the nth respiratory cycle.
The inhalation–exhalation ratio (i/e ratio) is expressed by the following formula:
i e = T i T e
By calculating this value for each respiratory cycle, the variability of the i/e ratio can be calculated (Figure 1).
In the following lines, we will explain the HRV analysis. HRV was analyzed by extracting the time series of RR intervals from the electrocardiogram signal, resampling at 2 Hz, and then performing a fast Fourier transform (FFT) to calculate HRV parameters in the frequency domain. Resampling RR interval data at 2 Hz before HRV analysis is essential to convert the irregularly spaced heartbeat intervals into a uniformly sampled time series, which is required for frequency-domain analysis such as the fast Fourier transform (FFT). This process enables consistent computation of spectral power in defined frequency bands (very low frequency (VLF), LF, and HF).
  • Very low frequency (VLF) power: 0.0033–0.04 Hz. Reflects long-term regulatory mechanisms such as thermoregulation and the renin–angiotensin system.
  • Low frequency (LF) power: 0.04–0.15 Hz. Represents a mix of sympathetic and parasympathetic activity, associated with baroreflex sensitivity.
  • High frequency (HF) power: 0.15–0.4 Hz. Indicates parasympathetic (vagal) activity and is closely related to respiratory sinus arrhythmia.
  • Frequency to high frequency ratio (LF/HF): commonly used as an index of sympathovagal balance.
The 2 Hz rate is sufficient to capture the dynamics of typical heart rate variability without unnecessary oversampling. Although interpolation may introduce minor distortions, it allows for standardization across data and improves comparability and stability in HRV feature extraction.
The electrocardiogram signal was measured using a Biotope Mini (East Medic Co., Ltd., Kanazawa, Japan). HRV parameters were calculated from the obtained electrocardiogram signal.
The data were visualized by creating scatter plots for 5 min and 3 min intervals to examine individual differences in the change in respiratory balance over time. The reason for conducting the 3 min and 5 min analyses was to confirm the stability and changes of the indices over a short period of time (3 min) while comparing them with the standard HRV analysis time (5 min). This allows us to evaluate the reliability and practicality of the results depending on the measurement time [8]. For the 3 min measurements, the first and last 1 min segments were excluded from the analysis to minimize the effects of initial adjustment and ending anticipation, focusing instead on the stable middle portion.

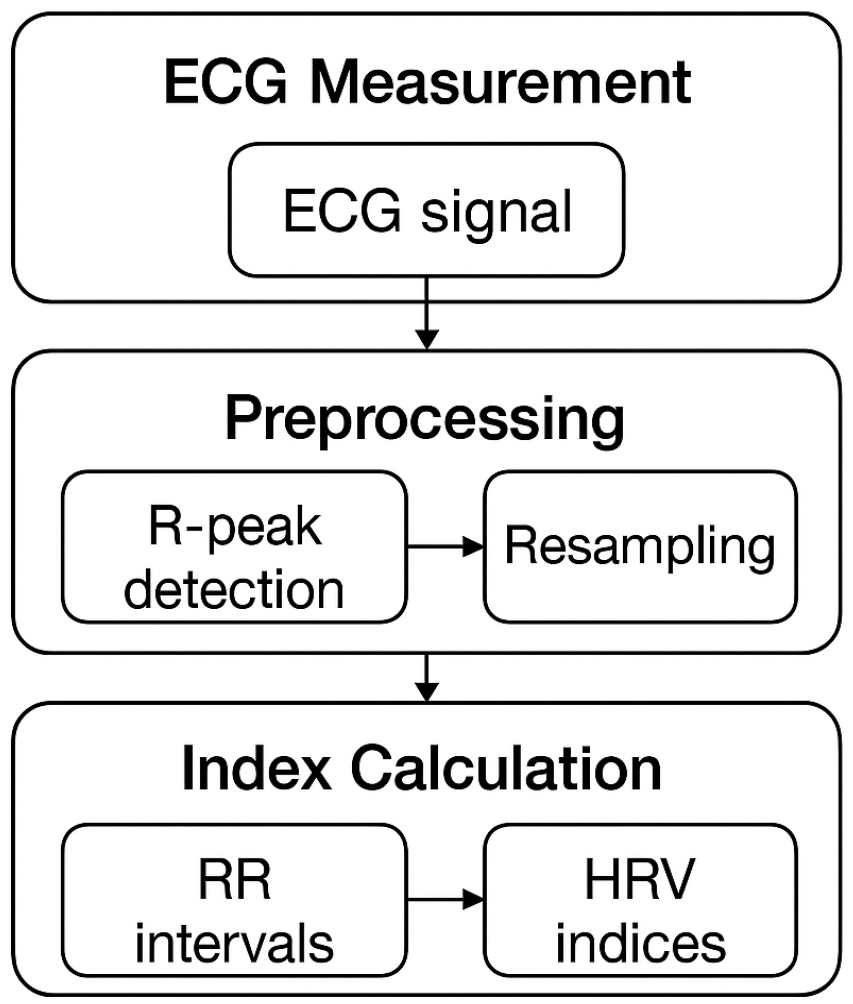
2.3. Data Processing and Analysis

The respiratory waveform was analyzed to determine the i/e ratio and its variance. The inspiratory and expiratory phases were identified using signal peak detection. HRV was calculated from ECG signals using standard time-domain and frequency-domain methods. The LF/HF ratio was used as an index of autonomic nervous system balance, particularly in relation to sympathetic and parasympathetic activity. For HRV analysis, R-peaks were detected from the ECG signal using a Pan–Tompkins algorithm; the RR intervals (time between successive R-peaks) were extracted, and outlier detection was performed to remove ectopic beats or noise-induced artifacts. Time-domain metrics, the standard deviation of NN intervals (two normal heartbeats, SDRR), were calculated. All analyses were conducted using Python v3.6.3 with appropriate signal processing libraries (Figure 2).

2.4. Statistical Analysis
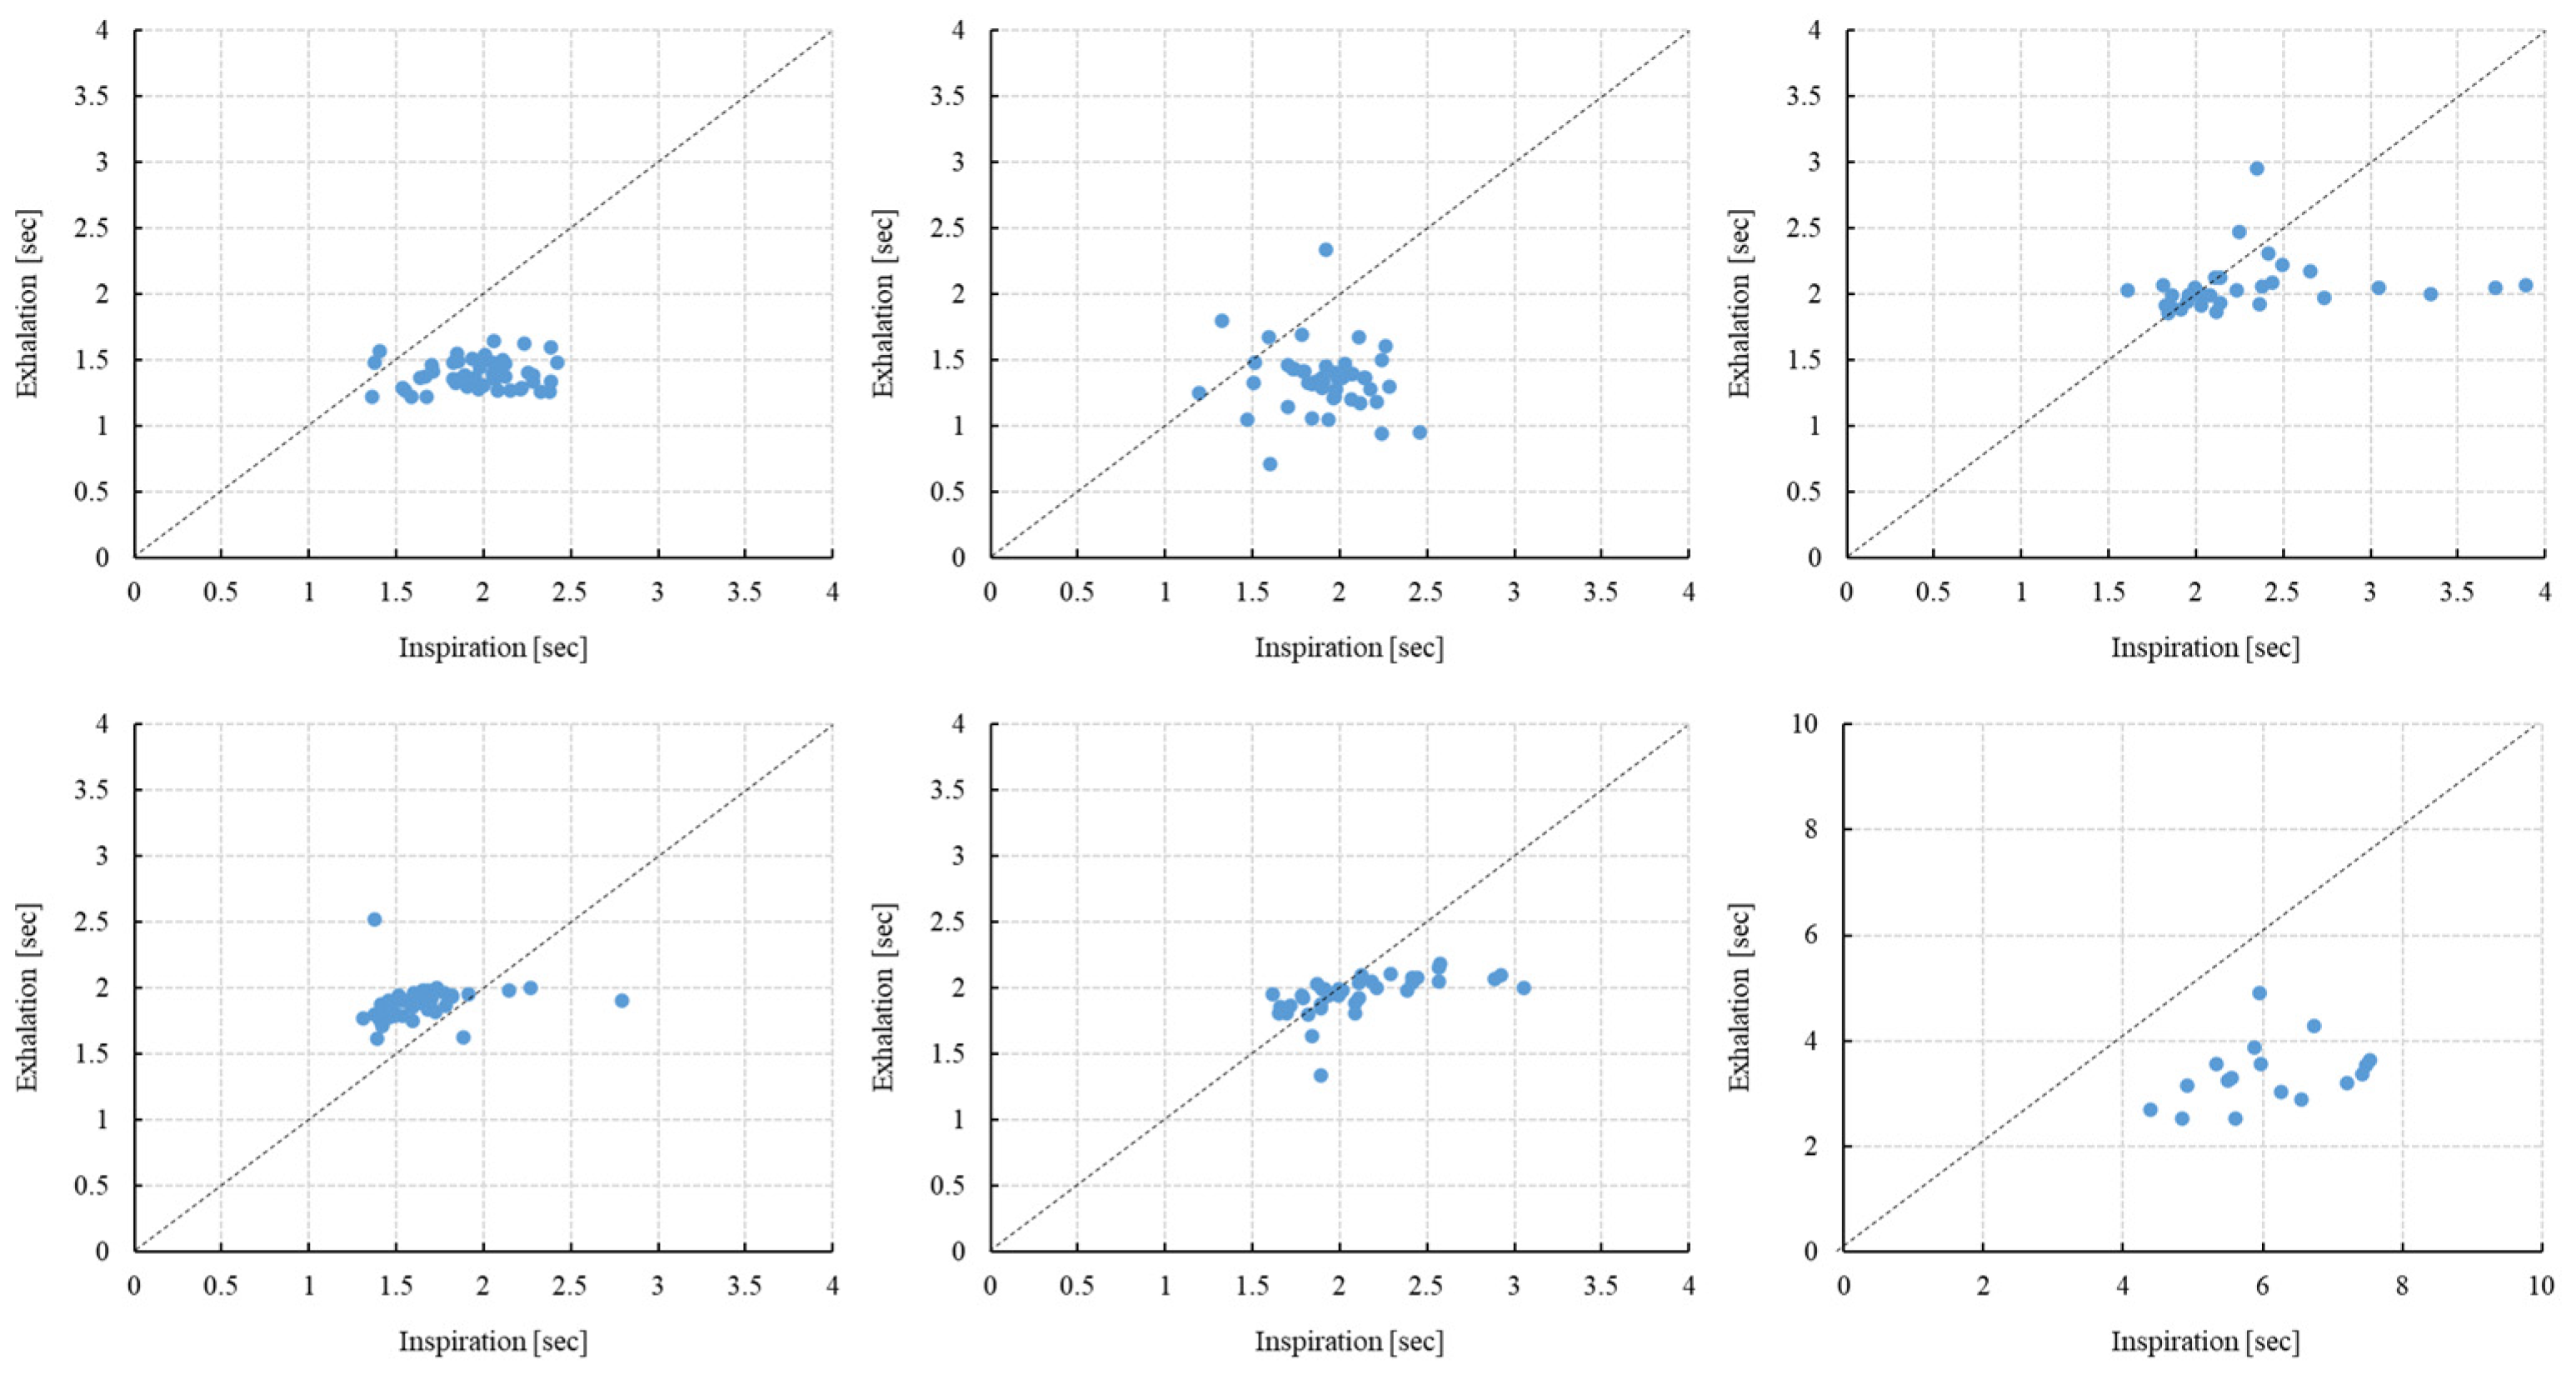
All statistical analyses were performed using IBM SPSS Statistics (v28, IBM Corporation, Armonk, NY, USA). Descriptive statistics were used to summarize the respiratory and HRV data. Correlation analyses were conducted to examine relationships between the i/e ratio and HRV indices. A significance level of p < 0.05 was considered statistically significant.

3. Results

Figure 3 shows the respiratory curve, ECG, and the visualization of the spectrum. Figure 4 and Figure 5 show the scatter plots of T(inspiration) and T(exhalation) of six subjects analyzed for 5 and 3 min, respectively. T indicates the length (time) of inhalation and exhalation. It was demonstrated that the duration of inhalation varied more than that of exhalation.
Figure 4 and Figure 5, Table 1 and Table 2 show the ratio of T(inspiration) to T(exhalation) (5 min and 3 min), respectively. A paired t-test showed that the inhalation time was significantly longer than the exhalation time in five subjects. The standard deviation of the inhalation time was also larger than that of the exhalation time. In five subjects, the ratio of the inhalation time to the exhalation time was 1.074–1.423. In addition, one of the subjects had an extremely slow respiratory cycle compared to the other subjects (Figure 6).
The analysis results of the HRV parameters for each subject are shown in Table 3, Table 4, Table 5 and Table 6. One of the six subjects had a large LF/HF value.
When calculating the ratio of inhalation to exhalation (i/e ratio), one of the six subjects had a longer exhalation than inhalation. As a result, the i/e ratio was lower than 1 (subject number 4). In addition, of the six subjects, only one (subject number 5) had an LF/HF (low frequency/high frequency) ratio lower than 1, indicating that parasympathetic nerve activity was dominant over sympathetic nerve activity (the i/e ratio of subject 5, inspiration was longer than expiration).
Scatter plots for six subjects are shown; the upper row shows subjects 1, 2, and 3, and the lower row shows subjects 4, 5, and 6. The vertical axis shows exhalation (seconds) and the horizontal axis shows inhalation (seconds). There are individual differences in the way inhaled and exhaled air is dispersed, and there is greater variance during inspiration.
Scatter plots for six subjects are shown; the upper row shows subjects 1, 2, and 3, and the lower row shows subjects 4, 5, and 6.

4. Discussion

The results of this experiment showed that the inhalation time tends to be longer than the exhalation time and to fluctuate more, and that the i/e ratio and the LF/HF ratio are not necessarily linked. In this study, we investigated the variability and ratio (i/e ratio) of inspiratory and expiratory times, as well as heart rate variability (HRV) parameters, in six healthy subjects using a thermistor-based respiratory sensor and electrocardiogram (ECG) measurements. It is generally understood that an LF/HF (low frequency/high frequency) ratio lower than 1 indicates a state in which parasympathetic nerve activity is dominant over sympathetic nerve activity [10,20,29]; respiratory fluctuations are the main component and the LF/HF ratio is considered to be an index of autonomic nerve balance [30,31]. In this study, the balance of natural spontaneous breathing in six subjects was analyzed in combination with HRV indices. One of the six subjects had a longer expiration than inspiration (i/e < 1), and one subject had LF/HF < 1. However, these two subjects did not match. This result is novel because it is believed that the autonomic nerves of healthy people without underlying diseases can be regulated by breathing. However, interpretation of LF/HF has long been difficult because it is greatly influenced by individual differences and measurement conditions (posture, breathing, measurement time, etc.) [32,33].
These results indicate that individual differences in breathing patterns and autonomic nervous system patterns exist even under similar conditions, emphasizing the necessity of personalized evaluation approaches in physiological research. This is because the results of this study suggest that the i/e ratio and LF/HF ratio are not necessarily directly correlated.
Furthermore, while deep or slow breathing typically enhances parasympathetic activity, this relationship is complex and may be influenced by factors such as mental state and individual differences, even when posture is standardized to a seated position. Subject 6 had a long respiratory cycle with a frequency of 0.1 Hz. For such subjects, careful interpretation and correction are required to estimate the autonomic nervous state from HRV analysis. The HF component (0.15–0.4 Hz) is mainly derived from respiratory sinus arrhythmia (RSA) and is considered an index of parasympathetic nervous activity [30]. Since the HF band corresponds to approximately 9–24 breaths per minute (4–6 s cycle), if the respiratory cycle is too long, RSA will not be included in the HF band and will not appear in the HF band. In fact, subject 6’s respiratory cycle is longer than 10 s (=0.1 Hz or less), and therefore, the effect of RSA appears in the LF band (0.04–0.15 Hz). In this case, the HF component decreases, which may be mistakenly interpreted as a decrease in parasympathetic nervous activity. Possible solutions include measuring and correcting respiratory frequency (for example, finding RSA peaks individually and correcting the HRV spectrum) or using indices that are not dependent on frequency band (time domain indices, nonlinear indices). Nevertheless, this suggests the importance of measuring under conditions where breathing is constantly controlled (paced breathing).
The finding that the inspiratory phase is significantly longer than the expiratory phase is consistent with previous studies conducted under spontaneous breathing conditions [32,34,35,36,37]. Additionally, several studies have reported that expiratory duration is longer and more variable in a relaxed awake state [38]. The HF index of HRV is known to reflect parasympathetic (vagus) nerve activity associated with respiratory sinus arrhythmia (RSA) [39,40] and is actually used in screening for sleep disorders [41,42,43,44,45]. Therefore, the results of this study may also be applicable to sleep research.
This study has several limitations. First, the sample size was small (n = 6), limiting the generalizability of the results. Second, although breathing was spontaneous, no control over breathing depth was applied, potentially introducing confounding variables. Additionally, the analysis was conducted over a short time frame (3–5 min), which may have prevented the full capture of long-term trends or adaptive responses. However, this 5 min measurement yielded interesting results. In previous heart rate variability studies, the LF/HF ratio has been considered an indicator of stress or relaxation. Still, this study demonstrated that even when posture was standardized to a seated position, there was significant individual variation, and that even when the i/e ratio of breathing was less than 1, the LF/HF ratio was not necessarily low.
Future studies should expand the sample size and conduct experiments that include breathing control tasks to more accurately assess the causal relationship between breathing patterns and autonomic nervous system dynamics; validation is needed on a larger dataset that includes age, gender, physical strength, and psychological state. Additionally, combining respiratory data with additional physiological indicators such as blood pressure or skin conductance may provide a more comprehensive understanding of individual autonomic profiles. It is also necessary to investigate its relevance to cardiopulmonary function monitoring, and it is anticipated that it will be combined with exercise stress testing (CPX) [46] and measurements of maximum oxygen uptake (VO2max). Finally, applying machine learning approaches to model trends in i/e ratios and HRV data under diverse conditions may provide new insights into health monitoring and stress detection using respiratory and heart rate indicators [47,48,49,50,51,52]. This may enable detailed measurements of ultra-low frequency (ULF, 0~0.003 Hz) [27] and other indices of heart rate variability, and by measuring in the supine position, we plan to clarify the relationship with other indices, including ULF. We will also consider using questionnaires to assess emotions such as anxiety and analyzing associations between the timing of measurements and levels of daytime alertness.
This study highlights the subtle interplay between respiration and autonomic nervous system function and emphasizes the importance of considering individual differences in physiological assessments. The i/e ratio is a respiratory movement index, while LF/HF is an autonomic nerve index, and it seems that the discrepancies in the values arise because they reflect different physiological mechanisms; LF/HF is affected by many factors, including not only changes in breathing patterns, but also mental stress, posture, blood pressure fluctuations, and metabolic state.

5. Conclusions

This study analyzed respiratory patterns and heart rate variability (HRV) in six healthy subjects using wearable sensors. The findings revealed that, in most subjects, the duration of inhalation was significantly longer and more variable than that of exhalation, with i/e ratios ranging from 1.074 to 1.423. One subject, however, exhibited a longer exhalation period, resulting in an i/e ratio of less than 1. Additionally, the HRV analysis showed that only one subject had a low LF/HF ratio (<1), indicating dominant parasympathetic activity. These results suggest that while inhalation tends to dominate in duration and variability under resting conditions, individual differences in respiratory and autonomic responses are notable. This highlights the importance of personalized analysis in physiological monitoring.

Author Contributions

Conceptualization, E.Y. and Y.Y.; methodology, E.Y. and Y.Y.; software, Y.Y.; validation, E.Y. and Y.Y.; formal analysis, E.Y.; investigation, E.Y.; resources, E.Y.; data curation, Y.Y.; writing—original draft preparation, E.Y.; writing—review and editing, E.Y.; visualization, Y.Y.; supervision, E.Y.; project administration, E.Y.; funding acquisition, E.Y. All authors have read and agreed to the published version of the manuscript.

Funding

This research received no external funding.

Institutional Review Board Statement

The study was conducted in accordance with the Declaration of Helsinki, and it was conducted with the approval of the Ethics Committee of Nagoya City University Hospital (Approval No. 60-18-0211, approved on 22 March 2019).

Informed Consent Statement

Informed consent for participation was obtained from all subjects involved in the study.

Data Availability Statement

The data presented in this study are available on request from the corresponding author.

Acknowledgments

We would like to express our sincere gratitude to all participants who took part in this study. Their time and cooperation made this research possible.

Conflicts of Interest

The authors declare no conflicts of interest.

References

  1. Sarkar, M.; Madabhavi, I.V.; Mehta, S.; Mohanty, S. Use of Flow Volume Curve to Evaluate Large Airway Obstruction. Monaldi Arch. Chest Dis. 2022, 92, 1947. [Google Scholar] [CrossRef] [PubMed]
  2. Al-Khlaiwi, T. Flow Volume Curve: A Diagnostic Tool in Extrathoracic Airway Obstruction. Pak. J. Med. Sci. 2020, 36, 846–847. [Google Scholar] [CrossRef]
  3. Huang, J.; Toga, H.; Ohya, N. Flow-Volume Curve. Nihon Rinsho 1997, 55 (Suppl. 2), 15–18. [Google Scholar]
  4. Chen, G.; Guan, R.; Shi, M.; Dai, X.; Li, H.; Zhou, N.; Chen, D.; Mao, H. A Nanoforest-Based Humidity Sensor for Respiration Monitoring. Microsyst. Nanoeng. 2022, 8, 44. [Google Scholar] [CrossRef] [PubMed]
  5. Fei, J.; Pavlidis, I. Thermistor at a Distance: Unobtrusive Measurement of Breathing. IEEE Trans. Biomed. Eng. 2010, 57, 988–998. [Google Scholar] [CrossRef]
  6. Boparai, S.; Solomon, G.M. Interpretation of Spirometry, Peak Flow, and Provocation Testing for Asthma. Otolaryngol. Clin. N. Am. 2024, 57, 201–213. [Google Scholar] [CrossRef] [PubMed]
  7. Brigham, E.P.; West, N.E. Diagnosis of asthma: Diagnostic testing. Int. Forum Allergy Rhinol. 2015, 5 (Suppl. 1), S27–S30. [Google Scholar] [CrossRef] [PubMed]
  8. Price, D.; Brusselle, G. Challenges of COPD diagnosis. Expert Opin. Med. Diagn. 2013, 7, 543–556. [Google Scholar] [CrossRef]
  9. McCormack, M.C.; Enright, P.L. Making the diagnosis of asthma. Respir. Care 2008, 53, 583–590. [Google Scholar]
  10. Ritsert, F.; Elgendi, M.; Galli, V.; Menon, C. Heart and Breathing Rate Variations as Biomarkers for Anxiety Detection. Bioengineering 2022, 9, 711. [Google Scholar] [CrossRef]
  11. Huang, Q.; Zhang, H.; Zhou, R. Stress Reappraisal Improves the Autonomic Nervous System Response of Test Anxious Individuals: Evidence from Heart Rate Variability. Neurosci. Lett. 2023, 812, 137372. [Google Scholar] [CrossRef]
  12. Immanuel, S.; Teferra, M.N.; Baumert, M.; Bidargaddi, N. Heart Rate Variability for Evaluating Psychological Stress Changes in Healthy Adults: A Scoping Review. Neuropsychobiology 2023, 82, 187–202. [Google Scholar] [CrossRef]
  13. Shea, S.A. Behavioural and Arousal-Related Influences on Breathing in Humans. Exp. Physiol. 1996, 81, 1–26. [Google Scholar] [CrossRef] [PubMed]
  14. Dutschmann, M.; Dick, T.E. Pontine Mechanisms of Respiratory Control. Compr. Physiol. 2012, 2, 2443–2469. [Google Scholar] [CrossRef]
  15. Thayer, J.F.; Åhs, F.; Fredrikson, M.; Sollers, J.J.; Wager, T.D. A Meta-Analysis of Heart Rate Variability and Neuroimaging Studies: Implications for Heart Rate Variability as a Marker of Stress and Health. Neurosci. Biobehav. Rev. 2012, 36, 747–756. [Google Scholar] [CrossRef] [PubMed]
  16. Szulczewski, M.T. Training of Paced Breathing at 0.1 Hz Improves CO2 Homeostasis and Relaxation during a Paced Breathing Task. PLoS ONE 2019, 14, e0218550. [Google Scholar] [CrossRef]
  17. Yokogawa, M.; Kurebayashi, T.; Soma, K.; Miaki, H.; Nakagawa, T. Investigation into Deep Breathing through Measurement of Ventilatory Parameters and Observation of Breathing Patterns. J. Vis. Exp. 2019, 151, e60062. [Google Scholar] [CrossRef]
  18. Schleicher, D.; Jarvers, I.; Kocur, M.; Kandsperger, S.; Brunner, R.; Ecker, A. Does It Need an App? Differences between App-Guided Breathing and Natural Relaxation in Adolescents after Acute Stress. Psychoneuroendocrinology 2024, 169, 107148. [Google Scholar] [CrossRef]
  19. Berntson, G.G.; Cacioppo, J.T.; Quigley, K.S. Respiratory Sinus Arrhythmia: Autonomic Origins, Physiological Mechanisms, and Psychophysiological Implications. Psychophysiology 1993, 30, 183–196. [Google Scholar] [CrossRef]
  20. Garssen, B.; de Ruiter, C.; van Dyck, R. Breathing Retraining: A Rational Placebo? Clin. Psychol. Rev. 1992, 12, 141–153. [Google Scholar] [CrossRef]
  21. Remmers, J.E.; Issa, F.G.; Suratt, P.M. Sleep and Respiration. J. Appl. Physiol. 1990, 68, 1286–1289. [Google Scholar] [CrossRef] [PubMed]
  22. Decker, M.J.; Haaga, J.; Arnold, J.L.; Atzberger, D.; Strohl, K.P. Functional Electrical Stimulation and Respiration during Sleep. J. Appl. Physiol. 1993, 75, 1053–1061. [Google Scholar] [CrossRef] [PubMed]
  23. Doheny, E.P.; Lowery, M.M.; Russell, A.; Ryan, S. Estimation of Respiration Rate and Sleeping Position Using a Wearable Accelerometer. Annu. Int. Conf. IEEE Eng. Med. Biol. Soc. 2020, 2020, 4668–4671. [Google Scholar] [CrossRef] [PubMed]
  24. Addison, P.S.; Antunes, A.; Montgomery, D.; Borg, U.R. Non-Contact Monitoring of Inhalation-Exhalation (I:E) Ratio in Non-Ventilated Subjects. IEEE J. Transl. Eng. Health Med. 2024, 12, 721–726. [Google Scholar] [CrossRef]
  25. Liang, J.; Zhang, X.; He, X.; Ling, L.; Zeng, C.; Luo, Y. The Independent and Combined Effects of Respiratory Events and Cortical Arousals on the Autonomic Nervous System across Sleep Stages. Sleep Breath. 2018, 22, 1161–1168. [Google Scholar] [CrossRef]
  26. Hernando, A.; Posada-Quintero, H.; Peláez-Coca, M.D.; Gil, E.; Chon, K.H. Autonomic Nervous System Characterization in Hyperbaric Environments Considering Respiratory Component and Non-Linear Analysis of Heart Rate Variability. Comput. Methods Programs Biomed. 2022, 214, 106527. [Google Scholar] [CrossRef]
  27. Task Force of the European Society of Cardiology and the North American Society of Pacing and Electrophysiology. Heart Rate Variability: Standards of Measurement, Physiological Interpretation, and Clinical Use. Circulation 1996, 93, 1043–1065. [Google Scholar] [CrossRef]
  28. Grossman, P.; Kollai, M. Respiratory Sinus Arrhythmia, Cardiac Vagal Tone, and Respiration: Within- and Between-Individual Relations. Psychophysiology 1993, 30, 486–495. [Google Scholar] [CrossRef]
  29. Yoshida, Y.; Furukawa, Y.; Ogasawara, H.; Yuda, E.; Hayano, J. Longer lying position causes lower LF/HF of heart rate variability during ambulatory monitoring. In Proceedings of the IEEE Global Conference on Consumer Electronics (GCCE), Kyoto, Japan, 11–14 October 2016; pp. 348–349. [Google Scholar] [CrossRef]
  30. Porges, S.W. The Polyvagal Perspective. Biol. Psychol. 2007, 74, 116–143. [Google Scholar] [CrossRef]
  31. Sakakibara, M.; Hayano, J. Effect of Slowed Respiration on Cardiac Parasympathetic Response to Threat. Psychosom. Med. 1996, 58, 32–37. [Google Scholar] [CrossRef]
  32. Strauss-Blasche, G.; Moser, M.; Voica, M.; McLeod, D.R.; Klammer, N.; Marktl, W. Relative Timing of Inspiration and Expiration Affects Respiratory Sinus Arrhythmia. Clin. Exp. Pharmacol. Physiol. 2000, 27, 601–606. [Google Scholar] [CrossRef] [PubMed]
  33. Berntson, G.G.; Bigger, J.T.; Eckberg, D.L.; Grossman, P.; Kaufmann, P.G.; Malik, M.; Nagaraja, H.N.; Porges, S.W.; Saul, J.P.; Stone, P.H.; et al. Heart Rate Variability: Origins, Methods, and Interpretive Caveats. Psychophysiology 1997, 34, 623–648. [Google Scholar] [CrossRef]
  34. Hayano, J.; Mukai, S.; Sakakibara, M.; Okada, A.; Takata, K.; Fujinami, T. Effects of Respiratory Interval on Vagal Modulation of Heart Rate. Am. J. Physiol. 1994, 267, H33–H40. [Google Scholar] [CrossRef] [PubMed]
  35. Vaschillo, E.; Vaschillo, B.; Lehrer, P.M. Characteristics of Resonance in Heart Rate Variability Stimulated by Biofeedback. Appl. Psychophysiol. Biofeedback 2006, 31, 129–142. [Google Scholar] [CrossRef] [PubMed]
  36. Yasuma, F.; Hayano, J. Respiratory Sinus Arrhythmia: Why Does the Heartbeat Synchronize with Respiratory Rhythm? Chest 2004, 125, 683–690. [Google Scholar] [CrossRef]
  37. Marsh, H.M.; Rehder, K.; Hyatt, R.E. Respiratory Timing and Depth of Breathing in Dogs Anesthetized with Halothane or Enflurane. J. Appl. Physiol. Respir. Environ. Exerc. Physiol. 1981, 51, 19–25. [Google Scholar] [CrossRef]
  38. Maxwell, D.L.; Cover, D.; Hughes, J.M. Effect of Respiratory Apparatus on Timing and Depth of Breathing in Man. Respir. Physiol. 1985, 61, 255–264. [Google Scholar] [CrossRef]
  39. Giardino, N.D.; Glenny, R.W.; Borson, S.; Chan, L. Respiratory Sinus Arrhythmia Is Associated with Efficiency of Pulmonary Gas Exchange in Healthy Humans. Am. J. Physiol. Heart Circ. Physiol. 2003, 284, H1585–H1591. [Google Scholar] [CrossRef]
  40. Naik, G.R.; Breen, P.P.; Jayarathna, T.; Tong, B.K.; Eckert, D.J.; Gargiulo, G.D. Morphic Sensors for Respiratory Parameters Estimation: Validation against Overnight Polysomnography. Biosensors 2023, 13, 703. [Google Scholar] [CrossRef]
  41. Grossman, P.; Karemaker, J.; Wieling, W. Prediction of Tonic Parasympathetic Cardiac Control Using Respiratory Sinus Arrhythmia: The Need for Respiratory Control. Psychophysiology 1991, 28, 201–216. [Google Scholar] [CrossRef]
  42. Phillips, B. Sleep, Sleep Loss, and Breathing. South. Med. J. 1985, 78, 1483–1486. [Google Scholar] [CrossRef] [PubMed]
  43. Zhu, X.; Chen, W.; Nemoto, T.; Kanemitsu, Y.; Kitamura, K.; Yamakoshi, K.; Wei, D. Real-Time Monitoring of Respiration Rhythm and Pulse Rate during Sleep. IEEE Trans. Biomed. Eng. 2006, 53, 2553–2563. [Google Scholar] [CrossRef]
  44. Hobson, J.A.; Goldfrank, F.; Snyder, F. Respiration and Mental Activity in Sleep. J. Psychiatr. Res. 1965, 3, 79–90. [Google Scholar] [CrossRef]
  45. Gaiduk, M.; Perea, J.J.; Seepold, R.; Martinez Madrid, N.; Penzel, T.; Glos, M.; Ortega, J.A. Estimation of Sleep Stages Analyzing Respiratory and Movement Signals. IEEE J. Biomed. Health Inform. 2022, 26, 505–514. [Google Scholar] [CrossRef] [PubMed]
  46. Balady, G.J.; Arena, R.; Sietsema, K.; Myers, J.; Coke, L.; Fletcher, G.F.; Forman, D.; Franklin, B.; Guazzi, M.; Gulati, M.; et al. Clinician’s Guide to cardiopulmonary exercise testing in adults: A scientific statement from the American Heart Association. Circulation 2010, 122, 191–225. [Google Scholar] [CrossRef]
  47. Lalanza, J.F.; Lorente, S.; Bullich, R.; García, C.; Losilla, J.M.; Capdevila, L. Methods for Heart Rate Variability Biofeedback (HRVB): A Systematic Review and Guidelines. Appl. Psychophysiol. Biofeedback 2023, 48, 275–297. [Google Scholar] [CrossRef]
  48. Lehrer, P.M.; Vaschillo, E.; Vaschillo, B.; Lu, S.-E.; Eckberg, D.L.; Edelberg, R.; Shih, W.J.; Lin, Y.; Kuusela, T.A.; Tahvanainen, K.U.O.; et al. Heart Rate Variability Biofeedback Increases Baroreflex Gain and Peak Expiratory Flow. Psychosom. Med. 2003, 65, 796–805. [Google Scholar] [CrossRef]
  49. Pitzalis, M.V.; Mastropasqua, F.; Massari, F.; Passantino, A.; Colombo, R.; Mannarini, A.; Forleo, C.; Rizzon, P. Effect of Respiratory Rate on the Relationship between RR Interval and Systolic Blood Pressure Fluctuations: A Frequency-Dependent Phenomenon. Cardiovasc. Res. 1998, 38, 332–339. [Google Scholar] [CrossRef] [PubMed]
  50. Song, H.-S.; Lehrer, P.M. The Effects of Specific Respiratory Rates on Heart Rate and Heart Rate Variability. Appl. Psychophysiol. Biofeedback 2003, 28, 13–23. [Google Scholar] [CrossRef]
  51. Seipäjärvi, S.M.; Tuomola, A.; Juurakko, J.; Rottensteiner, M.; Rissanen, A.E.; Kurkela, J.L.O.; Kujala, U.M.; Laukkanen, J.A.; Wikgren, J. Measuring Psychosocial Stress with Heart Rate Variability-Based Methods in Different Health and Age Groups. Physiol. Meas. 2022, 43, 055003. [Google Scholar] [CrossRef]
  52. van der Zwan, J.E.; de Vente, W.; Huizink, A.C.; Bögels, S.M.; de Bruin, E.I. Physical Activity, Mindfulness Meditation, or Heart Rate Variability Biofeedback for Stress Reduction: A Randomized Controlled Trial. Appl. Psychophysiol. Biofeedback 2015, 40, 257–268. [Google Scholar] [CrossRef] [PubMed]
Figure 1. Identification of breathing curves and peaks. The vertical axis represents respiratory volume (arbitrary units), and the horizontal axis represents time (seconds). The red line shown respiration curve, and its peak (maximum or minimum value) is shown as a vertical line. For each respiratory cycle, the peak time (Tp) and bottom time (Tb) of the respiratory curve are identified. In respiratory measurements using a thermistor, when the vertical axis of the graph indicates temperature, it represents changes in temperature during respiration. The temperature of inhaled and exhaled air changes, so the amount of change is measured using a thermistor sensor.
Electronics 14 01903 g001
Figure 2. Block diagram for ECG measurement and analysis. The subjects were asked to breathe spontaneously in a quiet sitting position while their heart rate variability and breathing patterns (inhalation-to-exhalation ratio and breathing frequency) were measured, and the synchrony between the two was analyzed.
Electronics 14 01903 g002
Figure 3. Visualization of ECG, respiratory curve, and frequency analysis of a subject. The top of (a) shows the electrocardiogram signal (blue line), and the bottom (red line) shows the respiration curve. Both are in units of the vertical axis [mv] and the horizontal axis [s]. The black vertical lines in the respiration curve (red line) detect the peaks and bottoms. (b) shows the power spectral density function of the respiration curve. The vertical axis is in units of arbitrary signals (EU). The frequency of human breathing is generally considered to be 0.25 Hz, or about 15 breaths per minute. This is a value that is of interest as a frequency component in heart rate variability analysis, as respiration and heart rate fluctuations are related. The 0.25 Hz value (4 s period) is one of the main elements that make up the HF component (high frequency component) of heart rate variability.
Electronics 14 01903 g003
Figure 4. Scatter plot of T(inspiration) and T(exhalation) (5 min) [N = 6].
Electronics 14 01903 g004
Figure 5. Scatter plot of T(inspiration) and T(exhalation) (3 min) [N = 6].
Electronics 14 01903 g005
Figure 6. Respiratory curve, HRV time series, and RRI and respiratory power spectrum of a subject with a respiratory cycle of 10 s (0.1 Hz). (a) shows the respiration curve (red line), (b) shows the HRV time series (blue line), (c) shows the power spectrum of the heart rate RR interval (RRI), and (d) shows the power spectrum of the respiration curve. (a) The vertical axis represents mV, and the horizontal axis represents time. (b) The vertical axis represents ms, and the horizontal axis represents time. (c) The vertical axis represents ms2, and the horizontal axis represents frequency (Hz). (d) The vertical axis represents mV2, and the horizontal axis represents frequency.
Electronics 14 01903 g006
Table 1. Ratio of T(inspiration) to T(exhalation) (5 min).
SubjectsInspiration
[s]
Exhalation
[s]
p-Value
(Insp. vs. Exha.)
Insp./Exha.
[Ratio]
Insp.
+Exha.
[s]
Peak
Power
[Ratio]
Peak
Frequency
[Hz]
(Coefficient of Variation)(Coefficient of Variation)(Coefficient of Variation)
12.006 ± 0.2671.425 ± 0.152<0.0011.423 ± 0.2303.4310.06260.282
−0.132−0.106−0.162
21.828 ± 0.3861.360 ± 0.260<0.0011.418 ± 0.4743.1880.04850.275
−0.21−0.19−0.334
32.322 ± 0.5852.041 ± 0.184<0.0011.138 ± 0.2664.3630.04090.21
−0.25−0.089−0.234
41.591 ± 0.2881.843 ± 0.151<0.0010.865 ± 0.1453.4340.06380.237
−0.18−0.082−0.168
52.133 ± 0.3701.958 ± 0.135<0.0011.074 ± 0.1604.0910.09380.244
−0.172−0.067−0.149
65.655 ± 1.0963.871 ± 1.558<0.0011.667 ± 0.5779.5260.06440.103
−0.191−0.402−0.346
Table 2. Ratio of T(inspiration) to T(exhalation) (3 min).
SubjectsInspiration
[s]
Exhalation
[s]
p-Value
(Insp. vs. Exha.)
Insp./Exha.
[Ratio]
Insp.
+Exha.
[s]
Peak
Power
[mV2]
Peak
Frequency
[Hz]
(Coefficient of Variation)(Coefficient of Variation)(Coefficient of Variation)
11.963 ± 0.2731.395 ± 0.110<0.0011.414 ± 0.2163.3580.0910.282
−0.139−0.079−0.153
21.912 ± 0.2521.352 ± 0.245<0.0011.462 ± 0.3483.2640.0570.289
−0.132−0.181−0.238
32.342 ± 0.6062.068 ± 0.2050.0111.135 ± 0.2824.410.0330.214
−0.259−0.099−0.248
41.643 ± 0.2501.885 ± 0.130<0.0010.873 ± 0.1293.5280.1160.237
−0.152−0.069−0.148
52.113 ± 0.3601.955 ± 0.1520.0031.080 ± 0.1574.0680.1270.214
−0.17−0.078−0.145
66.069 ± 0.9703.370 ± 0.610<0.0011.833 ± 0.3269.4390.1270.099
−0.16−0.181−0.178
Table 3. HRV parameter calculation results (5 min).
SubjectsRRI
[ms]
SDRR
[ms]
VLF [ln,ms2]LF
[ln,ms2]
HF
[ln,ms2]
LF/HF
[ratio]
1609184.574.373.093.59
2805366.734.983.833.15
3781235.735.284.322.63
4602185.323.683.481.22
5741636.76.917.240.72
6810344.96.84.1913.57
Table 4. HRV parameter calculation results (3 min).
SubjectsRRI
[ms]
SDRR
[ms]
VLF
[ln,ms2]
LF
[ln,ms2]
HF
[ln,ms2]
LF/HF
[ratio]
1599134.184.472.447.67
2782296.695.843.837.44
3782255.835.474.572.47
4593144.834.263.462.21
5730595.276.067.250.3
6808304.926.784.0315.54
Table 5. Correlation between T(i)/T(e) and HRV parameters (5 min).
HRV IndexRRISDRRVLFLFHFLF/HF
r0.481−0.007−0.2920.396−0.2520.806
p-value0.3310.9980.57380.4350.630.053
Table 6. Correlation between T(i)/T(e) and HRV parameters (3 min).
HRV IndexRRISDRRVLFLFHFLF/HF
r0.518−0.0290.010.63−0.2770.944
p-value0.2920.9560.9850.1840.5960.005
Disclaimer/Publisher’s Note: The statements, opinions and data contained in all publications are solely those of the individual author(s) and contributor(s) and not of MDPI and/or the editor(s). MDPI and/or the editor(s) disclaim responsibility for any injury to people or property resulting from any ideas, methods, instructions or products referred to in the content.

