Article

Gate-Level Hardware Trojan Detection Method Based on K-Hypergraph

by
Jiaji He
,
Bingxin Lin
,
Qizhi Zhang
* and
Yiqiang Zhao
*
School of Microelectronics, Tianjin University, Tianjin 300072, China
*
Authors to whom correspondence should be addressed.
Electronics 2025, 14(9), 1902; https://doi.org/10.3390/electronics14091902
Submission received: 19 March 2025 / Revised: 19 April 2025 / Accepted: 5 May 2025 / Published: 7 May 2025

Abstract

:
To shorten the development cycle of integrated circuit (IC) chips, third-party IP cores (3PIPs) are widely used in the design phase; however, these 3PIPs may be untrusted, creating potential vulnerabilities. Attackers may insert hardware Trojans (HTs) into 3PIPs, resulting in the leakage of critical information, alteration of circuit functions, or even physical damage to circuits. This has attracted considerable attention, leading to increased research efforts focusing on detection methods for HTs. This paper proposes a K-Hypergraph model construction methodology oriented towards the abstraction of HT characteristics, aiming at detecting HTs. This method employs the K-nearest neighbors (K-NN) algorithm to construct a hypergraph model of gate-level netlists based on the extracted features. To ensure data balance, the SMOTE algorithm is employed before constructing the K-Hypergraph model. Then, the K-Hypergraph model is trained, and the weights of the K-Hypergraph are updated to accomplish the classification task of distinguishing between Trojan nodes and normal nodes. The experimental results demonstrate that, when evaluating Trust-Hub benchmark performance indicators, the proposed method has average balanced accuracy of 91.18% in classifying Trojan nodes, with a true positive rate (TPR) of 92.12%.

1. Introduction

A hardware Trojan (HT) is a type of circuit structure with specific malicious functions introduced at one or more stages of the integrated circuit design and manufacturing process. Whether in chip system design, register transfer level (RTL) design, backend implementation, chip manufacturing, or even the packaging and testing stages, malicious attackers can introduce HTs to achieve malicious purposes, including leaking key information, changing specific circuit functions, reducing circuit performance during operation, or refusing command executions. The security threats posed by HTs are characterized by their high levels of concealment, permeability, and destructiveness, making them particularly challenging to detect, prevent, and eliminate. These attributes render HTs a significant threat to the security and integrity of information systems, undermining trust in the technological infrastructure that underpins modern society [1,2,3,4].
A HT usually consists of two parts, namely the trigger and the payload [5], as shown in Figure 1. When specific conditions are met, an activation signal is sent to the payload to trigger the HT. Typically, the trigger conditions for HTs are designed to be rare instruction sets, low-activity nodes, or complex state transitions within the host circuit. This approach ensures that the Trojan remains well concealed, making it difficult to detect through conventional methods. After receiving activation signals, the payload part of the HT is activated to perform the expected malicious functions, such as tampering with circuit functions, denying system services, reducing system performance, leaking internal information, and causing damage to the functionality, confidentiality, and integrity of the host circuit [6]. The payload of an HT remains dormant for most of the time, evading conventional testing methods by ensuring normal chip operations.
Typically, compared to the manufacturing phase, HTs can more easily be inserted during the design phase by altering circuit design files at the register transfer level or gate level. HTs inserted at the register transfer level may be optimized during the synthesis process by the design tool, such as the design compiler. Meanwhile, HTs inserted at the gate level can be directly merged into the final design. Therefore, in addition to defensive technologies (such as resisting power analysis attacks through specific circuit designs [7]), gate-level HT detection technology has attracted attention. The machine learning methods used for gate-level HT detection include structural feature detection and statistical feature detection. Structural feature detection mainly extracts the structural information of each circuit level to detect gate-level HTs [8]. Statistical feature detection uses probability statistical methods to calculate the gate-level flipping probability, which has the advantage of more accurately finding low-switching-activity nodes. However, due to the simplicity and fast speed of structural feature extraction methods, detection methods based on structural features have been more widely applied than those based on statistical features.
In previous studies using gate-level structural features to detect HTs, the gate-level netlist was modeled as a directed graph or undirected graph (i.e., a simple graph) to represent the structure of the netlist. This method only connects two nodes with an edge, while connections among gates (nodes) in gate-level netlists are often more complex, involving one-to-many or many-to-many relationships [9], and hypergraphs can effectively represent such complex relationships, as shown in Figure 2, the node set of hypergraph G is V = { v 1 , v 2 , v 3 , v 4 , v 5 } , and the hyperedge set is E = { e 1 , e 2 , e 3 , e 4 } . Forcing these multiple relationships into binary associations will result in the significant loss of valuable information. In the field of very large-scale integration (VLSI) design and circuit layouts, there are already methods to represent the netlist as a hypergraph for circuit partitioning. However, in such hypergraphs, gates are taken as nodes and nets as hyperedges. While this can represent higher-order relationships between nodes, it has limitations, being constrained by the structure of the original circuit and relatively fixed. This paper innovatively applies the method of constructing hypergraphs based on K-NN to gate-level netlists, proposing a hypergraph model construction method oriented towards abstracting the structural features of hardware Trojans—named the K-Hypergraph method.
The contributions of this paper are summarized as follows.
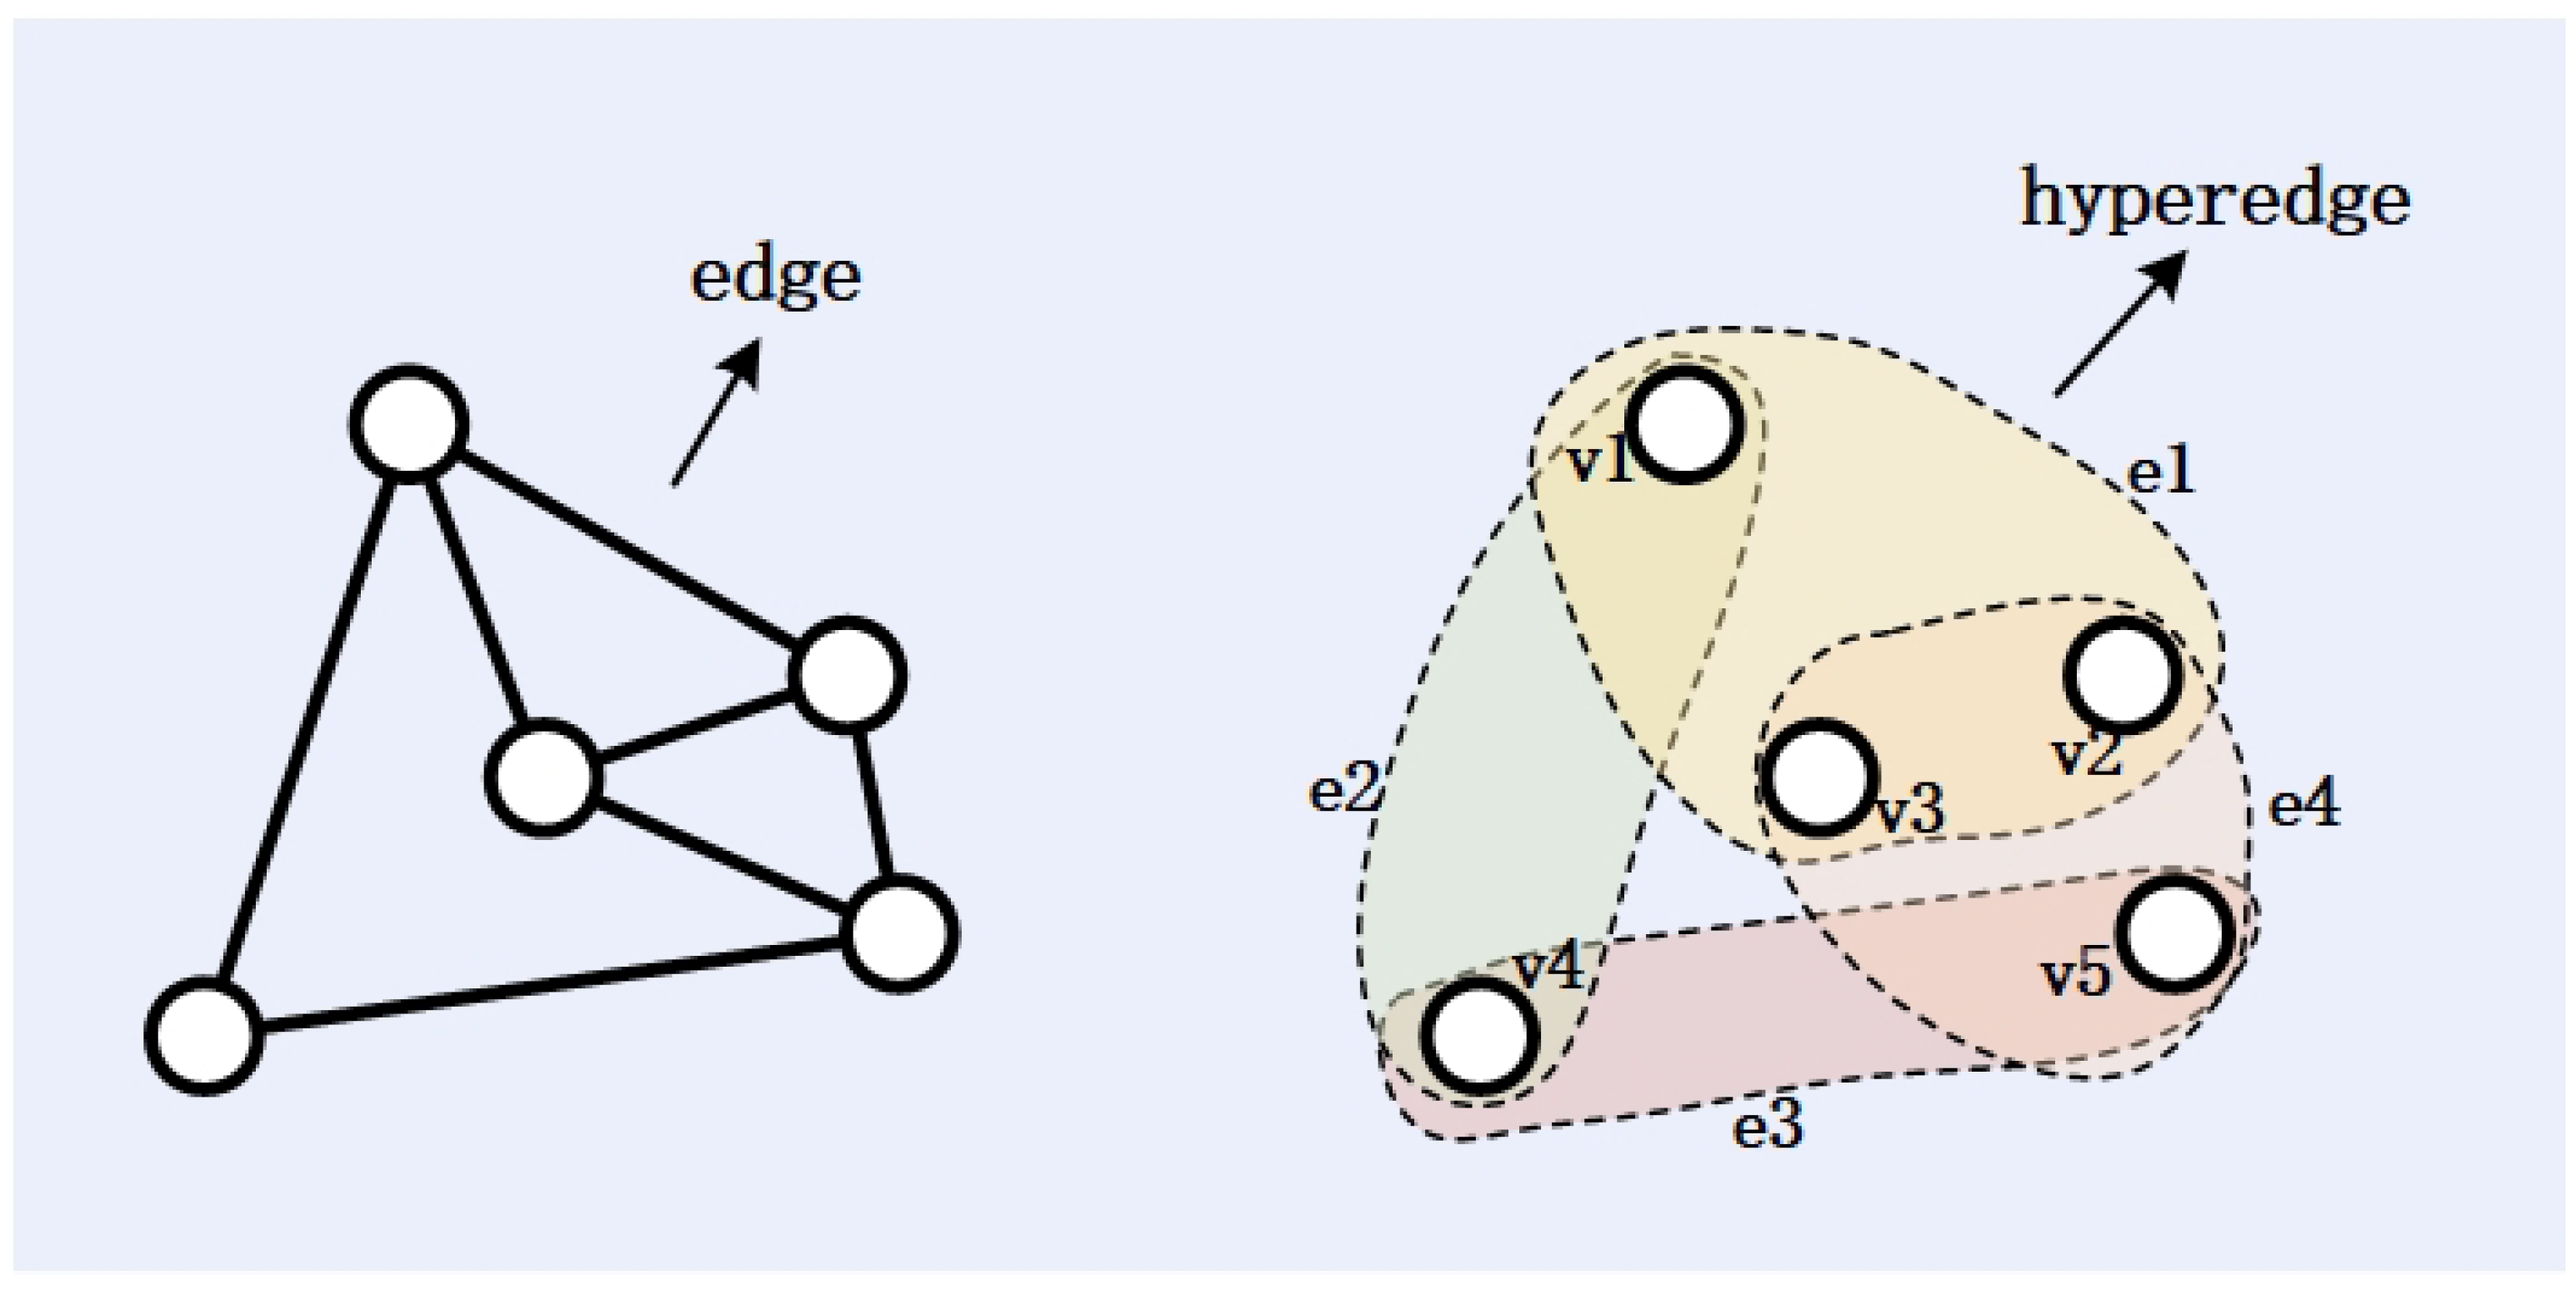
  • This paper proposes a K-Hypergraph model construction method focused on the abstraction of hardware Trojan characteristics. Unlike traditional gate-level netlist hypergraph models (where gates are nodes and nets are hyperedges), the proposed method dynamically adjusts the structure of the hypergraph based on the features, independently of the original circuit structure. This approach allows the K-Hypergraph model to place greater emphasis on the functional characteristics of the circuit, rather than relying solely on the structural information described by the hardware.
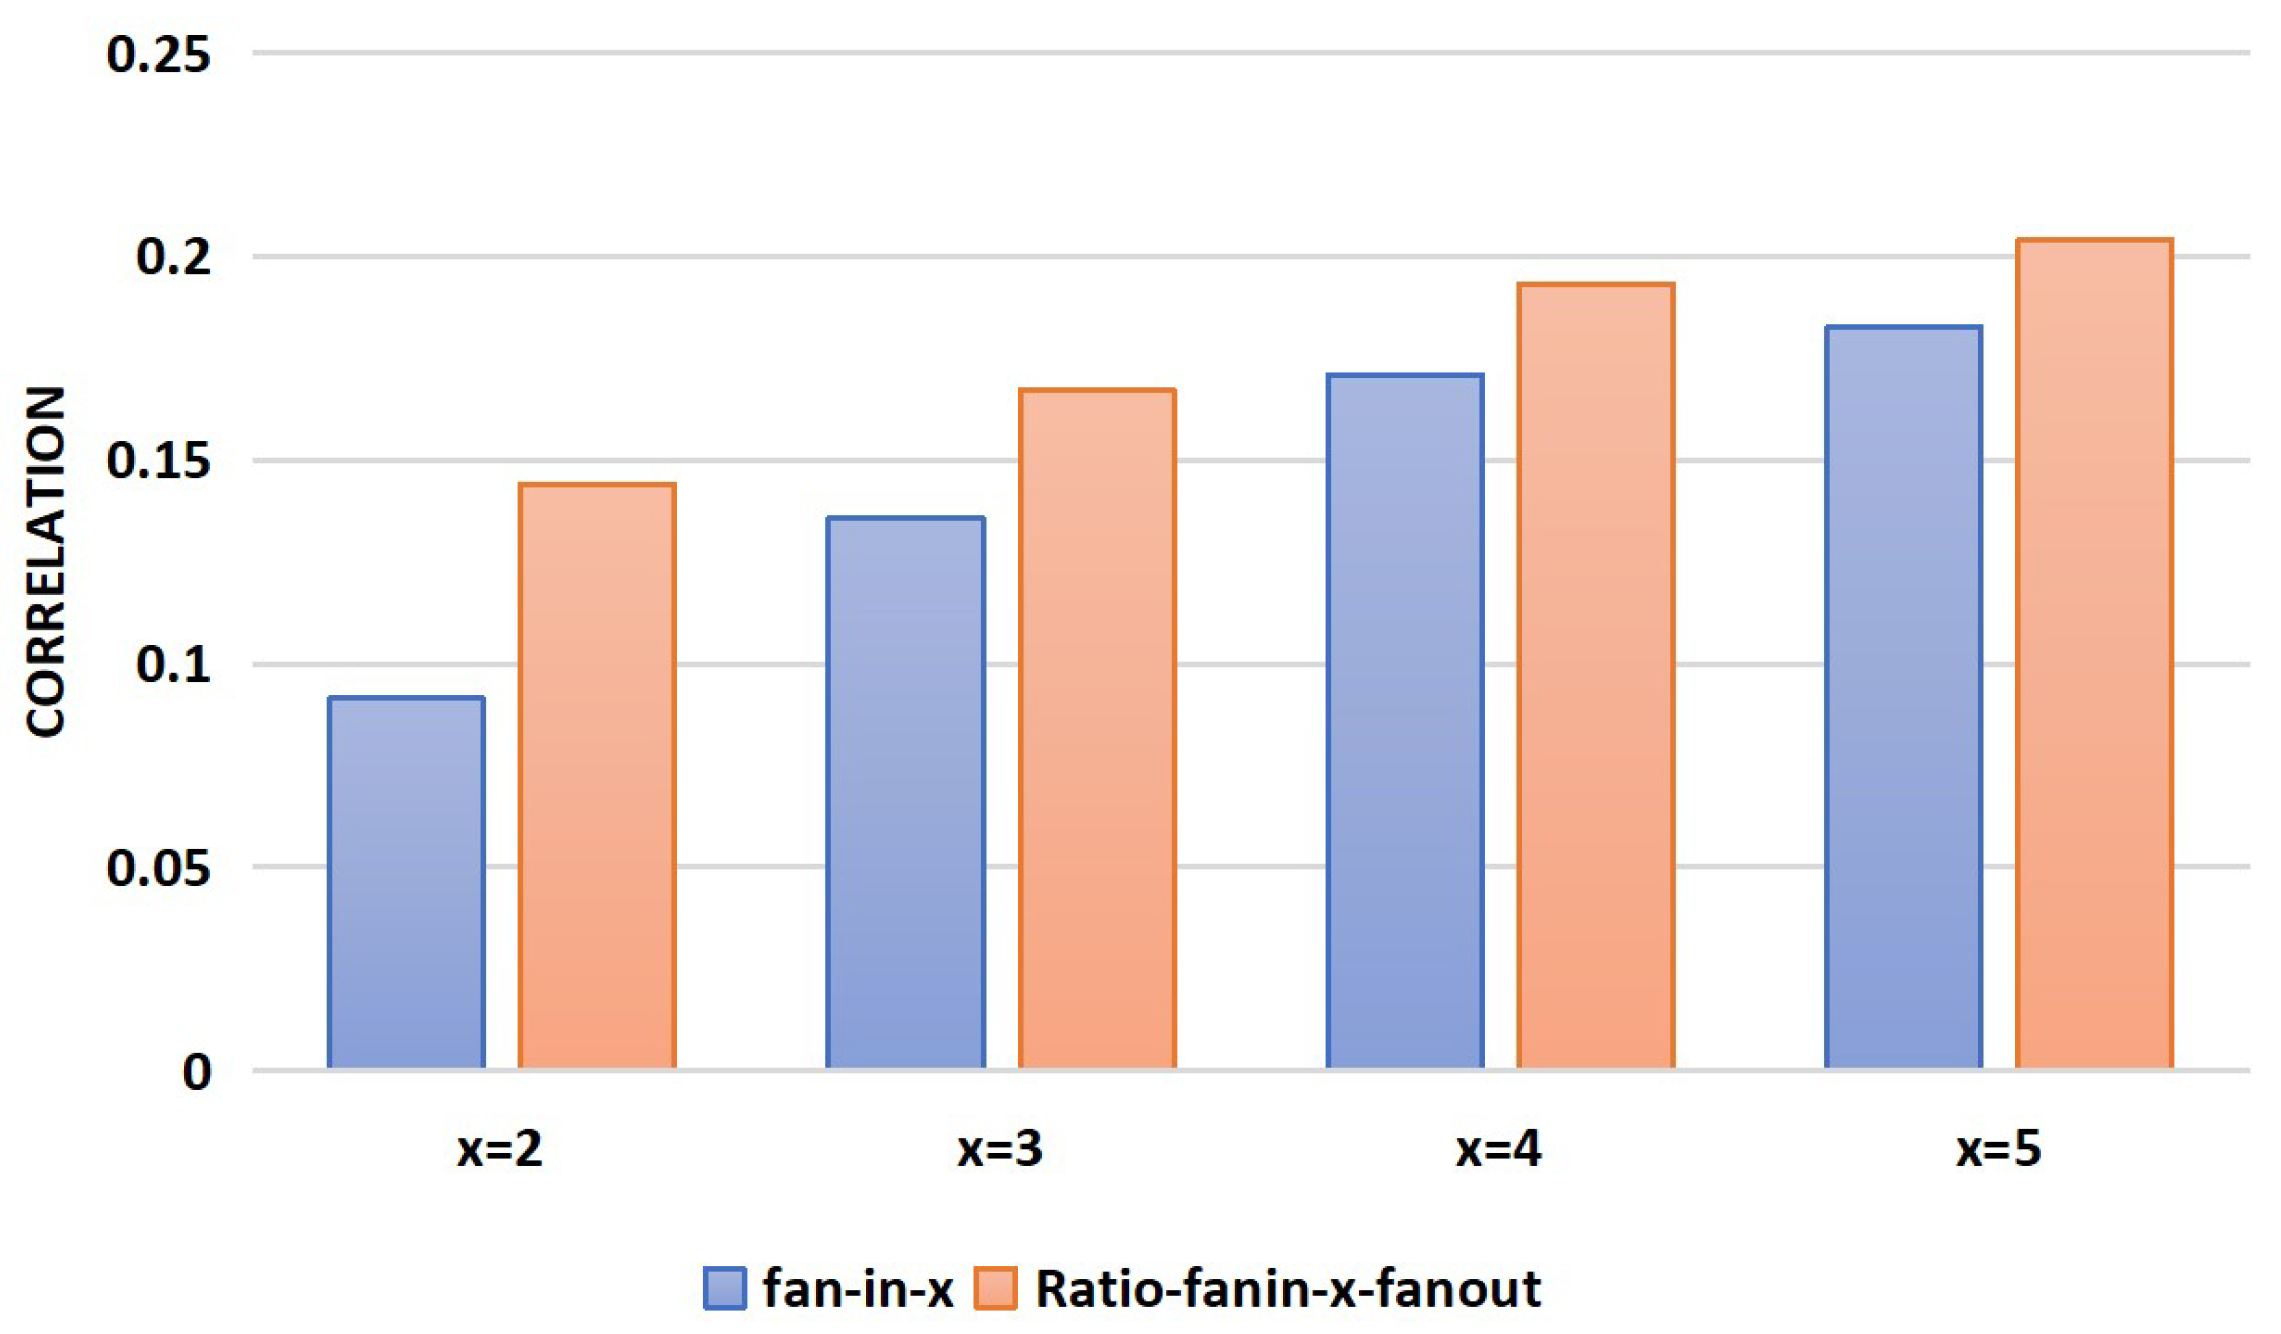
  • This paper improves upon the commonly used fan-in count feature by dividing it by the fan-out count, using the resulting ratio as a new structural feature. A correlation analysis is conducted between the features before and after the improvements, revealing that the correlation of the improved features and the node labels is increased by up to 50%.
  • The learning process for hypergraph structures involves iteratively updating the weights of the hypergraph based on the residuals between predicted labels and actual labels until the weights converge or the maximum number of iterations is reached, ultimately identifying HTs. Experimental results show that, compared with existing methods, this method can effectively and accurately identify most HT nodes.
The rest of the paper is arranged as follows. In Section 2, we review previous research on HT detection at the gate level. Section 3 first introduces the characteristics of the dataset used and then continues to describe the architecture of the proposed model and machine learning. Section 4 evaluates the method proposed in this paper and compares it with previous research methods. Finally, a conclusion is drawn in Section 5.

2. Related Works

The technology for the detection of HTs based on feature recognition has emerged as a focal point of research, attributed to its advantages of low implementation costs, robust detection stability, excellent scalability, and promising commercial applications. In 2017, Salmani H et al. proposed a method based on controllability and observability analysis [10]. They discovered that, after inserting HTs into the circuit under test, the controllability and observability characteristics of the gate-level circuits exhibited significant differences compared to the original circuit gates. Using unsupervised clustering algorithms, they detected HTs based on these characteristic differences. Hasegawa K et al. proposed a detection method based on feature analysis in 2018. They constructed features based on the boundary structure at the interface between normal circuits and Trojan circuits, dividing the boundaries in the given circuit into groups of normal circuits and Trojan circuits, and then performed HT classification [11].
In recent years, machine learning methods have gained increasing popularity. Many researchers have combined these techniques with HT detection methods to improve the detection rates. Hasegawa et al. proposed a method using machine learning to detect HTs in gate-level netlists in 2016 [12]. This approach was further optimized in 2022 by Liakos et al., who introduced a new reinforcement learning model called “GAINESIS”. This was the first HT detection method based on a powerful generative adversarial network (GAN) algorithm [13]. In 2020, R. Sharma et al. proposed an HT detection technique based on XGBoost [14]. By assigning higher weights to minority class samples, this method effectively addressed the overfitting problem caused by imbalanced datasets. In 2022, Negishi R et al. proposed a Trojan probability propagation method, optimizing the XGBoost algorithm to improve the average F-measure [15].
In summary, HT detection technology based on feature recognition has received widespread attention in the academic community and has achieved significant research outcomes. Despite this, the field still holds vast potential for development. Previous research has primarily focused on the feature extraction of HTs and the optimization of detection algorithms, aiming to comprehensively reveal the common characteristics of Trojan circuits and enhance the performance of classification models. However, there has been relatively insufficient exploration of the interactions between nodes in netlists. The question of how to build a more accurate model to describe the circuit structure and functionality of netlists warrants further in-depth research.

3. Proposed Method

The proposed K-Hypergraph is constructed based on the structural features extracted from the netlist, differing from the previously applied hypergraph structures (where gates are nodes and nets are hyperedges). This novel structure calculates the similarity between nodes using the K-NN method, thereby flexibly capturing the complex higher-order relationships among nodes. In this method, K-NN is used as a tool to construct hyperedges, where the neighborhood distance information that it outputs is used to build the adjacency matrix of the hypergraph. The strength of the edges in the hypergraph is represented by the results of a Gaussian distribution. The closer the relative distance between two nodes, the larger the value, indicating higher similarity and a tighter connection between them.
Unlike methods such as graph convolutional networks (GCNs) or graph neural networks (GNNs) that learn through message passing mechanisms, the hypergraph model is trained based on label propagation and residual updates. Label propagation is a semi-supervised learning method that can infer the labels of a large amount of unlabeled data from only a small portion of labeled data. After performing label propagation, the residuals are calculated by comparing the predicted labels with the true labels [16]. These residuals, along with the current weights, are then used to update the weights of the hypergraph. Throughout the training process, the edge weights w of the hypergraph are iteratively adjusted to better fit the data. This enables the model to predict the labels of unknown instances based on known label data, ultimately aiming to identify HT nodes. The entire process is shown in the Figure 3.

3.1. Dataset

The threat model in this paper is based on the assumption that an untrustworthy third-party IP (3PIP) provider implants an HT in the pre-place and route stage. The object of the threat model is a softcore or gate-level IP that can be integrated into a gate-level netlist and used in the final circuit design. In this context, the 3PIP provider is assumed to have the ability to subtly manipulate the design process without detection. By introducing hidden traps at the early stages of the design, such as in the IP core or during routing, the provider can embed malicious functionalities or vulnerabilities within the final design. These HTs are designed to remain undetected during regular functional verification, as they do not interfere with the primary operation of the circuit under normal conditions.
The Trust-Hub Hardware Trojan Library [17], an open-source platform sponsored by the National Science Foundation (NSF) in the United States, offers a variety of Trojan circuits at the physical level, gate level, register transfer level, and board level, facilitating comprehensive communication and resource sharing among researchers. Currently, most research findings in this field are evaluated based on this platform, utilizing the same test benchmarks to verify the reliability of their respective detection methods. Through horizontal comparative analysis, the superiority of their methods is demonstrated.
This study is conducted based on the gate-level HT circuits provided by Trust-Hub. Depending on the type of standard cell library used, the gate-level netlists in the Trust-Hub Trojan library can be broadly divided into two groups. One group is implemented using the Synopsys 90 nm Generic Library (SAED), while the other is implemented using the LEDA 250 nm library. Since the LEDA 250 nm library is relatively outdated, this paper focuses on the SAED-based dataset to analyze the scenario at more advanced process nodes. These gate-level netlists are all written in the Verilog HDL language, and the specific information of the benchmarks used is shown in Table 1.

3.2. Feature Extraction

This paper analyzes, selects, and improves the structural features proposed in the reference [18] (differently, this paper uses gates as nodes instead of nets), as shown in Table 2. Since a single gate in a circuit netlist is almost ineffective on its own, this paper does not discuss all features where x = 1, if such an “x” exists.
This paper argues that the “fan-in-x” feature proposed in the reference [18] is not comprehensive because it does not take the number of fan-outs into account. For example, in the AES encryption algorithm, plaintext undergoes XOR with the key, resulting in a gate-level circuit with a high fan-in number (ranging from 128 or 256 to even 1024), yet it is not a Trojan module. In HTs, a high fan-in number combined with a low fan-out number can achieve an extremely low probability of being triggered.
Therefore, this paper improves upon this by incorporating the number of fan-outs, using the ratio of the 2–5- level fan-in counts to the 1-level fan-out count as four features, denoted as ratio-fan-in-x-fan-out ( 2 x 5 ). The correlation between the fan-in-x and ratio-fan-in-x-fan-out features and the labels (Trojan nodes or normal nodes) is calculated, as shown in Figure 4, and the results show that the correlation between the improved features and labels is increased to varying degrees, with the largest improvement reaching 50%.
Next, this paper calculates the correlation between the features containing “x” and the labels. As illustrated in Figure 5, it is evident that all “out-ff-x” features exhibit a negative correlation. Consequently, this paper eliminates these four features, retaining the remaining twelve. Among the remaining features in the reference [18], this paper selects “in-nearestPI” and “out-nearestPO”, while the others are omitted due to slight repetition with the previously mentioned features.
In addition, there is a type of HT payload circuit with a specific structure, which is the ring oscillator. After this type of HT is activated, it will reduce the performance of the mother circuit, such as s35932-T300, or leak internal information through side channels, such as s38417-T300. The above types of HTs all have long inverter chains on their paths; therefore, the number of inverters contained in the 2–5-level logic gates before and after the target node can be used as a structural feature for the detection of HTs, denoted as in-inv-x and out-inv-x ( 2 x 5 ). There are a total of 30 features, as shown in Table 3. We use Python v3.6 scripts to automate the extraction of netlist features.

3.3. Construction of K-Hypergraph

This paper proposes the construction of a K-Hypergraph model based on the abstraction of structural features. Compared to simple graphs, hypergraphs can more effectively represent complex relationships among data, offering greater expressiveness than simple graph models that can only depict pairwise relationships [19]. By modeling higher-order relationships, hypergraphs are better equipped to filter out noise and anomalous data, thereby enhancing the robustness of the model. In contrast, simple graph structures are more susceptible to the influence of noisy data; if a node is incorrectly labeled, it may propagate erroneous information to its neighboring nodes, thus affecting the learning process of the entire graph.
Unlike traditional hypergraph structures, where gates serve as nodes and nets as hyperedges, the K-Hypergraph model is more adaptable to complex circuit functionalities. It is not constrained by the original circuit structure and can better reflect the underlying relationships between nodes. This flexibility allows the K-Hypergraph to capture intricate interactions within the circuit more accurately, making it particularly suitable for the identification of subtle anomalies such as HT nodes.
A hypergraph can be defined as G ( V , E , W ) , where V represents the set of nodes in the hypergraph, E represents the set of hyperedges, and W represents hyperedge weights.
The K-Hypergraph integrates the benefits of both locality and globality. It captures the fine-grained details of the data while preserving the coherence of the overall structure. By constructing hyperedges based on the nearest neighbors of each node, the K-Hypergraph captures the local structure and patterns inherent in the data. This is particularly valuable in elucidating the internal organization of data. For example, in gate-level netlists, certain nodes may be highly functionally related but are not directly connected in the original structure; the K-Hypergraph can effectively reveal these underlying relationships.
Importantly, the K-Hypergraph’s reliance on the distances to its nearest neighbors also makes it highly sensitive to outliers. During the construction of the hypergraph, outlier points typically struggle to find enough neighbors, leading to their isolation within the K-Hypergraph. This isolation facilitates their identification and subsequent handling, further enhancing the robustness and reliability of the hypergraph model.
Before building the K-Hypergraph model, due to the very small proportion of Trojan nodes in the netlist circuit, there was a significant difference in the number of normal nodes and Trojan nodes, which is known as imbalanced data in machine learning. To address this issue, this paper uses the SMOTE algorithm to balance the data and obtain better classification results.
a.
Choose the distance metric. Firstly, it is necessary to determine a suitable distance metric standard to calculate the similarity or distance between data points. Common metrics include the Euclidean distance, Manhattan distance, etc. This paper calculates the Euclidean distance between every two nodes using node features, as shown in step 2 of Algorithm 1.
b.
Construct hyperedges. For each node i, find its k + 1 nearest neighbors (including itself). Since the netlist is relatively small, we will choose k values from 1 to 10 and evaluate the performance to select the optimal k value. Form a hyperedge e i consisting of node i and its k nearest neighbors and add this hyperedge to the set of hyperedges E, as shown in steps 4∼8 of Algorithm 1.
c.
Calculate the connection weights between nodes and hyperedges. For each neighbor j of node i, compute the Gaussian weight w i j and store it in the weight matrix W. These weights are used to construct the sparse matrix H. The weights reflect the similarity between samples, with closer samples having larger weights, as shown in steps 11∼17 of Algorithm 1.
d.
Initialize the global weights of hyperedges. Assign a global weight w to each hyperedge, initially set to 1, which will be iteratively optimized in the subsequent learning process, as shown in steps 18∼21 of Algorithm 1.
Algorithm 1 Generate K-Hypergraph
  • Input: Dataset X R n × d , number of neighbors k
  • Output: Hypergraph H = ( V , E , W )
    1:
    procedure GenerateK-Hypergraph( X , k )
    2:
          Calculate pairwise Euclidean distance matrix D R n × n
    3:
          Initialize node set V and edge set E
    4:
          for  i = 1 to n do
    5:
                Find the k + 1 nearest neighbors of node i (including itself) from D
    6:
                Let N i be the set of k + 1 nearest neighbors of node i
    7:
                Form a hyperedge e i = { i } N i
    8:
                Add hyperedge e i to the set of hyperedges E
    9:
          end for
    10:
        Initialize the weight matrix W R n × n with zeros
    11:
        for  i = 1 to n do
    12:
              for  j N i  do
    13:
                   Calculate the Gaussian weight w i j = exp D i j 2 σ 2 , where σ 2 = mean ( D )
    14:
                   Set W i j = w i j
    15:
            end for
    16:
        end for
    17:
        Construct the incidence matrix H R n × n
    18:
        for all  e E  do
    19:
              Initialize the weight of each hyperedge to 1
    20:
        end for
    21:
        return Hypergraph H = ( V , E , W )
    22:
    end procedure

3.4. Traning of K-Hypergraph

This paper optimizes the weights of the K-Hypergraph model iteratively to improve the prediction accuracy. In each iteration, label prediction is conducted through label propagation, and the weights are adjusted based on the prediction error until the convergence criterion is met or the maximum number of iterations is reached. The entire process combines label propagation with weight updating mechanisms, and, by repeatedly optimizing the weights, the hypergraph model can effectively perform label inference in semi-supervised learning tasks. During the label propagation or information transmission process, the K-Hypergraph can utilize hyperedges to implement more complex propagation mechanisms. Compared to the propagation based on edges in simple graphs, K-Hypergraph can simultaneously consider interactions among multiple nodes, thereby enhancing the accuracy and efficiency of propagation.
a.
Initialization.
  • Input Data: K-Hypergraph structure, partially known labels y (unlabeled nodes are marked with −1), and regularization parameter λ .
  • Indices of Known and Unknown Nodes:
    Known node indices : K = { i y i 1 }
    Unknown node indices : U = { i y i = 1 }
b.
Label Propagation
  • Initialize Label Matrix: Convert the partially known labels y into a one-hot encoded matrix Y.
  • Compute the θ Matrix: The θ matrix represents the relationships between nodes and is computed based on the hypergraph structure and weights:
    Θ i j = e E H i e H j e w e
    Here, H i e indicates whether node i belongs to hyperedge e, and w e is the weight of hyperedge e.
  • Compute the Laplacian Matrix L: A Laplacian matrix is used to capture the similarities and differences between nodes. The equation is as follows:
    L = I 1 1 + λ Θ
    where I is the identity matrix and λ is the regularization parameter.
  • Compute the Label Propagation Matrix F: Calculate the label propagation matrix F , which is used to propagate known label information to unlabeled nodes. The equation is as follows:
    F = λ + 1 λ L 1 Y
    Here, L 1 is the inverse of the Laplacian matrix.
  • Predict Labels for Unknown Nodes: For each node i, select the category corresponding to the maximum value in the i-th row of F as the prediction label, which is the classification result. The formula is as follows:
    y ^ U = arg max k F U , k
    For each unknown node, the predicted label is the index of the maximum value in the corresponding row of F .
c.
Weight Update
  • Compute Residuals: Compute residuals only for unknown nodes:
    r U = y U y ^ U
    Here, y U represents the true labels of the unknown nodes (initially -1), and y ^ U denotes the predicted labels.
  • Update Weights:
    w new = H T r + λ w
    Here, · denotes the absolute value, and H T is the transpose of the incidence matrix. Check Convergence: If the difference between the new and old weights is less than a threshold ϵ (e.g., 10 6 ), stop the iteration:
    w new w < ϵ
d.
Iteration: Repeat steps 2 and 3 until the maximum number of iterations is reached or convergence is achieved.
e.
Output: The final output includes the predicted labels for the unknown nodes y ^ U and the updated hypergraph weights w.

4. Implementation and Evaluation

In this section, the performance evaluation of the study is presented first, followed by an introduction to the evaluation metrics used, and it concludes with a comparative analysis.

4.1. Evaluation Metrics

In learning with imbalanced data, evaluating the accuracy alone is not enough. For example, if the number of positive samples is 9000 and the number of negative samples is 100, according to Equation (10), even if negative samples are not recognized at all, the accuracy is still 98.9%. This is obviously insufficient to correctly evaluate the performance. Therefore, this paper also uses the TPR, TNR, and balanced accuracy parameters to evaluate the model. They can simultaneously consider the model’s prediction capabilities for both positive and negative classes, avoiding the performance evaluation bias caused by one class having significantly more samples than the other in the dataset. The equations are as follows:
Accuracy = TP + TN TP + FP + FN + TN
TPR = TP TP + FN
TNR = TN TN + FP
Balanced Accuracy = TPR + TNR 2
Among them, TP and TN, respectively, represent the number of correctly classified Trojan nodes and normal nodes. Similarly, the symbol FP represents the number of normal nodes incorrectly classified as Trojan nodes, while FN represents the number of Trojan nodes incorrectly labeled as normal nodes. In our work, the TPR reached 92.12%, the TNR reached 90.23%, and the balanced accuracy reached 91.18%, indicating that our method is a sensitive detection method with significantly improved performance compared to previous gate-level HT detection mechanisms.

4.2. Performance Evaluation

This study adopted the leave-one-out cross-validation (LOOCV) [20] method to obtain the output distribution of each benchmark. In each iteration of the evaluation process, one benchmark was selected as the test sample, and the remaining benchmarks were used as training samples. Finally, we evaluated the selected benchmark. We repeated this iteration for each benchmark test. Table 4 shows the evaluation results in terms of the TPR, TNR, and ACC, indicating that our model has balanced accuracy of 91.18% in detecting Trojan nodes, with a true positive rate of 92.12% and a true negative rate of 90.23%.

4.3. Experimental Analysis and Comparison

This paper compares the detection results with those of other existing studies, as shown in Table 5.
Reference [21] proposes new hardware Trojan features based on the structure of trigger circuits and used random forest for classification. The paper focuses on extracting node features but does not consider the interactions between nodes. The average TPR of the mentioned model is only 58.143%.
Reference [22] converts the gate-level netlist into an undirected graph (a simple graph), extracts structural features, and uses a GCN to classify the nodes in the gate-level netlist. While the simple graph considers the interactions between nodes, it is limited to binary relationships. The relationships among nodes in the netlist are actually complex and multi-relational, and this treatment might result in the loss of information. Although the average TPR in [22] reached 95.05%, its average TNR was relatively low, at only 82.28%, with a false positive rate of 17.72%. In practical applications, such a high false positive rate would lead to unnecessary inspections, tests, or even chip replacements. These processes consume significant amounts of time and resources, including human, material, and financial resources.
Reference [20] converts the circuit netlist into an edge-attribute undirected graph (EAUG) and performs classification using graph attention networks (GATs), message passing neural networks (MPNNs), and graph isomorphism networks (GINs), aggregating features through node neighborhood information. However, this model essentially remains a simple graph, and the highest TPR value reached is 89%. Reference [23] is based on graph theory and machine learning, achieving hardware Trojan detection and diagnosis through a maximal set of connected subgraphs (MSOS) and feature extraction. They propose an MSOS sub-module partitioning algorithm to address the non-uniqueness issue of sub-module partitioning. By treating each MSOS as a whole, features are extracted and fed into a machine learning model to obtain classification results. The TPR exceeds 95%, and the TNR surpasses 37%. While the TPR is exceptionally high, with most hardware Trojan nodes being detected, the false positive rate is as high as 60%, resulting in balanced accuracy of only 66%. Thus, it might be challenging to apply this model in real-world scenarios. As the specific TPR values for each benchmark circuit are not provided, they are not displayed in Table 5.
Reference [24] evaluated various ensemble learning models and conducted feature optimization and hyperparameter tuning, providing directions for multi-model fusion. Reference [15] used a gradient boosting decision tree (GBDT) model for hardware Trojan detection and systematically compared XGBoost, LightGBM, and CatBoost, eventually identifying XGBoost as the best model. However, these papers focus on detection algorithms and do not consider the interactions and connection relationships between nodes. The average TPR within [15,24] failed to reach 80%, indicating that the detection accuracy still needs improvement.
The TPR and TNR values obtained by the method proposed in this paper are average. As shown in Table 6, the average balanced accuracy of the method proposed in this paper reaches 91.18%. Compared with previous methods, this paper provides a new and optimal compromise solution for HT detection.
Table 5. Comparison of TPR and TNR.
TPR (%)TNR (%)
BenchmarkThis Paper[21][22][24][15]This Paper[21][22][24][15]
RS232-T100010010010010010010010084.369999.7
RS232-T110010010010010010099.5110084.3100100
RS232-T120092.8610010010010099.5110084.7799.7100
RS232-T130010085.710010010099.5110084.3699.7100
RS232-T140010010010010010010010084.3699.7100
RS232-T150010010010010010010099.784.7799.799.4
RS232-T160091.6777.810010088.992.169984.0299.499.7
S15850-T10085.197.710092.369.253.0210080.9399.9100
S35932-T10093.337.710030.884.699.2710080.19100100
S35932-T20083.338.370.59258.398.7110080.13100100
S35932-T30077.7891.910097.391.989.2910080.45100100
S38417-T10083.339.191.6772.781.892.0210080.15100100
S38417-T20093.339.110072.727.387.1310080.20100100
S38584-T10088.8916.768.4216.716.753.1410080.13100100
Average92.1258.1495.0579.1176.3490.2399.9182.2899.7999.91

5. Conclusions

This paper introduces a K-Hypergraph model based on gate-level structural feature abstraction for the detection of hardware Trojans. Compared to simple graphs, hypergraphs can capture higher-level relationships among nodes; moreover, unlike traditional netlist hypergraph models that are confined to the original circuit structure, the K-Hypergraph leverages the similarity between nodes for its modeling approach. This enables it to better reflect the underlying relationships among nodes. After learning the structure of the K-Hypergraph, the method achieves a superior balance of accuracy and a lower false positive rate in hardware Trojan detection.

Author Contributions

Conceptualization, J.H.; methodology, B.L.; validation, Q.Z.; writing—original draft preparation, B.L.; writing—review and editing, J.H.; supervision, Y.Z. All authors have read and agreed to the published version of the manuscript.

Funding

This work is supported by the National Key R&D Program of China under Grant 2023YFB4403000.

Data Availability Statement

No data are contained within this article.

Conflicts of Interest

The authors declare no conflicts of interest.

References

  1. Bhunia, S.; Hsiao, M.S.; Banga, M.; Narasimhan, S. Hardware Trojan attacks: Threat analysis and countermeasures. Proc. IEEE 2014, 102, 1229–1247. [Google Scholar] [CrossRef]
  2. Tehranipoor, M.; Koushanfar, F. A survey of hardware Trojan taxonomy and detection. IEEE Des. Test Comput. 2010, 27, 10–25. [Google Scholar] [CrossRef]
  3. Chakraborty, R.S.; Narasimhan, S.; Bhunia, S. Hardware Trojan: Threats and emerging solutions. In Proceedings of the 2009 IEEE International High Level Design Validation and Test Workshop, San Francisco, CA, USA, 4–6 November 2009; pp. 166–171. [Google Scholar]
  4. Wu, T.F.; Ganesan, K.; Hu, Y.A.; Wong, H.S.P.; Wong, S.; Mitra, S. TPAD: Hardware Trojan prevention and detection for trusted integrated circuits. IEEE Trans. Comput.-Aided Des. Integr. Circuits Syst. 2016, 35, 521–534. [Google Scholar] [CrossRef]
  5. Bhunia, S.; Abramovici, M.; Agrawal, D.; Bradley, P.; Hsiao, M.S.; Plusquellic, J.; Tehranipoor, M. Protection Against Hardware Trojan Attacks: Towards a Comprehensive Solution. IEEE Des. Test 2013, 30, 6–17. [Google Scholar] [CrossRef]
  6. Landwehr, C.E.; Bull, A.R.; McDermott, J.P.; Choi, W.S. A taxonomy of computer program security flaws. Acm Comput. Surv. 1994, 26, 211–254. [Google Scholar] [CrossRef]
  7. Iranfar, P.; Amirany, A.; Moaiyeri, M.H. Power Attack-Immune Spintronic-Based AES Hardware Accelerator for Secure and High-Performance PiM Architectures. IEEE Trans. Magn. 2025, 61, 3400612. [Google Scholar] [CrossRef]
  8. Oya, M.; Shi, Y.; Yanagisawa, M.; Togawa, N. A score-based classification method for identifying hardware-trojans at gate-level netlists. In Proceedings of the Design, Automation & Test in Europe Conference & Exhibition, Grenoble, France, 9–13 March 2015; ACM: New York, NY, USA, 2015; pp. 465–470. [Google Scholar]
  9. Gao, Y.; Feng, Y.; Ji, S.; Ji, R. HGNN+: General Hypergraph Neural Networks. IEEE Trans. Pattern Anal. Mach. Intell. 2022, 45, 3181–3199. [Google Scholar] [CrossRef] [PubMed]
  10. Salmani, H. COTD: Reference-Free Hardware Trojan Detection and Recovery Based on Controllability and Observability in Gate-Level Netlist. IEEE Trans. Inf. Forensics Secur. 2017, 12, 338–350. [Google Scholar] [CrossRef]
  11. Hasegawa, K.; Yanagisawa, M.; Togawa, N. A hardware-classification method utilizing boundary net structures. In Proceedings of the 2018 IEEE International Conference on Consumer Electronics (ICCE), Las Vegas, NV, USA, 12–14 January 2018; IEEE: Piscataway, NJ, USA, 2018; pp. 1–4. [Google Scholar]
  12. Hasegawa, K.; Oya, M.; Yanagisawa, M.; Togawa, N. Hardware trojans classification for gate-level netlists based on machine learning. In Proceedings of the 2016 IEEE 22nd International Symposium on On-Line Testing and Robust System Design (IOLTS), Sant Feliu de Guixols, Spain, 4–6 July 2016; IEEE: Piscataway, NJ, USA, 2016; pp. 203–206. [Google Scholar]
  13. Liakos, K.G.; Georgakilas, G.K.; Plessas, F.C.; Kitsos, P. Gainesis: Generative artificial intelligence netlists synthesis. Electronics 2022, 11, 245. [Google Scholar] [CrossRef]
  14. Sharma, R.; Valivati, N.K.; Sharma, G.K.; Pattanaik, M. A New Hardware Trojan Detection Technique using Class Weighted XGBoost Classifier. In Proceedings of the 2020 24th International Symposium on VLSI Design and Test (VDAT), Bhubaneswar, India, 23–25 July 2020. [Google Scholar]
  15. Negishi, R.; Kurihara, T.; Togawa, N. Hardware-Trojan Detection at Gate-level Netlists using Gradient Boosting Decision Tree Models. In Proceedings of the 2022 IEEE 12th International Conference on Consumer Electronics (ICCE-Berlin), Berlin, Germany, 2–6 September 2022; pp. 1–6. [Google Scholar] [CrossRef]
  16. Roopa, S.N.; Sathya, D.; Sudha, V. Label Propagation from Laplacian Score for Semi-Supervised Attribute Selection. In Proceedings of the 2021 International Conference on Artificial Intelligence and Smart Systems (ICAIS), Coimbatore, India, 25–27 March 2021; pp. 537–542. [Google Scholar] [CrossRef]
  17. Trust-Hub.org. (n.d.). Available online: https://www.trust-hub.org/ (accessed on 12 March 2025).
  18. Hashemi, M.; Momeni, A.; Pashrashid, A.; Mohammadi, S. Graph Centrality Algorithms for Hardware Trojan Detection at Gate-Level Netlists. IJE 2022, 35, 1375–1387. [Google Scholar] [CrossRef]
  19. Zhou, D.; Huang, J.; Schölkopf, B. Learning with hypergraphs: Clustering, classification, and embedding. In Advances in Neural Information Processing Systems; MIT Press: Cambridge, MA, USA, 2006; Volume 19. [Google Scholar]
  20. Hasegawa, K.; Yamashita, K.; Hidano, S.; Fukushima, K.; Hashimoto, K.; Togawa, N. Node-wise Hardware Trojan Detection Based on Graph Learning. TC 2023, 74, 749–761. [Google Scholar] [CrossRef]
  21. Kurihara, T.; Togawa, N. Hardware-Trojan Classification based on the Structure of Trigger Circuits Utilizing Random Forests. In Proceedings of the 2021 IEEE 27th International Symposium on On-Line Testing and Robust System Design (IOLTS), Torino, Italy, 28–30 June 2021; pp. 1–4. [Google Scholar] [CrossRef]
  22. Imangholi, A.; Hashemi, M.; Momeni, A.; Mohammadi, S.; Carlson, T.E. FAST-GO: Fast, Accurate, and Scalable Hardware Trojan Detection using Graph Convolutional Networks. In Proceedings of the 2024 25th International Symposium on Quality Electronic Design (ISQED), San Francisco, CA, USA, 3–5 April 2024; pp. 1–8. [Google Scholar] [CrossRef]
  23. Wang, J.; Zhai, G.; Gao, H.; Xu, L.; Li, X.; Li, Z.; Huang, Z.; Xie, C. A Hardware Trojan Detection and Diagnosis Method for Gate-Level Netlists Based on Machine Learning and Graph Theory. Electronics 2024, 13, 59. [Google Scholar] [CrossRef]
  24. Negishi, R.; Togawa, N. Evaluation of Ensemble Learning Models for Hardware-Trojan Identification at Gate-level Netlists. In Proceedings of the 2024 IEEE International Conference on Consumer Electronics (ICCE), Las Vegas, NV, USA, 6–8 January 2024; pp. 1–6. [Google Scholar] [CrossRef]
Figure 1. HT structure diagram.
Electronics 14 01902 g001
Figure 2. Comparison between hypergraph and simple graph.
Electronics 14 01902 g002
Figure 3. Flow chart of method proposed in this paper.
Electronics 14 01902 g003
Figure 4. Correlations between the fan-in-x, ratio-fan-in-x-fan-out, and the labels.
Electronics 14 01902 g004
Figure 5. Correlations between the features and the labels.
Electronics 14 01902 g005
Table 1. Benchmarks used in this paper.
BenchmarksTrigger StructureTrigger Probability or ConditionEffects
RS232-T1000Combination comparator 3.55 × 10 13 Change function
RS232-T1100Timing comparator 3.55 × 10 13 Change function
RS232-T1200Timing comparator 5.00 × 10 11 Change function
RS232-T1300Combination comparator 8.00 × 10 10 Change function
RS232-T1400Timing comparator 5.20 × 10 15 Change function
RS232-T1500Timing comparator 3.55 × 10 13 Change function
RS232-T1600Timing comparator 5.77 × 10 9 Change function
S15850-T100Combination comparatorTriggered only in functional modeChange function, refuse service
S35932-T100ComparatorTriggered only in functional modeChange function, leak information
S35932-T200ComparatorTriggered only in functional modeDenial of service
S35932-T300ComparatorTriggered only in functional modeDenial of service, reduced performance
S38417-T100Comparator 1.42 × 10 70 Change function, refuse service
S38417-T200Comparator 1.66 × 10 44 Change function, refuse service
S38584-T100ComparatorTriggered only in functional modeChange function, refuse service
Table 2. Structural features in [18].
Feature ( 1 x 5 )Description
fan-in-xthe number of fan-ins up to x-level away from net n
in-ff-x (out-ff-x)the number of flip-flops up to x-level away from the input (output) side of net n
in-mux-x (out-mux-x)the number of multiplexers up to x-level away from the input side and output side of net n
in-nearestff (out-nearestff)the levels of the nearest flip-flops from the input (output) side of net n
in-nearestmux (out-nearestmux)the level of the nearest multiplexers from the input side and output side of net n
in-nearestPI (out-nearestPO)the minimum levels from net n to any primary inputs (PI) (primary outputs (PO))
Table 3. Structural features utilized in this paper.
Feature ( 2 x 5 )Description
Ratio-fan-in-x-fan-outthe ratio of the number of x-level fan inputs to the number of 1-level fan outputs of a node
In-ff-xthe number of flip-flops up to x-level away from the input side of gate n
In (Out)-mux-xthe number of multiplexers up to x-level away from the input side and output side of gate n
In (Out)-inv-xthe number of inverters up to x-level away from the input side and output side of gate n
In-nearestPIthe minimum levels from gate n to any PI
Out-nearestPOthe minimum levels from gate n to any PO
Table 4. Classification results of this study.
BenchmarkTPR/%TNR/%
RS232-T1000100100
RS232-T110010099.51
RS232-T120092.8699.51
RS232-T130010099.51
RS232-T1400100100
RS232-T1500100100
RS232-T160091.6792.16
S15850-T10085.1953.02
S35932-T10093.3399.27
S35932-T20083.3398.71
S35932-T30077.7889.29
S38417-T10083.3392.02
S38417-T20093.3387.13
S38584-T10088.8953.14
Average92.1290.23
Table 6. Comparison of average balanced accuracy.
BenchmarkThis Paper[21][22][24][15][23]
Average Balanced
Accuracy
91.1879.0388.6689.4588.1366
Disclaimer/Publisher’s Note: The statements, opinions and data contained in all publications are solely those of the individual author(s) and contributor(s) and not of MDPI and/or the editor(s). MDPI and/or the editor(s) disclaim responsibility for any injury to people or property resulting from any ideas, methods, instructions or products referred to in the content.

