Abstract
Ensuring the security and reliability of lithium-ion batteries necessitates the development of a robust methodology for detecting defects in battery separators during production. This study initially uses data augmentation techniques in the data processing phase, followed by the utilization of the weighted random sampler method for sampling. Additionally, the dataset is partitioned using the Stratified K-Fold cross-validation method to tackle imbalanced sample data. Subsequently, an ensemble of object detection algorithms involving Faster Region Convolutional Neural Network and RetinaNet is developed. The ensemble method employs a voting mechanism to ascertain the most accurate predictions and utilizes the Adaptive Delta optimization algorithm with adaptive learning rates. This algorithm adjusts the learning rate based on parameter change rates, eliminating the requirement for setting an initial learning rate to ensure result convergence. Finally, a model fine-tuning technique using pre-training transfer learning is applied to improve the detection performance of the ensemble model. Experimental results show that the improved methodology demonstrates a 16.26% increase in recall, a 7.05% improvement in precision, an 11.83% rise in balanced F Score, and a 0.23 increase in the area under the Receiver Operating Characteristic curve. The study results indicate that the proposed method is an effective and accurate approach to detecting defects in lithium-ion battery separators.
1. Introduction
Escalating concerns over environmental pollution, global warming, and energy shortages have led to a heightened focus on exploring and harnessing alternative energy sources. The global drive to address the energy crisis and reduce greenhouse gas emissions is propelling the shift from fuel-based vehicles to new energy vehicles [1,2]. In the field of new energy vehicles, with the extensive production and adoption of lithium-ion batteries, the industry has placed a significant emphasis on the safety and reliability of power batteries [3]. The lithium-ion battery diaphragm, a critical battery component, often undergoes insufficient inspection for potential defects that could compromise battery performance, lifespan, or even lead to safety accident [4,5]. These issues can significantly impact both personal safety and property integrity. Therefore, identifying surface defects is vital for enhancing industrial product quality control and production efficiency. Detecting surface defects [6] in industrial products and their components holds paramount importance.
Batteries have better anti-aging properties to maintain a long service life, and the quality control of the battery directly affects its service life and battery safety. Therefore, it is particularly important to monitor and detect defects in the production process of each component of lithium-ion batteries, which is the basis for the development of high-quality, reliable batteries, and also to minimize the occurrence of thermal runaway batteries and other safety issues that affect the use of the battery. The composition of the power battery comprises four constituent elements; the positive and negative electrodes, as well as the electrolyte and diaphragm are the key components of the device. The diaphragm plays a pivotal role in separating the positive and negative electrodes, thereby preventing the unregulated flow of electrons during the charging and discharging processes. It also facilitates the unrestricted movement of lithium ions within the electrolyte. During the manufacturing process, the diaphragm undergoes a series of complex physical changes, including mixing, stirring, extrusion, stretching, blowing, and cutting, which result in the final structure and characteristics of the diaphragm [7]. In the context of battery manufacturing, the process is susceptible to the introduction of various defect types. The current research focus on battery defect detection is primarily oriented towards the following areas: the surface of the cell [8], the electrode coating [9], the battery case [10], and foreign object defects [11]. Additionally, there are studies underway investigating the detection of defects in the pore closure of the battery diaphragm [12]. However, there is a paucity of research on the detection of defects in the appearance of the diaphragm. This research lacuna represents a significant research gap that merits attention.
Research on industrial product appearance defect detection has evolved over almost half a century since its inception in the 1980s. In the field of lithium-ion battery inspection research, deficiencies in the battery production process, such as inadequate battery voltage or friction with production equipment, can lead to internal or external battery defects [13]. Detecting these defects is a vital component of the production process [14]. Initially, battery manufacturers used manual inspection techniques to detect defects during battery testing. However, manual inspection has inherent limitations like inefficiency, high costs, and a tendency to miss or misidentify defects. Additionally, different inspectors may adhere to varying standards, introducing inconsistency in the inspection process [15]. Manufacturers urgently require an automated defect detection method to enhance detection efficiency and lower costs. In the early stages of this field of research, conventional machine learning-based methodologies were utilized for the identification of anomalous samples. Exemplary illustrations of such methodologies encompass the utilization of support vector machines [16,17], K-nearest neighbor algorithms [18], and artificial neural networks [19], as proposed by Zhong et al., Dupont et al. and Bustillo et al., respectively. In the context of traditional defect detection algorithms, feature extractors are designed with the objective of extracting features that were specified by humans. These features can be extracted based on the histogram proposed by Luo et al. [20], the local binary pattern proposed by Song et al. [21], the wavelet transform proposed by Jeon et al. [17], and the scale invariant feature transform (SIFT) proposed by Ngo et al. [22]. Subsequently, these features are utilized for classification purposes once extracted. Nevertheless, two primary factors limit the effectiveness of traditional machine learning methods in industrial surface defect detection. On the one hand, the extraction of specific features [23] is susceptible to variability caused by factors like image quality and color variations. On the other hand, the application of traditional machine learning algorithms is limited by their task-specific nature, which consequently results in poor model generalization. In contrast, deep learning models circumvent the impact of manually extracted features in end-to-end training methods. Furthermore, the utilization of big data-driven training strategies guarantees model generalizability.
The advancement of deep learning and convolutional neural networks has led to an increasing application of target detection algorithms in visual inspections for industrial surface defects [24]. The supervised framework for detecting industrial surface defects is centered around convolutional neural networks (CNNs) and consists of two main research directions. Firstly, more robust CNN models are developed to enhance the accuracy and generalizability of industrial surface defect detection [25,26,27]. Secondly, there are recognition networks tailored for particular recognition tasks. These encompass networks optimized for small-size defect detection through feature refinement modules proposed by Dong et al. [28], a feature layer fusion-focused network for enhanced multi-scale target detection by Zeng et al. [29], and the implementation of appropriate sampling and training strategies to mitigate imbalanced data [30,31] by Wan et al., among others. Girshick et al. [32] introduced algorithms for two-stage target detection using the Region-based Convolutional Neural Network (R-CNN) [33]. This algorithm utilizes deeply convolved features to create candidate frames for eigenvalue extraction, which are subsequently fed into a classifier for classification and recognition through the Selective Search (SS) method proposed by Uijlings et al. [34]. However, the training process is intrinsically slow and complex, making it incapable of reaching the globally optimal solution. Girshick et al. [35] proposed the Fast R-CNN algorithm, which, unlike the previous method, conducts convolution operations on individual candidate regions rather than convolving the entire image, thus eliminating redundant computations. The original method of generating candidate regions is time-consuming. To address this, Ren et al. introduced the Region Proposal Network (RPN) [36] based on Fast R-CNN to overcome the bottleneck of extracting candidate frames from the original Fast R-CNN. The RPN replaces the traditional selective search algorithm to extract feature candidate frames, resulting in time savings. Wang et al. proposed the You Only Look Once (YOLO) algorithm [37] and Liu et al. proposed the Single Shot Multi Box Detector (SSD) algorithm [38], which have significantly advanced target detection in terms of image testing speed. However, the YOLO algorithm struggles with poor localization and challenges in detecting dense scenarios and small targets. The SSD algorithm is based on Visual Geometry Group 16-layer network (VGG16), and incorporating an additional convolutional layer to enhance the feature map enables precise model detection. While it performs similarly to the YOLO algorithm in speed for detecting typical targets and matches Faster Region Convolutional Neural Network (Faster R-CNN) in detection accuracy, its capability in detecting small targets remains limited compared to Faster R-CNN, leading to the issue of lost information in feature extraction. The issue of missing information in feature extraction persists. By experimental data characteristics and related relevant research algorithms, this study leverages a limited dataset that simplifies feature location and category labeling. The benefits of a supervised defect detection model surpass the drawbacks, leading to improved defect detection in lithium-ion battery diaphragms. The primary contributions of this study encompass the following three facets:
(1) Propose incorporating data augmentation alongside the Weighted Random Sampler method for data loading and the Stratified K-Fold cross-validation technique for dataset partitioning to ensure balanced category representation.
(2) Introduce a pre-training–fine-tuning transfer learning approach for detecting lithium-ion battery diaphragm defects to address the challenge of learning from a limited sample size.
(3) Suggest integrating Faster R-CNN and RetinaNet models for target detection, employing transfer learning techniques, and utilizing a voting method to optimize prediction results. This strategy aims to enhance the detection accuracy of the battery diaphragm surface defect detection model and minimize defect leakage and misdetection, thereby improving the efficacy of the surface defect detection task.
This study innovatively proposes a migration learning method for power battery diaphragm defect detection, which can effectively solve the problem of sample category imbalance through improved data sampling methods and subsequent cross-validation. The enhanced target detection algorithm, leveraging transfer learning, can accurately identify defects in the small sample lithium-ion battery diaphragm dataset that has not been previously trained in the target detection model. Finally, the detection performance is improved by the voting method of model integration. Therefore, investigating battery diaphragm surface defects using the devised detection algorithm holds practical engineering significance for battery production and manufacturing processes.
2. Materials and Methods
2.1. Transfer Learning
In the context of lithium battery diaphragm production, advancements in automation and the refinement of manufacturing processes have led to a significant reduction in the number of defect samples requiring inspection. This development has potential implications for the efficacy of the detection algorithm, as it may necessitate the identification of novel defect categories. The limited dataset of lithium-ion battery diaphragm defects, coupled with an imbalance between defective and normal samples, hinders direct training of the datasets for optimal performance and predictions in the target detection model. Instead, employing transfer learning [39] can leverage past experiences from a pre-trained model’s source domain to enhance learning and performance in the target domain. With diaphragm defects in both the source and target domains labeled accordingly in a trained model, transfer learning via model pre-training can be directly implemented in the target domain followed by fine-tuning. Fine-tuning prevents training the network anew for a fresh task, thus saving time and cost. Pre-trained models typically operate on extensive datasets, akin to augmenting training data, enhancing model robustness, and generalization. Fine-tuning is straightforward, requiring focus solely on the target task, as depicted in Figure 1 illustrating the pre-training-fine-tuning workflow. Therefore, this study employs the model pre-training transfer learning methodology to fine-tune the lithium-ion battery diaphragm defect detection model, aiming to meet the detection objectives.
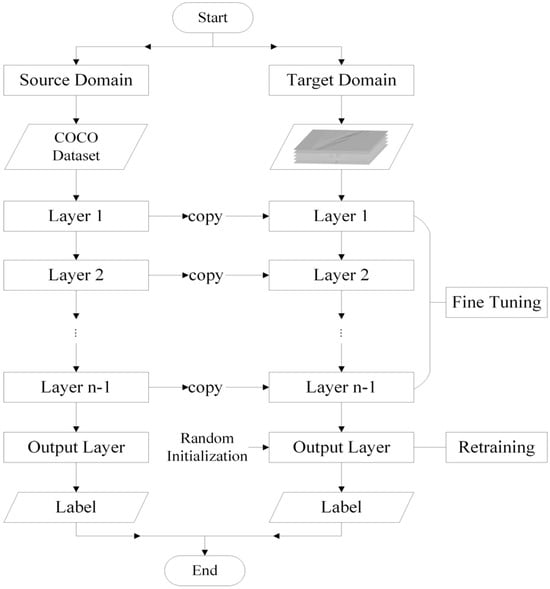
Figure 1.
Pre-training–fine-tuning process for transfer learning.
The transfer process outlined in this paper, based on the pre-training–fine-tuning method, is depicted in Figure 2. Initially, the input images undergo preprocessing steps involving size standardization, image rotation, and normalization. Normalization employs the same mean and standard deviation as in the pre-trained model training. Subsequently, the pre-trained network model’s architecture is acquired, along with weights trained on a large dataset. The last fully connected layer of the pre-trained model is removed. The preserved pre-trained model links to a fresh initialization layer with randomly set weights to ensure consistency in neuron count between the final layer and predicted categories. The weights of the retained pre-trained model are frozen to prevent them from being updated during backpropagation. However, the weights of the new initialization layer and the output layer are adjustable, allowing updates according to the processed lithium-ion battery separator dataset. The training epochs are increased and the trainable parameters are updated to further tune the model.
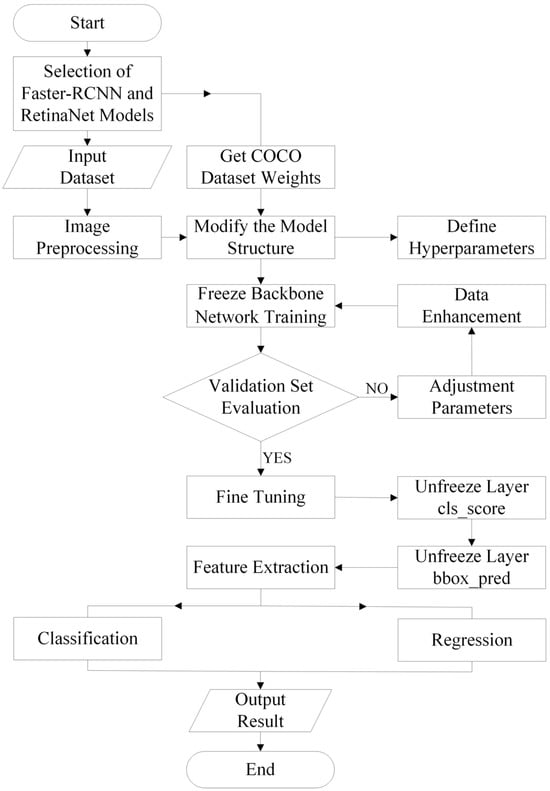
Figure 2.
Transfer Learning Process.
2.2. Pre-Trained Model
The Faster R-CNN model typically consists of three main components. Initially, it extracts features from input images through a convolutional neural network. These extracted convolutional features are then used as input to the RPN to generate region proposals and bounding boxes. Finally, a regressor corrects target positions based on anchor points of the bounding boxes, while a classifier distinguishes objects within the boxes as belonging to the target class or background. The holistic structure of the Faster R-CNN model is illustrated in Figure 3. The RPN substitutes the Selective Search algorithm of R-CNN and executes two primary functions: classification to ascertain the presence of targets within predefined anchors and bounding box regression to enhance anchor precision for more precise proposals. Following this, Region of Interest Pooling (ROI Pooling) assembles’ bounding box coordinates, generated by RPN, extract features from maps, perform pooling procedures, adjust bounding box sizes per region, and transfer region bounding box data to the network’s fully connected layers for classification and regression tasks.
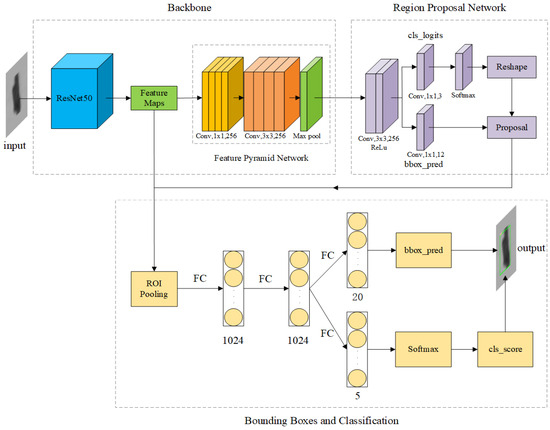
Figure 3.
The structure of the Faster R-CNN model.
The RetinaNet model primarily comprises a Residual Network (ResNet) backbone network, a Feature Pyramid Network (FPN), a classification sub-network, and a bounding box regression sub-network. The structure of the RetinaNet model is illustrated in Figure 4, where the backbone network incorporates ResNet and FPN for target feature extraction. The classification and bounding box regression sub-networks handle target classification and position regression utilizing the feature maps. Single-stage object detection methods, which lack the candidate region generation step, often face challenges with hard-to-easy sample imbalances during target prediction with anchor points. This imbalance can lead to suboptimal network optimization and impact model training on defective samples. The RetinaNet model effectively tackles class imbalance through Focal Loss. By managing the weights of hard and easy samples, it diminishes the influence of easy samples on the classification loss function, widens the loss spectrum for misclassified hard samples, evens out the contribution of positive and negative samples in the classification process, thereby enhancing detection performance. The detailed specifics are provided below:
where pt represents the score for predicting box classification, α is the parameter used to control the balance between positive and negative samples. Its value is set to 0.25. γ signifies the modulating factor parameter, established at 2, aimed at diminishing the influence of easily classifiable samples during the learning process.
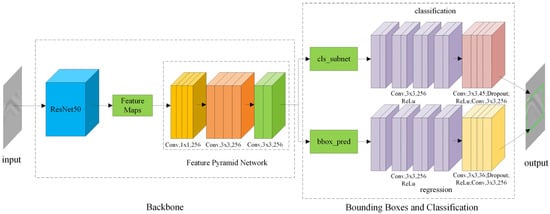
Figure 4.
The structure of the RetinaNet model.
This section details enhancements to the detection algorithm of the Faster R-CNN. Transfer learning was utilized to fine-tune the network using weights trained on the COCO dataset for Faster R-CNN-ResNet50-fpn. The model was frozen to retain pre-trained weights, the convolutional layer of the final RPN module was unfrozen, the classification and regression were modified according to the number of battery diaphragm defects categories. Sub-network, due to the irregular shape and size of the battery diaphragm defects and the high similarity between the categories, after continuously adjusting the parameters to optimize the model, modify the final output features for the battery diaphragm defect categories to ensure that the final number of classification categories is the same as the number of categories in the power battery diaphragm dataset. Additionally, an L2 regularization coefficient was introduced to mitigate overfitting. The pre-training model is based on the COCO dataset mainly for large-scale generic feature learning, which learnt the visual features of various objects, such as people, animals, vehicles and so on. These generic features have some generalization ability for the target detection task, which can help the network converge faster and achieve better results in new tasks. Meanwhile, the images in the COCO dataset contain rich low-level features, such as edges, textures, etc., which can help the model to better understand the image content, including the features of battery diaphragm defects. Finally, Faster -RCNN, as a classical target detection framework, has been trained and validated on the COCO dataset, and has been shown to perform well on generic target detection tasks. However, variability in content and size persists between the source and target domains. Specifically, COCO contains natural scene objects, while diaphragm defects exhibit microtexture features and low contrast characteristics. Additionally, COCO targets exhibit variability in scale, while diaphragm defects are typically sub-millimeter localized features. Consequently, to mitigate the inter-domain variability, the COCO images undergo a series of modifications during data preprocessing, including grayout, contrast enhancement, and high-frequency filtering. These modifications are designed to simulate the imaging characteristics of diaphragm defects. The strategy of progressive fine-tuning is adopted to learn the generic target detection capability based on the COCO initialization model. Fine-tuning is performed on a small amount of diaphragm defect labeling data to optimize the classification head and RPN. These results demonstrate that the aforementioned method can better reduce the variability between the source domain and the target domain. Furthermore, it can achieve the cross-domain migration effect of migration learning and the experimental requirements of diaphragm defect detection.
Due to the imbalanced distribution of categories in the dataset, with ratios of defect categories (bubbles, stains, wrinkles, composite bubbles) to normal samples being 0.082:0.068:0.070:0.077:1, the ratio of hard-to-easy sample categories approached 1:13. To tackle data imbalance, data augmentation was applied during data loading, and sampling utilized the Weighted-RandomSampler method. This method calculates the ratio of samples in each category to the total dataset size, assigning probability weights to each sample for sampling. This approach increases the sampling probability for samples from categories with fewer instances, ensuring a balanced input of category samples for model training. Consequently, the final ratio of input images for each category was modified to 0.83:0.82:0.91:1:0.79. In this section, the dataset was divided using the Stratified K-Fold cross-validation method. Stratified K-Fold, unlike standard K-Fold cross-validation, aids in preventing imbalances in data categories that may arise from random splits. In Stratified K-Fold, the data are first categorized, and then each category is divided into 3 folds. The specific process is illustrated in Figure 5, which shows how Stratified K-Fold cross-validation preserves the distributional characteristics of each category in the original data and better reflects the real situation in the case of imbalanced samples. This ensures that the model encounters samples from all categories in each fold, facilitating a better evaluation and comparison of different model performances. Similarly, ResNet50 served as the backbone network for RetinaNet. Transfer learning was applied for fine-tuning, obtaining pre-trained weights and freezing the model, while unfreezing the fully connected layers of the final classification head. The NMS threshold of the model was set to 0.3 for improved accuracy in predicting smaller targets. Furthermore, the Faster R-CNN model was integrated with the RetinaNet model. By utilizing a basic voting method, the predictions from the two fundamental models were merged to determine the final prediction. Based on the majority voting principle, the class that received the most votes was selected as the final prediction to enhance detection performance. Voting capitalizes on the strengths of various models, considering predictions from different models holistically to attain more consistent and precise results. As the backbone network of the pre-trained model using migration learning has been validated for broad applicability of the model under a large model, the use of fine-tuning techniques can be well generalized to the field of battery diaphragm defects under study, and therefore the network model approach is similarly able to be tailored to new defect classes after adjusting the parameters and other fine-tuning methods, and is able to support the extension of subsequent research to defect detection studies in other materials.
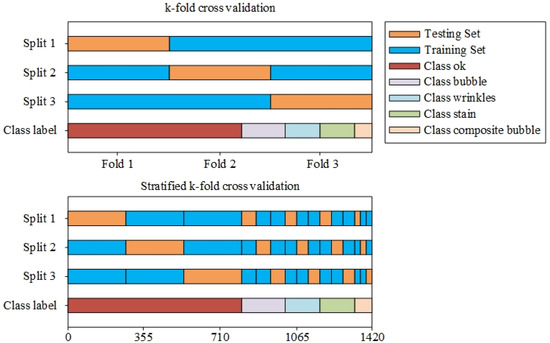
Figure 5.
Comparison of Stratified K-Fold and K-Fold Cross Validation.
The model underwent training utilizing the Adaptive Delta (AdaDelta) optimization algorithm featuring adaptive learning rates. Unlike traditional methods, AdaDelta eliminates the necessity of setting an initial learning rate, dynamically adjusting it based on parameter changes for convergence. Moreover, AdaDelta integrates a decay mechanism to counteract in Equations (3)–(5):
where ut is the exponentially decaying moving mean square (RMS), Vt is the second-order momentum of the current step, ε is a coefficient that increases the stability of the denominator, gt is the gradient of the current step, α is the learning rate, is the second-order momentum of the previous step, and β is the decay rate of the historical second-order momentum.
2.3. Loss Functions
The loss function of Faster R-CNN consists of two parts: (1) the classification loss and bounding box regression loss of the region network; (2) the classification loss and the loss of correcting the detection bounding box position. The loss function can be defined by the following Formula (6):
where pi denotes the probability that the ith anchor is predicted to be a true label, when is 1 which it is a positive sample and 0 which it is a negative sample, ti denotes the bounding box regression parameter that predicts the ith anchor, denotes the GTBox corresponding to the ith anchor, denotes the number of all the samples in a mini-batch, denotes the number of anchor positions, and λ denotes the weighting coefficient, The value of λ is the ratio of to . denotes the classification loss, (, ) denotes the logarithmic loss between the detected object and the non-target, and its calculation formula is shown in Equations (7) and (8):
The loss function of the RetinaNet model is defined by Equation (9):
where denotes Sigmoid Focal Loss, denotes L1 Loss, denotes the number of positive samples, i denotes all positive and negative samples, and j denotes all positive samples.
3. Results
3.1. Experimental Part
3.1.1. Experimental Equipment
All models in this study were trained in an environment with an RTX4060Ti graphics card, i5-12400F CPU, 16 GB of video memory, and 32 GB of RAM. The deep learning frameworks were Pytorch 1.12.0, CUDA 11.3, and NVIDIA CUDA Deep Neural Network Library (cuDNN) 8.9.7.
3.1.2. Data Processing
The text discusses the dataset utilized in the study, consisting of images taken from the production line of lithium-ion battery separator manufacturing. In the manufacturing process of the electric core, the positive and negative pole pieces and the diaphragm are coiled or laminated layer by layer and then encapsulated, and the electrolyte is injected by vacuum and made into a certain period of time in order to ensure that the electrolyte is fully infiltrated on the diaphragm and the positive and negative pole pieces. In this process, there will be air bubbles between the pole piece and the diaphragm in the core, and the diaphragm will also have fold defects in the winding, and also due to the machine and environmental factors such as the formation of surface dirt. Air bubbles are air or other gas masses present in the diaphragm, usually appearing as round or oval hollow areas, which may vary greatly in contrast to the surrounding material and may show distinct edges in the diaphragm. The presence of bubble defects will result in a hindrance to uniform transmission of lithium ions between positive and negative electrodes. This impedance in ionic transport leads to an increase in local current density. Additionally, impeded ionic transport causes an increase in interfacial polarization and a faster rate of capacity degradation. Lithium batteries containing air bubbles have been observed to generate heat in an uneven manner due to the variation in local current density. This phenomenon can potentially lead to a condition known as thermal runaway, which poses a significant safety concern. Composite bubbles have been shown to accelerate the decomposition of electrolyte gas production in comparison with single bubbles, resulting in a further increase in the volume expansion rate. The expansion of the bubble during the cycling process exerts pressure on the active material, which can result in a significant decrease in battery capacity. Concurrently, the thermal runaway threshold will be reduced, and the probability of thermal runaway will be significantly elevated under high-temperature conditions. The distinction between the two forms can be determined by examining their formation mechanisms, gas compositions, and dynamic behaviors. The formation of bubbles in the first case originates from manufacturing residual air or electrolyte vapors with stable gas compositions. In the second case, composite bubbles are formed by mixing the initial bubbles with H2 and CO2 produced by the side reaction. These composite bubbles then expand into multiple bubbles as the cycle progresses. Quantitative differentiation necessitates a combination of gas chromatography, in situ pressure monitoring, electrochemical impedance spectroscopy, and thermal analysis to guide the model in identifying features and safety warnings. Wrinkles are wrinkle-like structures that appear on the surface or inside the diaphragm. The phenomenon of wrinkles in the diaphragm after liquid injection may be due to two factors: one may be caused by the difference in the wettability of the electrolyte on the positive and negative electrode sheets and the diaphragm, and the other may be caused by the internal structure of the diaphragm. Some researchers believe that differences in the microstructure of polyolefin diaphragms prepared by the stretching method are the main reason for the generation of wrinkles, and that the uneven micro distribution of the electrolyte in the crystalline and amorphous regions within the diaphragm results in the accumulation of stress or relaxation at the micro-scale, which in turn generates macroscopic wrinkles in the diaphragm. The wrinkled regions may exhibit textural variations or higher frequency fine structures that may appear as continuous lines or curves in the image. The uneven porosity distribution of the diaphragm at the wrinkles will cause local lithium-ion flux concentration and preferential growth of lithium dendrites. The stress at the edge of the wrinkle is concentrated, and the diaphragm is susceptible to breakage during the cycle, which significantly increases the risk of a short circuit in the battery. Concurrently, the atypical distribution of electrolytes within the wrinkled region can readily induce an imbalance in the electrode reaction kinetics. Soiled areas, on the other hand, may contrast markedly with the basic color of the diaphragm, may appear as lumps or irregular shapes on the surface of the diaphragm, and may occur in specific areas of the diaphragm, such as edges or corners. The presence of contaminants can lead to an augmentation in the self-discharge rate, owing to the presence of conductive foreign matter that adheres to the surface of the diaphragm, resulting in the perforation of the diaphragm. Impurities such as Fe3+ can expedite the decomposition of the electrolyte. The resultant side reactions have been observed to cause a depletion of lithium ions and electrolyte, thereby leading to a rapid deterioration of the battery’s capacity.
As illustrated in Figure 6, the lithium battery pole piece detection imaging system consists of a transmission system, a lighting system, a sensing system, a central control system, and other subsystems. The hardware composition and function of these subsystems are delineated in Table 1.
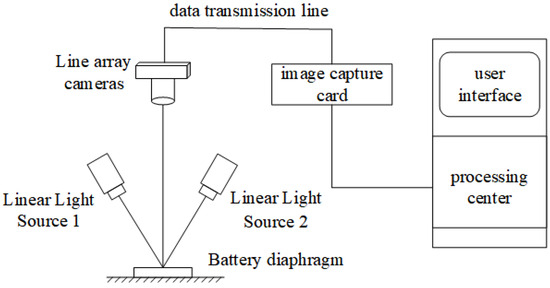
Figure 6.
Lithium Battery Separator Data Acquisition System.

Table 1.
Imaging device subsystems.
The diaphragm is driven by the drive system to move in the direction of the winder. As the diaphragm passes through the inspection area, the sensing system collects the image data under the illumination of the lighting system. These image data are then transmitted to the central control system via a data transmission line. The central control system is responsible for analyzing the collected data and processing the defect data accordingly. Moreover, the central control system is responsible for regulating the transmission rate of the drive system, the light intensity of the lighting system, and the shooting frequency of the line array camera.
The power battery diaphragm dataset collected by acquiring the production line and in the network is specifically 1257 bubbles, 1046 wrinkles, 1072 stains, 1183 composite bubbles, and 15,326 normal. It can be seen that the actual number of defect pictures that can be obtained is less compared to the number of datasets used for general deep learning model training. Hence, the research concentrates on precisely and swiftly training defect detection on limited samples, especially considering the disparity between normal samples and other defect types. Identifying the specific defect category is crucial. Given the scarcity of defect samples in contrast to normal samples, the study annotates the faulty samples in the training dataset. It employs supervised transfer learning to conduct small-sample transfer learning on the battery separators, utilizing a pre-trained model trained on a large dataset to train the small-sample battery separator dataset for object detection through transfer learning.
Due to the scarcity of defective samples in the dataset, the study initially utilized the roLabellmg labeling tool to create ground truth data for the defective samples in the lithium-ion battery separator training dataset. These ground truth data include bounding boxes and class labels for the targets in the images. Furthermore, the production site of engineering may be subject to disturbances such as vibration, electromagnetic noise, temperature and humidity fluctuations, and other disruptions. These factors have the potential to compromise the quality of imaging and the stability of the model. The implementation of a heterogeneous integration model, in conjunction with a voting method tailored to its specific class, can enhance the detection accuracy through the process of data fusion. Additionally, the application of data enhancement technology can improve the quality of the image. The dataset underwent preprocessing and augmentation. Through techniques like flipping, local cropping, color adjustments, and central rotation applied to the original images, the study expanded and enhanced the dataset. The resolution of the images has been standardized to 256 × 256. The augmentation of data pertaining to diaphragm defects has been demonstrated to facilitate the enhancement of the generalization capability of the target domain of migration learning, thereby circumventing the occurrence of overfitting phenomena. Part of the pre-processing of the separator defect images is illustrated in Figure 7. The lithium-ion battery separator defect images were split into training, testing, and validation data in a 7:2:1 ratio. Subsequently, a mechanism has been built to identify potential regions containing target defect areas. The Intersection over Union (IoU) metric has been used to create target category variables and establish target bounding box offset variables to correct the positions of identified defect areas. A model was developed to predict target categories and region proposals relative to the offset of target bounding boxes.
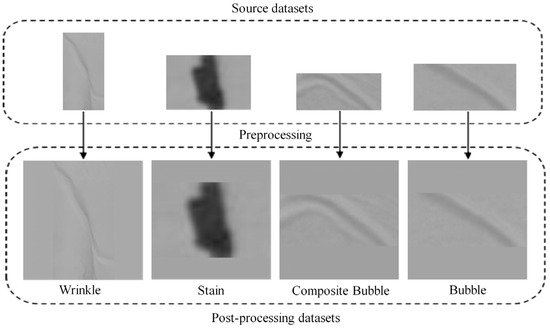
Figure 7.
Dataset preprocessing.
The training parameters are as follows: the epoch number is 30, batch size is 4, and the cross-validation fold is 3. The loss of training on the experimental equipment is shown in Figure 8a, where the loss of both training and testing converges to 0.19, and the final ratio of the number of images of each category to the input model is 0.83:0.82:0.91:1:0.79. In the integration strategy, the employment of hierarchical K-fold cross-validation to select the optimal model combination, in conjunction with the dynamic adjustment of the weights of each model, can prevent overfitting of the integrated model. This means that our network has been adequately trained by data enhancement, Stratified K-Fold cross-validation and Weighted Random Sampler sampling methods on the input data to balance the number of categories and adequately trained.
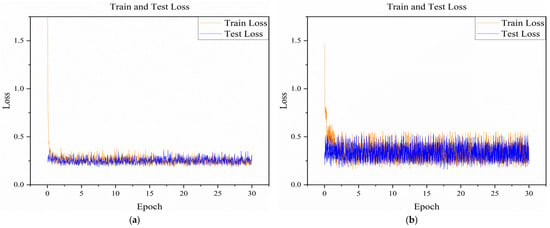
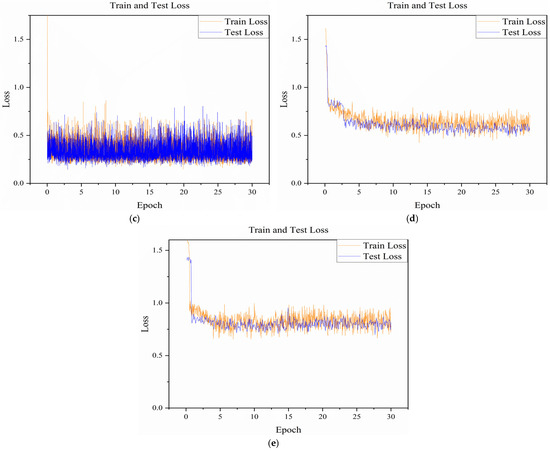
Figure 8.
Losses for model training and testing of different methods. (a) Model pre-training mi-grating Faster-RCNN and RetinaNet model integrated networks; (b) Faster-RCNN model; (c) RetinaNet model; (d) Fast-RCNN model; (e) Migrating the integrated model network without using model pre-training.
3.2. Evaluation Indicators
The IoU intersection ratio metric is often used to indicate the degree of proximity between the predicted and real frames. It is calculated as the area of the intersection of two frames divided by the area of the concatenation of two frames. The formula is as follows:
where A and B denote the prediction frame and the true frame, respectively.
True Positive (TP), True Negative (TN), False Positive (FP), and False Negative (FN) can be determined based on whether the classification result is correct or not. TP indicates that the classification result is true positive, TN indicates true negative, FP indicates false positive, and FN indicates false negative. The different methods were evaluated in terms of recall, precision and balanced F Score (F1 score) as classification performance indicators. They are defined as follows:
The Receiver Operating Characteristic (ROC) curve, which is also used to describe the comprehensive performance of the model, is calculated by setting different confidence thresholds to calculate the False Positive Rate (FPR) and True Positive Rate (TPR) values under different thresholds, and then plotted with the horizontal axis as FPR and the vertical axis as TPR.
On the ROC curve, the closer the point to the upper left corner, the better the effect. However, the area under the ROC curve is commonly used as a criterion for judging how good a model is, and the area under the ROC curve, also known as Area Under Curve (AUC). the larger the AUC, the better the comprehensive performance of the model.
4. Experimental Discussion and Analysis
4.1. Experimental Test Results
The validation of the proposed method is performed on the same experimental equipment as the training system configuration after sufficient training. On the lithium-ion battery diaphragm inspection dataset, we use transfer learning to fine-tune the Faster-RCNN and RetinaNet model integration networks and compare them to the direct training of the diaphragm defect dataset without the fine-tuning method using transfer learning. As can be seen from Figure 8, there is no use of transfer learning to directly use the model for training, due to the factors of small amount of training data, task changes, and scene changes, a large amount of high-quality defect data are not available in the short term for retraining the model, and, therefore, the model is not able to generalize well to the scenarios of defect detection in the lithium-ion battery diaphragm. The fine-tuning technique using migration learning enables the model to be adapted to the new field of lithium-ion battery diaphragm defects, converging more quickly and obtaining a very low loss value compared to the model without the use of migration learning, which ultimately converged to a loss value of 0.1942, a reduction of 0.6893. This shows that the transfer learning method is effective in our field of lithium-ion battery diaphragm defect detection.
Under the premise of applying transfer learning to fine-tune the model, we also use Fast-RCNN model, Faster-RCNN model and RetinaNet model to compare with it to evaluate the performance of lithium-ion battery diaphragm defect detection. During the training process of diaphragm defect detection, the loss trends of these three models are shown in Figure 8. Obviously, all three models are able to converge quickly and have low loss values, but due to the comprehensive comparison of the detection time and the running memory occupation, the batch size of 4 is chosen for the calculation. Furthermore, the dataset has a small sample size, which belongs to the small-sample problem, and, therefore, it will increase the fluctuation degree of the loss function; however, the range of fluctuation is around 0.1, with a maximum fluctuation value of 0.16, and does not affect the convergence of the model. The small batch size also produces an implicit regularization effect through noise injection. The convergence of the model, small batch size through the noise injection, also produces an implicit regularization effect. Through the comparison, it can also be seen that the method used can reduce the fluctuation of the loss function, making it easier for the model to converge, indicating that the models all have good learning ability to classify and detect defects by typical features. In contrast, the loss value of our improved method is even lower, reduced by 0.1317, indicating that the proposed method can improve the detection performance of the model.
In the process of model validation, since there is only one label marked for each image, the bounding box and category labels are displayed on the image by finding the model output bounding box with the highest IoU value with the labeled real bounding box as the final output of the model. Figure 9 shows some cases of correct detection and categorization in the process of model validation, which proves that the proposed method can realize the defect detection of the lithium-ion battery diaphragm and can correctly detect and label the categorized categories, even if the defective parts in each category have very similar characteristics.
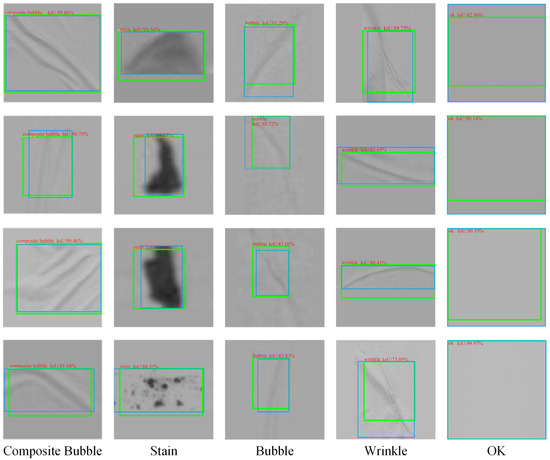
Figure 9.
Partially correct detection and classification of diaphragm images. Blue box: original defect labeling location; Green box: model-predicted bounding box location.
4.2. Analysis of Experimental Performance Validation
In this experiment, we first conduct sensitivity analysis on the hyperparameters such as learning rate, batch size, regularization coefficient, NMS threshold, etc. We set different learning rates, regularization coefficients, and NMS thresholds, and fix the rest of the parameters to control the variables for the comparative test. The comparative results are shown in Table 2, where we can see that the learning rate does not have a significant sensitivity to the model. It is because with the AdaDelta optimization algorithm, we use can use the rate of change in the parameters themselves to adjust the learning rate to make the results converge, so the initial learning rate set does not have a large impact on the performance of the model, and there is no need to repeatedly set different learning rates to optimize the model, which saves a great deal of time in the optimization of the model. Through comparison, we found that the size of batch size will affect the detection time and memory usage. If the batch size is too large, it will lead to high GPU memory, and the average detection time per image will also increase; however, when the batch size is too low, it will lead to large fluctuations in the training loss value. After a comprehensive comparison, we chose batch size of 4 to 4 so that the fluctuations in the loss value will not be significant. After a comprehensive comparison, we choose a batch size of 4 for training so that the fluctuation of the loss value will be relatively low, and, at the same time, it will not increase the running time and memory consumption, and the model performance can also be enhanced.

Table 2.
Sensitivity analysis.
Excessive regularization will lead to underfitting of the model, while too weak regularization will lead to overfitting, affecting the detection performance of the model. However, because of the migration learning fine-tuning method, which does not update the parameters of the backbone layer network but only fine-tunes the classification header, the data enhancement technique that is used to increase the dataset, which is combined with the early stopping method, and the use of dropout that makes the model less prone to overfitting, the effect of the regularization coefficient is not significant. NMS is used to filter redundant test frames by sorting all test frames by confidence, selecting the test frames with the highest confidence to be retained and suppressing other test frames with an IoU above a threshold until all test frames have been processed. Higher NMS thresholds reduce recall as more overlapping test frames are retained, resulting in fewer missed tests but more false tests; retained test frames contain more misdetections, and, therefore, precision is also reduced. On the contrary, a lower NMS threshold increases the recall but decreases the precision. In battery diaphragm defect detection, there is less overlap between targets in the picture, and lowering the NMS threshold does not have a significant effect on the model performance. However, defect detection is mainly about detecting the defects, which requires a higher recall to reduce the leakage rate. Therefore, after comprehensive comparison, a lower NMS threshold is chosen to increase the recall to complete the defect detection task.
After performing a sensitivity analysis of the hyperparameters such as learning rate, regularization factor, and NMS threshold, we set the hyperparameters with the best results, setting the learning rate to 0.15, the regularization factor to 1.5 × 10⁻⁶, and the NMS threshold to 0.3. We compared the results of using Faster-RCNN and RetinaNet integrated with one-stage method RetinaNet alone, and two-stage methods Faster-RCNN, Fast-RCNN alone. As shown in Table 3, the results of the four models shown for detection and classification can be seen that the Fast-RCNN algorithm is not good at predicting the fold category, resulting in a low Recall value. Meanwhile, the other three algorithms show good detection performance for the diaphragm defect dataset when detecting multiple categories simultaneously, with Recall, Precision, and F1 all reaching over 97%. The best performance is achieved with Faster-RCNN and RetinaNet integration, with recall reaching 99.61%, precision reaching 98.29%, and F1 reaching 98.95%. The average detection time for an image is 0.24 s, and the model runs on 12.2 GB of memory. From the comparison of the confusion matrix in Figure 10 and the ROC curve in Figure 11, it can also be seen that the AUC value of the integrated model of Faster-RCNN and RetinaNet, improved by the fine-tuning of the transfer learning for the defects multi-category classification, reaches 0.77, which is an improvement of 0.23 compared to the other models, and the improved model has a better performance.

Table 3.
Performance of different models in lithium-ion battery diaphragm defect detection.
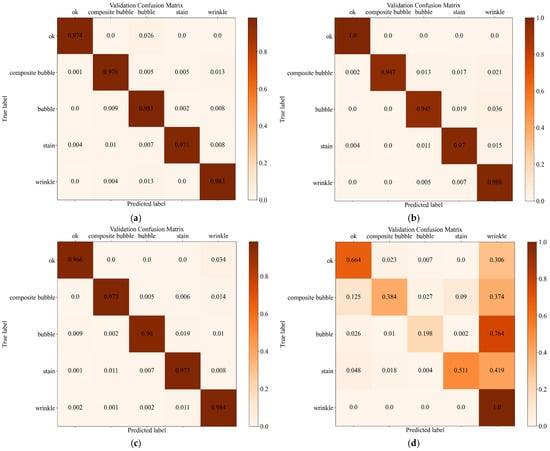
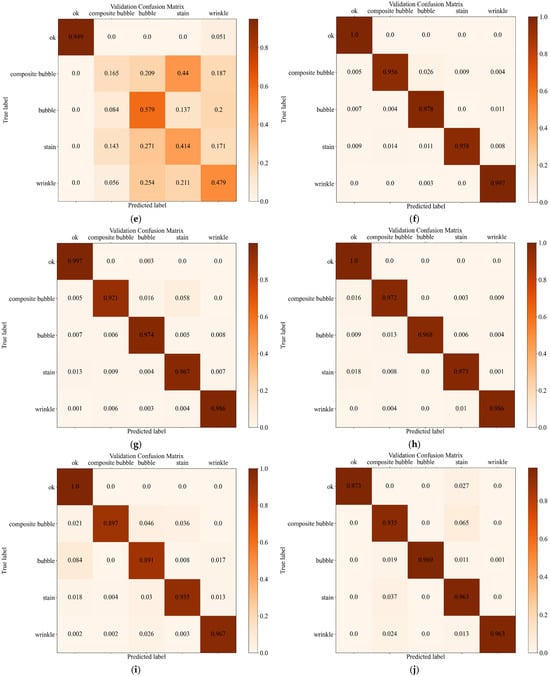
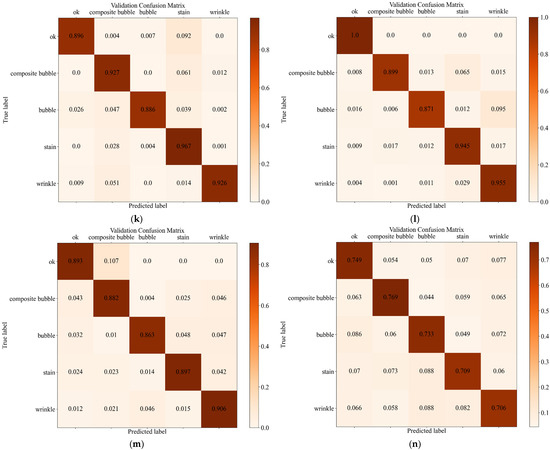
Figure 10.
Confusion matrix for different models. (a) Model pre-training migration Faster-RCNN and RetinaNet models integrated network; (b) Faster-RCNN model; (c) RetinaNet model; (d) Fast-RCNN model; (e) integrated model network using category-imbalanced source dataset; (f) regularization factor = 5 × 10⁻⁶; (g) regularization factor = 2 × 10⁻⁵; (h) NMS threshold = 0.5; (i) NMS threshold = 0.7; (j) batch size = 8; (k) unfreeze backbone network; (l) non-use dropout; (m) non-use pre-trained weights; (n) no replacement of classification and regression layers.
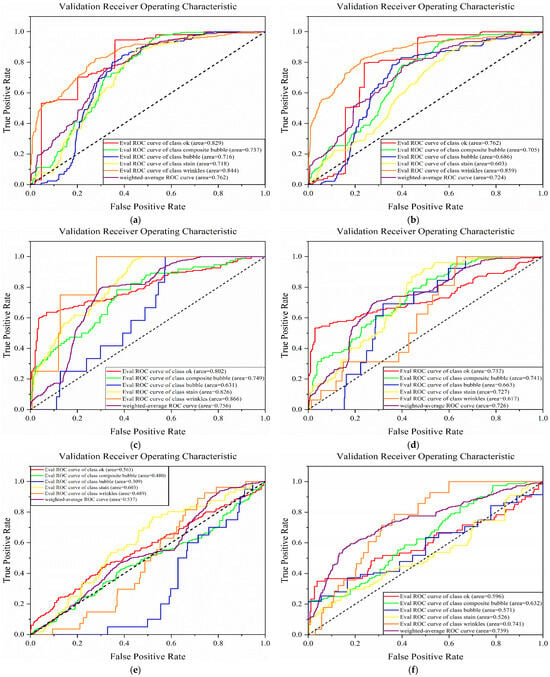
Figure 11.
ROC curves for different models. (a) Model pre-training migration Faster-RCNN and RetinaNet model integration networks; (b) Faster-RCNN model; (c) RetinaNet model; (d) Fast-RCNN model; (e) integration of the model network using the category-imbalanced source dataset; (f) integration without model pre-training migration Model Networks.
Finally, we need to conduct further ablation experiments on the detection model network to validate the migration learning approach used in the model. By comparing the experiments of whether to freeze the backbone network, whether to use dropout, replace the classification and regression layers, and use the pre-training weights based on the control variable method on the basis of the integrated models of Faster-RCNN and RetinaNet, the results are shown in Table 4. We can see that freezing the backbone network in the migration learning will greatly reduce the computational overhead, lower the training. The most important thing is that it can retain the generalized features that the model has already learned under the pre-training of the large dataset and can avoid destroying these generalized features on the small sample data. Similarly, the use of pre-training weights can accelerate the convergence, fine-tuning requires only a small number of iterations to converge, and the representation of features learned under the COCO dataset provides high-quality initialization parameters for detecting battery diaphragm defects, avoiding the inefficiency of training from zero. The use of dropout prevents overfitting and improves the generalization ability and also suppresses the overdependence of the pre-trained model on the source domain features. The final replacement of the classification and regression layer is the focus of migration learning, which modifies the final classification regression of the model from the output features of the COCO dataset to the number of categories required for diaphragm defects to ensure the accuracy of the classification and identification of the target task.

Table 4.
Ablation experiment.
Meanwhile, due to the imbalance in the number of categories in the source dataset, we compared two scenarios of using data augmentation and applying the Weighted RandomSampler method for sampling and dividing the dataset with the Stratified K-Fold cross-validation method and using only the source dataset for sampling training. From the comparison of the evaluation metrics in Table 5 and Figure 10, it is clear that sampling the training directly using the source dataset leads to the problem of imbalance of classification categories. The model pays more attention to samples from the majority category and does not learn enough features from the minority category data to perform the defect detection task well. However, by improving the sampling method and using cross-validation, the imbalance of defective sample categories can be solved and the performance of the model can be improved. In the experiments, although the average detection time and memory footprint were slightly higher, recall improved by 16.26%, precision improved by 7.05%, and F1 improved by 11.83% over the original data training model, and the results of the confusion matrix were also better than the results of the direct training on the source data. Therefore, the method is effective in lithium-ion battery diaphragm defect detection.

Table 5.
Performance validation of category imbalance in lithium-ion battery diaphragm defect detection.
The ROC curves are shown in Figure 11, which shows that the area AUC under the ROC curves for the five categories of diaphragm defects normal diaphragm, composite bubble, bubble, stains and wrinkles are basically above 0.7. From Figure 11, it can be observed that the normal image and folded categories have the largest areas, and these two categories are well-characterized and can be distinguished from the remaining three categories.
Figure 12 can show that there are many similarities between the features of the three categories of composite bubbles, air bubbles, and wrinkles, so the model performs a little bit lower in the classification of these three categories, and the area of its ROC curve is lower. After combining the results of each category, the AUC value of the ROC curve of the average weighted-average obtained could also reach 0.77, which indicates that the method has a high performance in the defect detection of lithium-ion battery diaphragm.
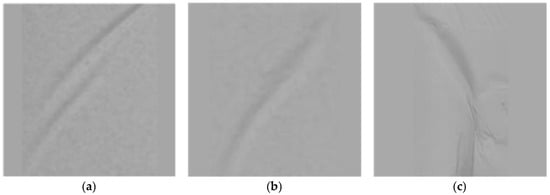
Figure 12.
Examples of feature similarity images for different defect categories: (a) composite bubbles; (b) bubbles; and (c) folds.
In the context of production line detection, two primary challenges emerge. Firstly, the necessity for real-time responsiveness poses a significant constraint, as production lines often require millisecond-level response times. Secondly, the efficacy of deep learning-based models may be hindered by the computing capabilities of the embedded devices utilized. Therefore, this study aims to make a comparison and verify the average image detection time and running memory consumption of the model. A sensitivity analysis, along with an examination of the results of ablation experiments and a comparison of the performance of different models, was conducted to determine the average detection time of this model. The results indicated that the average detection time was only 0.24 s per image. In addition, the running memory consumption was found to be 12.2 GB, which is essentially satisfactory for the application in the engineering process.
5. Conclusions
An improved integrated model that combines Faster-RCNN and RetinaNet is proposed for the inspection task in the new field of lithium-ion battery diaphragm defect detection. Firstly, the model introduces data enhancement and the Weighted-RandomSampler method for data processing sampling. It partitions the dataset using the Stratified K-Fold cross-validation technique to address diaphragm defect category imbalances and to facilitate subsequent model training task. Secondly, the model integrates the Faster-RCNN and RetinaNet network models, leveraging their respective strengths and employing a voting mechanism for optimal predictions. It also utilizes the AdaDelta optimization algorithm with adaptive learning rate, eliminating the need for presetting initial learning rates and dynamically adjusting based on parameter changes for convergence. Finally, fine-tuning is carried out through transfer learning to migrate the new dataset of battery diaphragm defects with a small sample size to the model that was pre-trained on the COCO dataset. It is carried out to improve the robustness and generalization of the model in the new dataset with a small sample size, so as to adapt to the task of detecting and classifying defects in lithium-ion battery diaphragms and to improve the detection accuracy.
Our work verifies the validity of introducing the method through comparative experiments in terms of the comparative results of the experiments.
(1) By comparing the direct utilization of the source dataset with the introduction of data augmentation and the Weighted RandomSampler sampling techniques for model input, and dividing the training and validation datasets using hierarchical cross-validation, the training methods are compared. The input category number ratio of the model was improved from 0.082:0.068:0.070:0.077:1 with or without defects category ratio close to 1:9 to 0.83:0.82:0.91:1:0.79 close to a balanced amount of category data, which effectively solves the problem of imbalance in the category of defect samples.
(2) Sensitivity analysis compares the learning rate, batch size, regularization factor L2, and NMS threshold. It is then is subjected to ablation experiments, comparing whether to freeze the backbone network, use dropout, replace the classification and regression layers, and use the pre-training weights. It comprehensively compares recall, precision, F1, average detection time, and running memory. The optimal hyperparameter design is obtained as follows: learning rate is 0.15, batch size is 4, regularization factor L2 is 1.5 × 10⁻⁶, and NMS threshold is 0.3. The migration learning method is performed to freeze the backbone network, use dropout, use pre-training weights, and modify the network of classification and regression layers according to the defect features and categories to obtain the optimal detection model.
(3) By comparing the validation results of the integrated model with the single model, the improved method detects 1.96% higher recall, 0.82% higher precision, 1.56% higher F1, and 0.12 higher AUC of the area under the ROC curve. The average detection time for an image is 0.24 s, and the model runs on 12.2 GB of memory. The experimental contrasts demonstrate that employing the integrated model’s voting mechanism enhances the performance in detecting defects in lithium-ion battery diaphragms.
(4) Through a comparison of the integrated model’s validation outcomes between transfer learning and direct training, this enhanced method exhibits a remarkable 16.26% enhancement in recall, a 7.05% improvement in precision, an 11.83% boost in F1 score, and the AUC of the area under the ROC curve is improved by 0.23. The experimental findings indicate that fine-tuning the integrated model via the model fine-tuning technique using pre-training transfer learning effectively resolves issues concerning poor robustness and generalization in target detection models when dealing with small sample size datasets in novel domains. This approach enhances the model’s performance in lithium-ion battery diaphragm defect detection, establishing a strong foundation for subsequent defect detection endeavors in related fields.
Despite these achievements, there are still limitations and shortcomings. For scenarios outside of the training database, this study did not conduct more experiments, but since the backbone network of the pre-trained model with migration learning has been used to validate the broad applicability of the model under a large model, and this study used fine-tuning techniques to validate that the model can be well generalized to the field of battery diaphragm defects under study, the network model approach is similarly able to perform targeted adaptation to new defect classes after fine-tuning methods that include labeling the image bounding boxes and labels, adjusting the parameters, and freezing the backbone network. Therefore, the network modeling method can also be adapted to new defect categories after fine-tuning methods, including image preprocessing techniques such as labeling image bounding boxes and labels, adjusting parameters, and freezing the backbone network, which can support the extension of the subsequent research to the detection of defects in other materials. This part is only illustrated theoretically, and future work needs more experiments for verification to further enhance the robustness and scalability of the model.
Author Contributions
Conceptualization, X.Z. and L.Y.; methodology, X.Z.; software, X.Z.; validation, X.Z., Z.H. and Z.Z.; formal analysis, X.Z.; investigation, Q.Z.; resources, X.Z. and A.S.; data curation, X.Z. and L.Y.; writing—original draft preparation, X.Z.; writing—review and editing, X.Z. and A.S.; visualization, X.Z.; supervision, A.S.; project administration, X.Z.; funding acquisition, A.S. All authors have read and agreed to the published version of the manuscript.
Funding
This research received no external funding.
Data Availability Statement
The datasets analyzed during the current study are not publicly available due to reasons why data are not public but are available on reasonable request.
Conflicts of Interest
The authors declare no conflicts of interest.
Abbreviations
The following abbreviations are used in this manuscript:
| Faster R-CNN | Faster Region-based Convolutional Neural Network |
| R-CNN | Region-based Convolutional Neural Network |
| AdaDelta | Adaptive Delta |
| F1 score | balanced F Score |
| ROC | Receiver Operating Characteristic |
| SIFT | Scale-invariant feature transform |
| AUC | Area Under Curve |
| CNN | Convolutional Neural Network |
| SS | Selective Search |
| TPR | True Positive Rate |
| FPR | False Positive Rate |
| RPN | Region Proposal Network |
| YOLO | You Only Look Once |
| SSD | Single Shot MultiBox Detector |
| VGG16 | Visual Geometry Group 16-layer network |
| ROI Pooling | Region of Interest Pooling |
| FPN | Feature Pyramid Network |
| ResNet | Residual Network |
| NMS | Non-Maximum Suppression |
| cuDNN | CUDA Deep Neural Network Library |
| IoU | Intersection over Union |
| TP | True Positive |
| FP | False Positive |
| TN | True Negative |
| FN | False Negative |
References
- Shahjalal, M.; Roy, P.K.; Shams, T.; Fly, A.; Chowdhury, J.I.; Ahmed, R.; Liu, K. A review on second-life of Li-ion batteries: Prospects, challenges, and issues. Energy 2022, 241, 122881. [Google Scholar] [CrossRef]
- Ye, L.; Peng, D.; Xue, D.; Chen, S.; Shi, A. Co-estimation of lithium-ion battery state-of-charge and state-of-health based on fractional-order model. J. Energy Storage 2023, 65, 107225. [Google Scholar] [CrossRef]
- Ye, L.-H.; Chen, S.-J.; Shi, Y.-F.; Peng, D.-H.; Shi, A.-P. Remaining useful life prediction of lithium-ion battery based on chaotic particle swarm optimization and particle filter. Int. J. Electrochem. Sci. 2023, 18, 100122. [Google Scholar] [CrossRef]
- Hu, G.; Huang, P.; Bai, Z.; Wang, Q.; Qi, K. Comprehensively analysis the failure evolution and safety evaluation of automotive lithium ion battery. eTransportation 2021, 10, 100140. [Google Scholar] [CrossRef]
- Zhou, Z.; Zhou, X.; Cao, B.; Yang, L.; Liew, K. Investigating the relationship between heating temperature and thermal runaway of prismatic lithium-ion battery with LiFePO4 as cathode. Energy 2022, 256, 124714. [Google Scholar] [CrossRef]
- Zhu, J.; Zhou, D.; Lu, R.; Liu, X.; Wan, D. C2DEM-YOLO: Improved YOLOv8 for defect detection of photovoltaic cell modules in electroluminescence image. Nondestruct. Test. Eval. 2025, 40, 309–331. [Google Scholar] [CrossRef]
- Zhao, C.; He, J.; Li, J.; Tong, J.; Xiong, J. (Eds.) Preparation and properties of UHMWPE microporous membrane for lithium ion battery diaphragm. IOP Conf. Ser. Mater. Sci. Eng. 2018, 324, 012089. [Google Scholar] [CrossRef]
- Zhou, H.; Ge, Z.; Hu, Y.; Luo, J.; Zeng, Y. (Eds.) An Improved Deep Learning Network Based Defect Detection Algorithm for Lithium-ion Battery Pole Chip. In Proceedings of the 2023 8th International Conference on Cloud Computing and Big Data Analytics (ICCCBDA), Chengdu, China, 26–28 April 2023; IEEE: New York, NY, USA, 2023. [Google Scholar]
- Schoo, A.; Moschner, R.; Hülsmann, J.; Kwade, A. Coating defects of lithium-ion battery electrodes and their inline detection and tracking. Batteries 2023, 9, 111. [Google Scholar] [CrossRef]
- Choi, S.; Liu, P.; Yi, K.; Sampath, S.; Sohn, H. Noncontact laser ultrasonic inspection of weld defect in lithium-ion battery cap. J. Energy Storage 2023, 73, 108838. [Google Scholar] [CrossRef]
- Pan, Y.; Kong, X.; Yuan, Y.; Sun, Y.; Han, X.; Yang, H.; Zhang, J.; Liu, X.; Gao, P.; Li, Y.; et al. Detecting the foreign matter defect in lithium-ion batteries based on battery pilot manufacturing line data analyses. Energy 2023, 262, 125502. [Google Scholar] [CrossRef]
- Yuan, Y.; Wang, H.; Lu, L.; Sun, Y.; Kong, X.; Han, X.; Ouyang, M. In situ detection method for Li-ion battery of separator pore closure defects based on abnormal voltage in rest condition. J. Power Sources 2022, 542, 231785. [Google Scholar] [CrossRef]
- Felzenszwalb, P.; McAllester, D.; Ramanan, D. A discriminatively trained, multiscale, deformable part model. In Proceedings of the 2008 IEEE Conference on Computer Vision and Pattern Recognition, Anchorage, AL, USA, 23–28 June 2008; IEEE: New York, NY, USA, 2008. [Google Scholar]
- Jia, F.; Chen, C.-C. Emotional characteristics and time series analysis of Internet public opinion participants based on emotional feature words. Int. J. Adv. Robot. Syst. 2020, 17, 1729881420904213. [Google Scholar] [CrossRef]
- Wang, C.; Han, D. Credit card fraud forecasting model based on clustering analysis and integrated support vector machine. Clust. Comput. 2019, 22 (Suppl. S6), 13861–13866. [Google Scholar] [CrossRef]
- Zhong, F.; Kumar, R.; Quan, C. A cost-effective single-shot structured light system for 3D shape measurement. IEEE Sens. J. 2019, 19, 7335–7346. [Google Scholar] [CrossRef]
- Jeon, Y.-J.; Choi, D.-C.; Lee, S.J.; Yun, J.P.; Kim, S.W. Defect detection for corner cracks in steel billets using a wavelet reconstruction method. JOSA A 2014, 31, 227–237. [Google Scholar] [CrossRef]
- Dupont, F.; Odet, C.; Cartont, M. Optimization of the recognition of defects in flat steel products with the cost matrices theory. NDT&E Int. 1997, 30, 3–10. [Google Scholar]
- Bustillo, A.; Pimenov, D.Y.; Matuszewski, M.; Mikolajczyk, T. Using artificial intelligence models for the prediction of surface wear based on surface isotropy levels. Robot. Comput.-Integr. Manuf. 2018, 53, 215–227. [Google Scholar] [CrossRef]
- Luo, Q.; He, Y. A cost-effective and automatic surface defect inspection system for hot-rolled flat steel. Robot. Comput.-Integr. Manuf. 2016, 38, 16–30. [Google Scholar] [CrossRef]
- Song, K.; Yan, Y. A noise robust method based on completed local binary patterns for hot-rolled steel strip surface defects. Appl. Surf. Sci. 2013, 285, 858–864. [Google Scholar] [CrossRef]
- Ngo, V.-D.; Vuong, T.-C.; Van Luong, T.; Tran, H. Machine learning-based intrusion detection: Feature selection versus feature extraction. Cluster. Comput. 2024, 27, 2365–2379. [Google Scholar] [CrossRef]
- Weimer, D.; Scholz-Reiter, B.; Shpitalni, M. Design of deep convolutional neural network architectures for automated feature extraction in industrial inspection. CIRP Ann. 2016, 65, 417–420. [Google Scholar] [CrossRef]
- Kong, T.; Sun, F.; Yao, A.; Liu, H.; Lu, M.; Chen, Y. (Eds.) Ron: Reverse connection with objectness prior networks for object detection. In Proceedings of the IEEE Conference on Computer Vision and Pattern Recognition, Honolulu, HI, USA, 21–26 July 2017; IEEE: New York, NY, USA, 2017. [Google Scholar]
- Ren, R.; Hung, T.; Tan, K.C. A generic deep-learning-based approach for automated surface inspection. IEEE Trans. Cybern. 2017, 48, 929–940. [Google Scholar] [CrossRef] [PubMed]
- Bu, C.; Shen, R.; Bai, W.; Chen, P.; Li, R.; Zhou, R.; Li, J.; Tang, Q. CNN-based defect detection and classification of PV cells by infrared thermography method. Nondestruct. Test. Eval. 2024, 40, 1752–1769. [Google Scholar] [CrossRef]
- Li, M.; Wang, H.; Wan, Z. Surface defect detection of steel strips based on improved YOLOv4. Comput. Electr. Eng. 2022, 102, 108208. [Google Scholar] [CrossRef]
- Dong, H.; Yang, L.; Li, H. Small fault diagnosis of front-end speed controlled wind generator based on deep learning. WSEAS Trans. Circuits Syst. 2016, 15, 64. [Google Scholar]
- Zeng, N.; Wu, P.; Wang, Z.; Li, H.; Liu, W.; Liu, X. A small-sized object detection oriented multi-scale feature fusion approach with application to defect detection. IEEE Trans. Instrum. Meas. 2022, 71, 1–14. [Google Scholar] [CrossRef]
- Wan, X.; Zhang, X.; Liu, L. An improved VGG19 transfer learning strip steel surface defect recognition deep neural network based on few samples and imbalanced datasets. Appl. Sci. 2021, 11, 2606. [Google Scholar] [CrossRef]
- Wang, H.; Li, M.; Wan, Z. Rail surface defect detection based on improved Mask R-CNN. Comput. Electr. Eng. 2022, 102, 108269. [Google Scholar] [CrossRef]
- Girshick, R.; Donahue, J.; Darrell, T.; Malik, J. Region-based convolutional networks for accurate object detection and segmentation. IEEE Trans. Pattern Anal. Mach. Intell. 2015, 38, 142–158. [Google Scholar] [CrossRef]
- Nguyen, D.H.; Wahab, M.A. Damage detection in slab structures based on two-dimensional curvature mode shape method and Faster R-CNN. Adv. Eng. Softw. 2023, 176, 103371. [Google Scholar] [CrossRef]
- Uijlings, J.R.; Van De Sande, K.E.; Gevers, T.; Smeulders, A.W.M. Selective search for object recognition. Int. J. Comput. Vis. 2013, 104, 154–171. [Google Scholar] [CrossRef]
- Girshick, R. (Ed.) Fast R-CNN. computer science. In Proceedings of the 2015 IEEE International Conference on Computer Vision (ICCV), Washington, DC, USA, 11–18 December 2015; IEEE: New York, NY, USA, 2015. [Google Scholar]
- Ren, S.; He, K.; Girshick, R.; Sun, J. Faster R-CNN: Towards real-time object detection with region proposal networks. IEEE Trans. Pattern Anal. Mach. Intell. 2016, 39, 1137–1149. [Google Scholar] [CrossRef] [PubMed]
- Wang, S.; Fan, X.; Zhao, Z.; Qiao, Z.; Wang, N.; Qiu, Y.; Jia, X. Research on steel surface defect detection system based on YOLOv5s-SE-CA model and BEMD image enhancement. Nondestruct. Test. Eval. 2024, 1–20. [Google Scholar] [CrossRef]
- Liu, W.; Anguelov, D.; Erhan, D.; Szegedy, C.; Reed, S.; Fu, C.-Y.; Berg, A.C. (Eds.) Ssd: Single shot multibox detector. In Computer Vision–ECCV 2016: 14th European Conference, Amsterdam, The Netherlands, 11–14 October 2016; Proceedings, Part I 14; Springer: Berlin/Heidelberg, Germany, 2016. [Google Scholar]
- Arora, S.; Rani, R.; Saxena, N. SETL: A transfer learning based dynamic ensemble classifier for concept drift detection in streaming data. Clust. Comput. 2024, 27, 3417–3432. [Google Scholar] [CrossRef]
Disclaimer/Publisher’s Note: The statements, opinions and data contained in all publications are solely those of the individual author(s) and contributor(s) and not of MDPI and/or the editor(s). MDPI and/or the editor(s) disclaim responsibility for any injury to people or property resulting from any ideas, methods, instructions or products referred to in the content. |
© 2025 by the authors. Licensee MDPI, Basel, Switzerland. This article is an open access article distributed under the terms and conditions of the Creative Commons Attribution (CC BY) license (https://creativecommons.org/licenses/by/4.0/).