Article

Enhanced Charge Pump Architecture with Feedback Supply Selector for Optimized Switching Performance

Department of Electronic Devices, Circuits and Architectures, Faculty of Electronics, Telecommunications and Information Technology, National University of Science and Technology Politehnica Bucharest, 060042 Bucharest, Romania
*
Author to whom correspondence should be addressed.
Electronics 2025, 14(7), 1484; https://doi.org/10.3390/electronics14071484
Submission received: 19 March 2025 / Revised: 27 March 2025 / Accepted: 28 March 2025 / Published: 7 April 2025
(This article belongs to the Special Issue CMOS Integrated Circuits Design)

Abstract

:
Conventional operational amplifier designs often experience parameter performance issues during the transition between complementary input differential stages, which restricts the full rail-to-rail common mode voltage swing. This paper presents an innovative charge pump architecture featuring a feedback supply selector that optimizes the transition performance. The proposed approach employs a switched-capacitor technique to boost the supply voltage by 1.5 V relative to the input voltage, thereby enabling the use of a single pMOS differential input stage. The novel supply selector dynamically chooses the maximum available voltage between the external supply and the boosted output, ensuring efficient transistor switching and improved biasing. Schematic-level and post-layout simulations in a 250 nm CMOS process validate the design under varied load currents, supply voltages, temperatures, and process corners. Results show a significant reduction in output voltage ripple, with a maximum value of 48 mV achieved post-layout, and enhanced overall efficiency, even under higher load currents. This architecture provides a robust and scalable solution for advanced operational amplifiers, particularly in fields where high performance and stability are critical.

1. Introduction

In contemporary times, electronic devices have become indispensable in daily human activities. From basic computers to highly sophisticated and sensitive applications, such as medical devices, electric vehicles, and essential components in aerospace systems, these devices accompany and facilitate both mental and physical labor. A critical component of these electronic systems is the operational amplifier [1,2,3] (op-amp). These amplifiers receive a relatively small input signal, amplify and process it, and subsequently transmit it through their output (either differential or single-ended) to the next component of the system.
The technological advance and the increasing performance requirements for electronic equipment have led to the undeniable necessity of designing op-amps with enhanced parameters, including offset voltage [4], noise input [5], bandwidth [6], phase margin, and transient response. Compared to bipolar technology, CMOS technology (Complementary Metal-Oxide-Semiconductor) [7] offers several advantages in achieving these improvements, including higher speed, increased gate impedance, and lower manufacturing costs. Consequently, innovative solutions have been devised to refine well-established designs that are presented in the literature, while entirely new, innovative designs have also been developed (e.g., architectures incorporating trimming or chopping techniques).
Another crucial characteristic that IC design engineers must consider is the rail-to-rail common mode swing at the input [8]. This feature ensures that the amplifier operates according to its specified parameters regardless of the common-mode signal and its amplitude. In modern circuits, it is generally desirable for the rail-to-rail common mode swing to function at least 100 mV above or below the circuit’s supply rails.
A commonly used approach to achieve a rail-to-rail common mode swing at the input is employing complementary pMOS–nMOS transistor pairs [9]. In a well-defined common-mode range (−0.1 V to VDD − VSG − 2VOV (where VOV is the transistor’s overdrive voltage)), the pMOS differential stage operates (as pMOS transistors are preferred for a wider common-mode voltage range due to noise considerations), while in the other range (VDD − VSG − 2VOV V to VDD + 0.1 V), the nMOS stage becomes active. IC designers also have the option to operate both differential stages simultaneously. However, this approach increases circuit complexity due to the additional circuitry required to maintain a constant transconductance over the entire common-mode voltage range.
New original circuits have been provided to improve the complementary input stages performance. However, these designs introduce a significant drawback: the transition between the two differential stages. In this transition range, the total input transconductance [10] fluctuates significantly, causing a deviation in the amplifier’s parameters and restricting the common-mode voltage range in which the amplifier works as intended. If an electronic system operates within this undesired transition range, the amplifier may fail to process signals correctly, potentially leading to system malfunction.
A more efficient and robust solution to this issue is the charge pump method [11,12] that powers the input stage. By increasing the supply voltage with a defined margin, a single differential pair can be employed to achieve the input’s rail-to-rail swing, thereby eliminating the transition range where circuit parameters are compromised.
This paper presents an innovative charge pump design based on the switched capacitors principle. To maximize circuit efficiency, a state-of-the-art supply selector is implemented and discussed, enabling the switching transistors within the design to be turned on and off effectively.
This design is intended for applications involving general operational amplifiers that require a rail-to-rail input stage with enhanced common-mode voltage performance and a range of input currents suitable for both low-power and high-precision applications.
This article’s format is as follows: Section 2.1 introduces and explains the capacitor’s charge and discharge principle alongside the Dickson charge pump circuit. Section 2.2 explores the proposed charge pump architecture based on the switched capacitor principle. Section 2.3 discusses the low-dropout regulator (LDO) that drives the charge pump input and generates the required voltage. Section 2.4 examines the innovative supply selector circuit design and operation. Section 2.5 presents the final proposed charge pump schematic alongside all the internal blocks which compose it. Section 3 presents the proposed method and the supply selector circuit schematic-level simulations (Section 3.1). Parasitic extraction simulations are performed alongside a comparison to other papers that are recorded in the literature (Section 3.2). Section 4 details the charge pump layout implementation. A conclusion is also stated at the end of this paper.

2. Design and Implementation

This section offers a comprehensive overview of charge pump designs, emphasizing the dynamic behavior of capacitors within these circuits. Additionally, it introduces the basic schematic of the charge pump circuit to be implemented and simulated in this paper, along with an explanation of its operation. For contextual understanding, the Dickson charge pump is also discussed, with particular emphasis on its voltage multiplication mechanism. Furthermore, the Low-Dropout Regulator (LDO), which ensures a stable input supply, and the innovative supply selector circuit, designed to dynamically select the maximum available voltage and optimize the charge pump’s operation under varying conditions, will also be discussed.

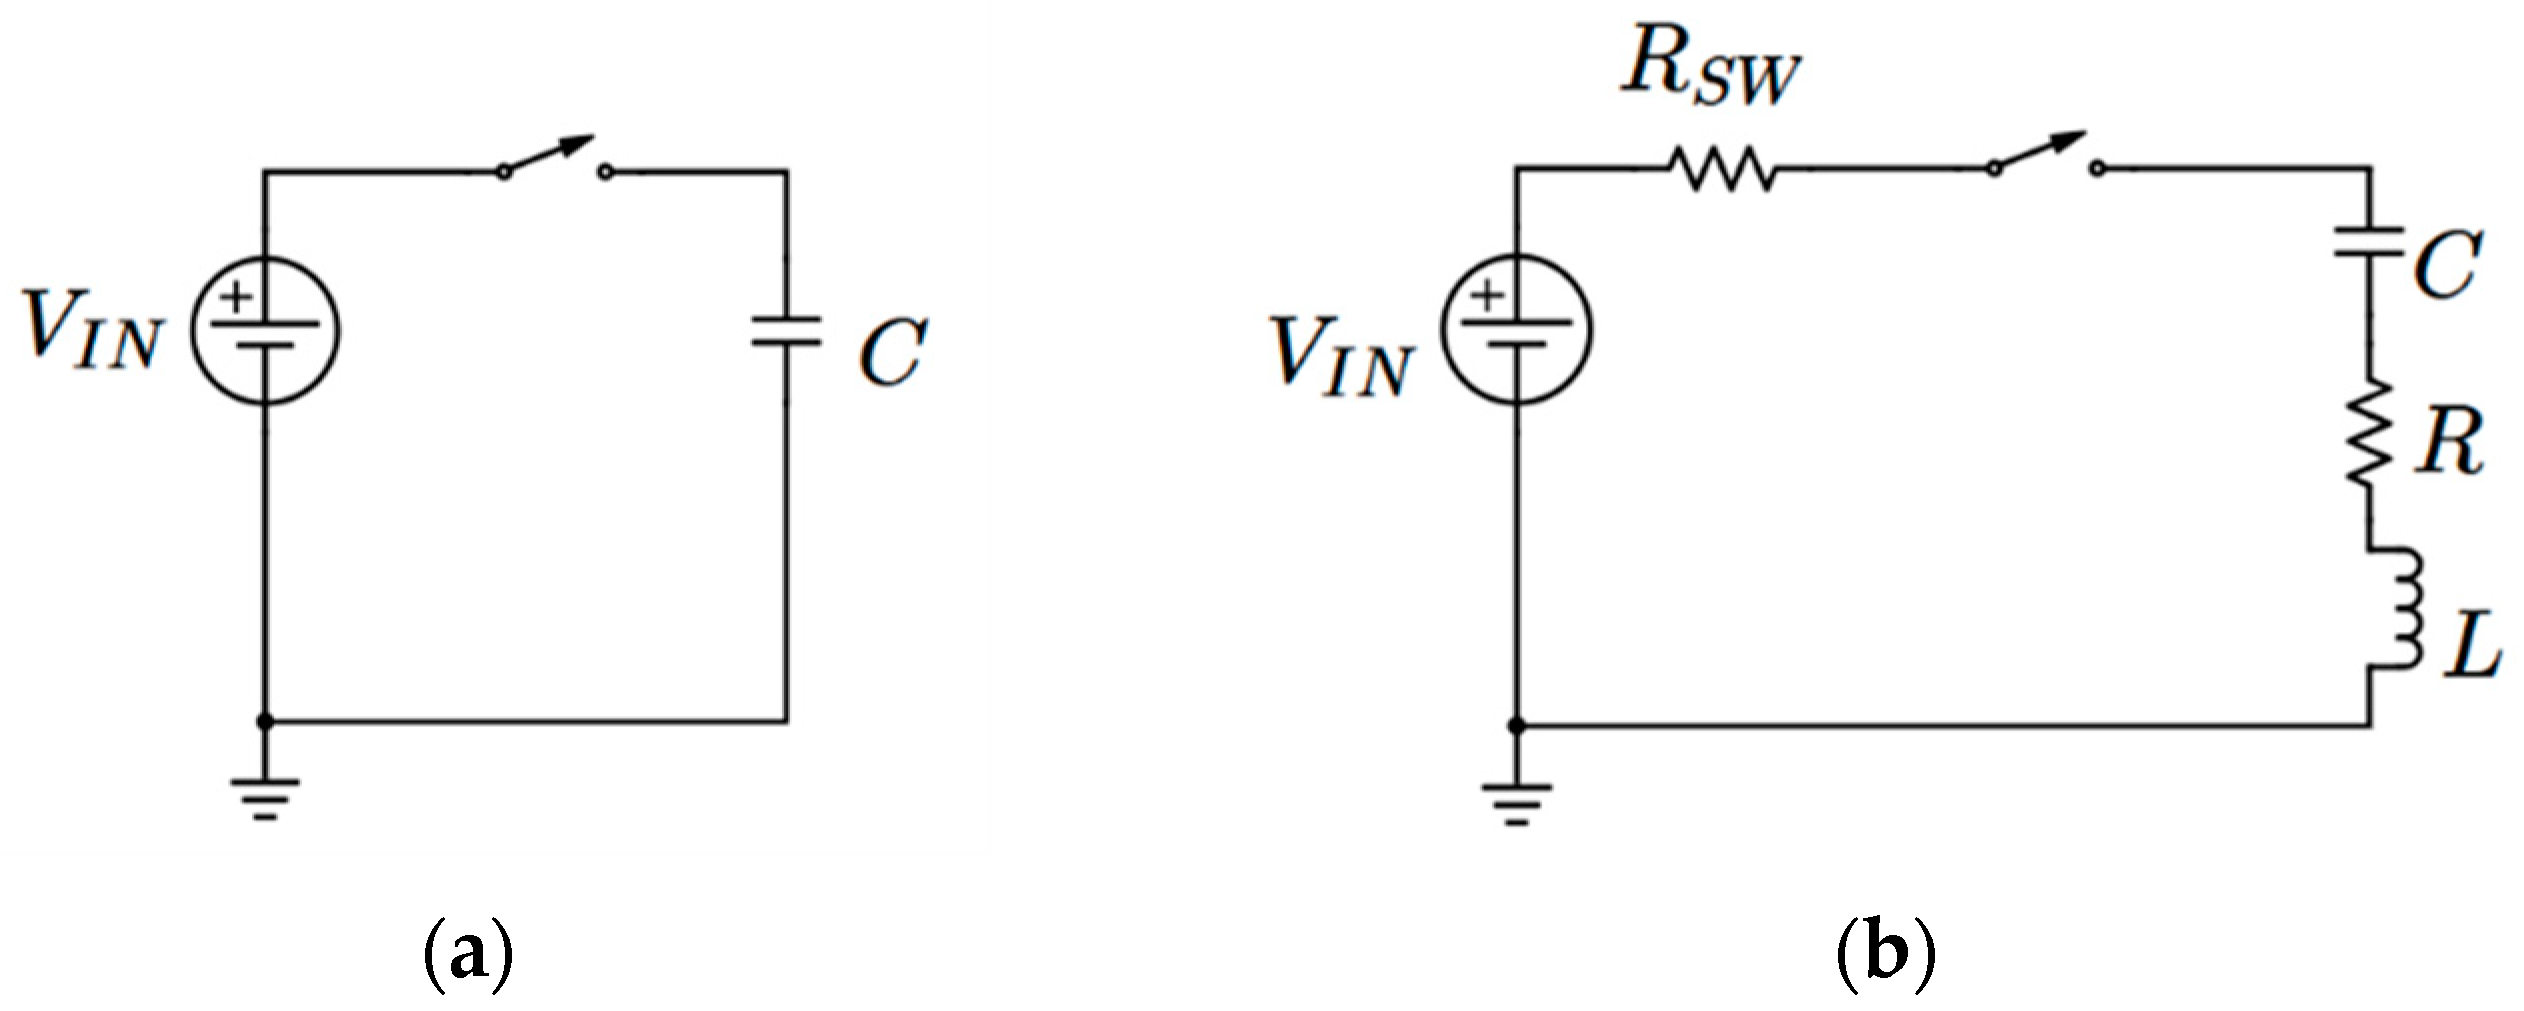
2.1. Charge Pump Principle

When a capacitor [13] is charged through a switch, it demonstrates the characteristic behavior of an RC circuit. This section will analyze the charging process, contrasting the ideal case, where the capacitor is connected to a switch without any resistance or inductance, with a more realistic model that accounts for the resistance of the switch, as well as the resistance and inductance inherent to the capacitor, as shown in Figure 1.
The charging process involves the movement of electrons, which creates an electric field within the capacitor.
Figure 2 shows two graphs depicting the behavior of the capacitor’s voltage and current, based on the formulas that define them, which are discussed in this section.
The capacitor charging and discharging process is characterized by an exponential curve governed by the time constant τ, which depends on the resistance R and capacitance C (τ = R × C). In the ideal case, the capacitor should charge instantaneously when a voltage is applied.
In a real capacitor model, the switch resistance (RSW), series resistance (R), and inductive effect (L) influence the charging and discharging process. The series and switch resistances limit the current flow, reducing the charging rate and extending the time required for the capacitor to reach its final voltage.
The inductive effect (L) opposes rapid current variations, leading to transient oscillations or ringing during switching events. This effect becomes more pronounced at higher frequencies, where it can affect performance. However, these effects are minimal for integrated capacitors and do not significantly influence overall behavior.
Initially, the capacitor is uncharged, with the voltage across it being 0 V and the current through the circuit at its maximum. At this point, the capacitor begins to accumulate charge, and the current is highest because there is no opposing voltage across the capacitor. The initial conditions of the circuit, where R and C are set to unitary values, serve as a simplified model for analyzing the capacitor’s charging process.
As the capacitor begins to charge, the voltage across it increases according to the following formula:
V t = V 0 1 e t R C
where V t is the voltage across the capacitor at time t, V 0 is the initial voltage applied, and R C is the time constant, with R being the equivalent resistance between the switch resistance RSW and the capacitor’s series resistance.
Simultaneously, the current through the circuit decreases exponentially, as described by the formula:
I t = I 0 e t R C
where I t is the current through the capacitor at time t, I 0 represents the initial current flow through the circuit, and can be calculated using Ohm’s Law:
I 0 = V 0 R
When the capacitor is fully charged, the voltage across it equals the supply voltage, and the current decreases to zero. As shown in Figure 2, during the charging process, the time constant τ represents the duration required for the voltage across the capacitor to reach approximately 63% of its final value (V0). After a period of 5τ, the capacitor is considered to be nearly fully charged, achieving more than 99% of its final voltage.
The charging behavior of capacitors plays a critical role in circuits like charge pumps, where capacitors are used to store and transfer energy to achieve a higher voltage. In such circuits, the capacitor’s charging and discharging cycles are carefully timed and controlled to ensure optimal performance and efficiency.
One of the most well-known charge pump circuits is the Dickson charge pump [14,15,16], illustrated in Figure 3. It features a two-stage circuit consisting of two diodes (D1 and D2) and two capacitors (C1 and C2). The circuit requires a fixed input voltage, which serves as the base voltage for the multiplication process. Additionally, a clock signal is essential for proper operation, as it controls the charge transfer between stages.
The circuit operates based on the toggling of the clock signal [17]. When the clock is low (0), diode D1 conducts, allowing the input voltage VIN to charge capacitor C1. In an ideal operation, when there is no voltage drop between the diodes and the clock transitions high (1), capacitor C1 is forced to a potential of 2VIN. At this stage, D1 turns off, while D2 turns on, allowing capacitor C2 to charge to 2VIN. As a result, the output voltage reaches twice the input voltage, effectively boosting the input voltage to twice its value. For N stages, the output voltage reaches approximately N × VIN; thus, through this technique, the input voltage is effectively multiplied, with the final output voltage being directly proportional to the number of stages used in the circuit.
An alternative implementation replaces the diodes with MOS transistors, as shown in Figure 3b. In certain cases, this can reduce voltage transfer losses when the input voltage is high enough. However, at low input voltages, the architecture does not perform as well due to the significant drain-source voltage drop of the transistors. One significant limitation of this scheme is the voltage drop across the diodes (or switches in general), which diminishes the voltage transfer and reduces the overall voltage transfer depending on the number of stages. Thus, the output voltage provided by the charge pump is given by the following formula:
V O U T = N × V I N k = 1 N V T k
where N is the number of stages and V T is the threshold voltage of each transistor in every stage.

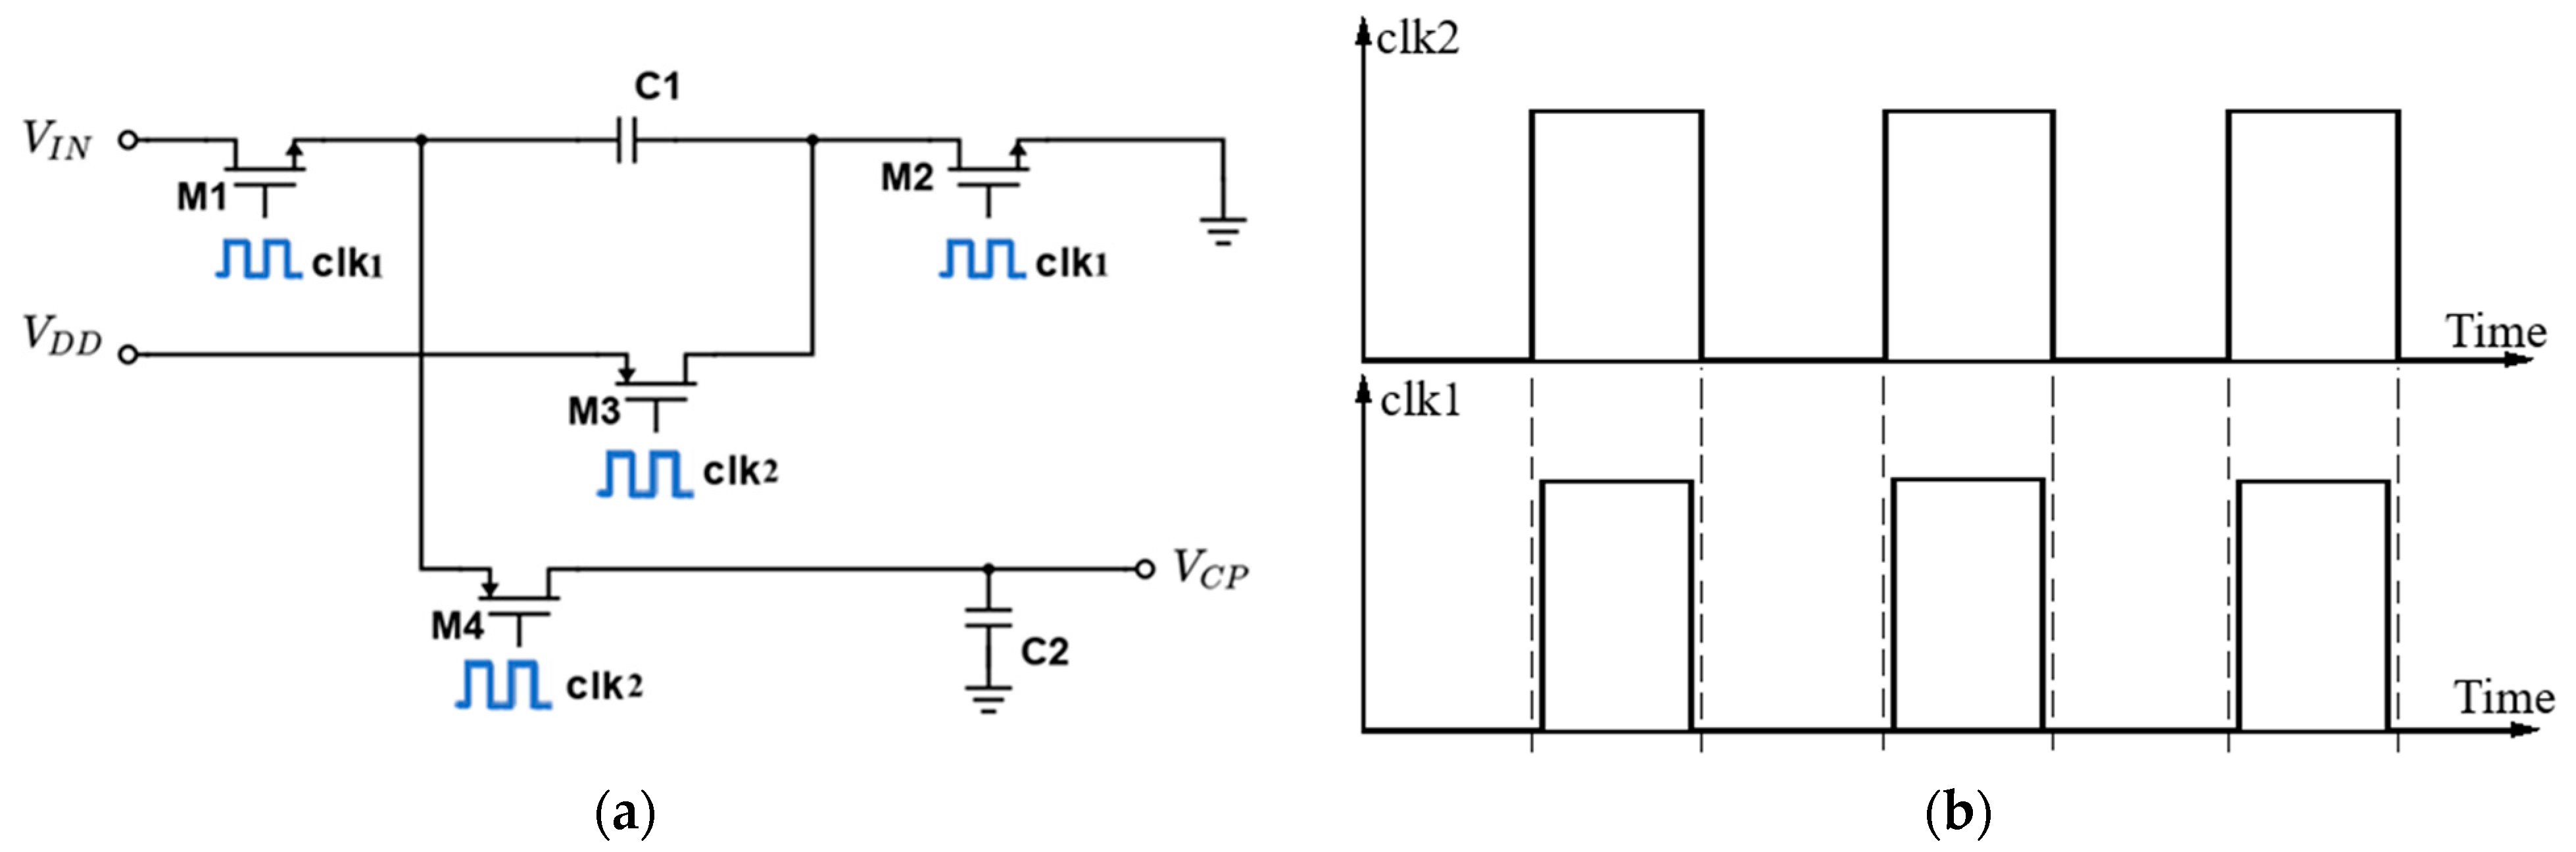
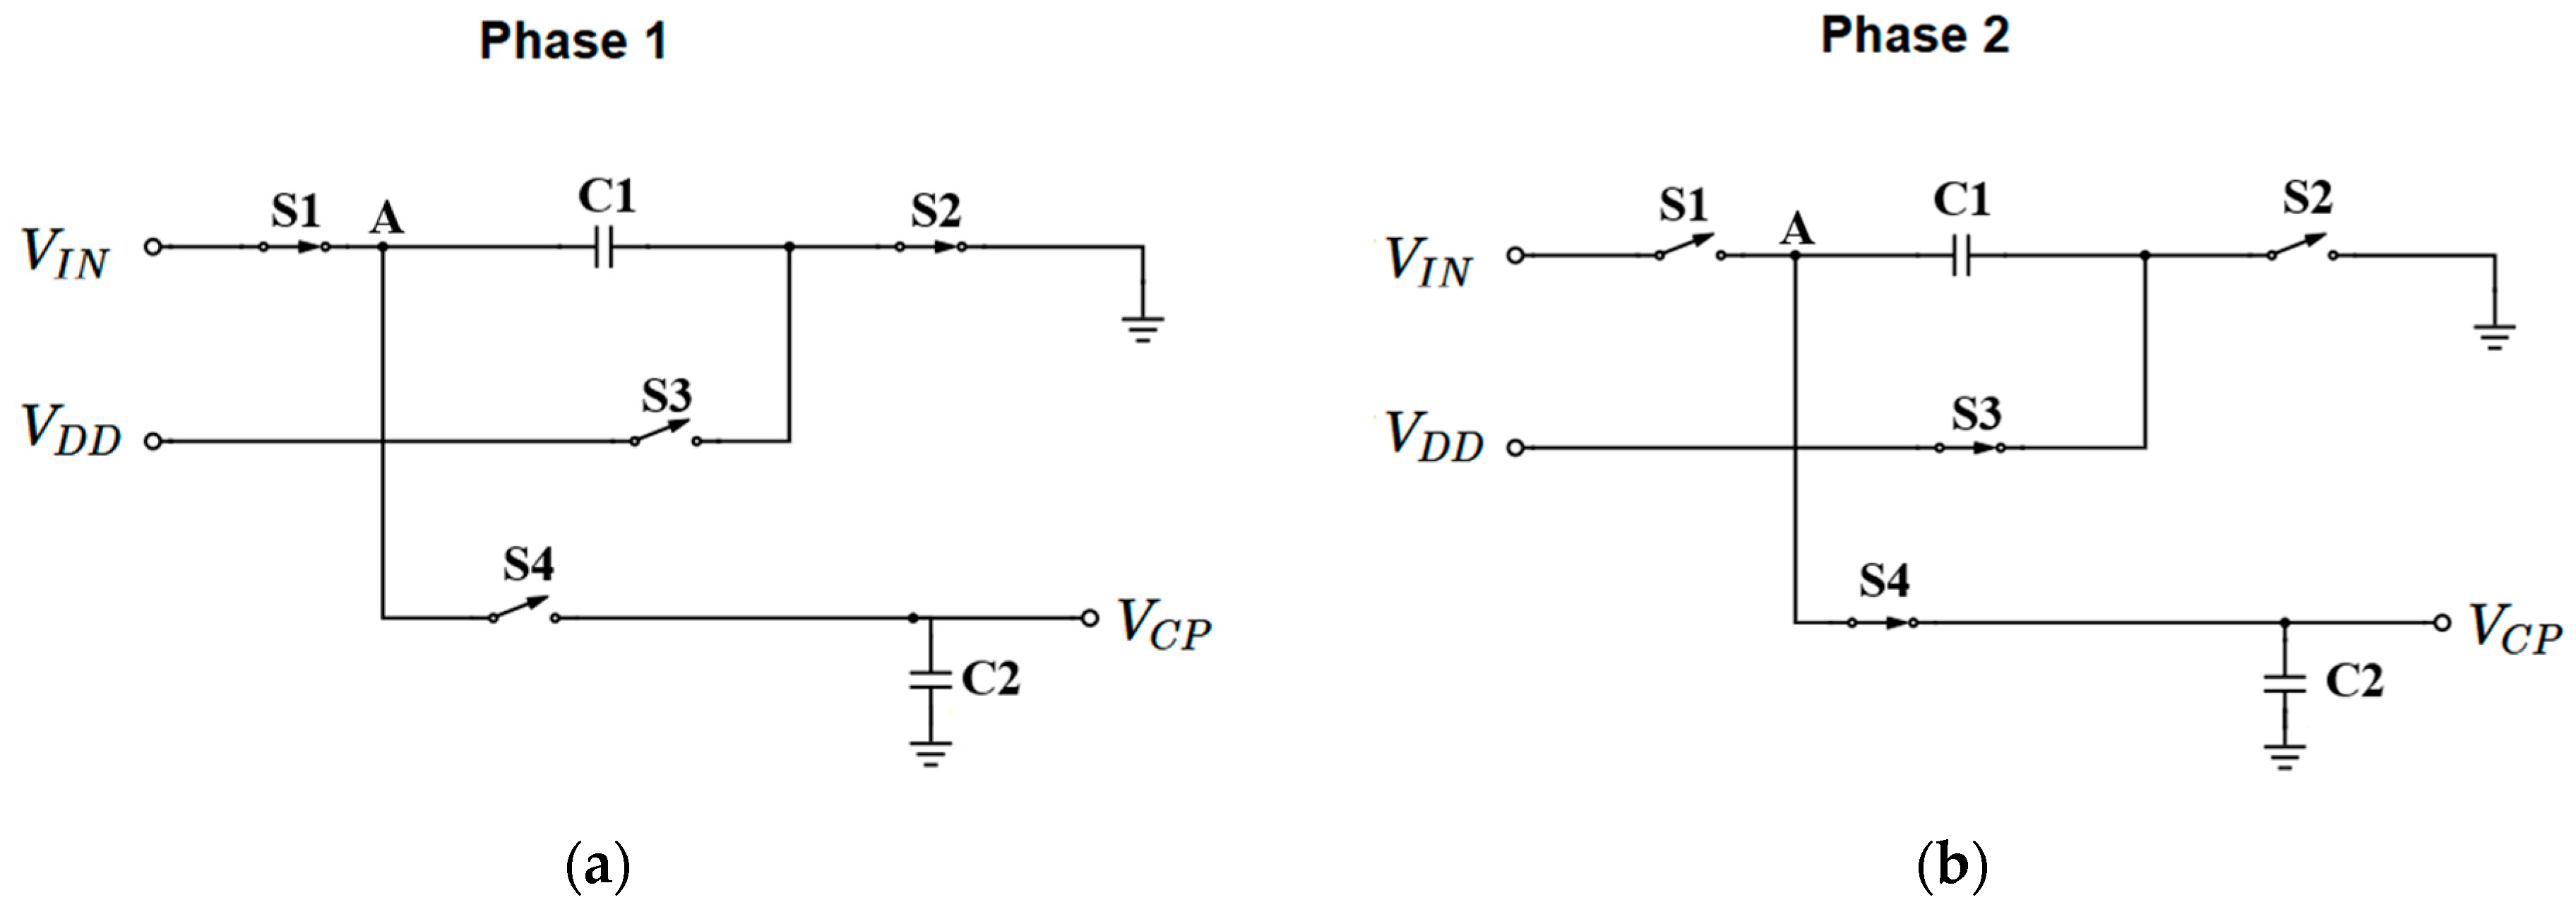
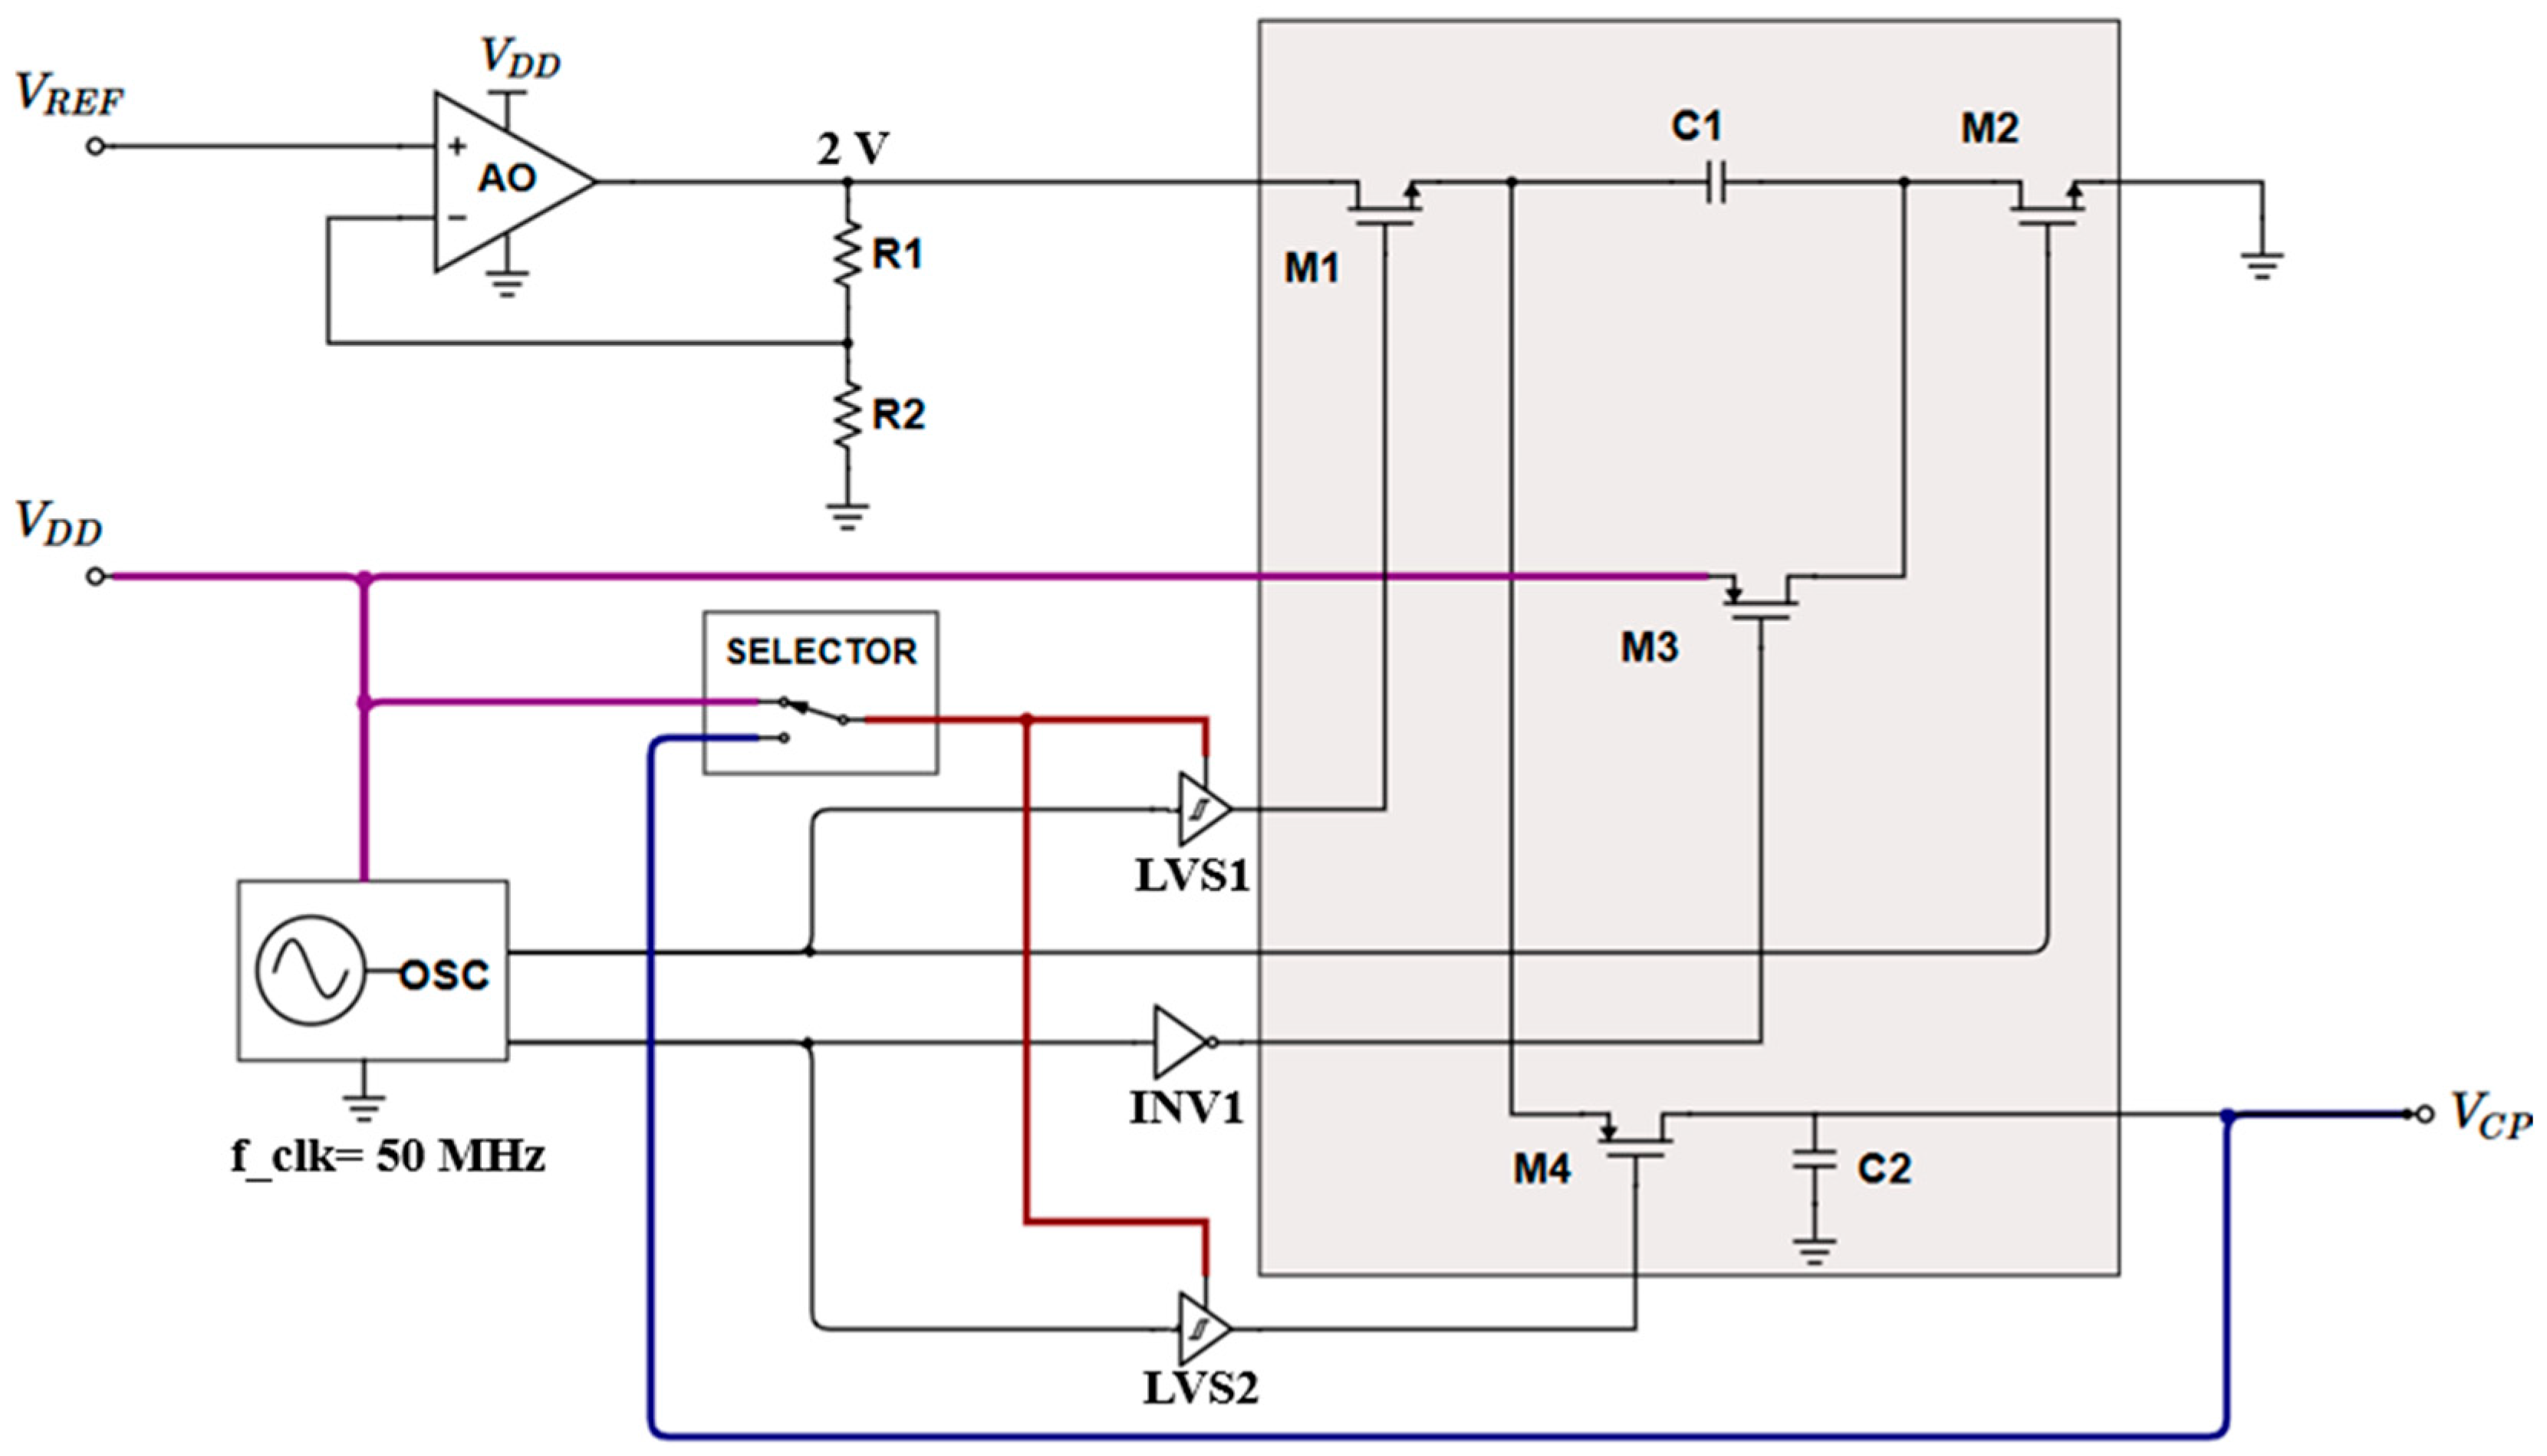
2.2. Proposed Switched-Capacitor Charge Pump

The proposed schematic for the charge pump circuit, as shown in this paper’s Figure 4a, introduces a significant improvement over the previous design of the Dickson charge pump. Unlike the earlier version, which aimed to double the input voltage, this new design increases the VDD voltage by 1.5 V, corresponding to the VIN voltage. This eliminates the need for transistors that could accommodate higher VDS voltages (>6.5 V for a VDD = 5 V), which would demand additional metal masks, thus increasing the chip cost and complexity. Also, the non-overlapping principle is used for clock signals clk1 and clk2 (Figure 4b) to toggle between two operational phases, which are detailed below. In this manner, the clocks achieve a higher performance for the charge pump output, as one pair of switches closes before the other one opens, thus assuring signal integrity. For example, the M2 transistor should close before M3 opens, to avoid a short between VDD signal and GND. This is the so-called “break before make” method.
In the first phase, presented in Figure 5a, the clock signal is at a logical “1”. During this phase, switches S1 and S2 are closed, allowing capacitor C1 to charge to the value of VIN. Meanwhile, switches S3 and S4 are open since they are pMOS transistors with a high logic level applied to their gates.
In the second phase, depicted in Figure 5b, when the clock signals are at a logical “0”, switches S1 and S2 are open. At this point, the voltage at node A is equal to the sum of the voltage across capacitor C1 and the VDD power voltage. This voltage at node A is further transmitted through switch S4 and is used to charge capacitor C2. As a result, the output voltage, VCP, is increased by VIN relative to VDD. This solution enables the amplifier to achieve a complete swing of common-mode voltages across a wide range, both below and above the supply voltages, while using only a single pMOS differential input stage.
The clock signals driving the two phases are synchronized but slightly delayed relative to one another, using a non-overlapping circuit. This delay ensures that switches S1 and S2 are fully open before the S3 and S4 switches are closed. This sequencing prevents any short-circuit path between the supply voltage and ground, thereby avoiding unnecessary power dissipation and ensuring the integrity of the voltage across capacitor C1. Additionally, if switches S1 and S4 are both open at the same time, the voltage at node A would drop below VIN, preventing capacitor C1 from charging fully. This would hinder the output voltage, VCP, from reaching the desired level, keeping it lower than VDD + VIN.

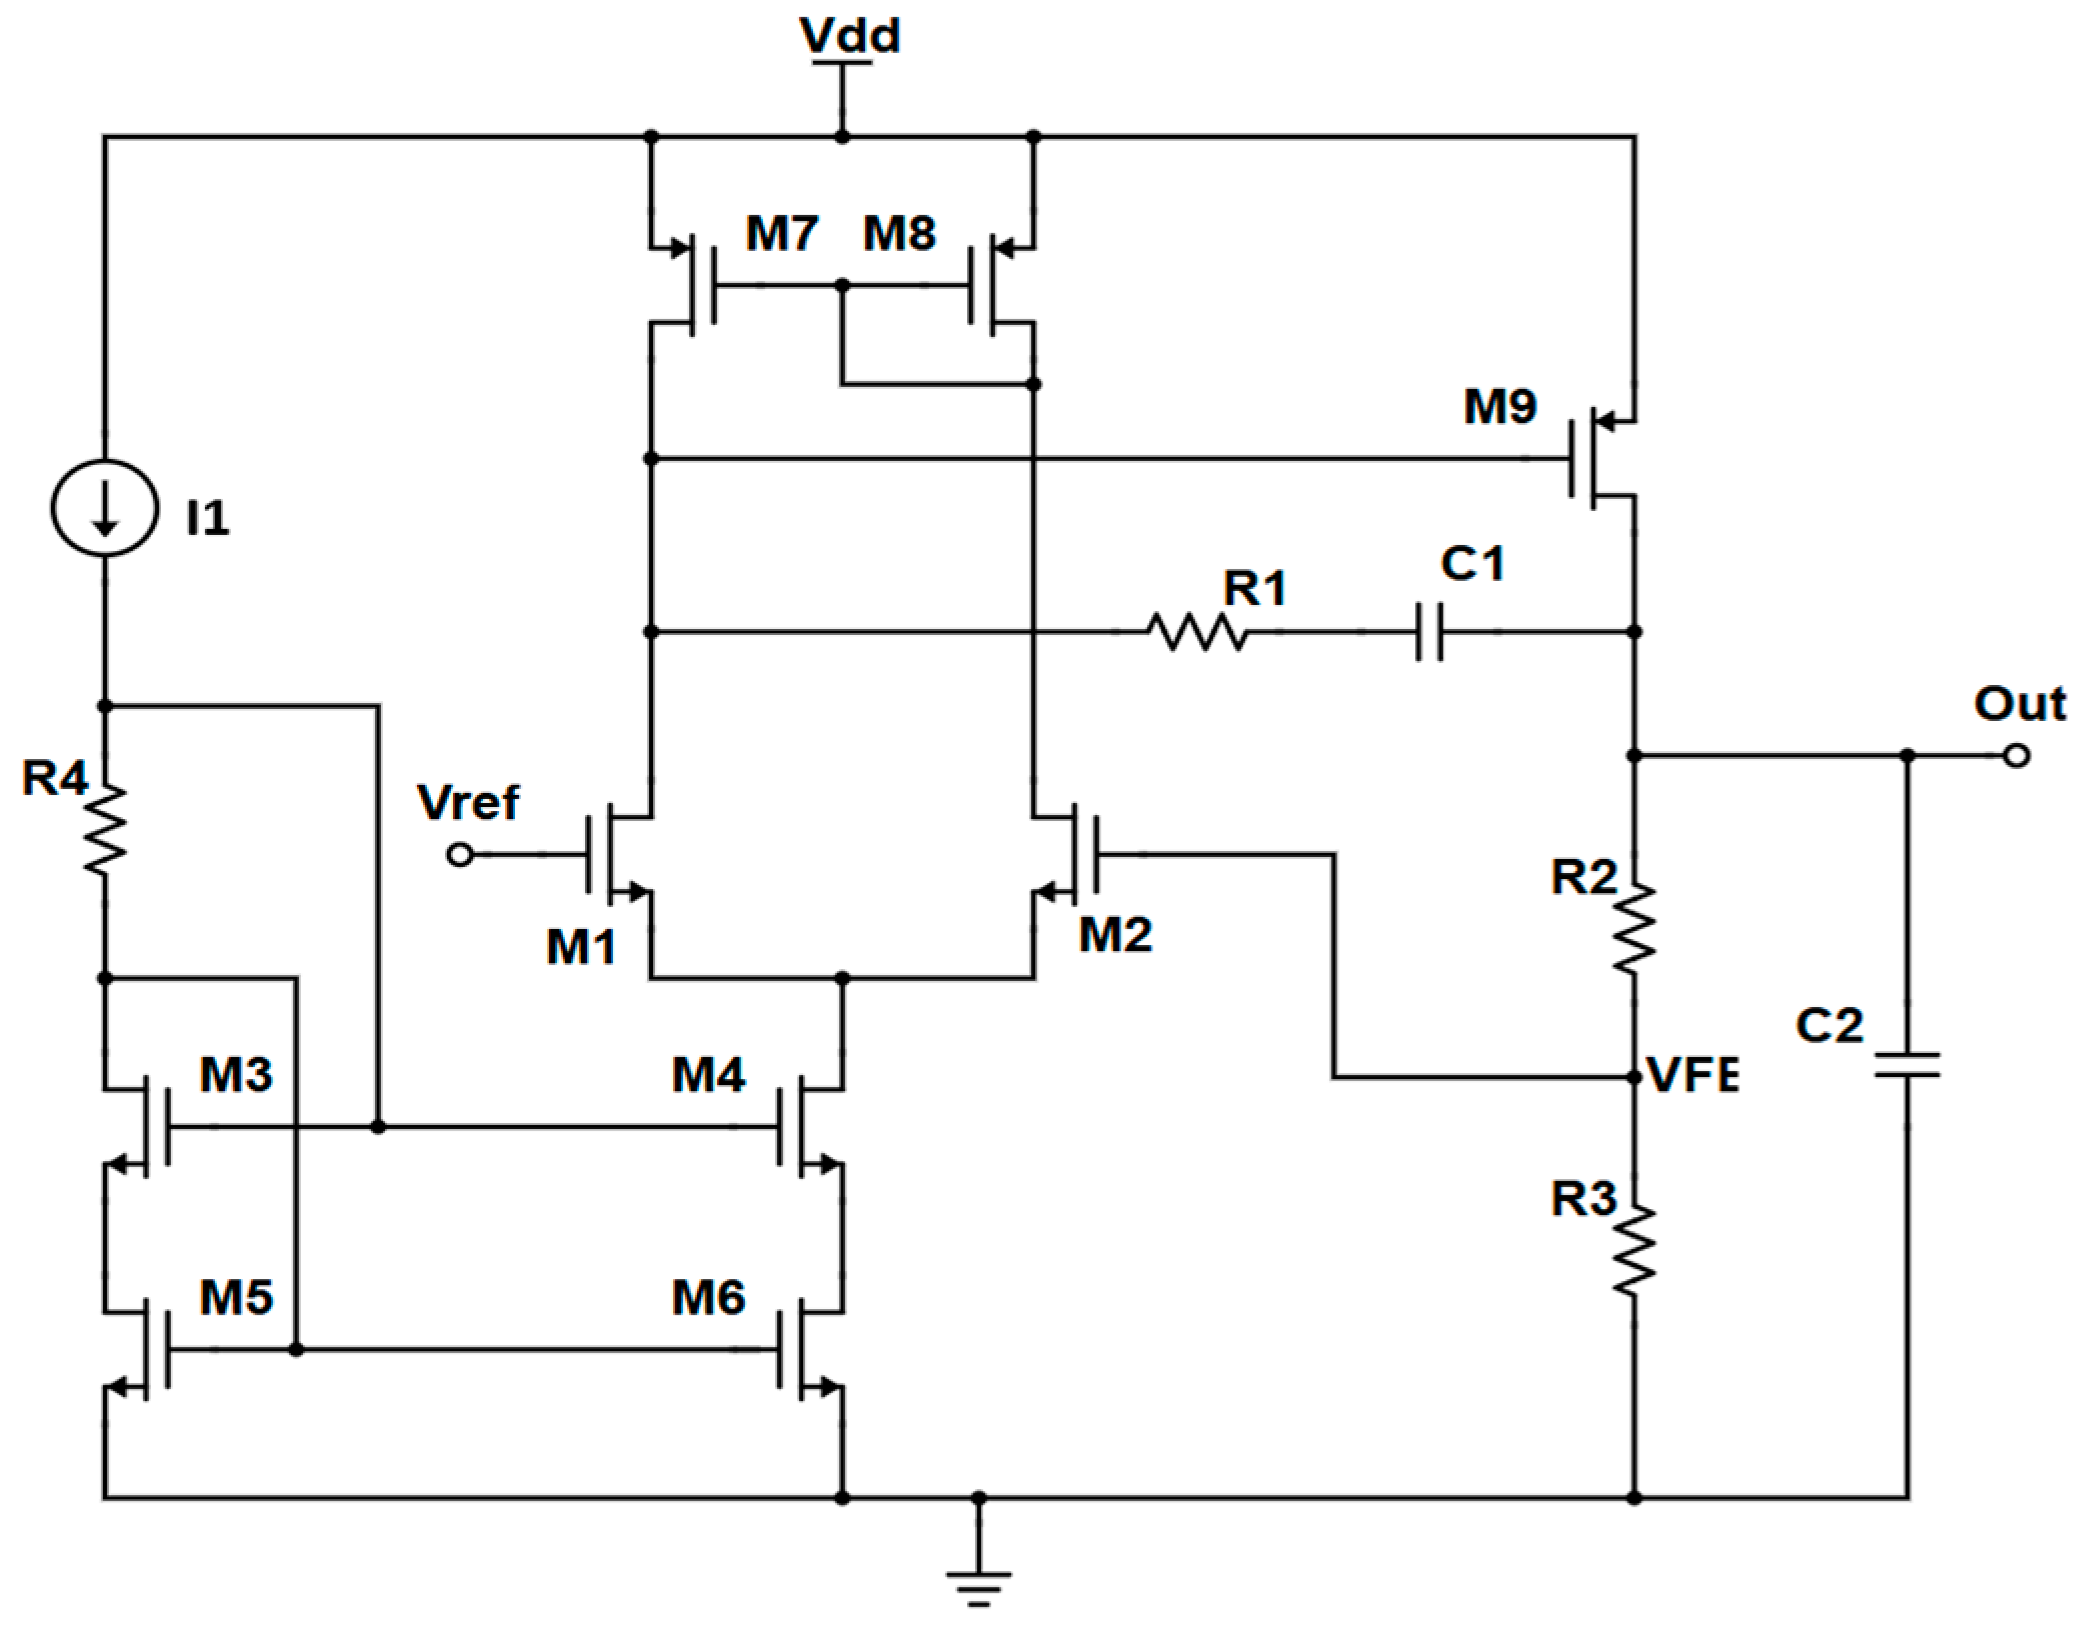
2.3. Low-Dropout Regulator (LDO)

LDOs [18,19] are essential components in modern electronics, providing stable output voltages even when the difference between input and output voltages is minimal. These devices operate as DC linear voltage regulators, ensuring reliable performance in sensitive circuits. The LDO schematic used in this paper is illustrated in Figure 6.
The LDO consists of two main components: an error amplifier (M1–M2 and M7–M8 transistors) and a pass transistor M9 [20], which work together to regulate voltage levels precisely.
A reference voltage [21] of approximately 1.5 V is available from design. This voltage reference corresponds to the VIN node in Figure 4, which will be summed to the charge pump output alongside the supply voltage VDD. A reference voltage, rather than VDD, was chosen as VIN to enable the use of symmetric low-voltage transistors, as explained in Section 2.2.
As stated above, the minimum voltage required to be added above VDD in order to only use one input differential pair is the sum of the gate-source voltage (VSG) and twice the overdrive voltage (2VOV), which is approximately 1.3 V. However, due to the influence of switches, capacitors, and the varying load current (ranging from 50 µA to 400 µA), voltage losses can cause the node to drop below the required minimum; thus, the available 1.5 V reference voltage could be insufficient. This drop prevents the operational amplifier from achieving the rail-to-rail input swing. Furthermore, the current capability must be ensured.
To mitigate this issue, the LDO is employed. When a 1.5 V voltage is applied at the input, the LDO boosts the output to 2 V. The pass transistor, M9, is sized appropriately to accommodate load currents between 50 µA and 400 µA. In this manner, the voltage losses can be surpassed and the current capability is ensured. The output voltage is defined by the formula:
V O U T = 1 + R 2 R 3 V R e f
Using this formula, the resistor values R2 and R3 can be calculated to achieve output voltage equal to 2 V. The LDO uses Miller compensation [22] and a nulling resistor. The nulling resistor shifts the pole from the right-hand plane to the left-hand plane, ensuring the amplifier’s stability and performance.
Without the LDO, the charge pump capacitor draws current directly from the reference voltage source during charging, causing voltage fluctuations that may affect circuit stability. Drawing current from the reference voltage causes its value to change, deviating from the precise 1.5 V required. To mitigate this, a buffer can be placed at the reference voltage output. However, while a buffer replicates the voltage, it cannot address the variations fully. Hence, the LDO is preferred to achieve a stable 2 V output. The transistor sizes and the corresponding values of the other components forming the voltage selection circuit are provided in Table 1.

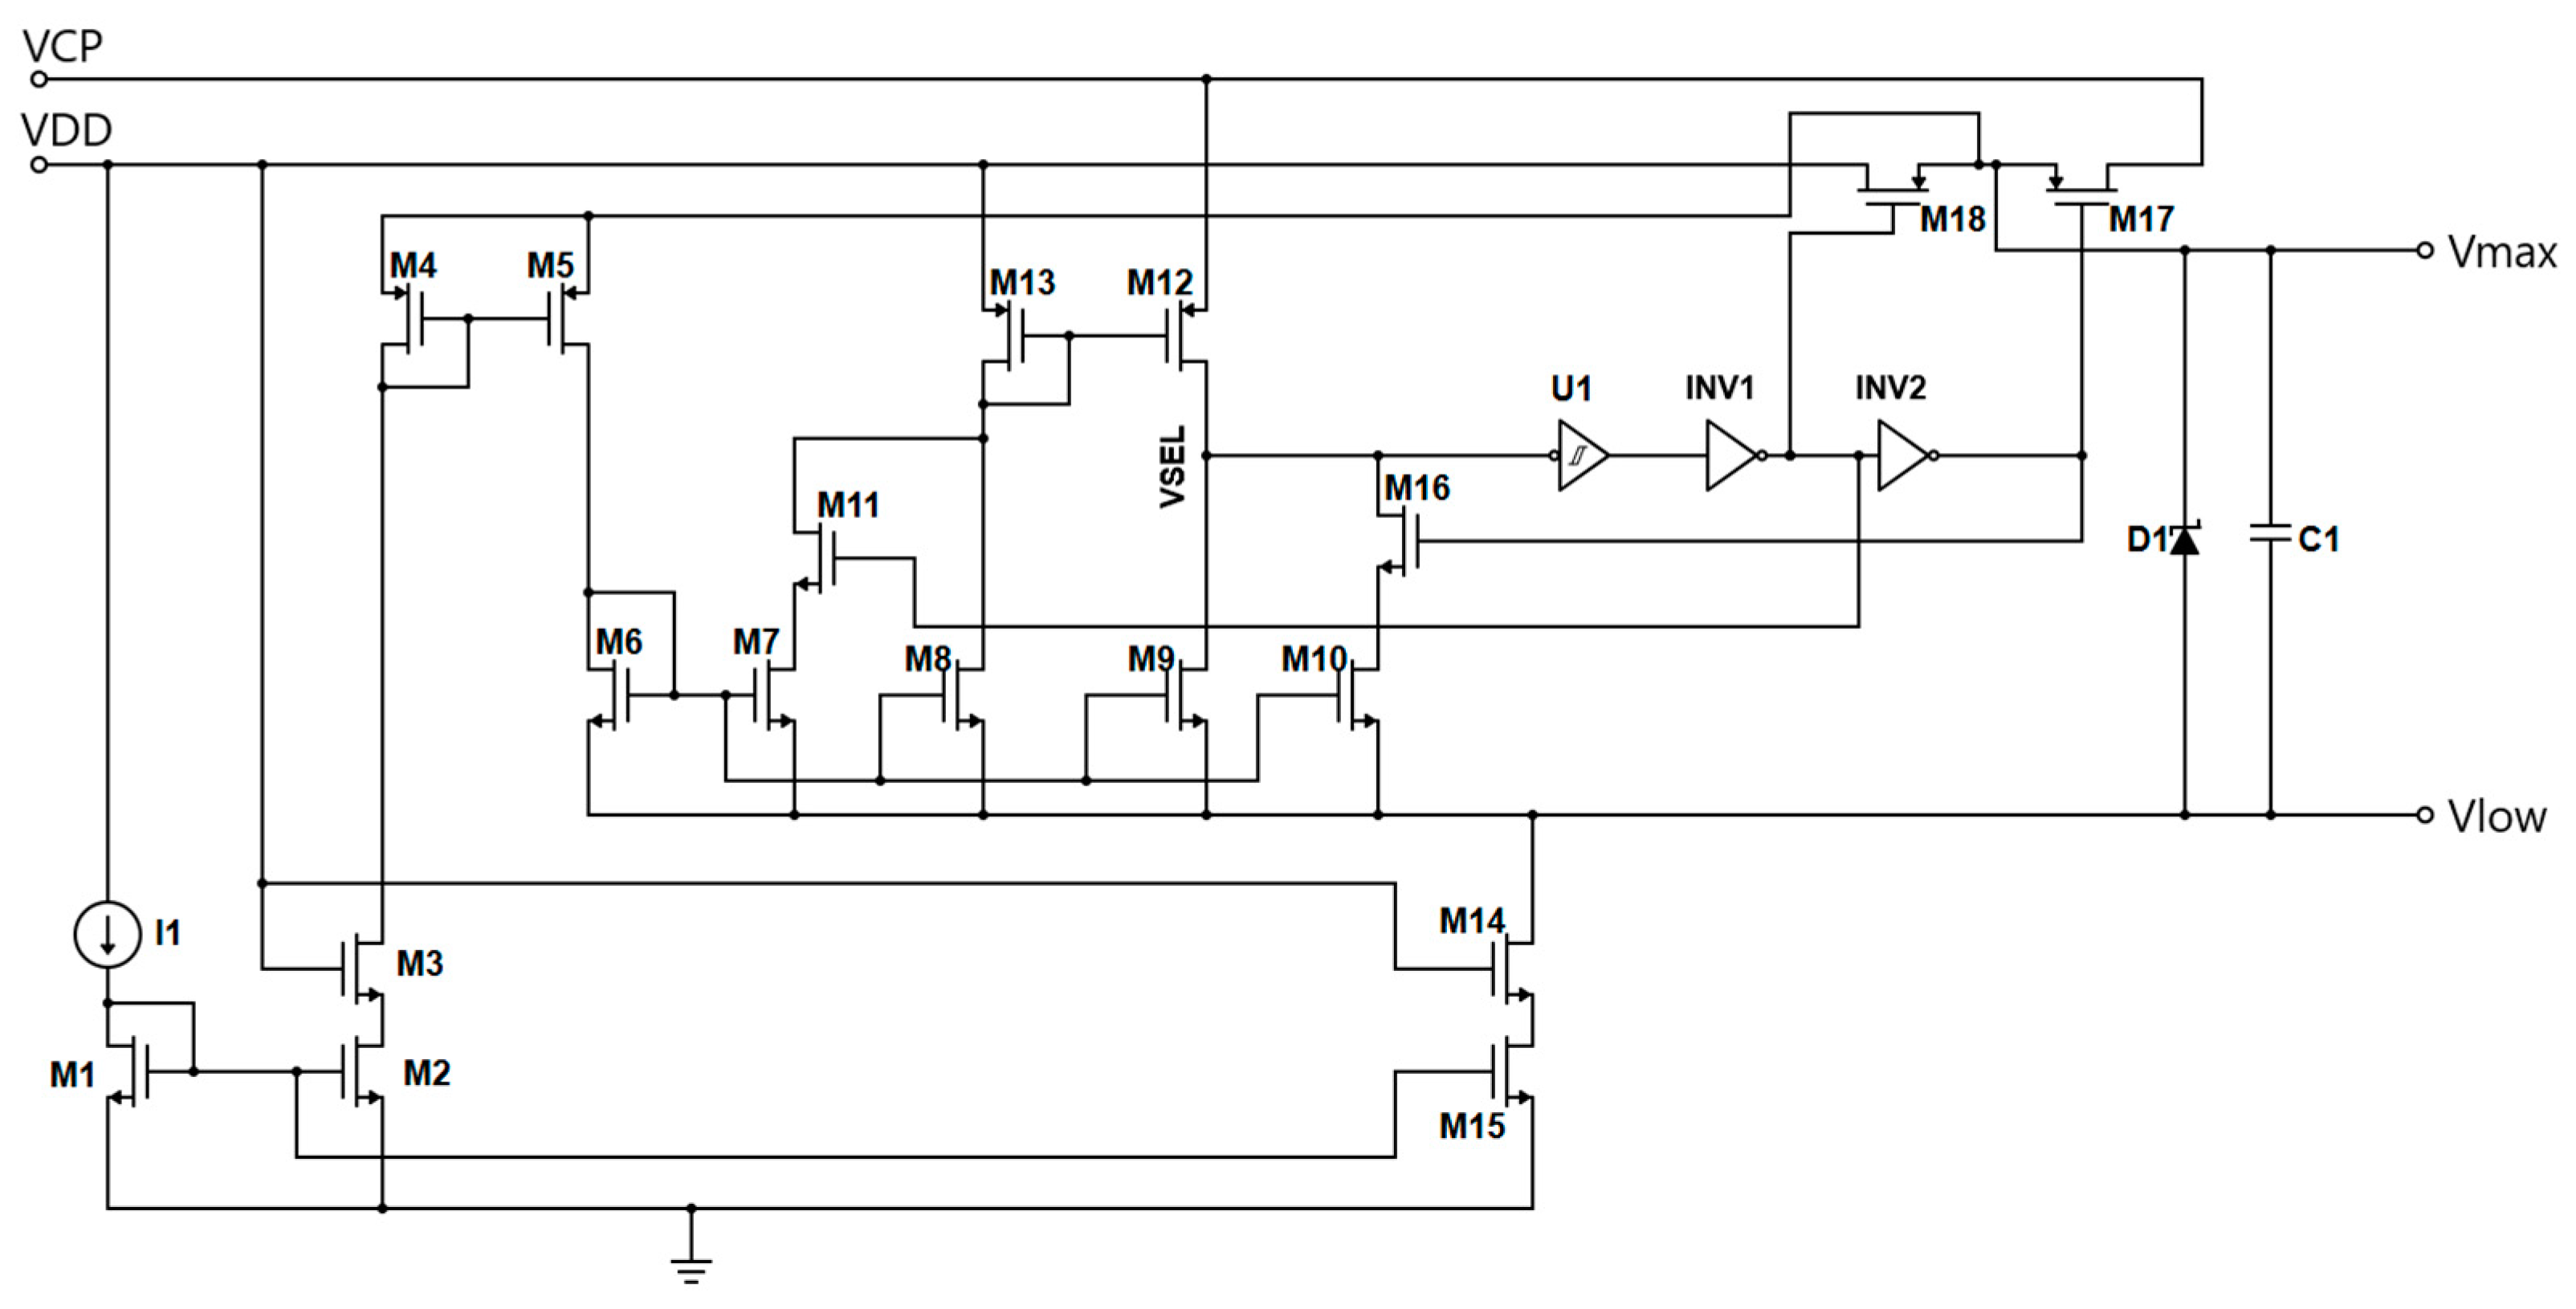
2.4. Innovative Supply Selector Circuit

The innovative circuit that selects the maximum available supply voltage in the system is presented in Figure 7. Its function is to compare the external supply voltage and the voltage generated by the charge pump architecture described in this paper, selecting the highest value.
This ensures that the two transistors, nMOS and pMOS, which connect the reference voltage (VREF), the supply voltage (VDD), and the charge pump (VCP), can be fully turned on or off, thereby maximizing the charge pump’s efficiency, which is based on the coupled capacitors’ principle.
The supply selector circuit principle is explained as follows. Transistors M12 and M13 read the voltage values at the VDD and VCP nodes. When the VCP node has a lower value than VDD, the M13 transistor’s source is at a higher potential than that of transistor M12, causing the VSEL node to be pulled down to VLOW by the nMOS transistor M9. The Schmitt trigger U1 converts the analog VSEL signal into a digital signal (input of the inverter INV1), ensuring a smooth transition. Consequently, the M18 transistor’s gate is pulled low by inverter INV1, while the M17 transistor’s gate is pulled high by inverter INV2. As a result, M18 is turned on, allowing the VDD signal to be transmitted to the VMAX output.
Conversely, when the VCP node has a higher value than VDD, the M12 transistor’s source is at a higher potential than that of transistor M13, causing the VSEL node to be pulled up to VMAX. In this case, the M18 transistor’s gate is pulled high by inverter INV1, while the M17 transistor’s gate is pulled down by inverter INV2. As a result, M17 is turned on, allowing the VCP signal to be transmitted to the VMAX output.
The transistor pairs M1–M2 and all transistors from M4–M10 represent current mirrors that multiply or demultiply the reference current I1. The nMOS transistors M3–M14 act as cascode stages, reducing the current variation through M2 and M15 with respect to the supply voltage. The nMOS transistors M11 and M16 introduce hysteresis into the circuit. The Zener diode D1 ensures a maximum voltage difference of 5.15 V between the VMAX and VLOW nodes, allowing the proposed architecture to be implemented in a low-voltage technology. The capacitor C1 smooths out potential variations that may arise. Transistors M14–M15 should be designed appropriately to ensure the necessary current for the proper circuit operation and the diode D1. The transistor sizes and the corresponding values of the other components forming the voltage selection circuit are provided in Table 2.

2.5. Top-Level View of the Proposed Charge Pump

The final charge pump schematic proposed in this paper is presented in Figure 8, illustrating all the components that constitute the design. The fundamental schematic, previously explained in Section 2.2, is highlighted using a rectangular frame. The error amplifier (AO), along with the feedback resistors R1 and R2, forms the low-dropout regulator described in Section 2.3, which provides both the input voltage for the charge pump and current-driving capability. The selector for the highest available voltage, in conjunction with the two level shifters (LVS1 and LVS2), ensures the complete switching operation of transistors M1 from M4.
A ring oscillator which is compensated in temperature and supply voltage is employed, generating a 50 MHz clock frequency at room temperature [23]. The oscillator produces two non-overlapping clock signals to maximize the charge pump efficiency. The inverter INV1 is utilized to bring the two clock signals into phase, as the OSC block (oscillator) generates complementary clock signals. Capacitor C1 functions as the switching capacitor between the reference voltage and the output, while C2 represents the charge pump output’s load. M1 and M2 transistors dimensions are W L = 44 0.5 μ m μ m and M3 and M4 transistors dimensions are W L = 60 0.5 μ m μ m .

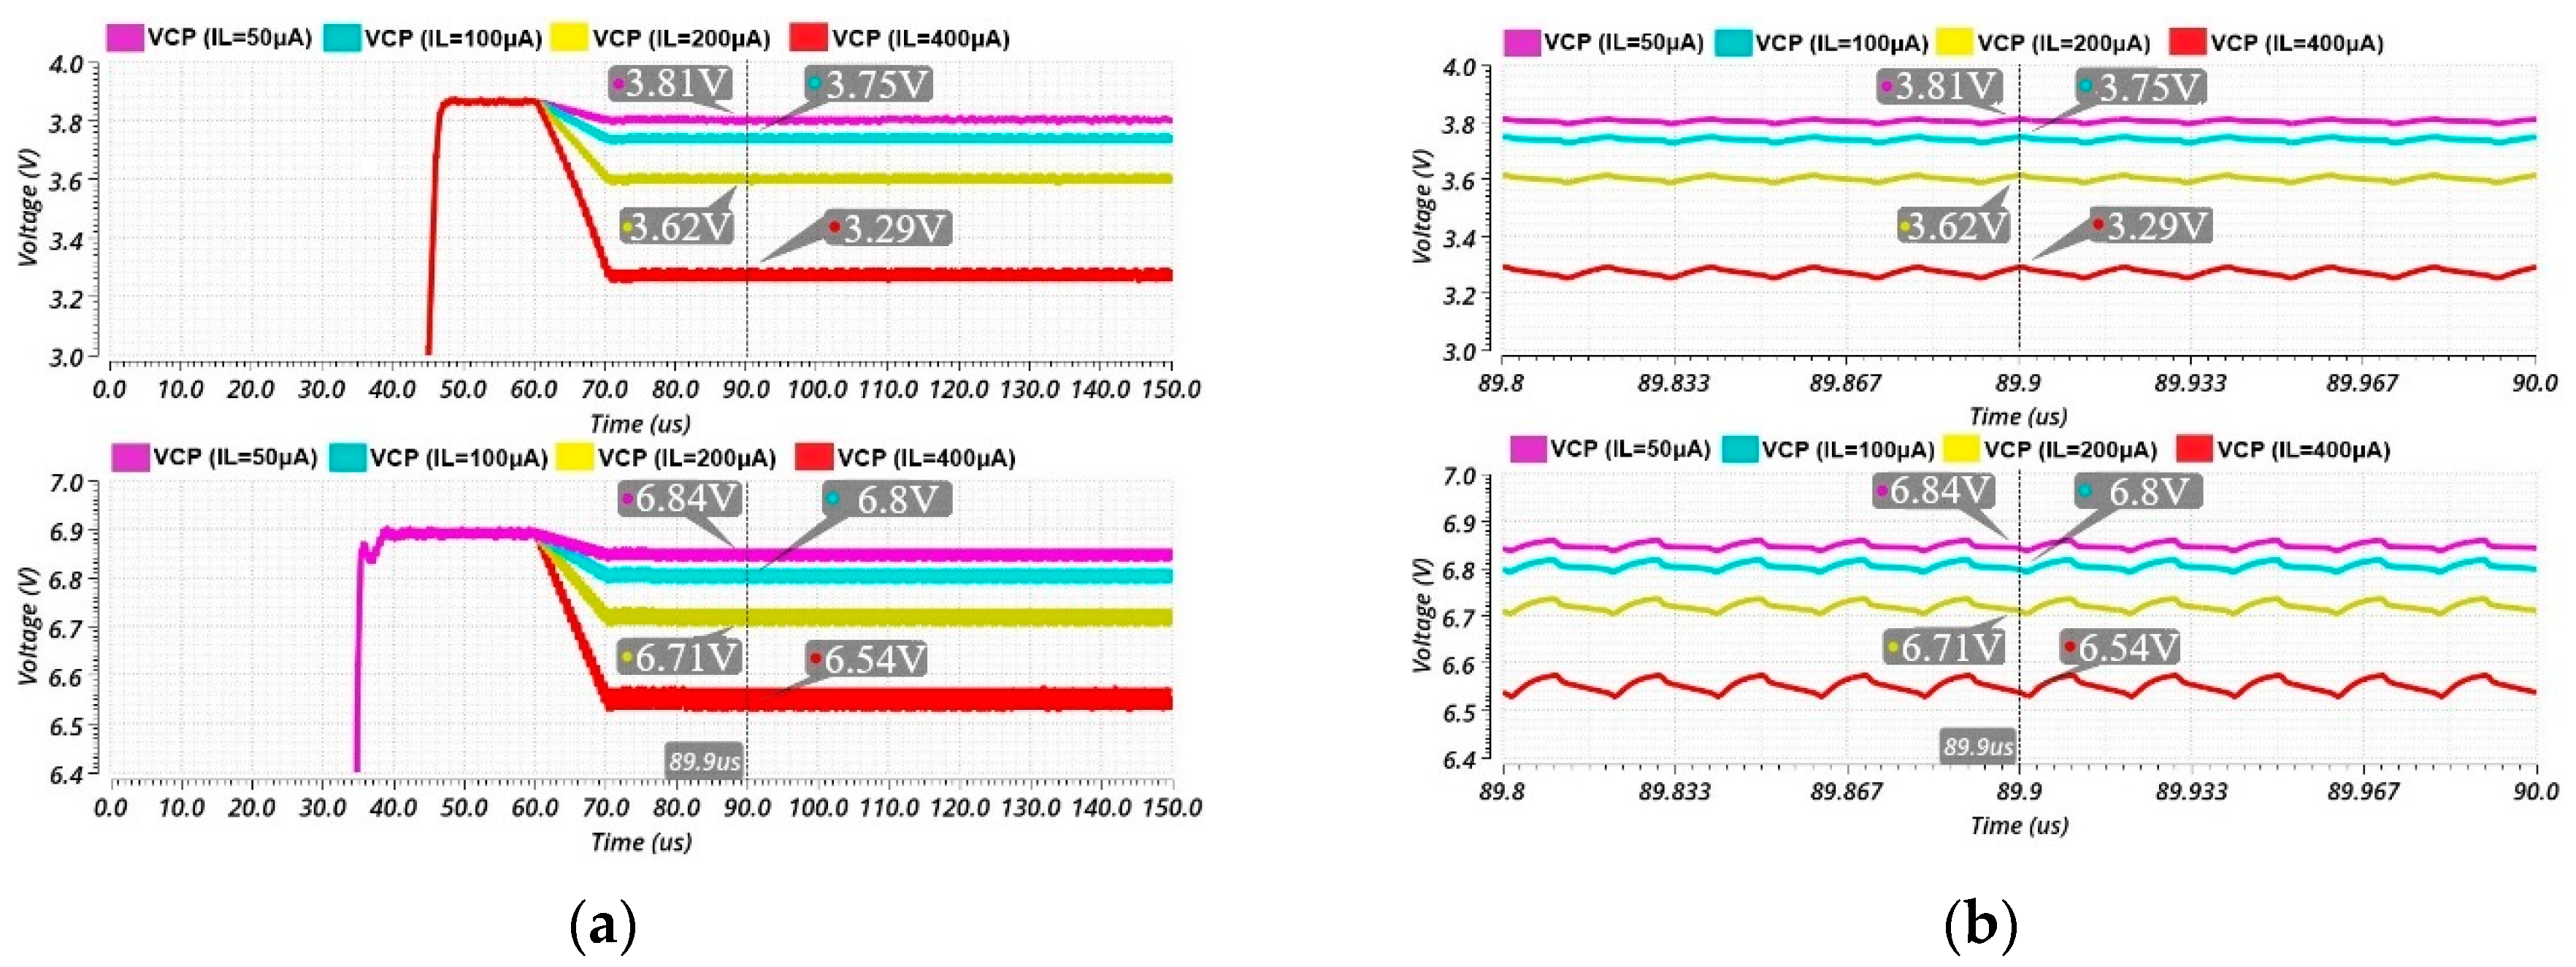
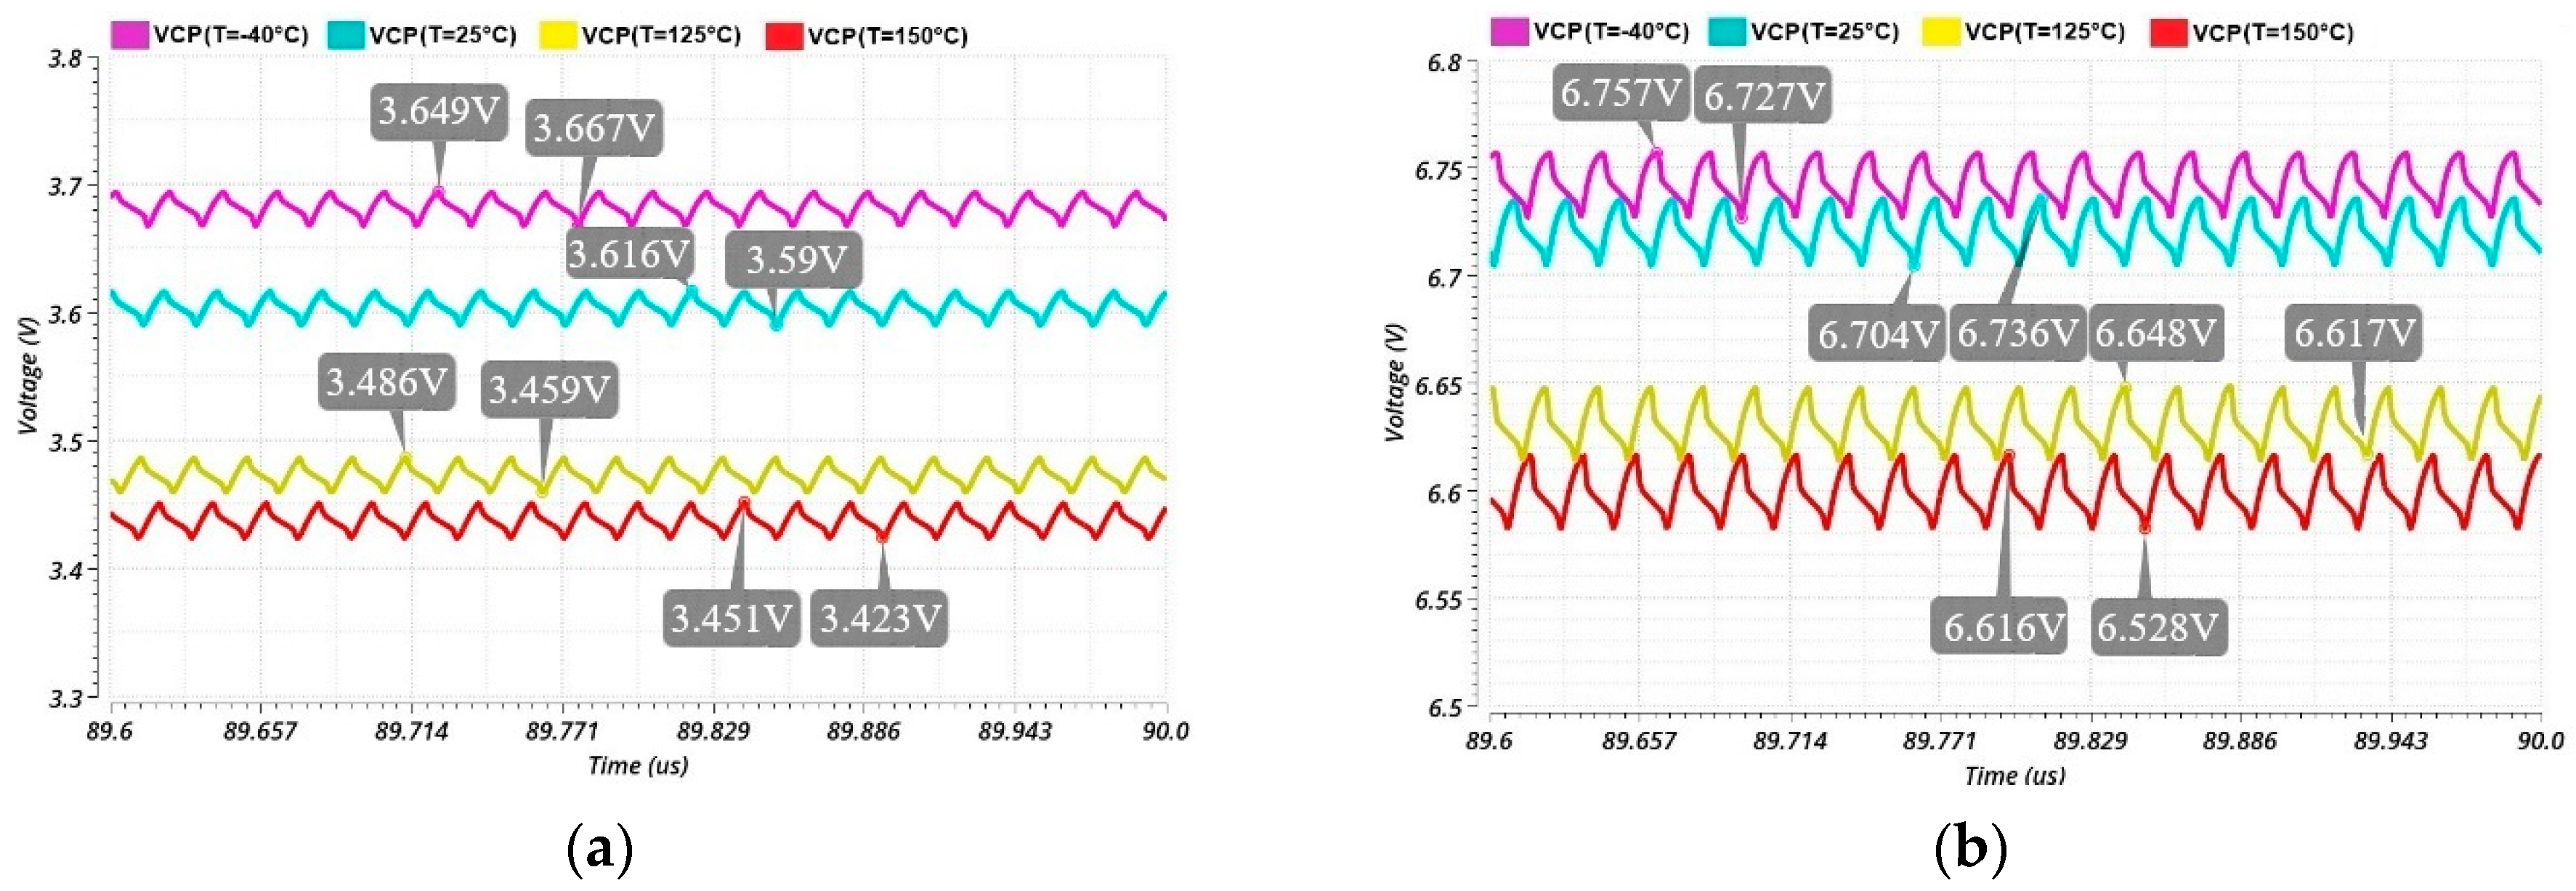
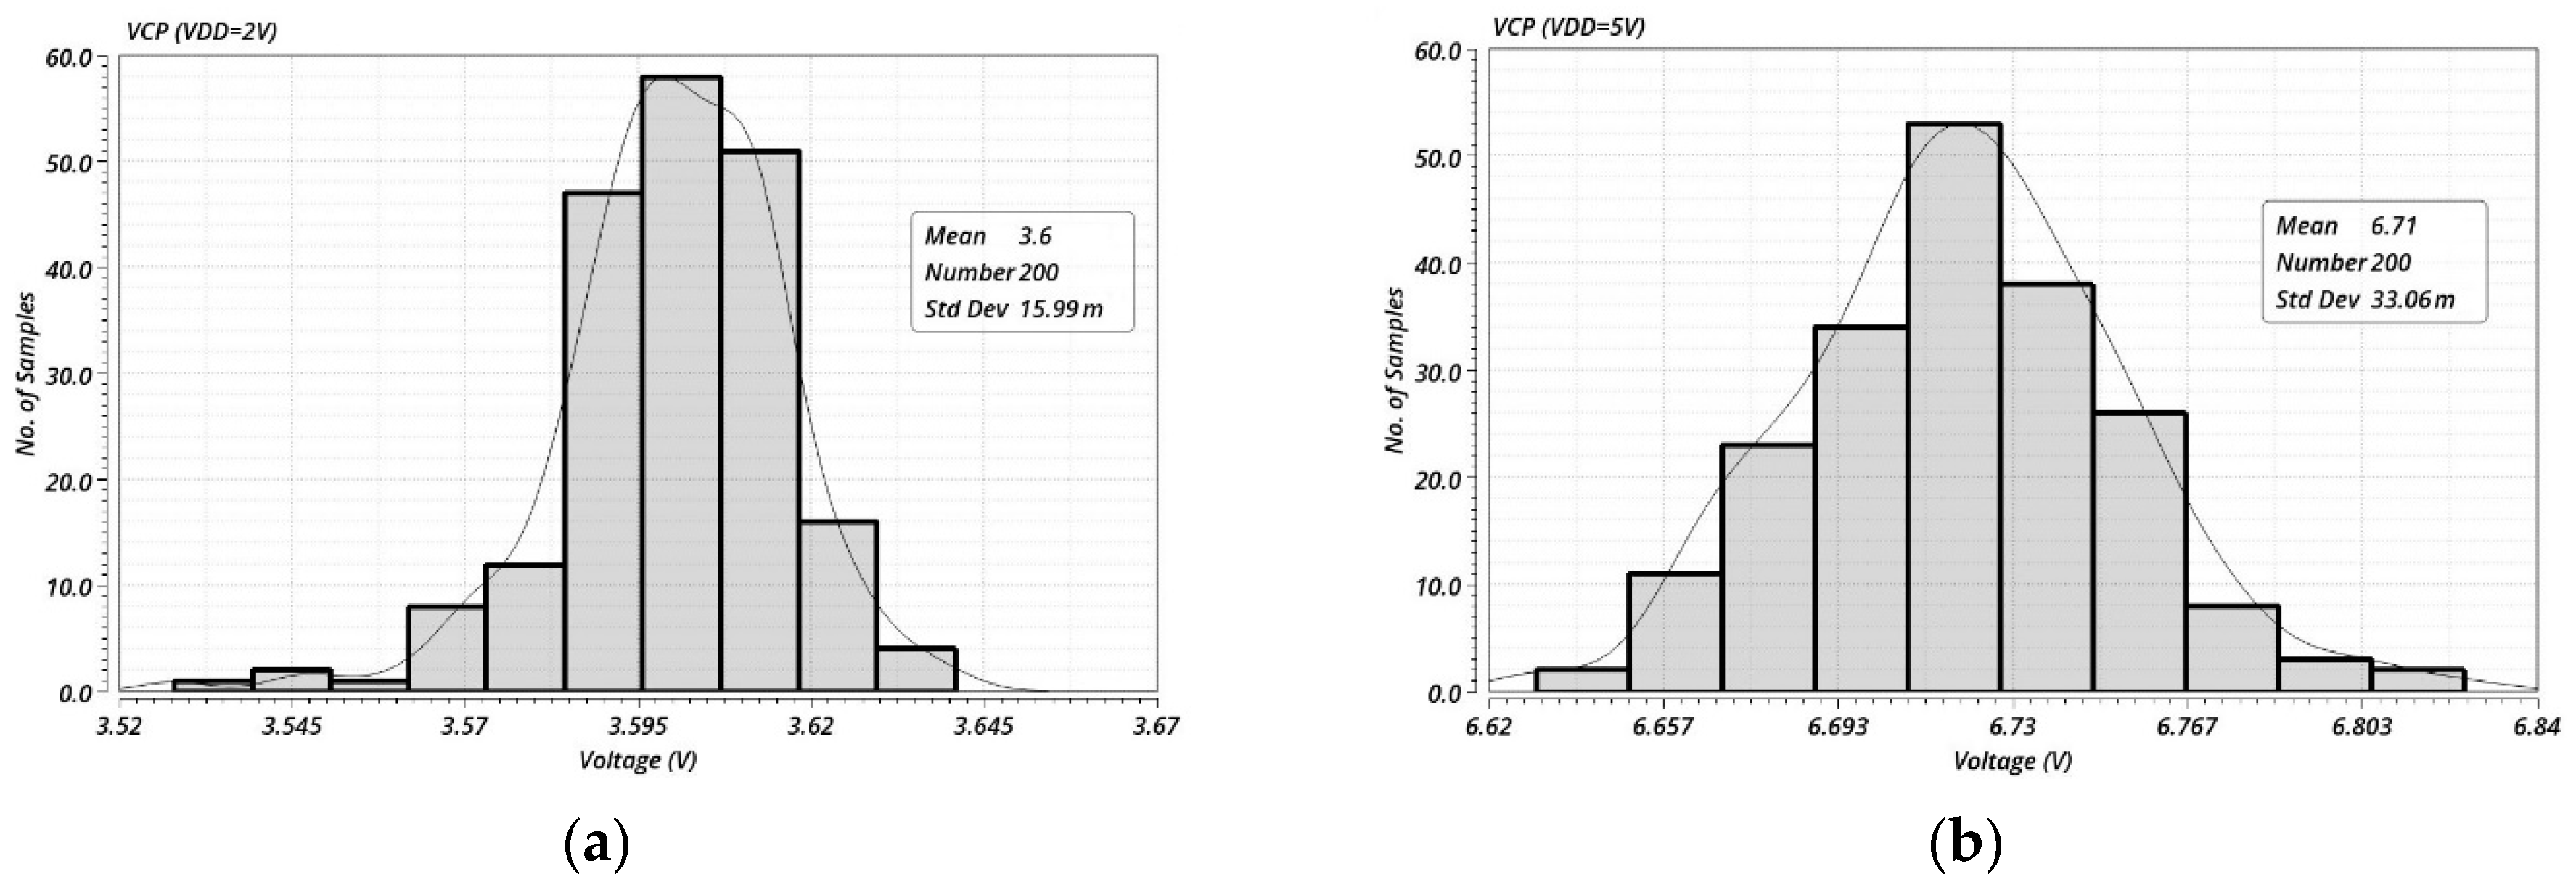
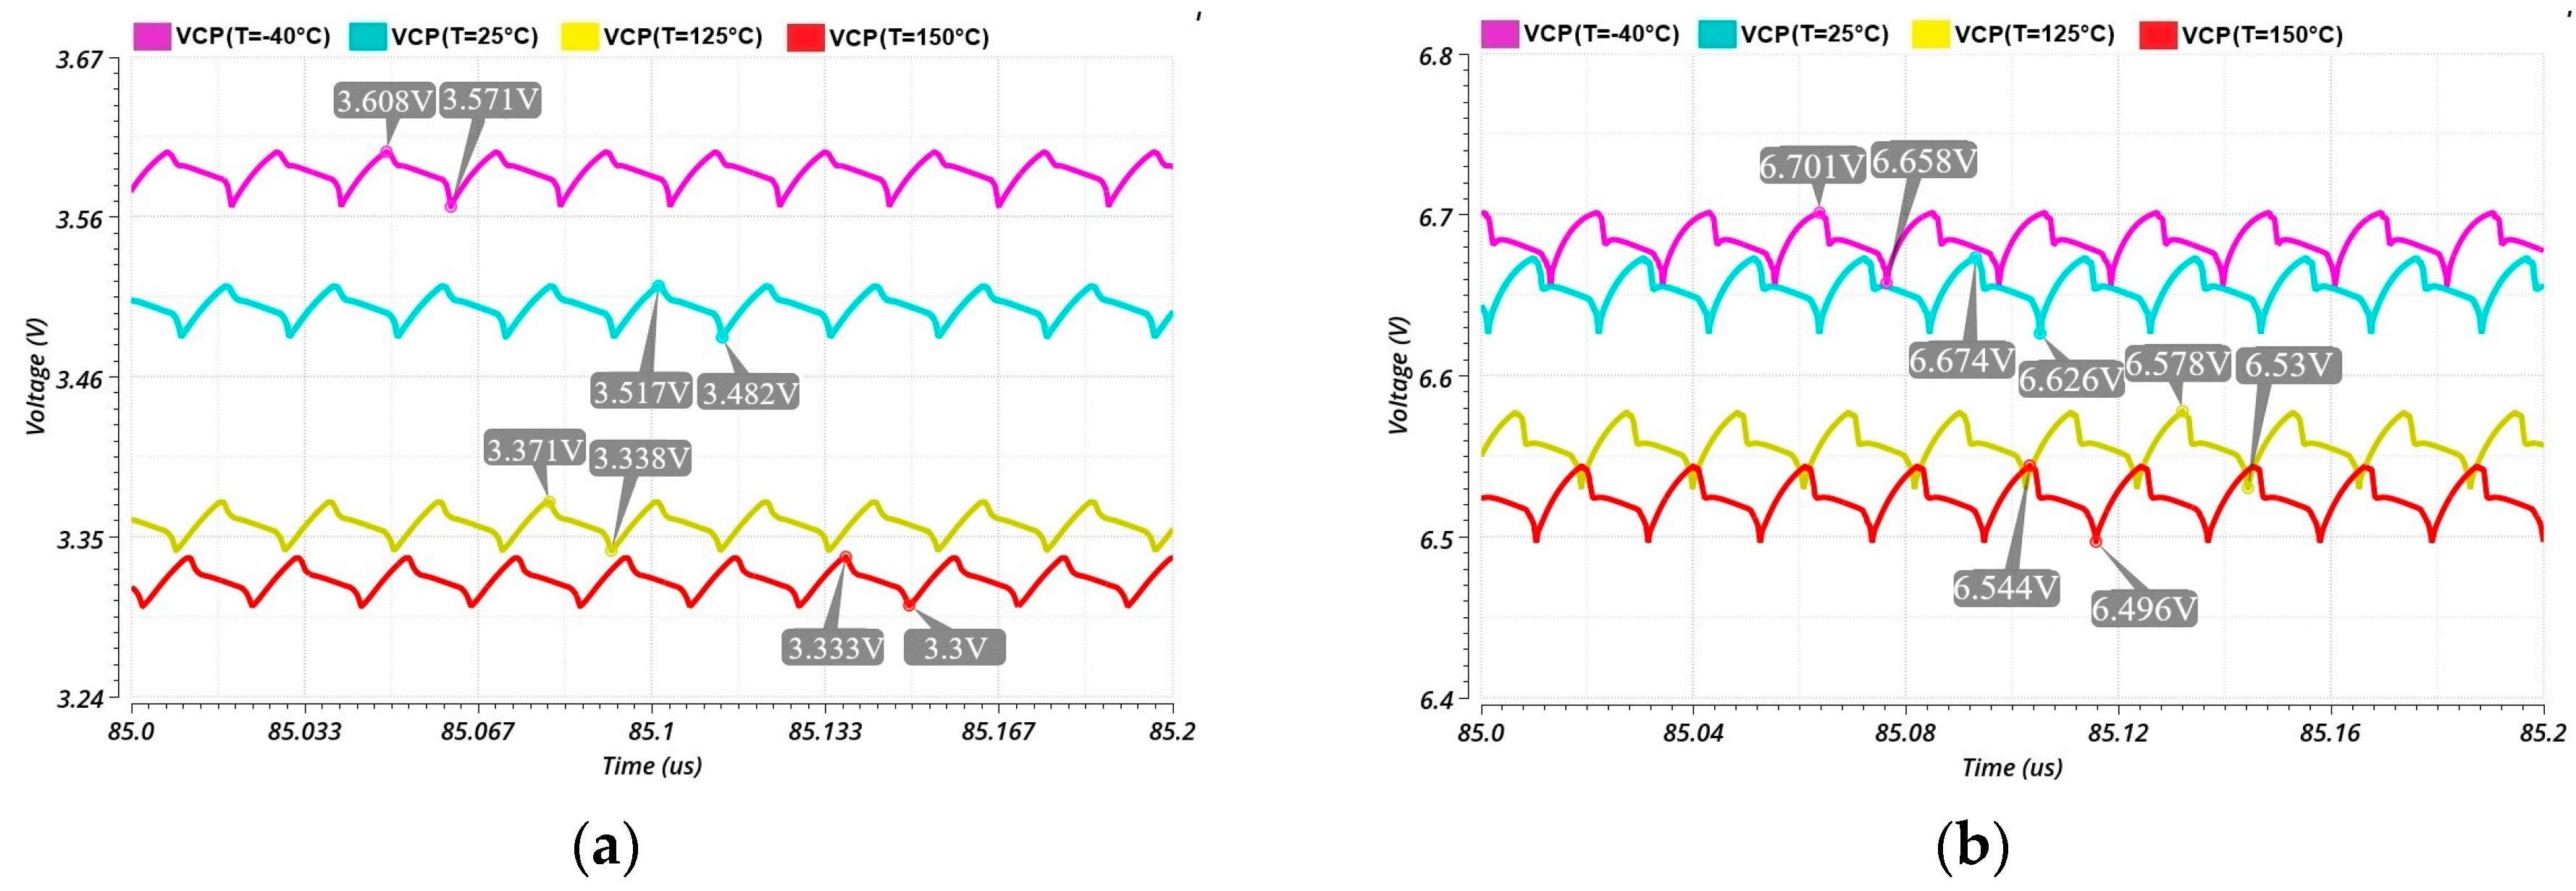
3. Simulations and Results

This chapter presents and discusses the proposed implemented method results based on circuit analysis. To evaluate the design performance, two types of simulations were conducted: schematic-level simulations (detailed in Section 3.1), which consider only the active and passive devices used in the circuit alongside their intrinsic parasitic effects (CGS, CGD, etc.) and parasitic extraction simulations (PEX—detailed in Section 3.2), which also add the parasitic contributions introduced by interconnecting wiring within the circuit.

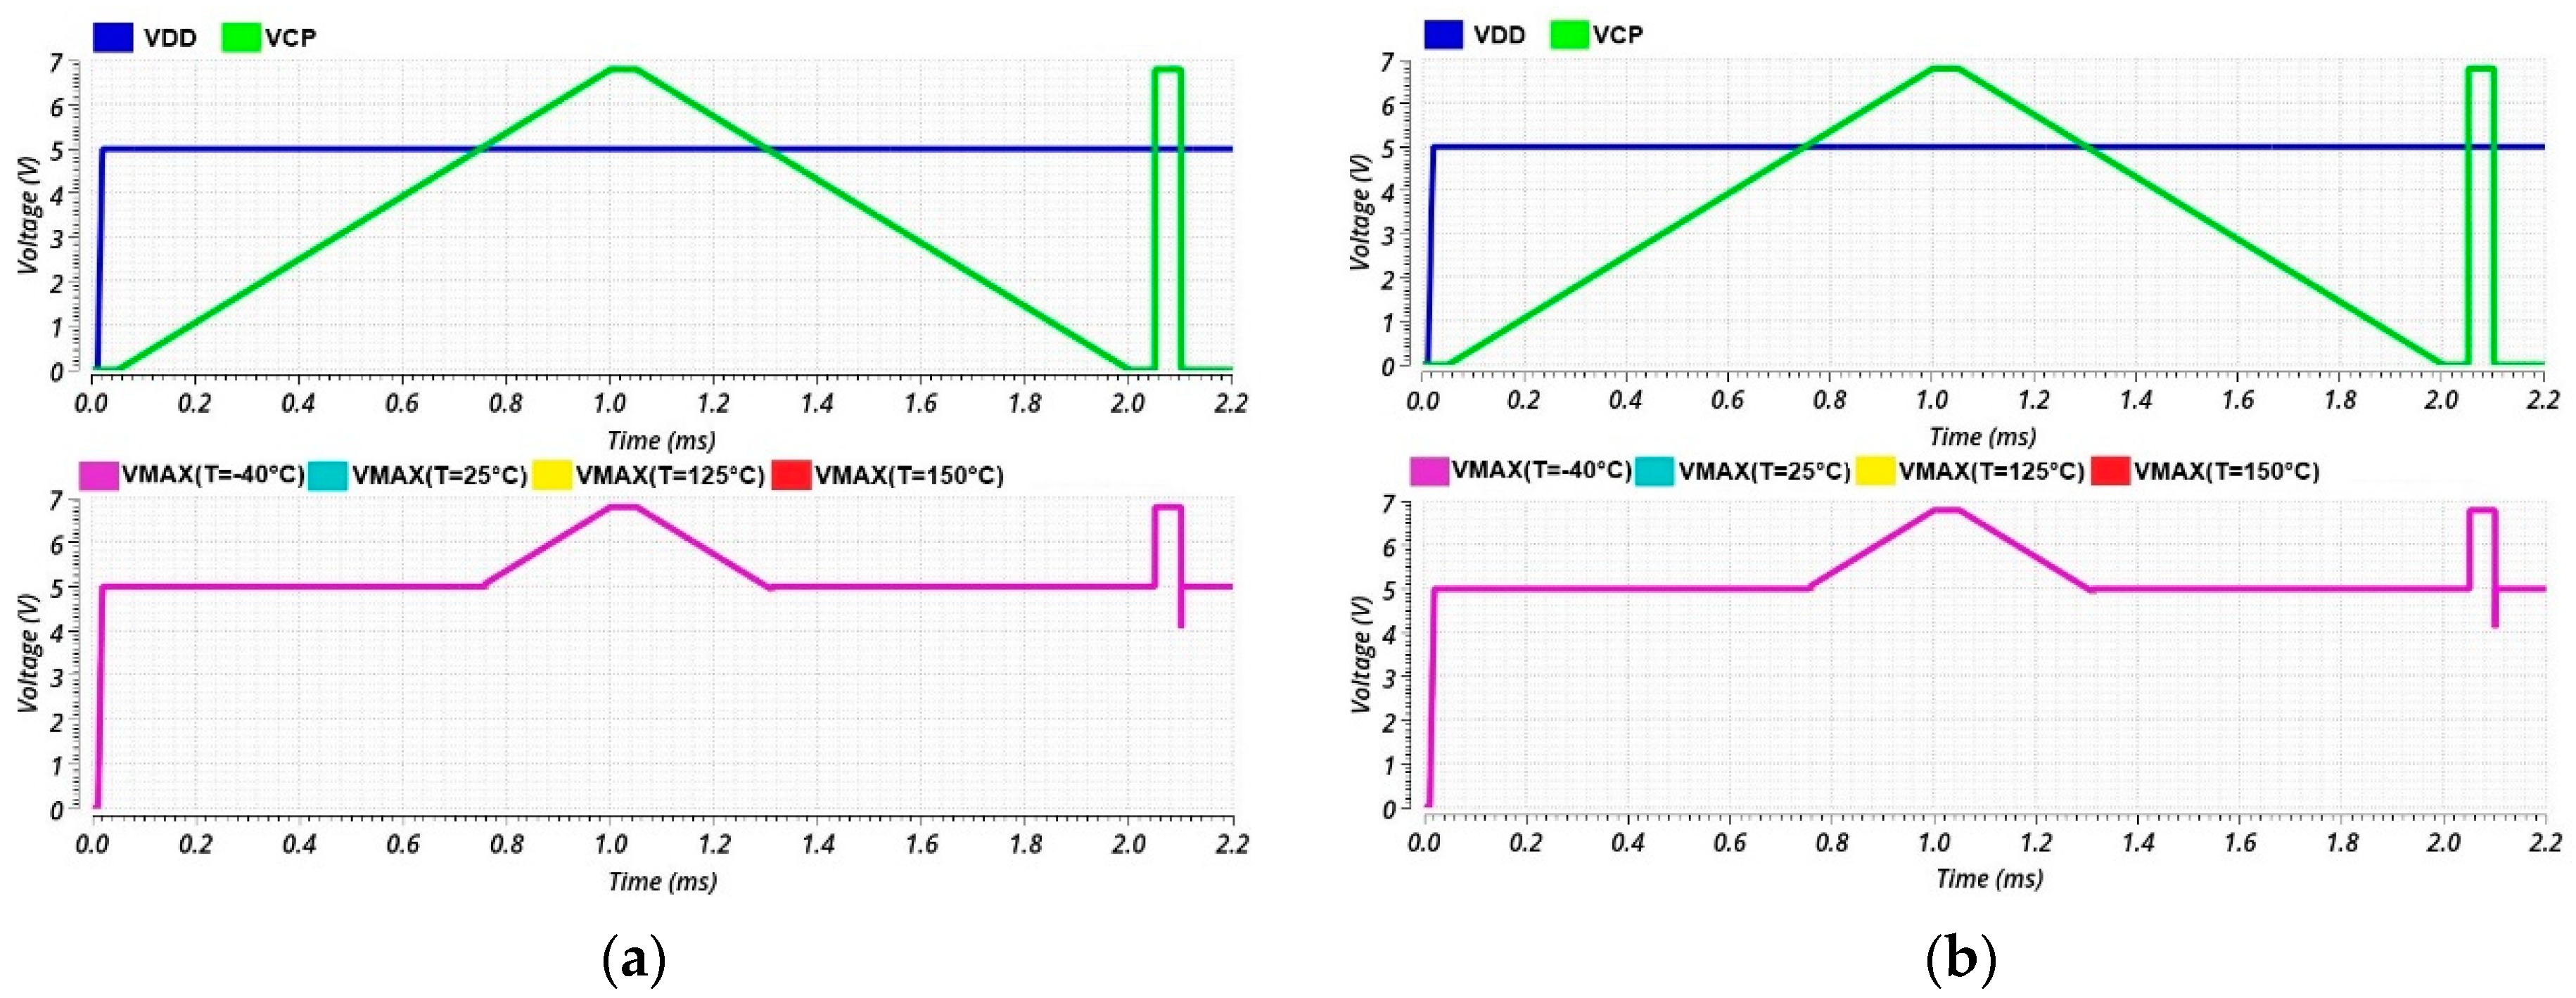
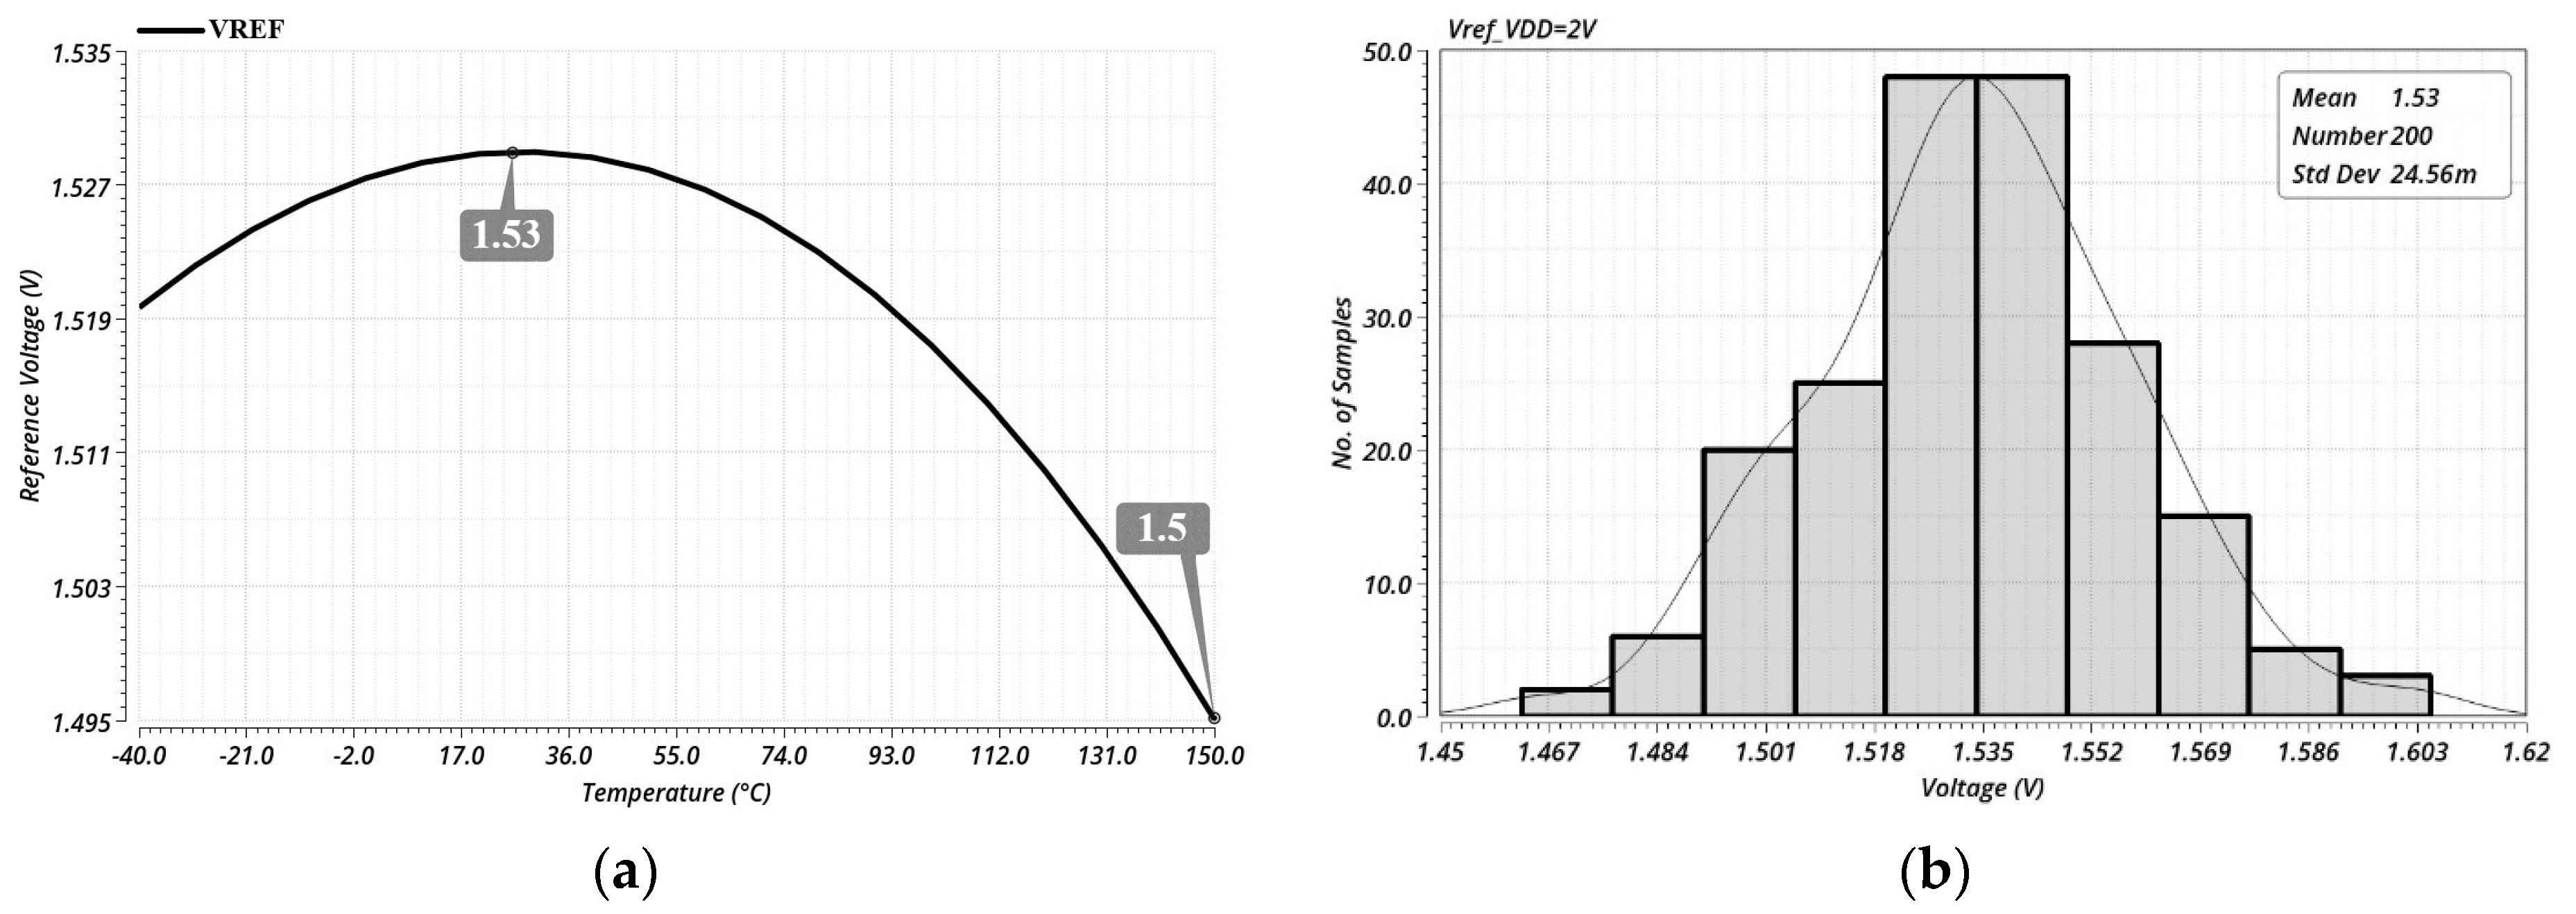
3.1. Schematic Level Simulations

The schematic-level simulations were carried out using the Cadence Virtuoso design environment, employing a 250 nm CMOS technology node. This technology was selected due to its stability at elevated temperatures—characterized by low leakage currents—as well as its proven reliability in automotive applications over time.
The supply voltage selector circuit performance is illustrated in Figure 9a,b, considering two supply voltages (2 V and 5 V) and four operating temperatures (−40 °C, 25 °C, 125 °C and 150 °C). The maximum value of VCP is set 1.8 V above the external supply voltage. In the upper section of the figures, the waveforms corresponding to the supply voltage and the charge pump’s output are depicted, while the lower section presents the VMAX voltage obtained at the selector output. It is important to note that, for the purpose of checking the supply selector’s performance, an ideal voltage source is used in this case for the VCP signal.
The results indicate that when VCP is below VDD, the circuit output follows the external power supply. Conversely, when VCP exceeds VDD, the voltage selector output accurately replicates the VCP’s behavior. Notably, regardless of the ambient temperature, the waveform remains unchanged, with the four graphs corresponding to the different temperatures overlapping perfectly.
The supply selector’s performance is also tested under fast transient input signals, as shown on the right-hand side of Figure 9a,b. Even when VCP undergoes an abrupt transition from 0 V to VDD + 1.8 V, the output successfully tracks the corresponding waveform without significant malfunctions. This demonstrates that the proposed model remains viable under all transient conditions.
Process variations can impact the proposed method’s quality. To assess the circuit’s performance under such conditions, slow and fast corner simulations are conducted. The results are presented in Figure 10a for the slow corner and 10b for the fast corner. This analysis focuses solely on the 5 V supply case, as the 2 V scenario exhibits identical behavior. The temperature range considered remains consistent with the typical case. The slow corner combines slow transistors’ turn-on and turn-off capability and a larger parasitic capacitance, due to a lower-than-normal carrier mobility. Accordingly, the fast corner exhibits faster turn-on and turn-off capability and a lower parasitic capacitance, due to a faster-than-normal carrier mobility.
In the slow corner (Figure 10a), the transistor’s threshold voltage shifts to a higher value, demanding a higher voltage to turn the devices on. Conversely, in the fast corner (Figure 10b), the threshold voltage is reduced, leading to a lower turn-on voltage for the transistors. A comparison between the two figures further reveals that process deviation does not impact on the circuit’s functionality. The waveforms corresponding to slow and fast process corners overlap closely, with only minor deviations on the order of a few µV.
Despite the process variations that could occur in the circuit manufacturing development, the supply selector schematic level simulations’ outcome confirms that the proposed technique remains a robust and effective solution for enhancing the switched-capacitor charge pump performance.
Another important charge pump parameter for this architecture that must be studied separately is the reference voltage VREF, since its value is added at the circuit output together with the supply voltage, thereby yielding the VCP voltage. The VREF’s dependency on temperature should be minimized to eliminate potential variations in the circuit’s final output voltage attributable to this parameter. If the reference voltage is to vary either directly or inversely with temperature, the charge pump’s output efficiency could be also affected by this specification (in addition to factors such as the switches’ RON resistance in the design, load current, output resistance, charge injection, etc.).
Following the discussion above, Figure 11a illustrates the influence of temperature on the reference voltage VREF. On the x-axis the temperature domain is represented and on the y-axis the reference voltage values according to different temperatures. It is observed that the voltage reference has a typical curvature with the ambient temperature, with the maximum value reached around room temperature (1.53 V) and a minimum voltage reached at 150 °C (1.5 V). The voltage drift with temperature obtained is T C = Δ V R E F Δ T V R E F _ N O M 10 6 = 105.26   p p m ° C . This is a typical value for first-order temperature compensation. For improved precision, second-order compensation would be necessary; however, this would require additional circuitry and was not the present paper’s objective.
Since Figure 11 shows only a typical simulation, in which device mismatches are not included, a Monte Carlo simulation was conducted using 200 points to account for these discrepancies. The sampling method selected for this paper is “low-discrepancy sequence”, as it covers the interest domain more quickly and evenly than random sampling. The histogram is depicted in Figure 11b for a VDD = 2 V and a temperature T = 25 °C.
It is observed that the mean value obtained in the Monte Carlo simulation is the same as that in a typical simulation (1.53 V), and the histogram exhibits a Gaussian distribution. Considering the standard deviation (σ = 24.56 mV), the reference voltage minimum and maximum values are VREF_MIN = 1.38 V and VREF_MAX = 1.68 V, respectively, when applying the mean ± 6σ technique for process improvement.
As highlighted in Section 2.4, to maximize the charge pump performance presented in this paper, it is necessary to implement a circuit that selects the maximum voltage available in the circuit. Without this additional block, the nMOS transistor M1 and the pMOS transistor M4 in the final charge pump schematic cannot be completely turned off or on, thereby affecting the circuit’s efficiency.
Figure 12 presents the charge pump output with and without the innovative supply selector circuit that has been implemented and explained above. The external supply voltages studied are 2 V and 5 V, with the temperature set at T = 25 °C. In the supply selector circuit’s absence, the charge pump VCP output decreases for both supply voltages. In the 2 V supply voltage case, the decrease is significant—approximately 960 mV. In percentage terms, the supply selector’s efficiency on the charge pump is 35.58%.
For a 5 V supply, the output’s voltage difference with and without the supply selector is smaller, only 300 mV. This is since the switching [24] of transistors M1 and M4 is better controlled as the supply voltage increases; however, the ripple is much higher in the supply selector’s absence. These results indicate that the transistors’ proper biasing used as switches is essential for enhancing efficiency, and that the innovative supply selector circuit proposed in this work improves the charge pump.
Subsequently, the designed charge pump response as a function of the load current is examined. Four load current values are tested: 50, 100, 200 and 400 µA, with the aim of ensuring an extensive range of biasing currents where the proposed method can be used to power the input stage. The obtained results are illustrated in Figure 13a,b.
In both figures’ upper section, the waveforms corresponding to a 2 V supply voltage are displayed, while the lower section shows the waveforms corresponding to a 5 V supply voltage. The selected temperature in this case is also T = 25 °C.
As the load current increases, the charge pump output voltage decreases: from 3.81 V (for VDD = 2 V) and 6.84 V (for VDD = 5 V) at ILOAD = 50 µA to 3.29 V (for VDD = 2 V) and 6.54 V (for VDD = 5 V) at ILOAD = 400 µA. Although, for a 2 V supply voltage, the drop at the VCP node is more pronounced (520 mV vs. 300 mV), the 3.29 V value remains sufficient to power the differential stage (the minimum charge pump output node voltage being defined as: VCP_MIN = VDD + VTH + 2VOV = 3 V, in a cascode current mirror case, with an 800 mV typical threshold voltage and a 100 mV saturation voltage).
Additionally, in Figure 13b a zoom has been applied on the x-axis to better understand the waveforms and the ripple behavior. It can be observed that the ripple increases as the load current increases. The implemented charge pump can support a wide range of bias currents for the input differential stage; thus, it is up to the IC designer which parameters to prioritize, depending on what it is required to achieve.
An important charge pump parameter that must be analyzed is the output ripple. Its value depends on the load current, the switches’ on resistance RON, and the circuit load capacitance. The simplest method to improve this parameter is to increase the load capacitance; however, the main drawback is the proportional increase in chip area. IC designers seek state-of-the-art solutions to minimize the output ripple as much as possible. In general, a trade-off is reached between the ripple magnitude and other required parameters.
This paper also addresses the output ripple issue, and Figure 14a,b present the results obtained for this parameter at four different temperatures: −40 °C, 25 °C, 125 °C, and 150 °C, and for two supply voltages: VDD = 2 V and VDD = 5 V. The load current is set to ILOAD = 200 µA.
To facilitate a clearer understanding of the obtained results, a zoom-in is performed on the graphs along both the y- and x-axes. It can be observed that the ripple value does not vary significantly with temperature for either supply voltage. The maximum fluctuation occurs at 5 V supply voltage (ΔVRIPPLE = 4 mV), while for a 2 V supply, the temperature-induced variation is negligible, measuring only 1 mV. The typical ripple values obtained for the designed charge pump are 26 mV (VDD = 2 V) and 32 mV (VDD = 5 V). Based on this analysis, an increasing trend in ripple value is observed as the supply voltage increases.
Like the voltage selector analyzed earlier, verifying the charge pump functionality across different process corners is essential to ensure optimal circuit performance under worst-case conditions. Consequently, simulations were conducted for both slow and fast process corners, and the results are illustrated in Figure 15. In this case, the same four temperatures are utilized to analyze the circuit: −40 °C, 25 °C, 125 °C, and 150 °C, with the charge pump load current set to 200 µA.
As shown, the process variations do not significantly impact the designed charge pump output, regardless of ambient temperature or supply voltage. When comparing the results obtained for different process corners at the two supply voltages, the charge pump output variations (ΔVCP) are as follows: 60 mV (T = −40 °C, 25 °C), 50 mV (T = 150 °C), 40 mV (T = 125 °C), results obtained for VDD = 2 V. In the 5 V case, the ΔVCP variation for different process corners is tighter: 60 mV (T = −40 °C), 20 mV (T = 125 °C), 10 mV (T = 25 °C), and 0 mV (T = 150 °C).
The relatively small fluctuations observed in the corner simulations indicate that the designed charge pump remains unaffected by process-induced parameter shifts, maintaining its reliability across all studied conditions (including the most unfavorable ones, where all parameters are shifted in a single direction).
To evaluate and account for the mismatch among the devices that design the charge pump, Monte Carlo simulations were performed with a total of 200 samples. The selected temperature for this analysis is T = 25 °C, using the same load current as in the previous two simulations (ILOAD = 200 µA). The resulting histograms are presented in Figure 16: (a) for VDD = 2 V and (b) for VDD = 5 V. It can be observed that, for the higher supply voltage, the charge pump standard deviation output doubles, increasing from 15.99 mV (VDD = 2 V) to 33.06 mV (VDD = 5 V). This outcome is expected, since for the lower supply voltage the added VREF value above the supply is equal to the supply voltage, thereby limiting the variations induced by the feedback amplifier; in this case, the two-stage op-amp output is biased in the linear region (for any other VDD value, the pMOS output transistor would operate in subthreshold region).
If we consider the mean ±6σ principle once more, then the minimum output value obtained in 99.999% of cases for the two scenarios studied is 3.5 V (VDD = 2 V) and 6.51 V (VDD = 5 V). These values are more than sufficient to power the op-amp’s input differential stage. A summary of the results obtained for an ambient T = 25 °C temperature and both supply voltages is presented in Table 3.

3.2. Post-Layout Simulations

Parasitic effects, including wire resistance, vertical capacitance, and coupled capacitance, can significantly impact on the parameters and the charge pump’s overall functionality. To accurately assess the circuit’s performance while accounting for these factors, post-layout simulations are conducted using the parasitic extraction (PEX) method. The R_C_CC model has been employed in this paper. These post-layout simulations provide the most precise results, offering a comprehensive prediction of how the proposed design will behave in silicon.
Figure 17a,b present the results obtained from PEX simulations performed on the designed charge pump for different load current values. The same test conditions described in Section 3.1 are maintained: four load currents (50 µA, 100 µA, 200 µA, and 400 µA), an ambient temperature of T = 25 °C, and two supply voltages, VDD = 2 V and VDD = 5 V.
The results show that the output VCP obtained from PEX is lower under all tested conditions compared to the results illustrated in Figure 13a,b. The primary factor contributing to this efficiency reduction is the metal interconnects’ resistivity, which, in combination with the switches’ RON resistance, affects the connections between the low-dropout regulator (LDO), switches, supply voltage, and charge pump output. Additionally, secondary effects such as coupled capacitances and a lower clock frequency obtained after PEX simulations (f = 48.13 MHz) further influence performance degradation.
The lowest efficiency is observed for a 400 µA load current and a 2 V supply voltage. Under these conditions, the obtained output voltage is VCP = 3.11 V, which is 180 mV lower than the result obtained from the schematic-level simulation. However, this voltage remains above the critical threshold required for the differential input stage’s proper operation (VCP_MIN = VDD + VTH + 2VOV = 3 V); thus, the charge pump delivers an appropriate output voltage, even under high input current conditions.
Next, the ripple at the charge pump output is analyzed based on the PEX simulation results. The test conditions are identical to those described in Figure 14a,b, including four temperature levels (−40 °C, 25 °C, 125 °C, and 150 °C) and two supply voltages (VDD = 2 V and 5 V). The results are presented in Figure 18a,b.
It is observed that the output ripple is higher compared to the results obtained from schematic-level simulations. This increase is primarily due to the lower clock frequency that was also mentioned above, which allows the capacitor to charge and discharge over a longer period.
Comparatively, at an ambient temperature of 25 °C, the ripple values obtained from PEX simulations are 9 mV and 16 mV higher than those from schematic-level simulations, as shown in Figure 14a,b. Specifically, for VDD = 2 V, the ripple increases from 26 mV (schematic) to 35 mV (PEX), while for VDD = 5 V, it rises from 32 mV (schematic) to 48 mV (PEX).
When analyzing the ripple variation with temperature, the change remains quite tight: only ΔVRIPPLE = 4 mV for a 2 V supply voltage and ΔVRIPPLE = 5 mV for VDD = 5 V.
To further increase the confidence in the proposed charge pump architecture results after parasitic extraction, slow and fast corners are also performed. As explained earlier in this paper, these corners represent the worst-case scenario in which the proposed circuit could operate.
Furthermore, the models accompanying the devices used in this work are very precise, being verified after thousands of circuits that were designed with them. The results achieved are illustrated in Figure 19a,b (slow and fast for VDD = 2 V) and Figure 19c,d (slow and fast for VDD = 5 V).
Again, as shown in the waveforms above, the process variations after PEX do not substantially impact the designed charge pump output, regardless of ambient temperature or supply voltage. When comparing the results obtained with process variations at the two supply voltages, the charge pump output fluctuations (ΔVCP) are as follows: 80 mV (T = −40 °C), 100 mV (T = 25 °C), 110 mV (T = 125 °C), and 140 mV (T = 150 °C), results obtained for VDD= 2 V. In the 5 V case, the ΔVCP variation for different process corners is again tighter: 30 mV (T = −40 °C), 50 mV (T = 25, 125 °C), 10 mV (T = 25 °C), and 20 mV (T = 150 °C).
The results accomplished after parasitic extraction highlight the fact that the proposed charge pump with a novel supply selector circuit that controls the switches’ gates is suitable to bias different op-amp input differential stages, from low-power applications to automotive ones.
A summary of the PEX results obtained in this paper is presented in Table 4 alongside a comparison between these outcomes and the ones obtained at a schematic level simulation.
Table 5 lists the proposed switched-capacitor charge pump with supply selector architecture performances obtained with parasitic effects (post-layout simulations) compared to other works that are reported in the literature (measurements and simulation results). The selected input voltage is 2 V. The presented circuit shows superior output voltage ripple performance to all the listed works, alongside lower power consumption than [25,26] and the die area is lower than [25]. Also, the proposed design has only one gain stage, and improved voltage gain per stage compared to [27,28]. The load capacitor is also lower than [25] and equal with [27,28].

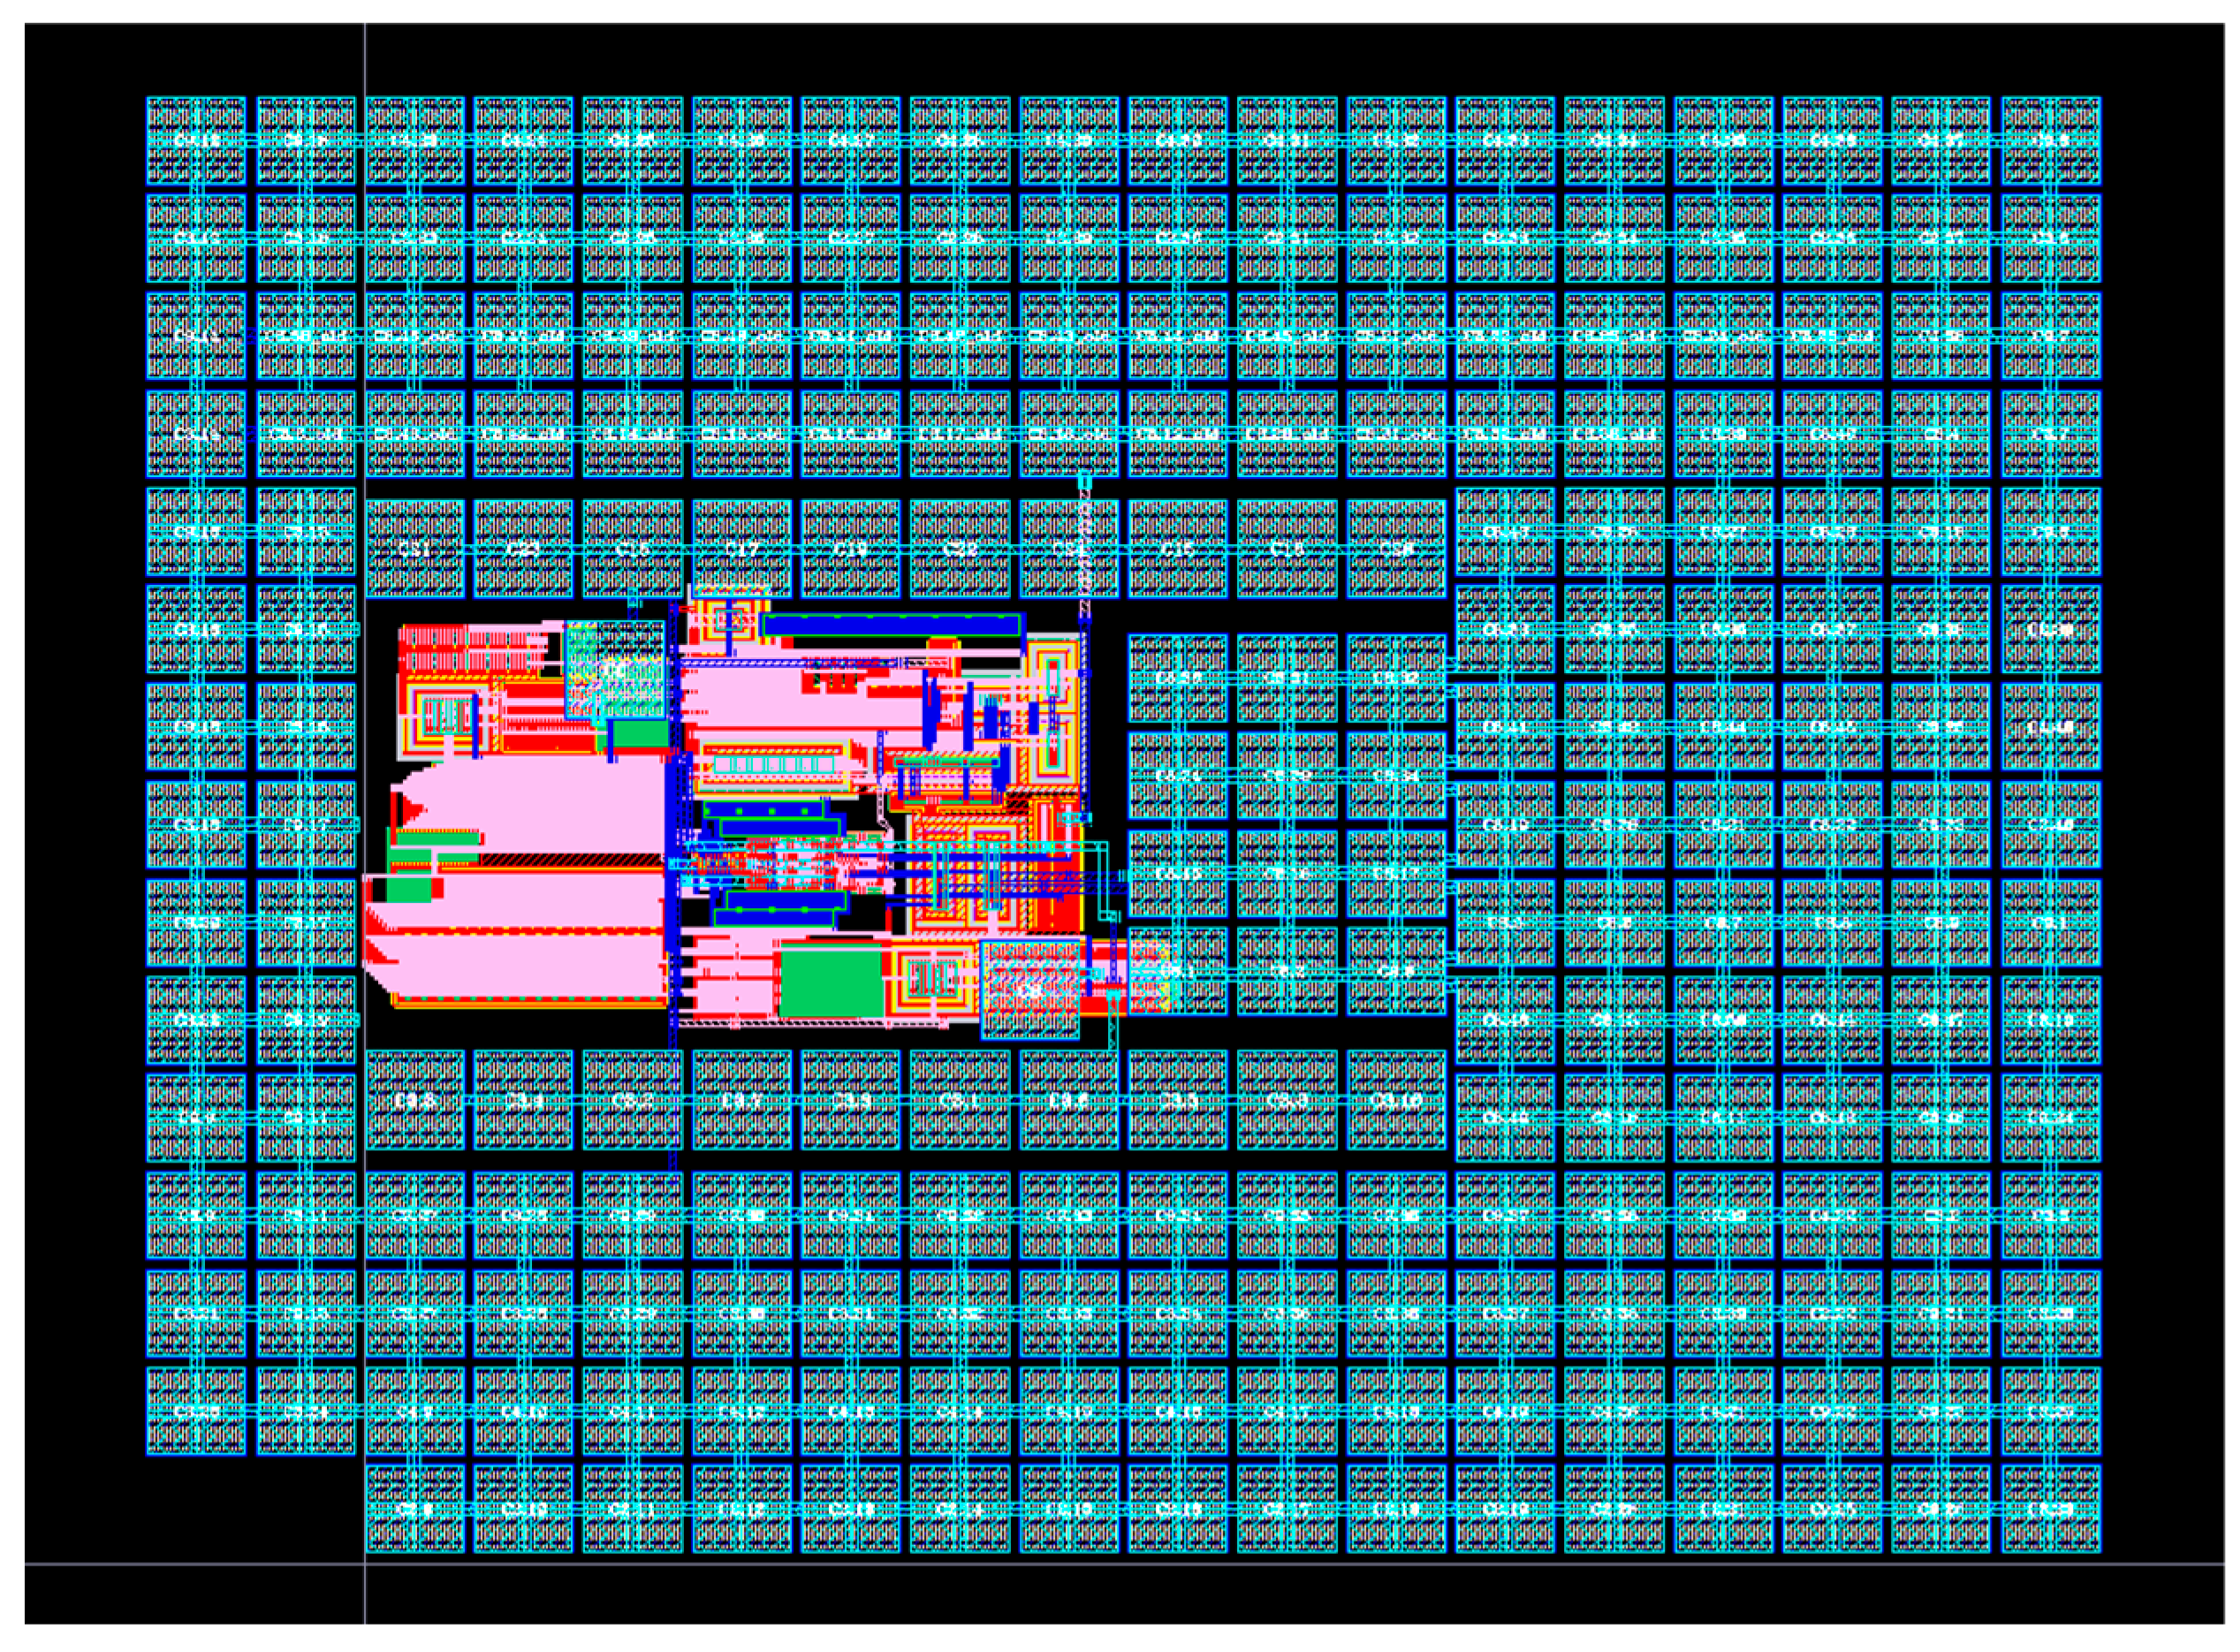
4. Layout Implementation

This section presents the final layout of the circuit, as illustrated in Figure 20. The layout comprises the circuit blocks discussed earlier in the paper, specifically the relaxation oscillator (A), supply selector (B), charge pump (C, G), and Low-Dropout Regulator (LDO) (D). For these blocks, we aimed to use separate supplies for digital and analog components, connecting at a higher metal layer [29], such as Metal 3. This approach was chosen to enhance performance and reduce interference between the two types of circuits. Compensation capacitors (E, F) were strategically placed at the top and bottom of the layout. The central area was dedicated to digital components, ensuring a compact and efficient design. Compensation capacitors were strategically placed directly above the devices to maintain stability [30]. The area of the circuit without the load capacitor is 575.8 µm × 241.2 µm.
In the case of the charge pump, the switches (C) were positioned on the right side of the circuit to minimize the length of connections to capacitor C1 (G), reducing resistance, as highlighted in Figure 20. These connections were routed on higher metal layers to further decrease the resistance of the wires [31]. Additionally, the digital section of the oscillator was placed near the nMOS and pMOS transistors used for switching, ensuring that clock signal paths were as short as possible to avoid issues in circuit operation. All digital cells were handcrafted, avoiding the use of standard cells. This method allowed for greater control over the layout and performance of each cell, ensuring they met our specific requirements. Figure 21 highlights the final layout of the circuit, with the load capacitor of the charge pump added.
Additionally, we implemented a common centroid matching technique for all devices to ensure uniformity and minimize mismatches. The total area of the circuit is 689.3 µm × 513.5 µm.

5. Conclusions

The proposed charge pump architecture, based on a switched-capacitor mechanism with a dynamic feedback supply selector, represents a significant advancement in analog circuit design. By circumventing the instability issues traditionally encountered during the transition between complementary differential stages, this approach not only achieves a full rail-to-rail common mode swing but also streamlines the circuitry by enabling the use of a single pMOS differential input stage. Comprehensive schematic-level and post-layout simulations validate the circuit’s robustness across a wide range of operating conditions—demonstrating superior performance in terms of voltage ripple, load current, mismatch between devices, and process variability. These promising results suggest that the design could have profound implications for high-performance analog applications, particularly in the automotive and precision instrumentation sectors. Furthermore, the novel integration of the supply selector opens avenues for future research, including scalability into advanced CMOS nodes and integration with emerging mixed-signal systems, ultimately contributing to the evolution of more efficient and reliable analog circuit solutions in next-generation integrated platforms.

Author Contributions

Conceptualization, C.S., A.A.M., T.I., A.N., D.D. and L.D.; methodology, C.S. and L.D.; software, C.S. and A.N.; validation, C.S., A.A.M. and T.I.; formal analysis, C.S.; investigation, C.S., A.A.M. and T.I.; resources C.S.; data curation, C.S.; writing—original draft preparation, C.S., A.A.M. and T.I.; writing—review and editing, C.S., D.D. and L.D.; visualization. C.S., D.D. and L.D.; supervision, L.D. and D.D.; project administration, L.D.; funding acquisition, L.D. and D.D. All authors have read and agreed to the published version of the manuscript.

Funding

This paper’s publication is funded by the National University of Science and Technology Politehnica Bucharest, PUBART project.

Data Availability Statement

Not applicable.

Conflicts of Interest

The authors declare no conflicts of interest.

References

  1. Xie, L. Two-stage operational amplifier with Class A and B output stage. In Proceedings of the 2021 3rd International Academic Exchange Conference on Science and Technology Innovation (IAECST), Guangzhou, China, 10–12 December 2021; pp. 260–263. [Google Scholar] [CrossRef]
  2. Kumar, V.A.; Mohamed Asan Basiri, M. “Flexible and High Throughput Designs of 4-Stage Operational Amplifier. In Proceedings of the 2024 15th International Conference on Computing Communication and Networking Technologies (ICCCNT), Kamand, India, 14–16 March 2024; pp. 1–6. [Google Scholar] [CrossRef]
  3. Cancelli, R.; Avitabile, G.; Florio, A. Designing and Optimizing a 2.4 GHz Complementary Metal–Oxide-Semiconductor Class-E Power Amplifier Combining Standard and High-Voltage Metal–Oxide-Semiconductor Field-Effect Transistors. Electronics 2025, 14, 1135. [Google Scholar] [CrossRef]
  4. Stancu, C.; Neacsu, A.; Ionescu, T.; Stanescu, C.; Profirescu, O.; Dobrescu, D.; Dobrescu, L. Offset Voltage Reduction in Two-Stage Folded-Cascode Operational Amplifier Using High-Precision Source Degeneration. Electronics 2023, 12, 4534. [Google Scholar] [CrossRef]
  5. Chaya, N.; Ghosh, A.; Srinivas, B.; Jain, A. An Ultra Low Power Low noise Operational Transconductance Amplifier for Biomedical Front-end Applications. In Proceedings of the 2020 International Conference on Inventive Computation Technologies (ICICT), Coimbatore, India, 26–28 February 2020; pp. 1020–1023. [Google Scholar] [CrossRef]
  6. Tai, F.; Nie, Z.; Wang, Y.; Chao, X.; Li, Q. A Low-Noise and Settling-Enhanced Switched-Capacitor Amplifier with Correlated Level Shifting and Bandwidth Switching. In Proceedings of the 2023 IEEE International Symposium on Circuits and Systems (ISCAS), Monterey, CA, USA, 21–25 May 2023; pp. 1–4. [Google Scholar] [CrossRef]
  7. Hoentschel, J.; Wei, A. From the present to the future: Scaling of planar VLSI-CMOS devices towards 3D-FinFETs and beyond 10 nm CMOS technologies; manufacturing challenges and future technology concepts. In Proceedings of the 2015 China Semiconductor Technology International Conference, Shanghai, China, 15–16 March 2015; pp. 1–4. [Google Scholar] [CrossRef]
  8. Kouhalvandi, L.; Aygün, S.; Güneş, E.O.; Kırcı, M. An improved 2 stage opamp with rail-to-rai! gain-boosted folded cascode input stage and monticelli rail-to-rail class AB output stage. In Proceedings of the 2017 24th IEEE International Conference on Electronics, Circuits and Systems (ICECS), Batumi, Georgia, 5–8 December 2017; pp. 542–545. [Google Scholar] [CrossRef]
  9. Gagliardi, F.; Catania, A.; Piotto, M.; Bruschi, P.; Dei, M. A Novel High-Performance Parallel-Type Slew-Rate Enhancer for LCD-Driving Applications. In Proceedings of the 2023 18th Conference on Ph.D Research in Microelectronics and Electronics (PRIME), Valencia, Spain, 18–21 June 2023; pp. 65–68. [Google Scholar] [CrossRef]
  10. Shuai, H.E.; Guo, Z.; Zheng, X.; Chen, H.; Li, Q. Research on Low Power Constant Transconductance Rail-to-Rail Operational Amplifier Technology. In Proceedings of the 2020 IEEE 15th International Conference on Solid-State & Integrated Circuit Technology (ICSICT), Kunming, China, 3–6 November 2020; pp. 1–3. [Google Scholar] [CrossRef]
  11. Rehani, A.; Chaitanya, G.V.; Anantula, P. A High Area and Current Efficient Charge Pump Design. In Proceedings of the 2024 International Conference on Microelectronics (ICM), Doha, Qatar, 14–17 December 2024; pp. 1–5. [Google Scholar] [CrossRef]
  12. Ng, W.-K.; Ertugrul, N.; Tam, W.-S.; Kok, C.-W. Design Strategy for 2-phase Switched Capacitor Charge Pump. In Proceedings of the 2021 31st Australasian Universities Power Engineering Conference (AUPEC), Perth, Australia, 26–30 September 2021; pp. 1–6. [Google Scholar] [CrossRef]
  13. Chowdhury, S.; Gurpinar, E.; Ozpineci, B. Capacitor Technologies: Characterization, Selection, and Packaging for Next-Generation Power Electronics Applications. IEEE Trans. Transp. Electrif. 2022, 8, 2710–2720. [Google Scholar] [CrossRef]
  14. Yim, T.; Lee, C.; Yoon, H. A High Speed Modified Dickson Charge Pump. In Proceedings of the 2021 IEEE International Symposium on Circuits and Systems (ISCAS), Daegu, Republic of Korea, 22–28 May 2021; pp. 1–5. [Google Scholar] [CrossRef]
  15. Rajora, R.; Sharma, K. Design and analysis of a low-power, high-efficiency 4-stage Dickson charge pump using CNTFETs. In Proceedings of the 2023 Second International Conference on Trends in Electrical, Electronics, and Computer Engineering (TEECCON), Bangalore, India, 23–24 August 2023; pp. 406–410. [Google Scholar] [CrossRef]
  16. Ballo, A.; Grasso, A.D.; Palumbo, G. Signal Amplification by Means of a Dickson Charge Pump: Analysis and Experimental Validation. Chips 2022, 1, 72–82. [Google Scholar] [CrossRef]
  17. Hussein, S.H.; Yaseen, M.T. Performance Evaluation of Low-Voltage CMOS Switched-Capacitor Circuit. In Proceedings of the 2021 8th International Conference on Electrical and Electronics Engineering (ICEEE), Antalya, Turkey, 9–11 April 2021; pp. 40–43. [Google Scholar] [CrossRef]
  18. Sahakyan, H.; Hayrapetyan, A.; Harutyunyan, S.; Stepanyan, A.; Azatyan, H.; Hovsepyan, G. A Low Dropout Voltage Regulator with Higher Than Supply Output Voltage and Load Based Frequency Control System. In Proceedings of the 2020 IEEE 40th International Conference on Electronics and Nanotechnology (ELNANO), Kyiv, Ukraine, 22–24 April 2020; pp. 366–369. [Google Scholar] [CrossRef]
  19. Ren, B.; Zhan, C.; Liu, F. A 0.8-V-VIN 3.76-nW 23.1-ppm/°C Low Dropout Regulator Based on Flipped Voltage Follower with Embedded CMOS Voltage Reference. In Proceedings of the 2024 IEEE International Conference on Integrated Circuits, Technologies and Applications (ICTA), Hangzhou, China, 25–27 October 2024; pp. 192–193. [Google Scholar] [CrossRef]
  20. Li, Y.; Li, Z.; Qian, L.; Wang, X.; Zhu, Z. A Low Quiescent Current Fast Transient LDO Regulator with Segmented Pass Transistors. IEEE Trans. Circuits Syst. II Express Briefs 2025, 72, 13–17. [Google Scholar] [CrossRef]
  21. Stanescu, C.; Dinca, C.; Iacob, R. Soft-start low voltage CMOS LDO. In Proceedings of the CAS 2013 (International Semiconductor Conference), Sinaia, Romania, 14–16 October 2013; pp. 185–188. [Google Scholar] [CrossRef]
  22. Shah, M.K.; Gaidhane, V.H.; Prasannan, C. Stability Analysis of Two-Stage OTA with Frequency Compensation. In Proceedings of the 2021 IEEE International IOT, Electronics and Mechatronics Conference (IEMTRONICS), Toronto, ON, Canada, 21–24 April 2021; pp. 1–6. [Google Scholar] [CrossRef]
  23. Stancu, C.; Neacsu, A.; Profirescu, O.; Dobrescu, D.; Dobrescu, L. Temperature and Power Supply Compensated CMOS Clock Circuit Based on Ring Oscillator. Electronics 2023, 12, 507. [Google Scholar] [CrossRef]
  24. Olaru, D.; Floricău, D. Optimal Method for Controlled Switching Circuits. UPB Sci. Bull. Ser. C 2009, 71, 187–196. [Google Scholar]
  25. Kar, G.C.; Sawan, M. Low-power high-voltage charge pumps for implantable microstimulators. In Proceedings of the 2012 IEEE International Symposium on Circuits and Systems (ISCAS), Seoul, Republic of Korea, 20–23 May 2012; pp. 2247–2250. [Google Scholar] [CrossRef]
  26. Jiang, X.; Yu, X.; Moez, K.; Elliott, D.G.; Chen, J. High-Efficiency Charge Pumps for Low-Power On-Chip Applications. IEEE Trans. Circuits Syst. I Regul. Pap. 2018, 65, 1143–1153. [Google Scholar] [CrossRef]
  27. Ballo, A.; Grasso, A.D.; Palumbo, G. A High-Performance Charge Pump Topology for Very-Low-Voltage Applications. IEEE Trans. Circuits Syst. II Express Briefs 2020, 67, 1304–1308. [Google Scholar] [CrossRef]
  28. Ballo, A.; Grasso, A.D.; Palumbo, G. Charge Pump Improvement for Energy Harvesting Applications by Node Pre-Charging. IEEE Trans. Circuits Syst. II Express Briefs 2020, 67, 3312–3316. [Google Scholar] [CrossRef]
  29. Jacob Baker, R. CMOS Circuit Design, Layout, and Simulation, 3rd ed.; John Wiley & Sons, Inc.: Hoboken, NJ, USA, 2010. [Google Scholar]
  30. Hastings, A. The Art of Analog Layout, 1st ed.; Prentice Hall: Hoboken, NJ, USA, 2001. [Google Scholar]
  31. Razavi, B. Design of Analog CMOS Integrated Circuits, 2nd ed.; McGraw-Hill Education: New York, NY, USA, 2016. [Google Scholar]
Figure 1. Ideal and real capacitor charging models: (a) ideal model; (b) realistic model.
Electronics 14 01484 g001
Figure 2. Capacitor charging behavior with unitary R and C values: (a) voltage behavior; (b) current behavior.
Electronics 14 01484 g002
Figure 3. Dickson charge pump circuit: (a) classic architecture with diodes; (b) implementation with MOS transistors.
Electronics 14 01484 g003
Figure 4. Proposed charge pump circuit design: (a) architecture; (b) clock behavior.
Electronics 14 01484 g004
Figure 5. Proposed charge pump circuit design with cycle phases: (a) phase 1; (b) phase 2.
Electronics 14 01484 g005
Figure 6. Low-dropout regulator.
Electronics 14 01484 g006
Figure 7. Transistor-level design implementation for the innovative supply selector.
Electronics 14 01484 g007
Figure 8. Proposed charge pump architecture, top-level view.
Electronics 14 01484 g008
Figure 9. Supply selector circuit performance over temperature: (a) VDD = 2 V; (b) VDD = 5 V.
Electronics 14 01484 g009
Figure 10. Supply selector performance with process variations: (a) slow; (b) fast.
Electronics 14 01484 g010
Figure 11. VREF results: (a) vs. temperature; (b) Monte Carlo histogram, T = 27 °C, VDD = 2 V.
Electronics 14 01484 g011
Figure 12. Charge pump efficiency with and without the supply selector.
Electronics 14 01484 g012
Figure 13. Charge pump response for different load currents: (a) overview; (b) zoom.
Electronics 14 01484 g013
Figure 14. Charge pump output ripple: (a) VDD = 2 V; (b) VDD = 5 V.
Electronics 14 01484 g014
Figure 15. Charge pump output voltage behavior in different process corners: (a) VDD = 2 V—slow; (b) VDD = 2 V—fast; (c) VDD = 5 V—slow; (d) VDD = 5 V—fast.
Electronics 14 01484 g015
Figure 16. Charge pump output histograms: (a) VDD = 2 V; (b) VDD = 5 V.
Electronics 14 01484 g016
Figure 17. Output PEX results for different load currents: (a) overview; (b) zoom.
Electronics 14 01484 g017
Figure 18. Charge pump output ripple after PEX: (a) VDD = 2 V; (b) VDD = 5 V.
Electronics 14 01484 g018
Figure 19. Charge pump output voltage behavior in different process corners after PEX: (a) VDD = 2 V—slow; (b) VDD = 2 V—fast; (c) VDD = 5 V—slow; (d) VDD = 5 V—fast.
Electronics 14 01484 g019
Figure 20. Charge pump layout without load capacitor.
Electronics 14 01484 g020
Figure 21. Circuit layout implementation with load capacitor included.
Electronics 14 01484 g021
Table 1. Design parameters for the LDO.
ParameterValue
(W/L) M1–M220/2 µm/µm
(W/L) M3, M412/2, 60/2 µm/µm
(W/L) M5, M612/2, 60/2 µm/µm
(W/L) M7–M840/0.5 µm/µm
(W/L) M9800/0.5 µm/µm
R128.9 kΩ
R2200 kΩ
R3600 kΩ
R4200 kΩ
C11.15 pF
I11 µA
Table 2. Design parameters for supply selector.
ParameterValue
(W/L) M1–M2, M158/4, 96/4 µm/µm
(W/L) M3, M1412/1, 144/1 µm/µm
(W/L) M4–M518/3 µm/µm
(W/L) M6–M7, M104/4 µm/µm
(W/L) M8–M98/4 µm/µm
(W/L) M11, M1610/0.5 µm/µm
(W/L) M12–M136/3 µm/µm
(W/L) M17–M1820/0.5 µm/µm
(W/L) M5–M6, M9–M10480/10, 416/3 µm/µm
(W/L) D10.8/5.4 µm/µm
C1900 fF
I11µA
Table 3. Charge pump results summary at T = 25 °C.
ParameterVDD = 2 VVDD = 5 V
Input voltage (V)25
Output voltage (V) (ILOAD = 200 µA)3.66.71
Load capacitance (pF)160160
Number of stages11
Clock frequency50 MHz50 MHz
Maximum output current400 µA400 µA
Output voltage ripple (mV) (ILOAD= 200 µA)2632
Output current (no load) (µA)354.8628.4
Table 4. Charge pump results summary after PEX at T = 25 °C.
ParameterVDD = 2 VVDD = 5 VSchematic Level VDD = 2 VSchematic Level VDD = 5 V
Input voltage (V)2525
Output voltage (V) (ILOAD = 200 µA)3.5036.653.66.71
Load capacitance (pF)160160160160
Number of stages1111
Clock frequency48.12 MHz48.13 MHz50 MHz50 MHz
Maximum output current400 µA400 µA400 µA400 µA
Output voltage ripple (mV) (ILOAD = 200 µA)35482632
Output current (no load) (µA)352.6625.1354.8628.4
Table 5. Table of comparison of charge pump circuit with other recent similar works.
Parameter[25][26][27][28]This Work
Year20122018202020202025
Technology (CMOS)130 nm130 nm65 nm65 nm250 nm
Input voltage (V)N/A1.20.40.42
Output voltage (V) 107.451.923.505
Load capacitance (pF)1 µFN/A160160160
Number of stagesN/A8441
Voltage gain per stageN/A6.201.4761.491.5
Clock frequency0.1 MHzN/A25448.12 MHz
Maximum output current500 µA5 mAN/AN/A400 µA
Output voltage ripple (mV) (with ILOAD)10073100N/A35
Output current (no load) (µA)250N/A3012.6352.6
Power consumption (no load) (µW)897.637250125.04705.2
Die area (mm2)2.25N/A0.0310.0210.35
Disclaimer/Publisher’s Note: The statements, opinions and data contained in all publications are solely those of the individual author(s) and contributor(s) and not of MDPI and/or the editor(s). MDPI and/or the editor(s) disclaim responsibility for any injury to people or property resulting from any ideas, methods, instructions or products referred to in the content.

