1. Introduction
There is a growing need for data monitoring across various contexts, often in remote locations, to analyze multiple parameters and enable early warning systems for extreme events [
1]. For example, structural health monitoring involves the continuous or periodic assessment of structural integrity and performance, which is crucial for ensuring the safety and longevity of critical infrastructure such as bridges and pipelines. This demand for monitoring has led to significant growth in the diffusion of sensors, embedded devices, and wireless sensor networks. These systems are often installed in remote areas that lack conventional power sources and in hard-to-reach locations. Although batteries could be used to power these devices in such cases, their maintenance, especially for large-scale monitoring systems with numerous sensor nodes, is costly or even impractical [
2]. Additionally, batteries have a relatively short life cycle and pose disposal challenges due to the handling of highly toxic chemical substances, leading to significant environmental concerns [
3].
An effective alternative to disposable batteries for supplying sensing devices is energy harvesters, which can convert otherwise wasted energy from the surrounding environment into electrical energy. Energy harvesting can be obtained from various sources [
4,
5], such as mechanical vibrations [
6,
7,
8]; solar radiation [
9,
10]; wind [
11]; thermal sources [
12,
13,
14]; rainfall [
15,
16]; and radio frequency fields [
17], among others. The amount of energy harvested depends on several factors, such as the device performance, the electronic interface with the load [
18], and the environmental context in which the equipment is installed [
19]. For these reasons, many research efforts focus on developing reliable and efficient devices [
20] and maximizing harvested energy [
21,
22,
23], while also considering characteristics such as miniaturization and weight reduction [
24].
Unfortunately, energy sources are not always stable or continuously available, making it challenging for the harvesting device to meet the load’s energy demands. For example, solar harvesters cannot operate at night, on rainy days, or in dark environments; vibration energy harvesters may be fluctuating and insufficient depending on the source of mechanical vibrations; and wind energy harvesters may be subject to significant fluctuations over time. To overcome these limitations and ensure a continuous and uninterrupted power supply to the load, one approach is to increase the size of the harvesting device and pair it with a large storage device, such as a rechargeable battery [
25]. When the harvested power exceeds the load requirements, the surplus energy is stored, while the stored energy is used to compensate for low-power periods.
An attractive alternative to oversizing both the harvesting and the storage devices is the use of hybrid energy harvesters, which are able to scavenge energy from multiple sources [
26]. These harvesters benefit from the complementary availability of energy sources [
27,
28], reducing the need for energy storage while also increasing the fault tolerance and the overall reliability of the power supply system [
29,
30]. Moreover, reducing the size of the storage device may enable the replacement of rechargeable batteries with supercapacitors. In fact, the latter are particularly attractive as energy buffers due to their much longer lifetime under repeated charge and discharge cycles, as well as their environmental friendliness [
31]. However, the lower energy density of supercapacitors compared to rechargeable batteries makes their physical size a critical issue. Since hybrid harvesters reduce the need for energy buffering, they increase the feasibility of using supercapacitors [
27].
The above considerations highlight that one of the main advantages of hybrid energy harvesters for powering embedded devices is the reduction in storage device size. Although this advantage is well recognized in the scientific literature, few studies have quantitatively investigated this aspect. It is worth mentioning the study in [
27], which estimates the average number of hours per year during which a hybrid energy harvester shuts down due to power shortages as a function of harvesting and storage device sizes. However, this study does not address the optimal sizing of the devices to ensure a continuous and uninterrupted power supply to the load, which is of great practical interest.
It is also important to note that extensive scientific literature exists on the sizing of production and storage devices in hybrid renewable energy systems for medium-to-high power applications, ranging from residential to neighborhood scale and beyond [
32,
33,
34]. However, these studies are not directly applicable to low-power applications for several reasons. First, in medium-to-high-power applications, the sizing of energy production devices is primarily driven by system cost, whereas in low-power applications, economic considerations are less critical than the previously mentioned technical constraints. Second, small energy harvesters, such as micro solar panels or micro wind turbines, are more affected by their surrounding environment—such as trees or birds—than large fields of renewable energy generators. This makes small-scale energy harvesting more variable and less stable over time, even when using the same primary energy source. Finally, the energy harvesting capability of devices decreases rapidly with size and available energy. For example, in the case of wind energy, as the harvester size is reduced to the centimeter or millimeter range, energy conversion efficiency declines, primarily due to the reduced blade size [
35]. Miniature energy harvesting devices based on triboelectric and piezoelectric effects [
36,
37], as well as on wind-induced vibrations [
38], perform significantly worse than large wind turbines when wind speeds drop below 1.5 m/s.
To address the gap in the scientific literature on hybrid energy harvesters for low-power applications, as described above, this work aims to quantify the benefits of hybrid energy harvesters in terms of storage and harvesting device sizing, by leveraging real-world measured data. Specifically, the study examines the energy that can be recovered from three natural sources—solar, wind, and rain—by exploiting data collected from a meteorological station in Cervinara (NA) between April 2021 and March 2022 [
39]. Wind energy availability was quantified using an anemometer to measure wind speed, rainfall energy was assessed using a rain gauge to measure rainfall depth, and solar radiation was measured using a pyranometer. Using these measurements, it is shown how to optimally size each component in a hybrid energy harvester, including both the harvesting devices and the storage device, to ensure a continuous and uninterrupted power supply to the load. The results provide a quantitative estimate of the benefits of hybrid energy harvesters compared to single-source energy harvesters.
The paper is organized as follows. The next section presents the methodology, outlining the steps taken to analyze and interpret the data collected from the meteorological station. It discusses the natural energy sources considered for harvesting, along with the process of converting measured data into usable power and energy. The third section simultaneously examines the three energy sources and quantifies the advantages of a hybrid system, with a focus on the sizing of the harvesting and storage devices. Conclusions end the paper.
2. Materials and Methods
Three natural sources, solar, wind, and rainfall, are considered here as energy sources for a hybrid energy harvester. As a case study, the availability of energy from each source has been estimated based on measurements taken by a meteorological station installed on a north-facing slope in the territory of Cervinara, southern Italy. This site presents an adverse environment characterized by steep terrain and the presence of tall trees (
Figure 1).
Table 1 summarizes information on the three considered energy sources and the corresponding monitored parameters. The table also provides details about the monitoring instruments, all of which belong to Campbell Scientific Inc., along with their sensitivity.
Time series of wind velocity, solar radiation, and rainfall were collected over a one-year period from April 2021 to March 2022. Although data were recorded at a constant time sampling rate of one minute, the available solar radiation and wind data were averaged over one hour, while rainfall data were cumulated to provide hourly values. The pyranometer, which measures solar radiation, directly provides power per unit surface area. Conversely, for the other two sources, wind and rainfall, the available power can be estimated by processing the measured data, as described in the following sections.
Note that a north-facing slope was chosen as the location for the measurements because, for orographic reasons, it is more exposed to the risk of slope instability caused by rain. Therefore, there is a greater need for a network of wireless sensors aimed at hydro-meteorological alerts. In the near future, a monitoring network powered by energy harvesters is planned to be installed in the chosen area. This area presents a challenging environment for solar and wind energy harvesters, because it is less sunny than a flat area or a south-facing slope, and is covered by tall trees that reduce the wind at ground level. The environmental conditions where energy harvesters can be installed to power monitoring sensors vary significantly. However, the analysis and design methodology of the hybrid harvester system presented here can also be applied in different environments.
2.1. Solar Energy Harvesting
This section discusses the potential for solar energy harvesting based on radiation measurements taken by the pyranometer at the weather station.
Figure 2a illustrates the temporal distribution of solar radiation over the period considered, showing hourly averaged values.
Figure 2b highlights daily variations, with solar radiation peaking around midday and dropping to zero at night. A significant fluctuation in solar radiation, characterized by high peaks followed by low values, is evident. This variability can be attributed to both sudden cloud cover and environmental factors, particularly the dense vegetation surrounding the station, which causes intermittent solar shielding at various times throughout the day. As expected, the highest solar radiation values are typically recorded from spring to summer, with some notable values also occurring in autumn and winter.
The histogram in
Figure 2c shows the number of hours corresponding to different levels of solar power. Specifically, the entire range of hourly averaged power values is divided into a series of bins along the
x-axis, while the right
y-axis displays the number of hours during which each level of solar power was recorded. Additionally, the left
y-axis presents the product of these hours, and the corresponding hourly averaged power, i.e., the energy, expressed as a percentage of the total measured energy.
The data highlight that most of the harvestable energy results from the accumulation of numerous small power values generated over extended periods. This reveals an inverse relationship between solar radiation intensity and the number of hours it is present, indicating that higher radiation levels are less frequent. The total number of hours with zero radiation is 3848, since dawn and dusk still allow for some energy harvesting.
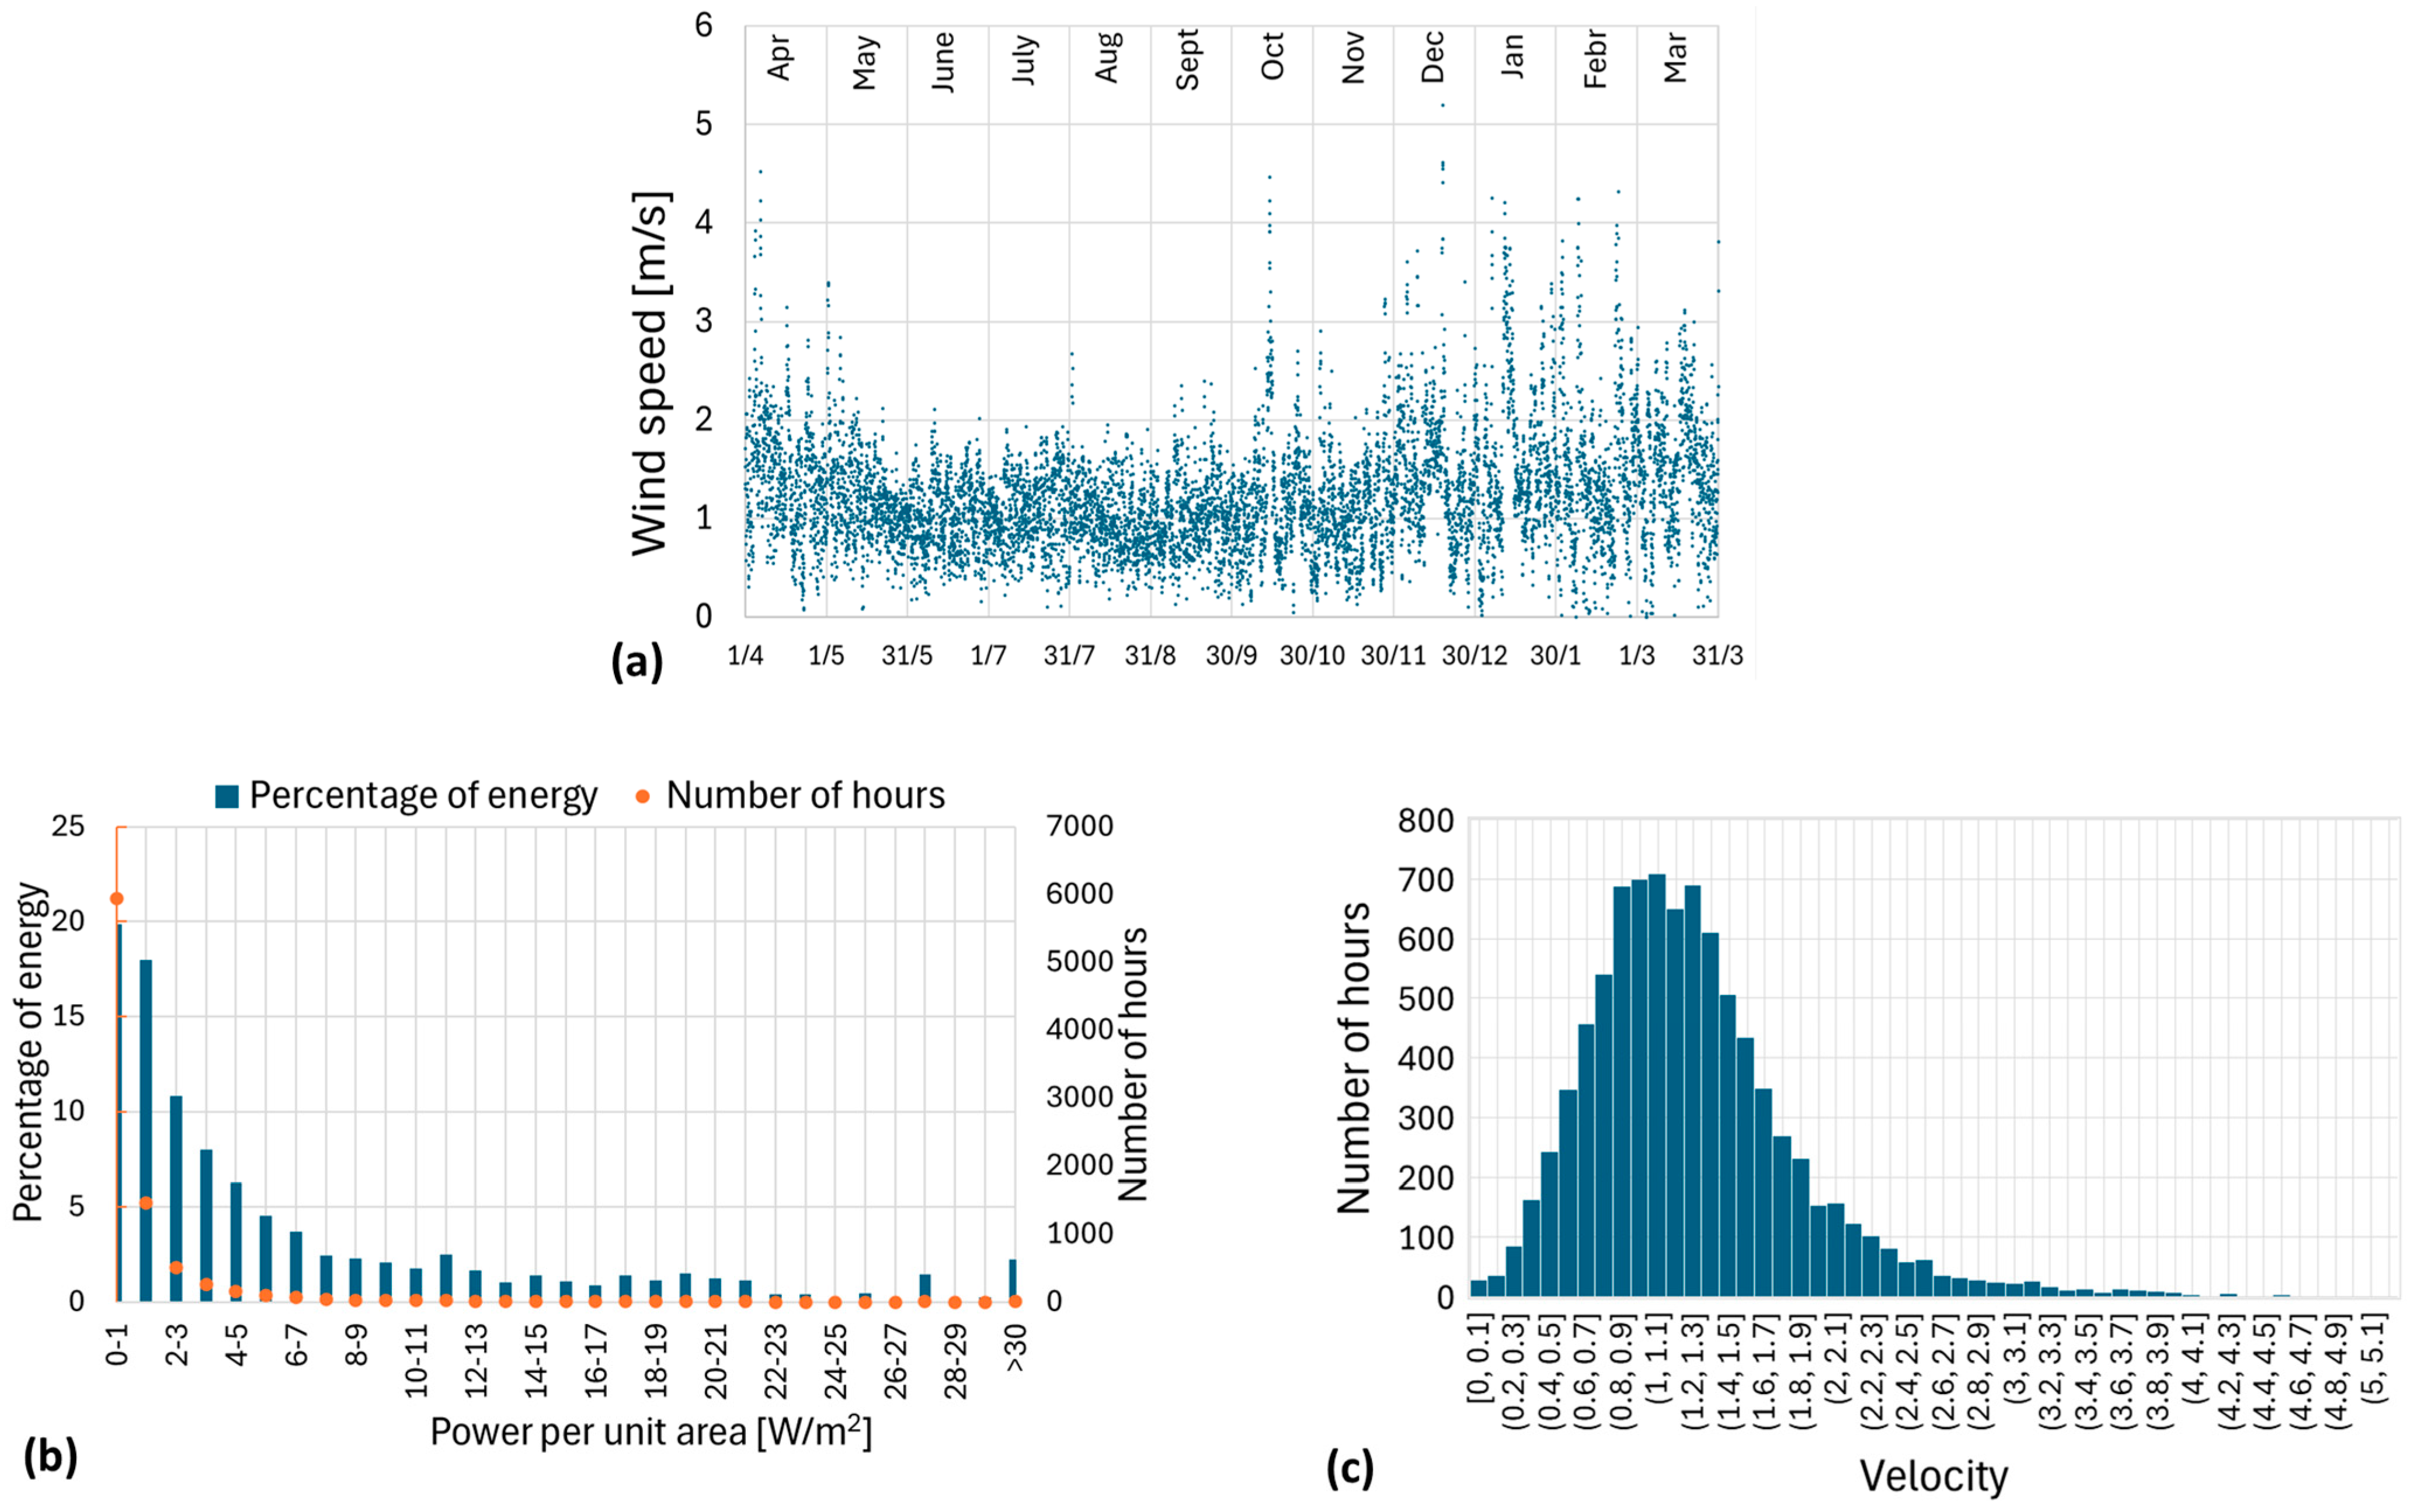
2.2. Wind Energy Harvesting
This section explores the potential for wind energy harvesting. As previously mentioned, the weather station is equipped with an anemometer to measure wind speed.
Figure 3a shows the temporal distribution of hourly averaged wind speeds over the one-year period under consideration. Seasonal variability is evident, with higher wind speeds in winter and lower speeds in summer. Sporadic peaks with high wind speeds also occur in autumn and spring.
Wind speed ranges from 0 m/s (a value recorded only for five hours throughout the year due to the high sensitivity of the anemometer) to just over 5 m/s. At first glance, this range may suggest limited variations in wind speed over time. However, it is important to note that averaging values over hourly intervals can obscure short but intense wind gusts. These gusts could potentially generate more energy than indicated by hourly averages due to the cubic dependence of power on wind speed. Therefore, the average values provide a conservative estimate of the available wind energy.
The theoretical maximum power extractable from wind was studied by Albert Betz [
40]. According to Betz’s law, no device can capture more than 59.3% of the kinetic energy in the wind. This efficiency factor
Cp = 0.593 is known as Betz’s coefficient, and the extractable power per unit area can be expressed as follows:
where
is the wind power per unit area,
is the air density, and
is the wind velocity. The available energy reported in
Figure 3b versus power is achieved by integrating wind power over one-hour intervals. The data indicate that most of the available energy results from the accumulation of numerous small power values generated at very low wind speeds. Conversely, for power values exceeding 6–7 W/m
2, contributions are significantly fewer, as high wind speeds occur much less frequently.
Figure 3c shows a frequency diagram for the average wind speed. Many hours exhibit very low mean speeds, between 0.7 m/s and 1.5 m/s, which may be insufficient to activate some wind energy harvesting devices. These low wind speeds could be attributed to the site characteristics, classifying it as not particularly windy. Additionally, the position of the meteorological station, surrounded by tall trees, may have influenced wind flow and reduced its intensity.
2.3. Rain Energy Harvesting
This section analyzes the potential for rain energy harvesting based on data collected by the rain gauge at the weather station. The rain gauge is a tipping bucket with a sensitivity of 0.197 mm of rainfall depth. The measured data are accumulated to obtain hourly rainfall depth (mm) or, equivalently, mean hourly rainfall intensity (mm/h).
Figure 4a depicts the temporal distribution of hourly rainfall intensity, showing that precipitation is most frequent in autumn and winter, with isolated peaks in spring and summer due to short but intense convective rainfall events. Over the period considered, rainfall was recorded for 909 h, mostly at low intensities. Rainfall intensity ranged from 0.197 mm/h (the device’s detection threshold) to a peak of 27.38 mm/h during an intense spring event.
From the measured rainfall intensity, the available rain energy can be estimated using two different approaches. The first approach involves harvesting energy directly from falling raindrops without water accumulation. The available energy is the kinetic energy of raindrops, which depends on the mass of the rainfall and falling speed. The mass m (kg) falling per hour corresponds to the rainfall intensity (mm/h), as 1 mm over a unit area equates to 1 L of water, which in turn has a mass of 1 kg. The falling speed can be determined from the hourly rainfall intensity according to the categorization in six classes as reported in
Table 2, in line with established studies [
41,
42]. The kinetic energy of precipitation is then evaluated using the following:
where
is the mass of the water and
is the velocity of the rain, and the mean power over a one-hour time interval
is given by the following:
The second approach involves storing rainwater into accumulation tanks to convert its energy into gravitational potential energy. The tank is connected to a nozzle positioned at a desired height, from which droplets of constant sizes outflow and fall at regular intervals. This controlled release, which converts the stored energy back into kinetic energy, is optimized for maximizing the energy harvested by the selected harvesting device. The energy efficiency of this approach is similar to the direct collection of rainwater, achieving average falling speeds of approximately 4 m/s for drop diameters between 1 and 2 mm [
43].
The choice between the two approaches depends on several factors, such as resource availability, storage feasibility, and design requirements. The energy that can be harvested using the first approach is shown in
Figure 4b.
Figure 4c presents a frequency diagram of precipitation depths, excluding hours with no recorded rainfall. Although many hours have only small precipitation amounts, the total annual rainfall depth amounts to 1300 mm.
2.4. Comparing Energy Sources
Figure 5a shows together the temporal power trends per unit area for the three monitored energy sources, while
Figure 5b reports the monthly averaged power values, using different amplification factors for the three sources to account for their different magnitudes. Although the reported data refer to a specific year, the annual trends are very similar to each other. The plots highlight that the temporal distribution of solar energy exhibits a strong seasonal dependence, with high power values in spring and summer and lower values in autumn and winter. Wind and rain energy are more significant during periods of reduced solar production, highlighting a complementary relationship among the sources. This complementarity is further confirmed by the cumulative energy trends reported in
Figure 5c. By leveraging this complementary behavior, hybrid energy harvesters can optimize energy extraction. Solar energy is maximized during sunny periods, while on rainy or cloudy days, wind and rain energy can compensate for reduced solar output. This dynamic approach ensures a consistent energy supply, adapting to real-time environmental conditions.
The logarithmic scale of the vertical axis in
Figure 5a also highlights the relative magnitudes of each source. Solar radiation dominates, while wind energy is nearly two orders of magnitude lower. Rainfall contributes minimally, at least three orders of magnitude lower than wind and five orders of magnitude lower than solar radiation. Thus, solar energy is the predominant source, with wind providing a complementary role. Although rain and solar energy exhibit some degree of synergy, the vast difference in their magnitudes limits their practical effectiveness. Since the power and energy values presented here are per unit area, adjusting the size of harvesting devices may partially bridge this gap, but rain energy remains negligible in overall power harvesting.
3. Hybrid Harvester Sizing
A hybrid energy harvester consists of multiple harvesting devices, each of which harvests energy from a different source, along with a storage device that can temporarily accumulate the energy extracted by the harvesting devices. This section focuses on optimizing the sizing of these devices, both harvesting and storage, by leveraging the data obtained in the previous section.
The sizing should ensure that the harvesting system is able to supply the load continuously, without interruptions. Therefore, the total energy harvested over the year should be at least equal to the energy drawn by the load, which, for simplicity, is assumed to operate at a constant power level. Thus, the average harvested power over the year should be equal to the load power. The storage device should be sized to ensure sufficient energy storage during periods of excess power extraction, allowing it to supply the load during power shortages.
To highlight the advantages of a hybrid harvester over single-source harvesters, let us start by analyzing the latter before introducing the hybrid solution. For a single-source solar energy harvester extracting a power per unit area and per unit efficiency equal to
, the harvested energy per unit area and per unit efficiency can be written as follows:
and the average harvested power over the year can be written as follows:
where
is equal to 1 year. To ensure a continuous power supply of the load, the average harvested power should be equal to that drawn by the load, i.e.,
, with
representing the area of the solar energy harvesting device and
representing its efficiency. The difference between the instantaneous harvested power and the power drawn by the load is temporarily accumulated in the storage device. Thus, the stored energy per unit area and per unit efficiency can be written as follows:
The storage device accumulates the excess part of the extracted energy in periods of plenty (
) and releases it in lean periods (
). By assuming a periodic operation, the initial value of the stored energy,
, results from the accumulation in the previous period and ensures that the stored energy is always positive, as follows:
For the storage device to perform its task, it must be large enough to be able to store the energy in (6) at any time. Thus, it must be able to store the maximum value assumed by (6) over time; let us call it . represents the minimum size of the storage device required to ensure the desired operation of the system. If the storage device were smaller, part of the excess energy would be lost and could not be delivered to the load in lean periods.
Figure 6a shows the stored solar energy
, calculated from the data presented in
Section 2. The diagram shows a consistent increase in energy production from spring to summer, followed by a decline in autumn. The maximum value of stored energy
, represents the minimum required size of the storage device
, which ensures a continuous power supply to the load with an average power
= 37.15 W/m
2.
Figure 6c shows the energy harvested throughout the year,
, (in red) and the normalized energy drawn by the load,
, (in dashed orange).
On the other hand, for a single-source wind energy harvester, following the same procedure used for solar harvester, it is possible to calculate the stored wind energy over one year,
, reported in
Figure 6b, as well as the harvested energy and the load energy, reported in
Figure 6d. The diagrams show an initial increase in values of the stored energy followed by stabilization at a nearly constant level in spring. This is followed by a sharp decline at the beginning of summer, a period characterized by reduced wind intensity and fewer intense gusts. Starting in autumn, fluctuations occur, with an overall increasing trend lasting until the end of winter. As in the solar case, diagrams in
Figure 6b,d allow the identification of
minimum required size of the storage device, which is equal to 11.17 MJ/m
2. This ensures a continuous power supply to the load, equal to
= 1.30 W/m
2.
Let us now consider a hybrid energy harvester that integrates both a solar and a wind energy harvester. The total harvested power, averaged over the year, should be equal to that of the load, i.e.,
, with
the area of the wind harvesting device and
its efficiency. The storage device should be able of accumulating the surplus energy from both harvesters. By normalizing the stored energy to the solar harvester area and efficiency, it can be expressed as follows:
Equation (8) shows that the stored energy per unit solar area and efficiency is a function of the ratio between the areas and efficiencies of the two harvesting devices.
The maximum value of (8), i.e.,
, represents the minimum required size of the storage device,
, that ensures a continuous power supply to the load. To gain insight into the sizing of the storage device, it is useful to normalize the size of the storage device to the total energy delivered to the load in the period
year per unit solar area and efficiency, i.e.,
. Thus, from (8) the normalized size of the storage device can be calculated as follows:
It is worth noting that the quantity in (9) is not a function of the area and efficiency of the solar energy harvester, but it is a function of the ratio between the area and efficiency of the wind and solar harvesters, i.e.,
. Both the numerator and denominator of (9) are a function of this ratio. The normalized size of the storage device in (9) is shown in
Figure 7 as a function of the above ratio. Configurations of hybrid harvesters with larger solar collection areas are positioned to the left of the graph, while those with larger wind collection areas are positioned to the right.
For = 0.01, where almost all the recovered energy comes from solar power, the storage device size should be just over 30% of the total energy delivered to the load. This trend remains nearly constant until the energy recovered from the wind becomes significant, complementing solar energy. The addition of wind energy extraction causes a decrease in the curve, which reaches a minimum value of 17.1% at = 20.4. Thus, this point represents the optimal value for the ratio , suggesting that the surface area allocated for wind energy harvesting should be approximately 20 times greater than that for solar energy harvesting, assuming comparable device efficiencies. In other words, if the wind energy harvesting area is about 20 times that of solar harvesting, the required storage device size can be reduced from 30.7% (as in the solar-only configuration) to 17.1% of the total load energy (corresponding to the optimal hybrid configuration).
It should be highlighted that the coefficients
and
represent the overall harvester efficiencies, meaning they account for both the losses in the device that converts primary energy into electrical energy, and the losses in the electronic interface between the conversion device and the electronic load. Since wind energy is converted into AC voltage, the electronic interface of the wind energy harvester must include a voltage rectifier, which is not required in the solar energy harvester. Consequently, the overall efficiency of the wind energy harvester is reduced due to the rectifier losses, unlike solar efficiency. From a practical perspective, commercial off-the-shelf micro solar panels with surface areas in the range
to
exhibit efficiencies between 15% and 20% [
44,
45,
46]. Recent prototypes of micro wind energy converters demonstrate conversion efficiencies, net of the Betz coefficient, ranging from 35% for a rotor diameter of 40 cm down to 1% for the smallest and least efficient systems [
47,
48]. Finally, off-the-shelf integrated circuits used to interface the above conversion devices with the electronic loads typically exhibit efficiencies between 80% and 90% [
49,
50].
It is worth noting that even though the curve in
Figure 7 was obtained from the measured power data, it allows for the estimation of optimal values for both the energy harvesters and the storage device, even at power levels different from those measured. However, this holds only if the wind power is not too low because the reduction in efficiency can prevent its use. The finding in
Figure 7 also highlights the lack of scalability of such systems at medium-to-high power levels. In fact, research aimed at determining the optimal surface area ratio for systems designed to recover medium to large power outputs has led to significantly different optimal ratios [
33].
Rain energy has not been considered in this analysis due to its extremely limited energy production compared to the other two sources, as discussed in
Section 2. In fact, harvesting rain energy would require overcoming a disparity ranging from 2 (relative to wind) to 5 (relative to solar) orders of magnitude. This would necessitate very large rain collection areas, which might only be practical if the roof surfaces of large buildings were used as basins to gather and gradually dispense water for energy harvesting purposes. In any case, unless considering extremely large buildings or particularly rainy areas, as considered in [
51,
52], such compensation appears hardly feasible.
As a practical example of the advantages of solar-wind hybrid energy harvesting, let us consider a solar panel with a surface area of 10 cm × 10 cm (0.01 m
2) combined with a wind harvesting circular surface area with a radius of 25 cm (0.20 m
2). This results in an area ratio of
, which is very close to the optimal area ratio of 20.42, for similar device efficiencies.
Figure 8a shows the power extracted by the two energy harvesters and the energy stored in the storage device
of the hybrid system. It is evident that the power extracted from the two energy sources is complementary, given the ratio of the areas considered. The stored energy follows the same trend as in
Figure 6a, although it is influenced by the behavior of the curve in
Figure 6b, i.e., by wind harvesting.
Figure 8b displays the minimum required size of the storage device for the considered hybrid energy harvester. The required storage device size, which ensures a continuous power supply to a load of
= 0.126 W, is equal to
= 0.68 MJ. If the same load power were to be supplied using solar energy alone, the required solar panel size would increase to 13 cm × 13 cm, and the required storage device size
would rise to 1.22 MJ, nearly double the size required for the hybrid solution.


