1. Introduction
The right coronary artery (RCA) plays a vital role in cardiac function by delivering oxygen-rich blood to crucial heart structures, including the right atrium, right ventricle, and parts of the left ventricle. It also supplies the essential sinoatrial and atrioventricular nodes [
1]. As the source of the posterior descending artery in most cases, the RCA is particularly significant in determining coronary dominance. Any RCA pathology, such as stenosis or anatomical variations, can result in serious complications including inferior myocardial infarction and cardiac arrhythmias [
2]. While invasive coronary angiography remains the gold standard for RCA assessment, computed tomography has emerged as a valuable, non-invasive alternative that provides detailed anatomical visualization without procedural risks [
3].
The extraction and reconstruction of coronary arteries from CT images pose significant challenges due to the complex structure of the coronary vessels, the presence of noise and calcifications, and the dynamic nature of the heart, which is influenced by both respiratory and cardiac motion [
4]. Manual segmentation of these vessels is a time-consuming process prone to inter-observer variability, making it an unreliable option for consistent clinical use [
5]. Automated methods, particularly those involving artificial intelligence, are increasingly being pursued as viable alternatives to overcome these challenges, ensuring consistency, accuracy, and efficiency [
6,
7].
In recent years, convolutional neural networks have emerged as powerful tools for medical image segmentation due to their ability to learn hierarchical features from large volumes of image data. For instance, the U-Net architecture [
8] has become a benchmark in medical imaging tasks, demonstrating strong performance in segmenting various types of tissues and organs. This foundational architecture has inspired numerous variants and improvements, each addressing specific challenges in medical image analysis. Attention U-Net [
9] enhances the original architecture by incorporating attention gates, which enable the network to focus on relevant image regions while suppressing irrelevant features. This modification has proven to beparticularly effective in multi-organ segmentation tasks, where precise boundary delineation is crucial. Similarly, Residual U-Net [
10] integrates residual connections to facilitate deeper network training and mitigate the vanishing gradient problem, resulting in improved feature representation and segmentation accuracy. Furthermore, Dense U-Net [
11] leverages dense connectivity patterns to strengthen feature propagation and encourage feature reuse, leading to more efficient network training and robust segmentation results. Also, 3D U-Net [
12] extends the original architecture to process volumetric medical data directly, making it particularly suitable for three-dimensional imaging modalities such as CT and MRI scans. This adaptation has significantly improved the accuracy of volumetric segmentation tasks. A more recent development, TransUNet [
13] combines the strengths of U-Net with transformer architectures, capitalizing on both local and global feature dependencies for enhanced segmentation performance. Swin-Unet [
14] further advances this approach by incorporating hierarchical transformer blocks, demonstrating state-of-the-art performance across various medical image segmentation benchmarks. However, despite their effectiveness, CNN-based approaches struggle with capturing long-range dependencies due to their limited receptive fields. This makes them less suitable for tasks where understanding the broader anatomical context is crucial, such as in coronary artery segmentation.
To overcome the limitations of CNNs in capturing global context, transformer-based architectures have gained increasing attention in the field of medical imaging. Originally developed for natural language processing, transformers utilize self-attention mechanisms that excel in modeling global dependencies and contextual relationships within data. In medical imaging, transformers have proven to be effective in enhancing segmentation accuracy by allowing the model to consider the entire image context, rather than being constrained to local features. This capability is particularly beneficial in segmenting coronary arteries. Vision Transformer (ViT) [
15] utilizes self-attention mechanisms to model global dependencies within the input data. Recent transformer models, such as Swin Transformer [
16], have further improved the efficiency of self-attention by introducing a hierarchical representation, making them more computationally feasible for use in medical applications. Additionally, several studies have focused on vessel segmentation in coronary artery CT images, exploring various methods. For instance, a CNN-based approach [
17] was applied for coronary artery segmentation from CT images, demonstrating strong performance in detecting vessels; however, the method suffered from high computational requirements and occasional inaccuracies in small vessel detection. Similarly, a 3D, fully convolutional network (FCN) [
18] was employed to segment coronary arteries, which improved the continuity of segmented vessels but faced challenges in distinguishing closely positioned vessel branches, especially in the presence of noise or calcifications. Another notable work introduced a hybrid approach combining a U-Net with attention mechanisms to segment coronary arteries from CT images [
19]. This method provided improved segmentation accuracy, particularly for smaller vessels, by focusing on critical regions. However, the reliance on complex attention layers resulted in increased memory consumption and slower inference times, limiting its real-time applicability in clinical settings. These methods collectively highlight the ongoing efforts and challenges in achieving precise and efficient coronary artery segmentation, paving the way for more advanced approaches, such as the integration of transformer-based models discussed in this work.
Despite the advantages transformers bring to medical image analysis, they come with significant computational costs, which limits their practical applicability in clinical environments that require real-time processing. One promising approach to mitigate these issues is the integration of lightweight network architectures, such as GhostNet, into transformer models. GhostNet [
20] employs Ghost modules to generate additional feature maps from intrinsic features, significantly reducing the computational burden while retaining accuracy. This hybrid approach, combining the global attention capabilities of transformers with the parameter efficiency of GhostNet, offers a balanced solution that is both effective and practical for clinical use. In medical imaging, GhostNet has been incorporated into U-Net architectures, such as Ghost-U-Net [
21], to improve liver tumor segmentation in CT scans, achieving efficient processing without compromising accuracy. Additionally, GhostNet has been utilized in mobile healthcare applications, including real-time ECG classification, where its lightweight design enables rapid analysis with reduced latency and power consumption [
22].
Furthermore, transitioning from 2D cross-sectional images to a 3D reconstruction of coronary arteries presents notable advantages. Three-dimensional reconstructions provide a holistic view of the vascular structures, enabling clinicians to assess vessel morphology more intuitively and accurately. Studies have shown that 3D models can significantly improve the accuracy of detecting and quantifying stenosis [
23]. For sonographers and radiologists, the added depth information facilitates a more precise evaluation of complex coronary anatomy, aiding in better preoperative planning and reducing uncertainties during interventions. This advancement not only enhances diagnostic capabilities but also reduces the cognitive load on healthcare professionals, ultimately leading to improved clinical outcomes. For patients, the shift towards non-invasive 3D imaging provides multiple benefits, including reduced exposure to the risks associated with invasive coronary angiography, such as arterial damage or infection. Additionally, a 3D representation allows for more personalized treatment planning, as a detailed visualization of the coronary artery tree can help clinicians devise more accurate interventions, potentially improving prognosis and reducing the likelihood of adverse events [
24].
This paper presents a method utilizing a transformer-integrated convolutional neural network with GhostNet for segmentation, enabling the automated extraction of the RCA from CT images and its reconstruction in 3D. The approach aims to address both the accuracy and efficiency challenges inherent in current methodologies, ultimately contributing to improved clinical workflows and patient care in the context of coronary artery disease management.
Our study makes the following contributions in this manuscript:
We propose a method for extracting cross-sections of the right coronary artery that achieves effective results without requiring excessive computational resources.
By employing volume rendering and surface smoothing techniques, we successfully reconstructed the three-dimensional structure of the vessel, facilitating more accurate localization of coronary artery stenosis for clinical diagnosis.
2. Materials and Methods
2.1. Materials
The research dataset consisted of CT images collected from 32 patients examined at Hokkaido University Hospital. The CT volumes ranged from 400 to 640 slices per patient, with each slice having dimensions of 512 × 512 pixels. Through careful manual selection, 4830 CT slices containing diagnostically significant information were separated from the complete volumes. These selected images underwent detailed annotation to mark the right coronary artery cross-sections, establishing an accurate ground truth dataset necessary for model development and evaluation. The dataset distribution involved 3400 CT images assigned for training purposes, 500 allocated for validation, and 930 designated for testing, all selected through random sampling from the 32 cases.
The image preparation workflow incorporated both preprocessing and data augmentation techniques. The preprocessing involved enhancing image quality, while augmentations, such as rotations, scaling, and flipping, were implemented to artificially increase the dataset’s diversity. These augmentation strategies served to expand the effective dataset size artificially, thereby strengthening the model’s ability to generalize and minimizing potential overfitting issues by introducing diverse data variations. The entire preprocessing and augmentation workflow was executed using Matlab2023b.
2.2. Model Descriptions
2.2.1. GhostNet
GhostNet [
20] is a lightweight neural network module designed to reduce computational load without sacrificing performance. It achieves this by using Ghost modules, which generate additional feature maps from the original features through simple linear operations. The core idea of GhostNet can be expressed mathematically as
where
represents the intrinsic feature maps generated by a standard convolution and
represents a set of cheap linear transformations applied to
to produce more feature maps. This approach significantly reduces the number of parameters and computational costs associated with the model, making it suitable for applications where efficiency is crucial.
GhostNet’s architecture employs a dual approach to feature map generation, utilizing standard convolution layers for primary feature extraction alongside Ghost modules for derivative feature map creation. This architectural design enables GhostNet to maintain robust feature representation capabilities while achieving significant reductions in parameter count and computational operations.
The implementation positions GhostNet between encoder and decoder components, creating an optimized architecture for coronary artery segmentation that balances performance with computational efficiency. This integration leverages Ghost modules to maintain segmentation precision while reducing model complexity, particularly beneficial for real-time clinical applications. The architecture incorporates batch normalization and activation layers throughout the Ghost module sequence, ensuring optimal feature map conditioning for subsequent network processing stages.
2.2.2. Volume Rendering
Volume rendering serves as a core visualization technique for examining complex, three-dimensional anatomical structures, with significant applications in medical imaging. This methodology transforms volumetric data obtained from CT and MRI scans into comprehensive visual displays that highlight intricate spatial and anatomical relationships [
25]. In the specific context of coronary artery visualization, volume rendering plays a crucial role by offering detailed perspectives of vessel structure, thus enhancing diagnostic accuracy and supporting treatment planning processes.
The technique involves converting volumetric data into three-dimensional representations through projection onto two-dimensional viewing planes. In contrast to surface-rendering methods that only show structural boundaries, volume-rendering examines the complete data volume to display internal characteristics. This capability is essential in medical imaging scenarios where healthcare professionals must evaluate both external surfaces and internal features, including tissue density variations [
26]. The technique’s flexibility in modifying opacity levels and color mappings enables the selective emphasis of various tissue types and anatomical structures, establishing volume-rendering as an adaptable tool for medical visualization applications. Volume-rendering distinguishes itself through its capacity to preserve fine details that might be lost in conventional surface-rendering methods. Studies have demonstrated that volume-rendering enhances the precision of clinical evaluations by providing more realistic anatomical visualizations compared to surface-rendering techniques [
27].
2.2.3. Proposed Methods
Despite the proven capabilities of the Medical Transformer in many applications, it has a significant drawback: deep networks generally require long training times and incur high computational costs. Specifically, while the Medical Transformer employs optimizations such as reducing attention window sizes and hierarchical processing to maintain training accuracy while reducing training costs, the fundamental transformer architecture limits the effectiveness of these measures. Additionally, the object queries in the decoder of the Medical Transformer are not highly correlated with the image, which impacts segmentation quality.
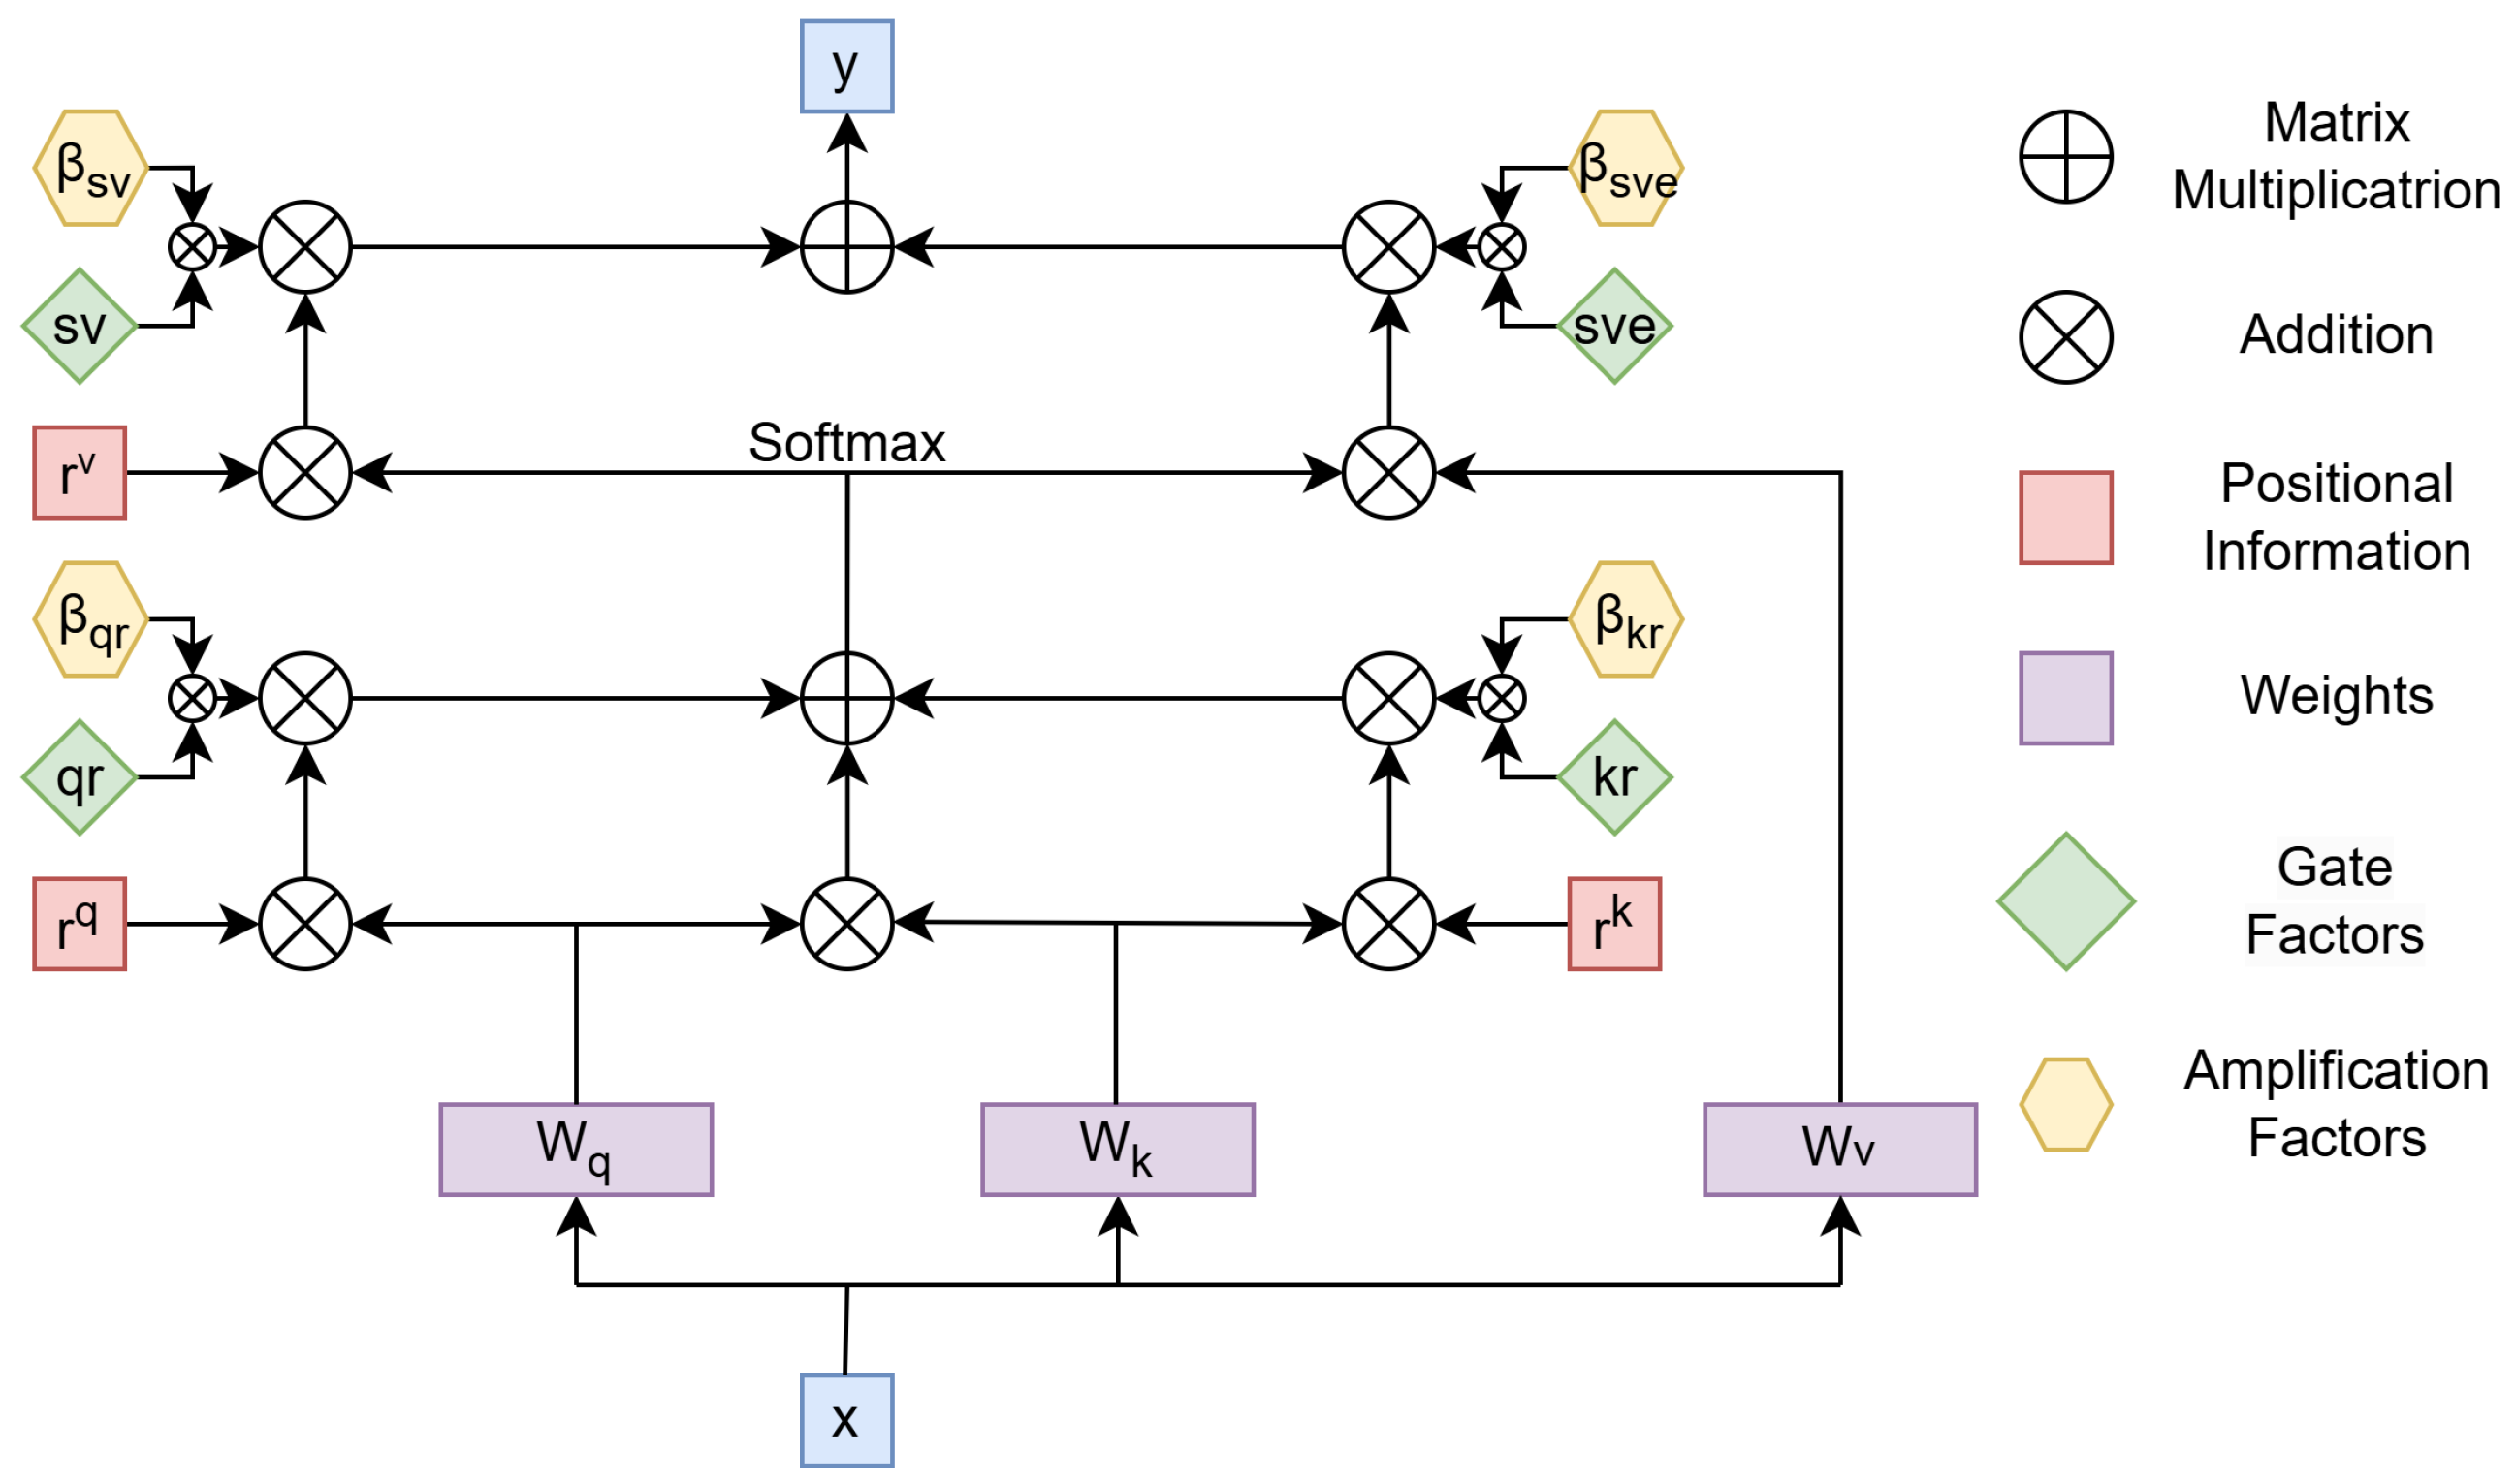
The proposed attention mechanism model is based on enhancing the axial attention mechanism. The axial attention mechanism is an approach that improves the efficiency of self-attention, particularly for high-dimensional data such as images or 3D volumes. Unlike traditional self-attention, which calculates relationships between all elements in the input tensor simultaneously, axial attention breaks this computation into sequential steps along specific dimensions, such as rows, columns, or depth. The input tensor, x, is first transformed using learnable weight matrices (, , and ) into queries (Q), keys (K), and values (V). These components allow the model to compute attention scores and aggregate information from relevant positions. Positional information (, , and ) is added at various stages to capture spatial dependencies, ensuring that the mechanism respects the structure of the input. The attention process begins by computing the interaction between Q and K, incorporating positional encodings to reflect relative positions. These interactions are normalized using a softmax function, producing attention weights. These weights are then used to combine the corresponding values, resulting in an aggregated representation. This process is repeated for each axis independently, such as row-wise and then column-wise, to ensure that the model captures dependencies across all dimensions. By decomposing the computation along each axis, axial attention significantly reduces the computational cost compared to traditional self-attention. Instead of scaling quadratically with the total number of elements in the input tensor, the computation scales linearly with respect to the size of each axis. This efficiency makes axial attention particularly suitable for handling large inputs while maintaining high performance. The output of axial attention, represented as y in the diagram, is a context-aware representation of the input, combining information along all dimensions. This mechanism not only preserves the global context of the input but also allows for more the efficient processing of high-dimensional data, making it a powerful tool for tasks like image and volume analysis, where computational efficiency and spatial structure are both critical.
The gated axial attention mechanism builds upon axial attention by introducing gate parameters (, , , ) to dynamically control the contributions of queries, keys, values, and positional encodings. This adjustment addresses a limitation in axial attention, where positional information (, , ) can overly influence attention scores. By scaling the impact of positional encodings, the gates ensure a better balance between content relevance and spatial dependencies, allowing the model to focus more effectively on meaningful relationships in the data. In this mechanism, the gates act as learnable coefficients that modulate the interaction between content and position. For example, and scale the influence of queries and keys when combined with positional encodings, while adjusts the contribution of values during aggregation. This dynamic modulation reduces the risk of overfitting to positional biases, making the model more robust to variations in spatial structure. The gated axial attention mechanism retains the computational efficiency of axial attention as it still processes data along individual axes. However, the added flexibility of gate parameters allows the model to adapt to diverse data distributions and the varying importance of spatial axes. This makes it especially useful for high-dimensional structured data, such as images and volumetric datasets, where spatial dependencies can differ significantly across dimensions.
We observed that when using gated axial attention for large tissue segmentation, the segmentation performance improved when the gate unit weights were smaller. Conversely, for smaller tissues, the segmentation accuracy improved when the gate unit weights were larger. This indicates that the smaller the impact of gate unit parameters on positional information, the more effective the model becomes in segmenting small targets. Since our goal was to identify small targets, we introduced four additional parameters, as shown in
Figure 1, to mitigate the weakening effect of the gate unit on positional information, thereby enhancing the model’s capability to segment vascular cross-sections.
With the proposed modifications, the self-attention mechanism applied to the width axis can be expressed as follows
We introduced amplification factors to the gated attention mechanism. Specifically, , , , , , , , and were learnable parameters that collectively formed the new parameters for modulating positional information. These parameters controlled the influence of the learned relative positional encoding for capturing non-local contextual information.
Additionally, we utilized GhostNet as the feature extractor, which significantly reduced the number of parameters and computational memory requirements while maintaining prediction accuracy. This approach not only lowered the time required for feature extraction but also enhanced the model’s efficiency. To further improve performance, we incorporated a structure that combined both local and global features extracted by GhostNet and fed them into the decoder. This integration enabled the effective detection of small regional targets, a critical factor for accurately segmenting the coronary arteries.
The overall network structure can be referred to in
Figure 2. In the proposed architecture, feature extraction is divided into two pathways: global and local. After extracting the features, they are fused and passed through fully connected layers. For global feature extraction, due to the large image size, we reduced the number of convolutional layers. On the other hand, for local feature extraction, where the segmented regions are smaller, we increased the number of convolutional layers. This adjustment ensured that the time required for global and local feature extraction was approximately the same, facilitating the subsequent feature fusion process.
2.3. The 3D Reconstruction
The 3D reconstruction of the vessel was achieved by creating a mesh grid from extracted boundary points in sequential 2D slices. This mesh grid represented the vessel’s morphology across layers and served as the foundation for volume rendering. By later applying Laplacian Pyramid Interpolation to the volume, we enhanced the resolution and smoothness of the reconstructed structure. This section details the steps involved in mesh grid construction, data storage, and 3D rendering.
2.3.1. Boundary Point Extraction and Layer-by-Layer Mesh Grid Construction
To represent the vessel’s structure in 3D, we first extracted the boundary points from each 2D slice of the vessel. Let denote the set of N boundary points extracted from the i-th layer, where is the coordinate of the n-th boundary point in the 2D plane. These points were obtained through the segmentation of each vessel slice and served as the vertices of the mesh grid.
Within each layer
i, we constructed a closed curve by connecting each pair of adjacent points
and
with a line segment, where
takes modulo
N to form a continuous boundary. Mathematically, this intra-layer connection can be represented by the set of line segments:
To extend the vessel structure across layers, we connected corresponding points in adjacent layers. For each point
in layer
i, we drew a line segment to the point
in the next layer
. This connection across layers was defined as
where
M represents the total number of layers and
indicates the layer’s position in the 3D space.
Combining the intra-layer and inter-layer connections, we obtained a complete 3D mesh grid representing the vessel’s structure. The 3D coordinates for each boundary point were given by , where z served as the depth axis.
2.3.2. Saving Mesh Grid Data
The mesh grid data, consisting of the boundary points and connection lines, were saved for each layer to preserve the structure and facilitate further processing. These data were stored in a structured format as a sequence of points and line segments for use in subsequent volume-rendering and interpolation steps. Each point was indexed and connectivity matrices were created to represent the intra-layer and inter-layer connections.
2.3.3. Initial Volume Rendering of the Mesh Grid
With the 3D mesh grid constructed, initial volume rendering was performed to visualize the vessel structure in the 3D space. By treating the mesh grid as a spatial representation of the vessel, we obtained a preliminary volume-rendering that provided an initial overview of the vessel’s morphology.
2.3.4. Resolution Enhancement and Smoothness Adjustment via Laplacian Pyramid Interpolation
To improve the resolution and smoothness of the reconstructed volume, we applied Laplacian Pyramid Interpolation to the initial rendering. The Laplacian Pyramid Interpolation process refined the spatial details and enhanced the continuity of the vessel surface, resulting in a high-quality 3D visualization.
Given the original volume data
V, represented by the 3D coordinates of the mesh points, we constructed a Laplacian pyramid
, where
was the finest level and
was the coarsest level. Using Gaussian filtering and downsampling, we defined each level of the Gaussian pyramid
as
where
. Subsequently, each level of the Laplacian pyramid was formed by subtracting the upsampled version of the next coarser Gaussian level from the current Gaussian level:
Starting from the coarsest level
, we iteratively upsampled and combined the layers to reconstruct the volume at higher resolution:
The Laplacian Pyramid Interpolation enhanced structural continuity and detail across the vessel surface, ensuring that the 3D rendering retained both smoothness and resolution. This step provided a refined, high-resolution 3D volume suitable for detailed analysis and visualization of the vessel morphology.
2.4. Evaluation Indicators
2.4.1. F1 Score
The F1 score is a metric used to evaluate the accuracy of a binary classification model, considering both precision and recall. It is particularly useful when there is an imbalanced class distribution. The F1 score is the harmonic mean of precision and recall, providing a single measure that balances the two.
The F1 score can be calculated as
The F1 score is maximized when both precision and recall are high, making it a useful metric when you need a balance between the two.
2.4.2. Mean Intersection over Union
The mean Intersection over Union (mIoU) is a metric commonly used in semantic segmentation tasks. It measures the overlap between the predicted segmentation and the ground truth. For a single class, the IoU is defined as the ratio of the intersection of the predicted and true positive pixels to the union of all predicted and true positive pixels. The mean IoU is computed by averaging the IoU values across all classes.
The mean IoU is the average of the IoU scores across all classes:
where
N is the number of classes (e.g., background and different object categories in segmentation tasks). The summation is taken over all classes.
This metric provides a comprehensive measure of performance for segmentation tasks as it takes into account the overlap between predicted and actual regions across all classes.
3. Experiment and Results
In this study, we conducted training and prediction experiments using the same dataset across various state-of-the-art deep learning networks to evaluate their performance. The networks included Medical Transformer [
28], RCA-IUnet [
29], ResUNet [
10], TransUNet [
13], UNet++ [
30], DeepLabV3+ [
31], and our proposed networks, one without GhostNet and the other with GhostNet.
The comparative results of these networks are presented in
Table 1, where we provide detailed statistics, including the number of parameters, inference speed, F1 score, and IoU. These metrics were chosen to offer a comprehensive evaluation of the computational efficiency and prediction accuracy of each model.
To visually demonstrate the differences in performance, we selected two representative images from the test set. These images highlight the recognition capabilities of each network in generating segmentation masks. The prediction masks generated by each network, alongside their corresponding ground truth, are displayed in
Figure 3. This figure allows for a clear qualitative comparison of the models’ effectiveness in segmenting the input images.
The performance comparison of various deep learning models, as detailed in
Table 1, highlighted both the accuracy and computational efficiency of our proposed methods on the given CT image dataset. Among the tested methods, our proposed network without GhostNet achieved the highest F1 score of 0.897, demonstrating superior segmentation accuracy for the RCA cross-sections across multiple CT layers. This reflected the effectiveness of our approach in extracting fine vascular structures. When GhostNet was incorporated (Ours*), there was a marginal decrease in segmentation accuracy, with the F1 score reduced to 0.887 and the IoU to 0.797. However, this configuration achieved a significant improvement in inference speed, recording the fastest time of 7.03 ms. This trade-off between accuracy and computational efficiency makes the GhostNet-enabled model particularly suitable for applications where real-time performance is critical.
The inference speed of our proposed model was measured on a system equipped with an NVIDIA GeForce RTX 3060 GPU (32 GB), an 11th Gen Intel(R) Core(TM) i5 CPU, and 32 GB of RAM. The total number of parameters was approximately 5.5 million, confirming the model’s lightweight design. Given its relatively low computational complexity and memory requirements, the proposed architecture demonstrated the potential for real-time deployment on edge devices commonly used in clinical environments, such as the NVIDIA Jetson platform or devices compatible with Intel OpenVINO. The integration of GhostNet contributed significantly to the model’s efficiency, making it suitable for resource-constrained settings without sacrificing performance.
Comparatively, other networks, such as Medical Transformer and Deeplabv3+, exhibited competitive performance in terms of accuracy, with F1 scores of 0.882 and 0.841, respectively. However, their computational costs, including larger parameter sizes and slower inference speeds, make them less efficient for practical deployment. Networks like RCA-IUnet and ResUNet, while lighter in terms of parameters, showed significantly lower F1 scores of 0.783 and 0.723, indicating less effective segmentation capabilities.
After extracting the cross-sectional masks of each layer of the right coronary artery, we proceeded to extract the edges of the predicted cross-sectional masks. On these edges, 30 points were uniformly distributed. Each point was assigned a unique identifier and neighboring points were connected by lines. This approach enabled the construction of a point-based matrix, which was then utilized to generate a three-dimensional mesh grid for reconstruction.
Figure 4a illustrates the reconstructed RCA of one patient. In this visualization, blue lines represent the connections between points within each individual layer, while red lines indicate the connections between corresponding points across adjacent layers. For better visualization and clarity, the Z-axis—representing the inter-layer distance—was appropriately stretched to emphasize the spatial relationships.
Subsequently, based on the constructed mesh grid, we employed volume-rendering techniques to further enhance the visualization of the vascular structure. Specifically, we utilized a surface-rendering approach within the volume-rendering framework to transform the mesh grid into a continuous, smooth representation of the vessel surface. This method enabled a detailed depiction of the vascular topology, providing a clear and intuitive visualization of both the location and morphology of vascular narrowing.
The rendering process involved assigning specific color and opacity values to the surface based on the geometric attributes of the mesh grid, allowing for the differentiation of structural details. This facilitated the identification of stenotic regions by highlighting their spatial characteristics and transitions. The resulting image, shown in
Figure 4b, represented a preliminary rendered visualization of the RCA. The coordinate system, displayed in the lower-left corner, provided a spatial reference for interpreting the reconstructed geometry.
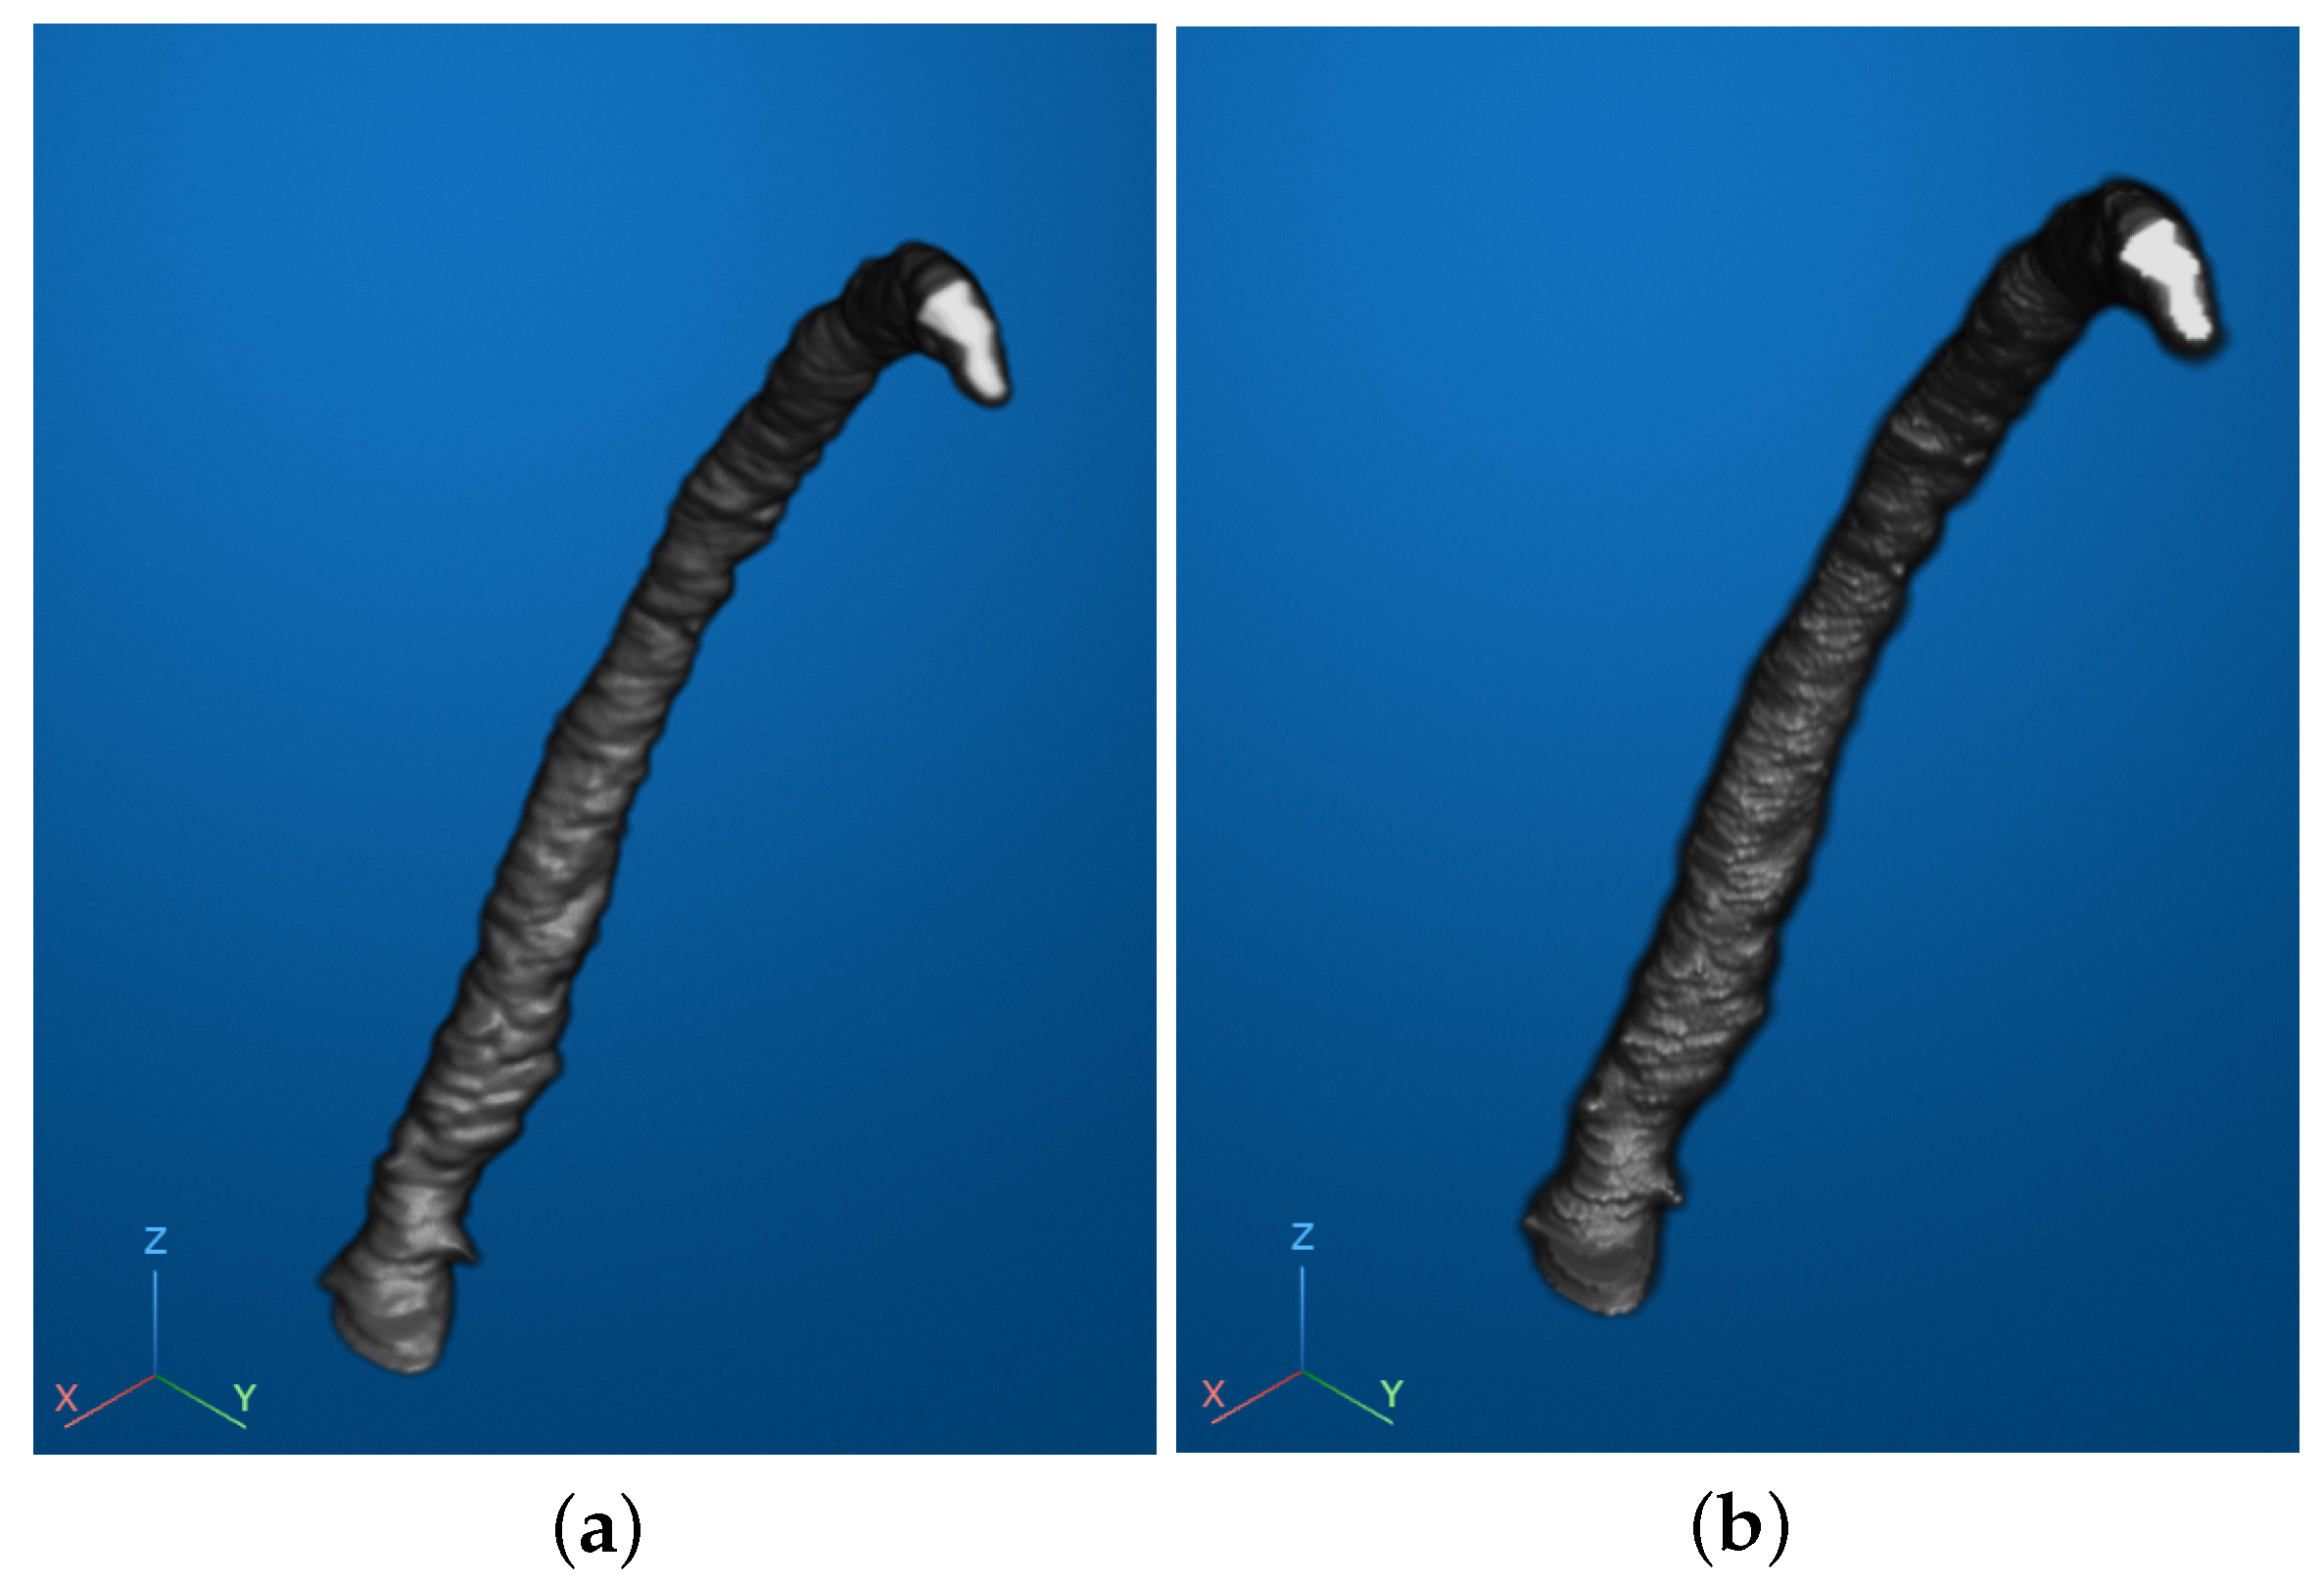
To further enhance the visual quality and improve the interpretability of the reconstructed vascular image, we applied smoothing techniques. Specifically, we utilized two methods: Laplacian Pyramid Interpolation and Gaussian Smoothing Interpolation. These methods were employed to reduce visual noise and ensure a smoother representation of the vascular surface, facilitating better observation and analysis.
The results of the smoothing processes are illustrated in
Figure 5. Subfigure (a) shows the outcome of Gaussian Smoothing Interpolation, which emphasized gradual transitions and overall uniformity in the surface structure. Subfigure (b) presents the results of Laplacian Pyramid Interpolation, which preserved fine details while reducing abrupt variations in the mesh.
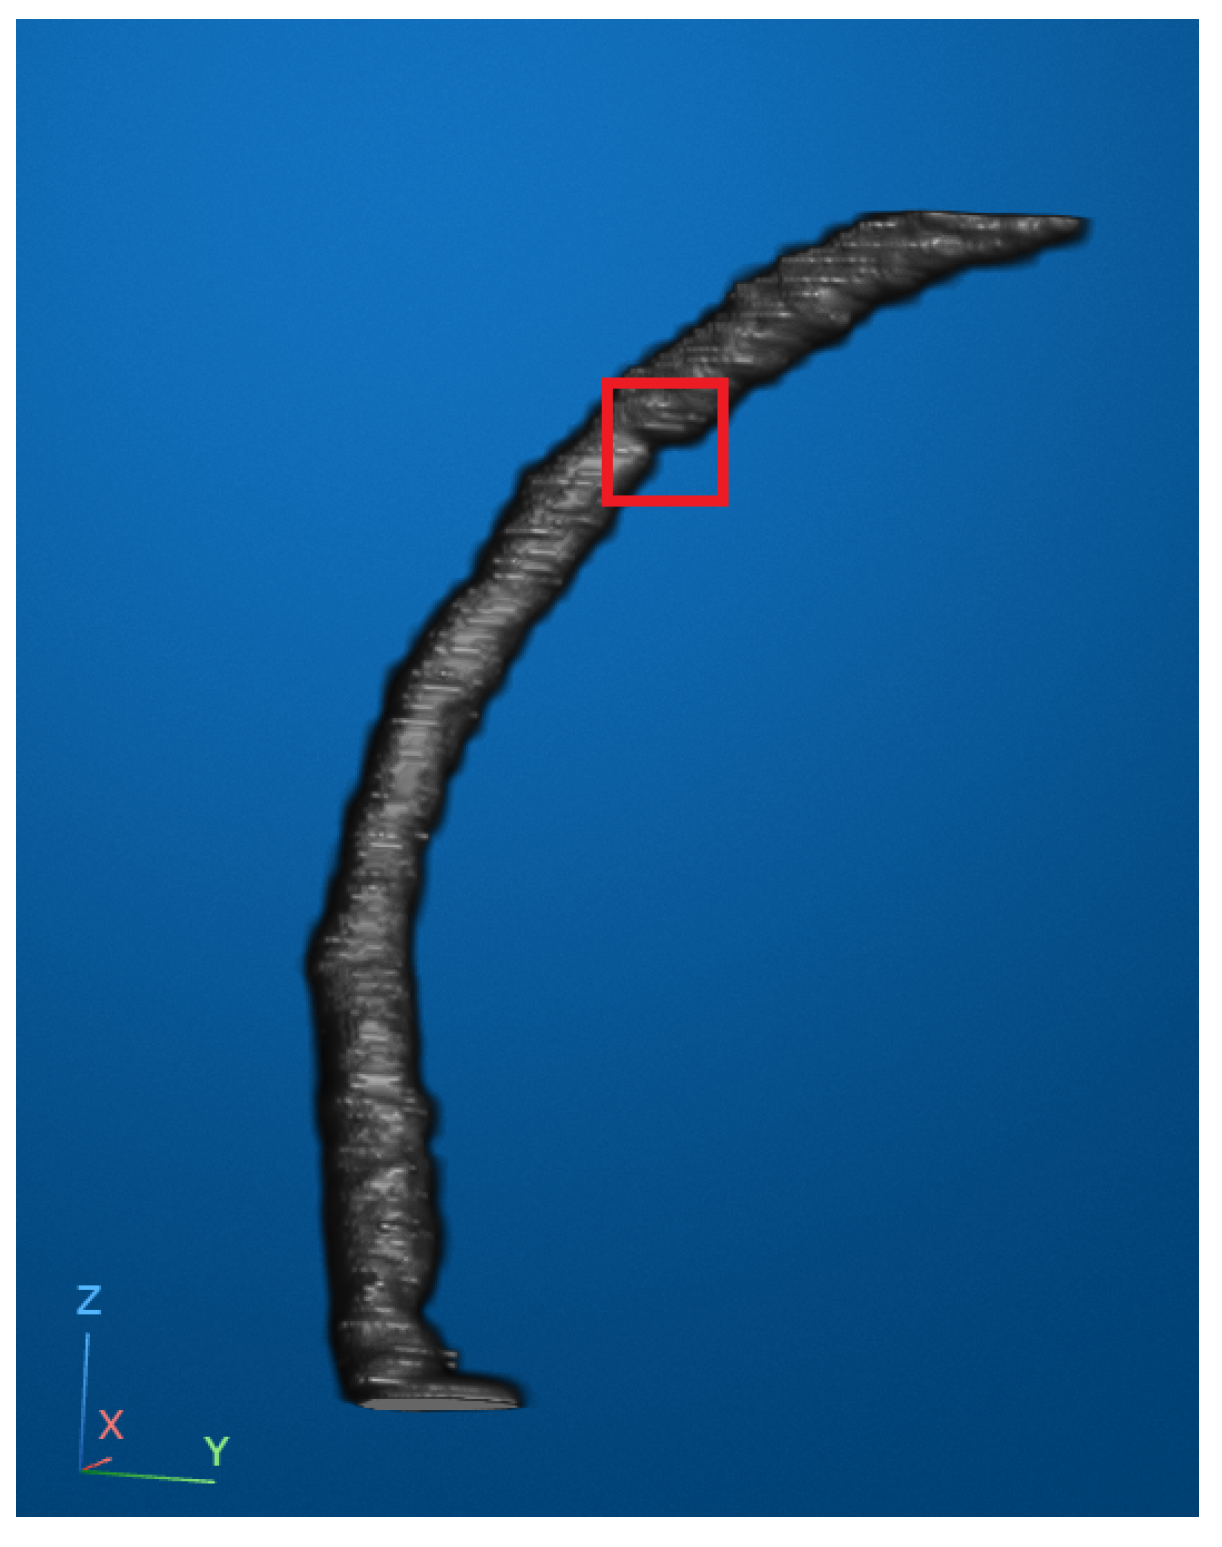
According to widely accepted clinical guidelines, a coronary artery stenosis is considered moderate when the lumen diameter is reduced by more than 50% and severe when the reduction exceeds 75%. In our reconstructed and smoothed 3D vascular images, we attempted to identify an optimal viewing angle that allowed for the clearest observation of both the location and apparent degree of stenosis. In
Figure 6, the stenotic region is marked with a red bounding box to highlight an area of visually significant narrowing. While the narrowing in this region appeared prominent and corresponded well with the typical morphological patterns of stenosis, we must note that our dataset lacked access to corresponding clinical diagnostic reports. Therefore, although the narrowing was evident from visual inspection, we refrained from assigning a specific stenosis grade and instead conservatively describe it as visibly significant.
4. Discussion
This study presents a comprehensive evaluation of state-of-the-art deep learning models and a proposed architecture for the automated segmentation and 3D reconstruction of the right coronary artery from CT images. The results demonstrate notable advancements in both segmentation accuracy and computational efficiency, indicating the practicality of our method for real-time clinical applications. Through comparative analysis, our proposed model without GhostNet achieved the highest segmentation performance, with an F1 score of 0.897 and IoU of 0.814. These results underscore the effectiveness of the Transformer-based module in capturing long-range dependencies and global contextual information within the vascular structure. Compared with conventional convolution-based architectures such as ResUNet, our model demonstrated superior accuracy, particularly in detecting small, complex vascular cross-sections that are often subject to segmentation failure. This improvement can be attributed to the enhanced representational capacity introduced by the attention mechanism within the transformer module, which allows the network to focus on subtle but clinically important vessel features that may be overlooked by local receptive fields in traditional CNNs.
However, this gain in accuracy is accompanied by an increased computational burden. To address this issue, we integrated the GhostNet backbone into the network and conducted an ablation study to compare its performance with and without GhostNet. The model without GhostNet achieved the highest segmentation accuracy, with an F1 score of 0.897 and an IoU of 0.814, but had a larger parameter size of approximately 11.0 M and an inference time of 14.05 ms. After incorporating GhostNet (with s = 2), the parameter size was reduced by half to approximately 5.5 M and the inference speed improved significantly to 7.03 ms, demonstrating a clear advantage in computational efficiency. This result suggests that GhostNet is highly effective in reducing computational complexity while maintaining competitive segmentation accuracy (F1 score of 0.887, IoU of 0.797). The trade-off between speed and accuracy is acceptable for real-time clinical scenarios, such as intraoperative visualization or bedside diagnostics, where processing speed is critical. It is worth noting that the GhostNet architecture includes a tunable parameter s, which controls the degree of parameter reduction. In this study, we fixed s = 2 to balance speed and segmentation quality. Preliminary experiments indicate that increasing s could further reduce the number of parameters and accelerate inference, making the model even more suitable for deployment on resource-limited clinical edge devices. However, to maintain a reasonable level of segmentation accuracy, we limited the comparison in this work to s = 2, which we found to be a practical configuration.
The transition from 2D segmentation masks to 3D reconstruction represents a critical step in understanding the spatial structure of coronary arteries. The proposed reconstruction process involved extracting the edges of segmented masks, distributing points uniformly, and generating a mesh grid that connected points within and across layers. This approach facilitated the construction of a detailed 3D representation of the RCA, allowing for enhanced visualization of its topology. Volume-rendering further improved the interpretability of the reconstructed RCA. By using surface-rendering techniques, the vascular structures were transformed into a continuous and smooth representation, which effectively highlighted morphological features. The rendering provided an intuitive way to identify stenotic regions, aiding in clinical diagnosis and planning. The smoothing techniques, Gaussian Smoothing and Laplacian Pyramid Interpolation, played a key role in refining the visual quality of the 3D models. Gaussian Smoothing, along with faster processing times, indicating its superiority for applications requiring both high quality and efficiency. However, Laplacian Pyramid Interpolation excelled in preserving edge clarity and fine structural details, making it a suitable choice for tasks focused on detecting subtle abnormalities. The reconstructed models provided clinicians with a clear visualization of the degree and location of vascular narrowing. This feature can enhance the diagnostic process, reducing the likelihood of missed or inaccurate assessments. Moreover, the ability to adjust viewing angles and analyze smoothed vascular images supports more comprehensive evaluations, which could improve patient outcomes.
The clinical value of the 3D reconstruction method can significantly impact both procedural planning and patient care. Surgeons can utilize detailed 3D visualizations to better understand complex anatomical relationships and plan optimal approaches for interventional procedures. This enhanced understanding allows for more precise preoperative planning, potentially reducing procedure times and improving outcomes. The 3D models also serve as powerful tools for patient education, helping clinicians explain conditions and planned procedures more effectively, which can improve patient understanding and compliance. In multidisciplinary settings, these reconstructions enhance communication between different specialists, facilitating more comprehensive treatment planning. The technology also offers valuable opportunities for medical education, allowing trainees to study and practice on accurate representations of patient-specific anatomies. This application in training could accelerate the learning curve for new interventional cardiologists while improving their preparedness for complex cases.
This study, while demonstrating promising results, has several limitations that must be addressed to further validate and enhance the proposed methods:
Firstly, due to the unavailability of diagnostic data for the 32 patients included in the dataset, we were unable to validate the accuracy of stenosis location and stenosis rate predictions. This limitation hinders the ability to directly verify the clinical effectiveness of our method. Future work should aim to integrate diagnostic information to provide a more comprehensive assessment of the method’s accuracy and reliability.
Secondly, given the complexity of CT images, our study focused exclusively on the right coronary artery as it is relatively easier to identify and analyze. This approach excluded the evaluation of stenoses in branching vessels or the left coronary artery, which are equally critical in clinical diagnoses. Addressing these areas in future research would ensure a more comprehensive and versatile method capable of analyzing the full coronary vascular structure.
Thirdly, incorporating the proposed pipeline into real-world clinical workflows requires further testing. Key factors such as noise robustness, compatibility with various imaging modalities, and the user-friendliness of visualization tools need to be evaluated in collaboration with clinicians. These assessments will help ensure that the methods are practical and effective for daily clinical use.
Future work could also explore the application of these methods in related domains, such as the analysis of other vascular regions or integration with intraoperative imaging systems. In particular, we plan to extend the proposed method to other coronary arteries, such as the left anterior descending (LAD) artery and the left circumflex artery (LCX). Given the morphological and contrast similarities between these vessels and the right coronary artery, we expect that only minimal modifications to the architecture or parameters will be necessary. Furthermore, we envision integrating our method into a clinical decision support system (CDSS), where real-time vessel extraction and 3D visualization could provide intuitive anatomical insights and assist clinicians in diagnosis, lesion localization, and surgical planning. In addition, incorporating advanced techniques such as reinforcement learning or generative adversarial networks (GANs) could further improve the model’s adaptability and accuracy across varied clinical scenarios. While our current study is limited to static CT imaging, incorporating temporal dynamics and modeling the persistent motion of anatomical features may provide valuable insights for future clinical applications, such as predicting stenosis progression or tracking mobile structures like blood clots. Integrating such motion-predictive frameworks with our vascular modeling approach could open new possibilities for dynamic risk assessment and longitudinal monitoring in cardiovascular imaging.
5. Conclusions
In conclusion, this study introduced an effective deep learning framework for right coronary artery segmentation and 3D reconstruction from CT images, integrating transformer-based global feature extraction with the lightweight GhostNet backbone. The proposed method achieves a strong balance between segmentation accuracy, computational efficiency, and 3D visualization, contributing to potential challenges in coronary artery analysis. The reconstructed 3D models provide intuitive insights into vascular structure and potential stenosis, supporting diagnosis and surgical planning. While this study was limited to static imaging data, the presented approach establishes a solid foundation for future work involving dynamic feature modeling, clinical decision support integration, and generalization to other coronary arteries. With further validation, this framework holds promise as a practical tool to support cardiovascular diagnostics and improve patient care.


