1. Introduction
Occupancy detection methods that are non-invasive, seamlessly integrated into existing infrastructures, and privacy-assuring are important for numerous applications, ranging from energy management to enclosed spaces monitoring. These techniques enable identification of human presence in designated spaces, providing the opportunity to optimize energy consumption based on occupancy patterns [
1]. Moreover, they support efficient monitoring of laboratory and clinical room usage, ensuring that resources are allocated optimally. Importantly, by analyzing temporal occupancy patterns, such systems can also detect anomalous behavior that may indicate potential security or safety concerns.
In their recent research article, Mena-Martinez et al. [
2] identified personal privacy as a major problem in the deployment of direct indoor occupancy estimation methods, including video-based approaches. Motion detection and security alarm systems have traditionally relied on passive infrared (PIR) sensors, which detect the infrared radiation emitted by objects based on the pyroelectric effect [
3]. These sensors offer several advantages, including low power consumption, a compact form factor, low cost, and ease of installation. Although PIR sensors are effective at detecting motion, they are limited in scenarios where individuals or objects remain stationary within their field of view, and are unable to estimate the number of occupants [
3].
Human respiration produces carbon dioxide as a metabolic byproduct. According to measurements from the NOAA Global Monitoring Laboratory, the global average carbon dioxide concentration was 420.37 ppm in November 2024 [
4]. In indoor settings, exhaled CO
2 mixes with the surrounding air, and its concentration depends on the number of occupants, room volume, and ventilation efficiency.
Persily et al. [
5] examined human carbon dioxide generation in relation to indoor air quality and building ventilation based on metabolic and physiological principles. They explored methods for estimating CO
2 generation from building occupants and presented an approach leveraging basal metabolic rate and level of physical activity. The authors concluded that future research should focus on validating and quantifying the accuracy of CO
2 generation estimates using activity schedules. Furthermore, they highlighted the need to investigate these estimates as a function of group size.
According to [
6], humans inhale air containing 21% O
2 and exhale air containing 16% O
2 and approximately 5% CO
2. Initial adverse effects, including headache, irritability, and confusion, result from increased CO
2 concentrations starting at 1000 ppm and become more dominant with further increases. A concentration of 20,000 ppm can lead to loss of consciousness and asphyxiation [
6].
The concept of detecting humans in indoor spaces based on carbon dioxide levels is not new and has been investigated by various researchers through various simulation models and academic prototypes.
Arief-Ang et al. [
7] proposed a CO
2-based time-series model to predict indoor human occupancy, achieving 94.4% accuracy in an academic room (up to four people) and 77.8% accuracy in a cinema theater (up to 300 people). The dataset consisted of measurements over 13 days (Scenario 1) and 23 days (Scenario 2). Notably, the authors utilized sensors from the same vendor as those employed in this research.
This work aimed to develop an indoor occupancy estimation model using CO2 sensor data and temporal features, which traditional thresholding or simple statistical methods might fail to detect effectively. The model was developed using a multi-modal original dataset of environmental parameters including relative humidity, temperature, sound energy and CO2 collected in a university laboratory over a one-year period. The development of the model adhered to the following criteria: privacy-preserving estimation, ease of installation within existing building and laboratory infrastructure, presence of an Internet of Things interface, low computational complexity, short retraining and deployment cycles for subsequent model versions (for specific time windows), and scalability across an entire department.
To the best of our knowledge, our work is the first to report such a large dataset of recordings, consisting of over one year of measurements. Moreover, other authors have not published datasets to enable replication of their studies. In their 2022 systematic review, ‘Measuring Indoor Occupancy through Environmental Sensors: A Systematic Review on Sensor Deployment’, published in Sensors, Alma Rosa Mena et al. [
8] concluded that only 11 studies (11.82%) report the availability of their datasets, with these datasets being publicly accessible for download and experimentation by others. With our approach, we aim to contribute to the scientific community by creating a dedicated webpage for this research, featuring an API to access the proposed model and the corresponding dataset.
The rest of the paper is organized as follows.
Section 2 presents related works.
Section 3 describes the sensors, the experimental dataset, and the proposed occupancy-estimation algorithm. In
Section 4, we describe the experimental setup and results. Discussion is presented in
Section 5. Finally, conclusions are given in
Section 6.
2. Background Related Works
In a comprehensive systematic review of indoor occupancy measurement using environmental sensors, Mena et al. [
8] observed that most studies were conducted in office environments (61.29%). The dominant sensor type was CO
2 (90.32%), though temperature and relative humidity sensors were also used (4.30%). Data fusion techniques were employed in 27.95% of studies. The most common approaches were based on parameter and feature combination. Machine learning algorithms, particularly Support Vector Machines (20.43%), Random Forests (15.05%), and Artificial Neural Networks (12.90%), were most popular. Principal conclusions from that state of the art are that environmental sensor data, including CO
2, paired with advanced data analytics can determine the correlation of environmental features with human presence in specific indoor environments [
9,
10,
11,
12]. D. Cali et al. [
13] proposed an algorithm for the detection of occupant presence based on the mass balance equation.
Previous studies have focused on the verification of CO
2-based occupancy monitoring in estimating energy consumption, e.g., Yixuan Wei et al. [
1] estimated occupancy levels using a blind system identification (BSI) based on CO
2 concentration and fresh-air system electricity consumption to predict air conditioning (AC) system electricity consumption. They showed that knowledge of the occupancy number can improve accuracy in predicting energy consumption using a feed-forward neural network (FFNN). This shows promise in the development of intelligent systems for building energy management.
Developing indoor occupancy models is significantly challenged by the time-consuming and labor-intensive process of collecting recording datasets. In [
7], Arief-Ang et al. observed that real world data analysis is superior to simulated models due to many factors.
Measuring CO
2 concentration is a challenging task. Several methods can be employed to address this challenge. Photoacoustic spectroscopy sensors detect pressure waves generated by CO
2 molecules absorbing modulated light. Non-dispersive infrared (NDIR) sensors operate on the principle that CO
2 molecules absorb mid-infrared wavelengths around 4.26 µm [
14]. Electrochemical sensors measure the gas concentration by measuring a change in electrical properties (resistance, capacitance, electric potential) induced by absorption of gas. Another method that is both rapid and suitable for real-time monitoring and measurement is laser absorption spectroscopy. This technique employs laser light tuned to the absorption wavelengths of CO
2 to measure its concentration in real time. For laboratory analysis, gas chromatography is commonly used. In chemical adsorption, CO
2 is captured through a chemical reaction with a sorbent, and the amount absorbed is subsequently measured. However, this approach has the drawback of being slower and less suited for real-time applications. Metal oxide sensors detect CO
2 by monitoring changes in the material’s conductivity, which result from the adsorption or desorption of gas on the surface of the metal oxide. This phenomenon was first demonstrated using zinc oxide [
15]. However, as Fine et al. [
15] observed, a significant challenge with these sensors is their difficulty in reliably measuring CO
2 within specific concentration ranges. Liu et al. [
16] highlighted the potential of carbon-based composites for developing CO
2 sensors. In their work, they demonstrated a low-cost and effective chemiresistive CO
2 sensor based on a composite of functionalized carbon nanotubes (f-CNTs) and polyethyleneimine (PEI). Generally, NDIR sensors are most popular for measuring CO
2 concentrations, because they offer a good balance of accuracy, stability, and long-term reliability [
14]. In
Table 1, we compare and contrast key methods for occupancy detection, highlighting their advantages, limitations, accuracy, and key references.
3. Methods
In this section, we describe the proposed methodology for CO2-based occupancy estimation, including the description and characterization of the measurement device, data collection procedures, and the proposed occupancy-estimation algorithm.
3.1. Sensors and Experimental Dataset
We chose the Smart Indoor Air Quality Monitor (SIAQM) developed by Netatmo to build our experimental dataset because it provide APIs and developer documentation to access recorded data. This approach has also been used by other researchers. SIAQM is powered by a USB wall adapter and connected to the Internet. SIAQM samples data every 5 min. It can measure key parameters of the indoor environment, including relative humidity (0 to 100%, accuracy ± 3%), temperature (0 °C to 50 °C, accuracy ± 0.3 °C), sound energy (35 dB to 120 dB), and CO
2 (0 to 5000 ppm, accuracy ± 100 ppm to 1000 ppm and ± 10% for measurements greater than 1000 ppm) [
19]. We used Netatmo API to write Python scrips that enabled the recording and processing of experimental data, as well as export of the data to a CSV file for further processing and analysis.
We installed the device in a university laboratory that typically holds 1 to 15 participants plus 1 academic teacher. The device was used to collect data from 18 September 2023 to 21 November 2024. We chose to place the sensor 1.2 m above the floor, similar to the works of other researchers (who often placed sensors at a height of about 100 cm [
8]) in a well-ventilated network rack that was designed to promote efficient airflow. A photograph of the laboratory, highlighting the sensor location with a red box, is shown in
Figure 1.
Finally, we created a dataset containing 19189 datapoints with available environmental data and timestamps. The created dataset and developed model are available on our research group website, with the link available on request for other researchers if they want to reproduce this study or implement and use the developed algorithm in their laboratory [
20].
3.2. Occupancy-Estimation Algorithm Using CO2 Levels and Temporal Features
We proposed an algorithm to predict room occupancy based on carbon dioxide (CO2) concentrations and temporal features derived from timestamped environmental data from SIAQM. We implemented the algorithm in Python 3.11.5 using TensorFlow.
Our processing and analysis pipeline was divided into the following major steps: data preprocessing, feature engineering and extraction, and deep learning techniques to model occupancy as a binary classification problem. The occupancy-estimation algorithm flowchart is presented in
Figure 2.
In the first step, we loaded and preprocessed the dataset from the API to a CSV file to ensure numerical integrity by converting CO2 values to 32-bit integers. We extracted temporal features from date-time stamps, including fractional hour (Hour), integer hour (Hour_int), and day-of-week indices (DayOfWeek).
We observed that the occupancy of the laboratory is generally periodic, starting from 8 am and ending in the evening on weekdays, while remaining empty on weekends, so we computed the following cyclical features:
This encoding would enable the deep learning model to recognize and learn any patterns in occupancy that might be influenced by the day of the week. This helped us to encode time-of-day in a periodic manner. We used one-hot encoding technique to encode the day-of-week value into seven binary columns (Day_0 to Day_6). We used this one-hot encoding technique because it effectively captures the temporal patterns of weekly room occupancy observed in our dataset. This approach allows the model to recognize recurring occupancy trends on specific weekdays. By using one-hot encoding, the model can better distinguish variations in occupancy patterns across different days, improving prediction accuracy. The final feature matrix X combines CO2 levels with the mentioned above temporal descriptors, yielding a 10-dimensional input per sample. Occupancy labels (y) were manually assigned.
We experimented with different artificial neural networks architectures and configuration parameters. Finally, we proposed a sequential neural network with three fully connected layers: an input layer with 10 neurons (matching feature dimensionality), a hidden layer (ReLU activation), and a single-output layer (sigmoid activation) for binary classification. We used the Adam optimizer and binary cross-entropy loss. The model was trained over 20 epochs using a batch size of 16. The dataset was split chronologically (80% training, 20% testing) to preserve temporal dependencies.
4. Experimental Results
We developed two model variants: a short-term model and a long-term model. The long-term model was trained on the entire collected dataset, while the short-term model used data from the period 18 October 2023 to 18 December 2023. This specific period was chosen due to the high quality of data and the regular weekly occupancy of the laboratory.
The performance of the proposed neural network model for occupancy detection based on CO
2 sensor data was evaluated using a comprehensive set of metrics: Accuracy, Precision, Recall, F1-score, and AUC-ROC [
21].
where:
True Positives (TP): The model correctly predicts the positive class (room is occupied).
True Negatives (TN): The model correctly predicts the negative class (room is unoccupied).
False Positives (FP): The model incorrectly predicts the positive class (predicts that the room is occupied when it is not).
False Negatives (FN): The model incorrectly predicts the negative class (predicts that the room is unoccupied when it is occupied).
Table 2 presents the classification metrics for the short-term (B) and long-term (A) models.
Figure 3,
Figure 4 and
Figure 5 show occupancy trends based on CO
2 levels (model A).
Figure 6,
Figure 7 and
Figure 8 show heatmaps to compare, contrast, and monitor model performance (model B).
5. Discussion
The experimental results demonstrate the effectiveness of the proposed deep learning model in predicting occupancy based on CO
2 sensor data and temporal features. As presented in
Table 1, the classification performance is notably high, with an accuracy of 0.97, an F1-score of 0.92, and an AUC-ROC of 0.99, indicating strong discriminatory power. The precision score of 1.00 suggests the model exhibits no false positives, making it highly reliable for detecting occupied states. However, the recall value of 0.86 implies some missed occupancy detections, which may be attributed to variations in CO
2 levels that do not fully capture the presence of individuals. These results indicate the feasibility of leveraging CO
2 concentration and temporal patterns for occupancy detection while highlighting potential areas for refinement, such as enhancing recall through additional feature engineering or adaptive thresholding techniques.
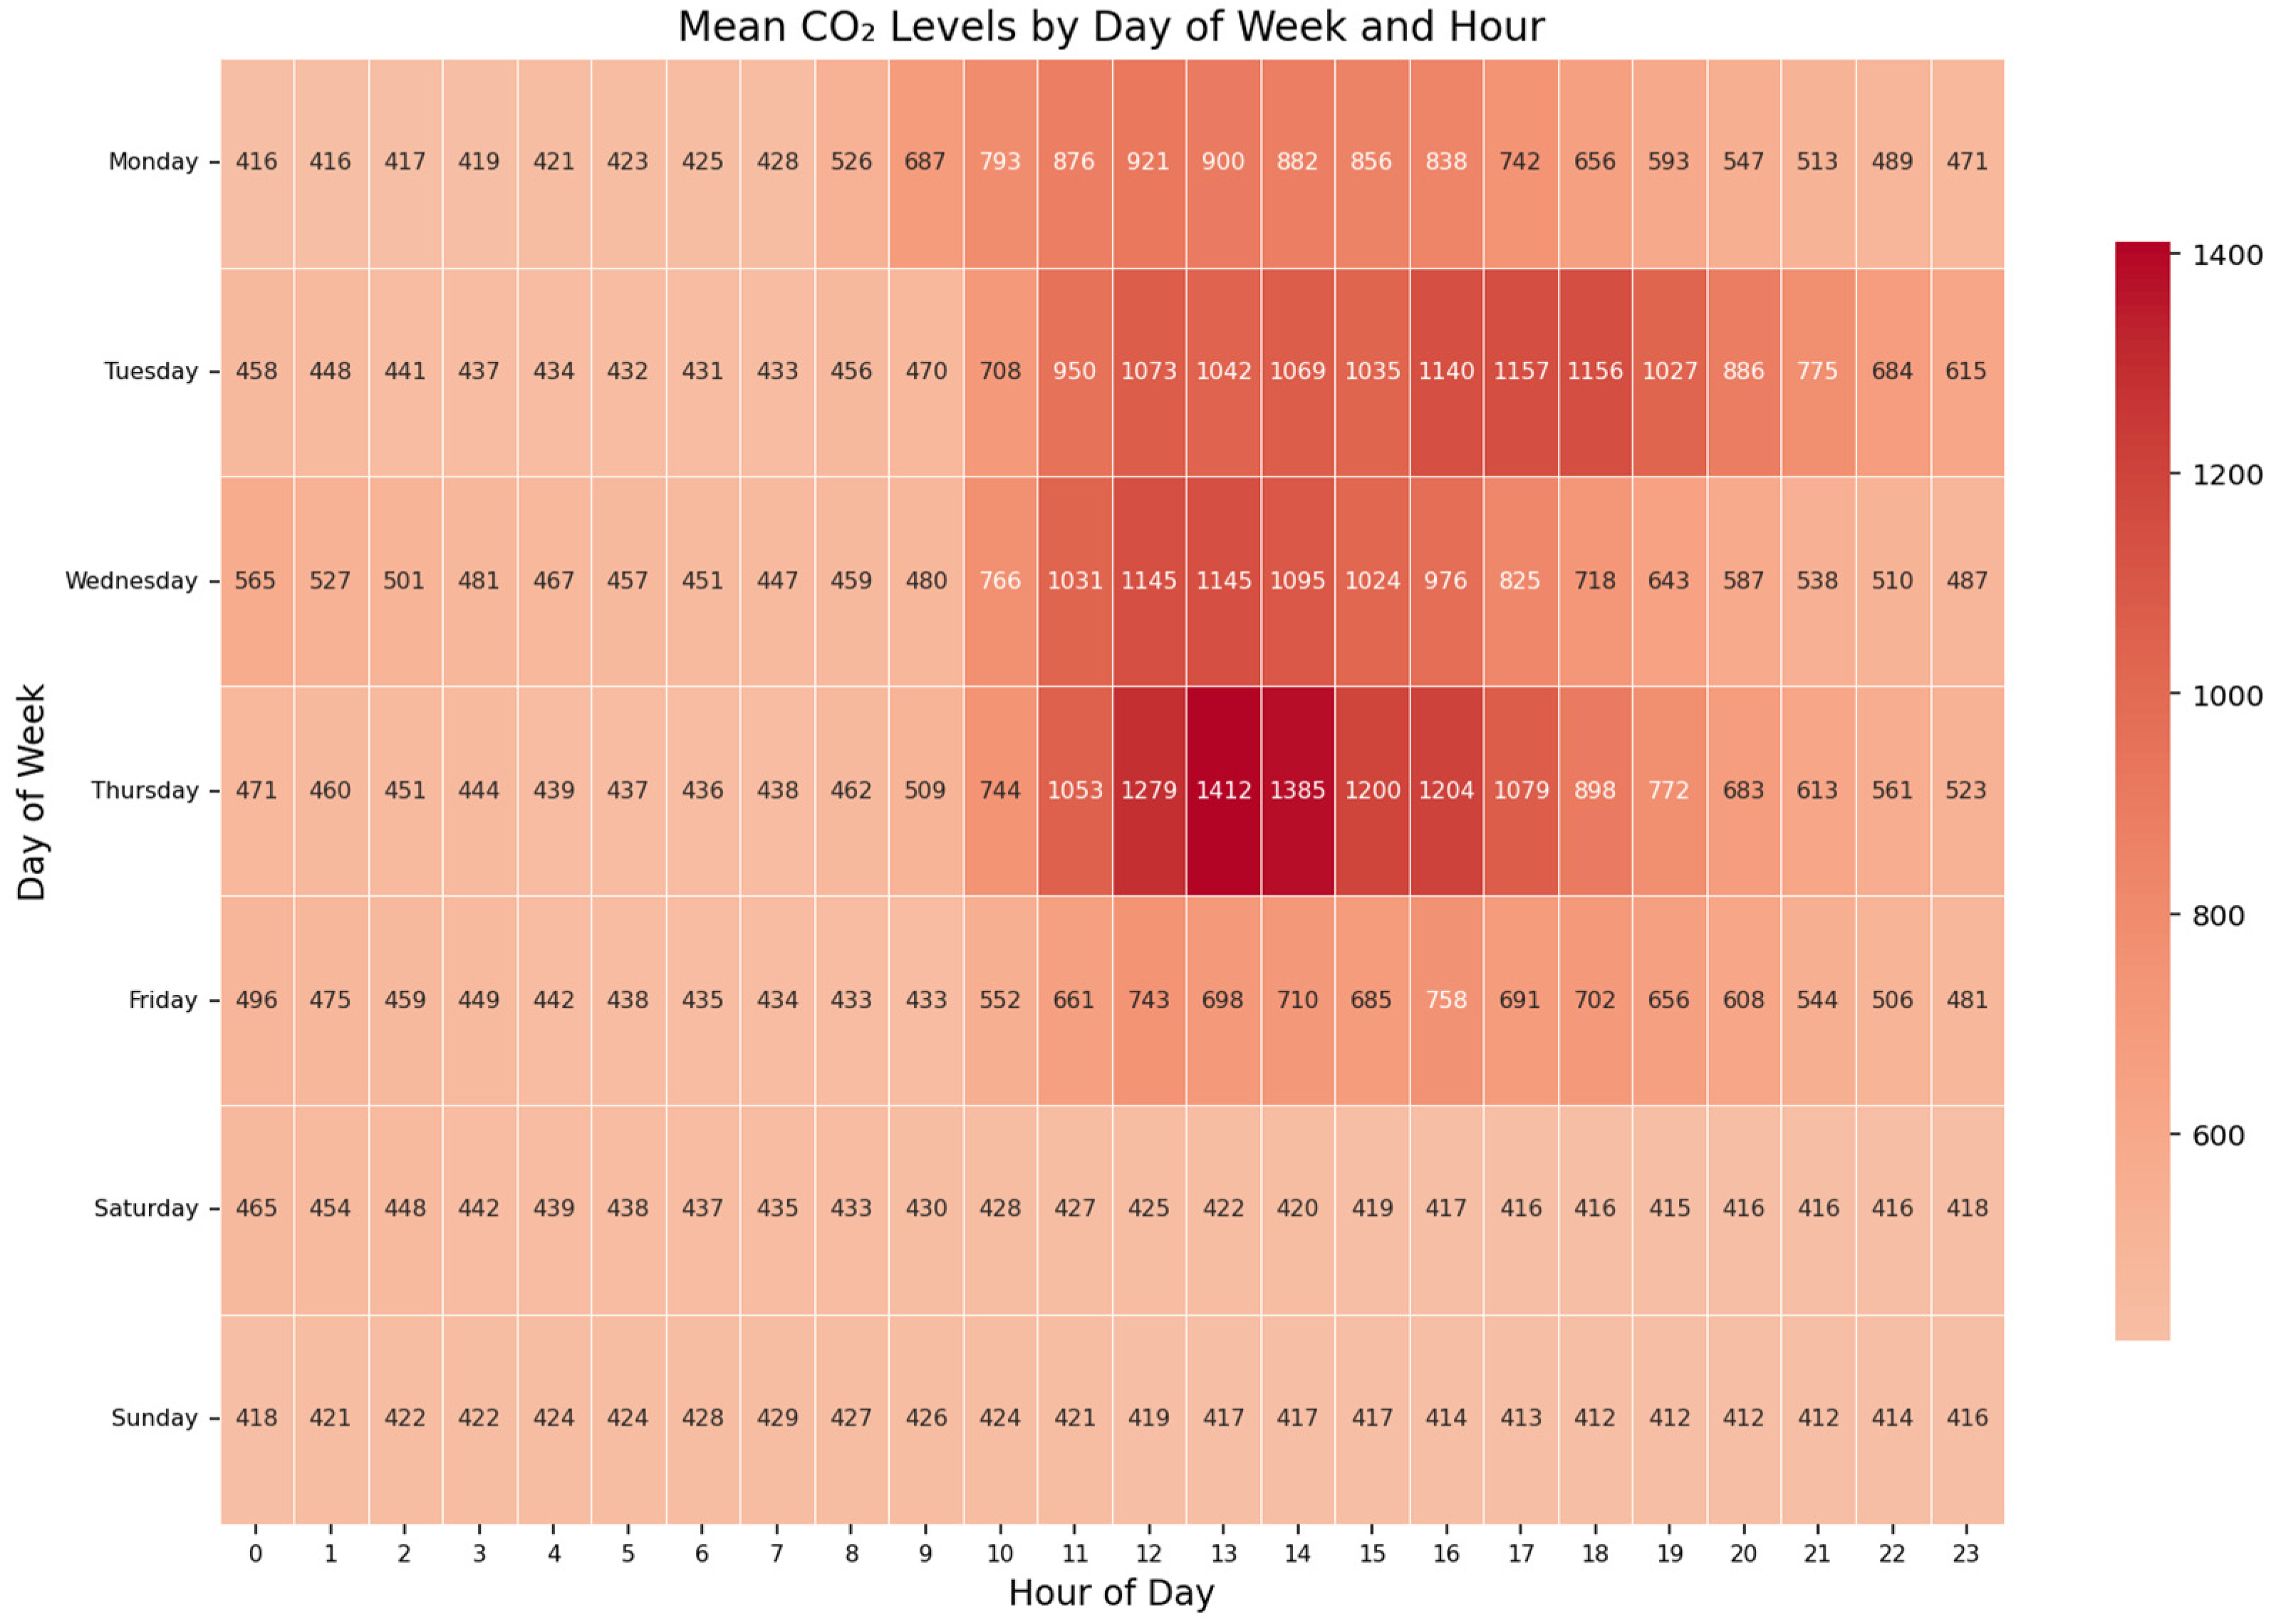
In
Figure 3, mean CO
2 levels exhibit a marked increase during office hours (09:00–18:00), with a gradual decline until 23:00, reflecting the expected work schedule of the laboratory.
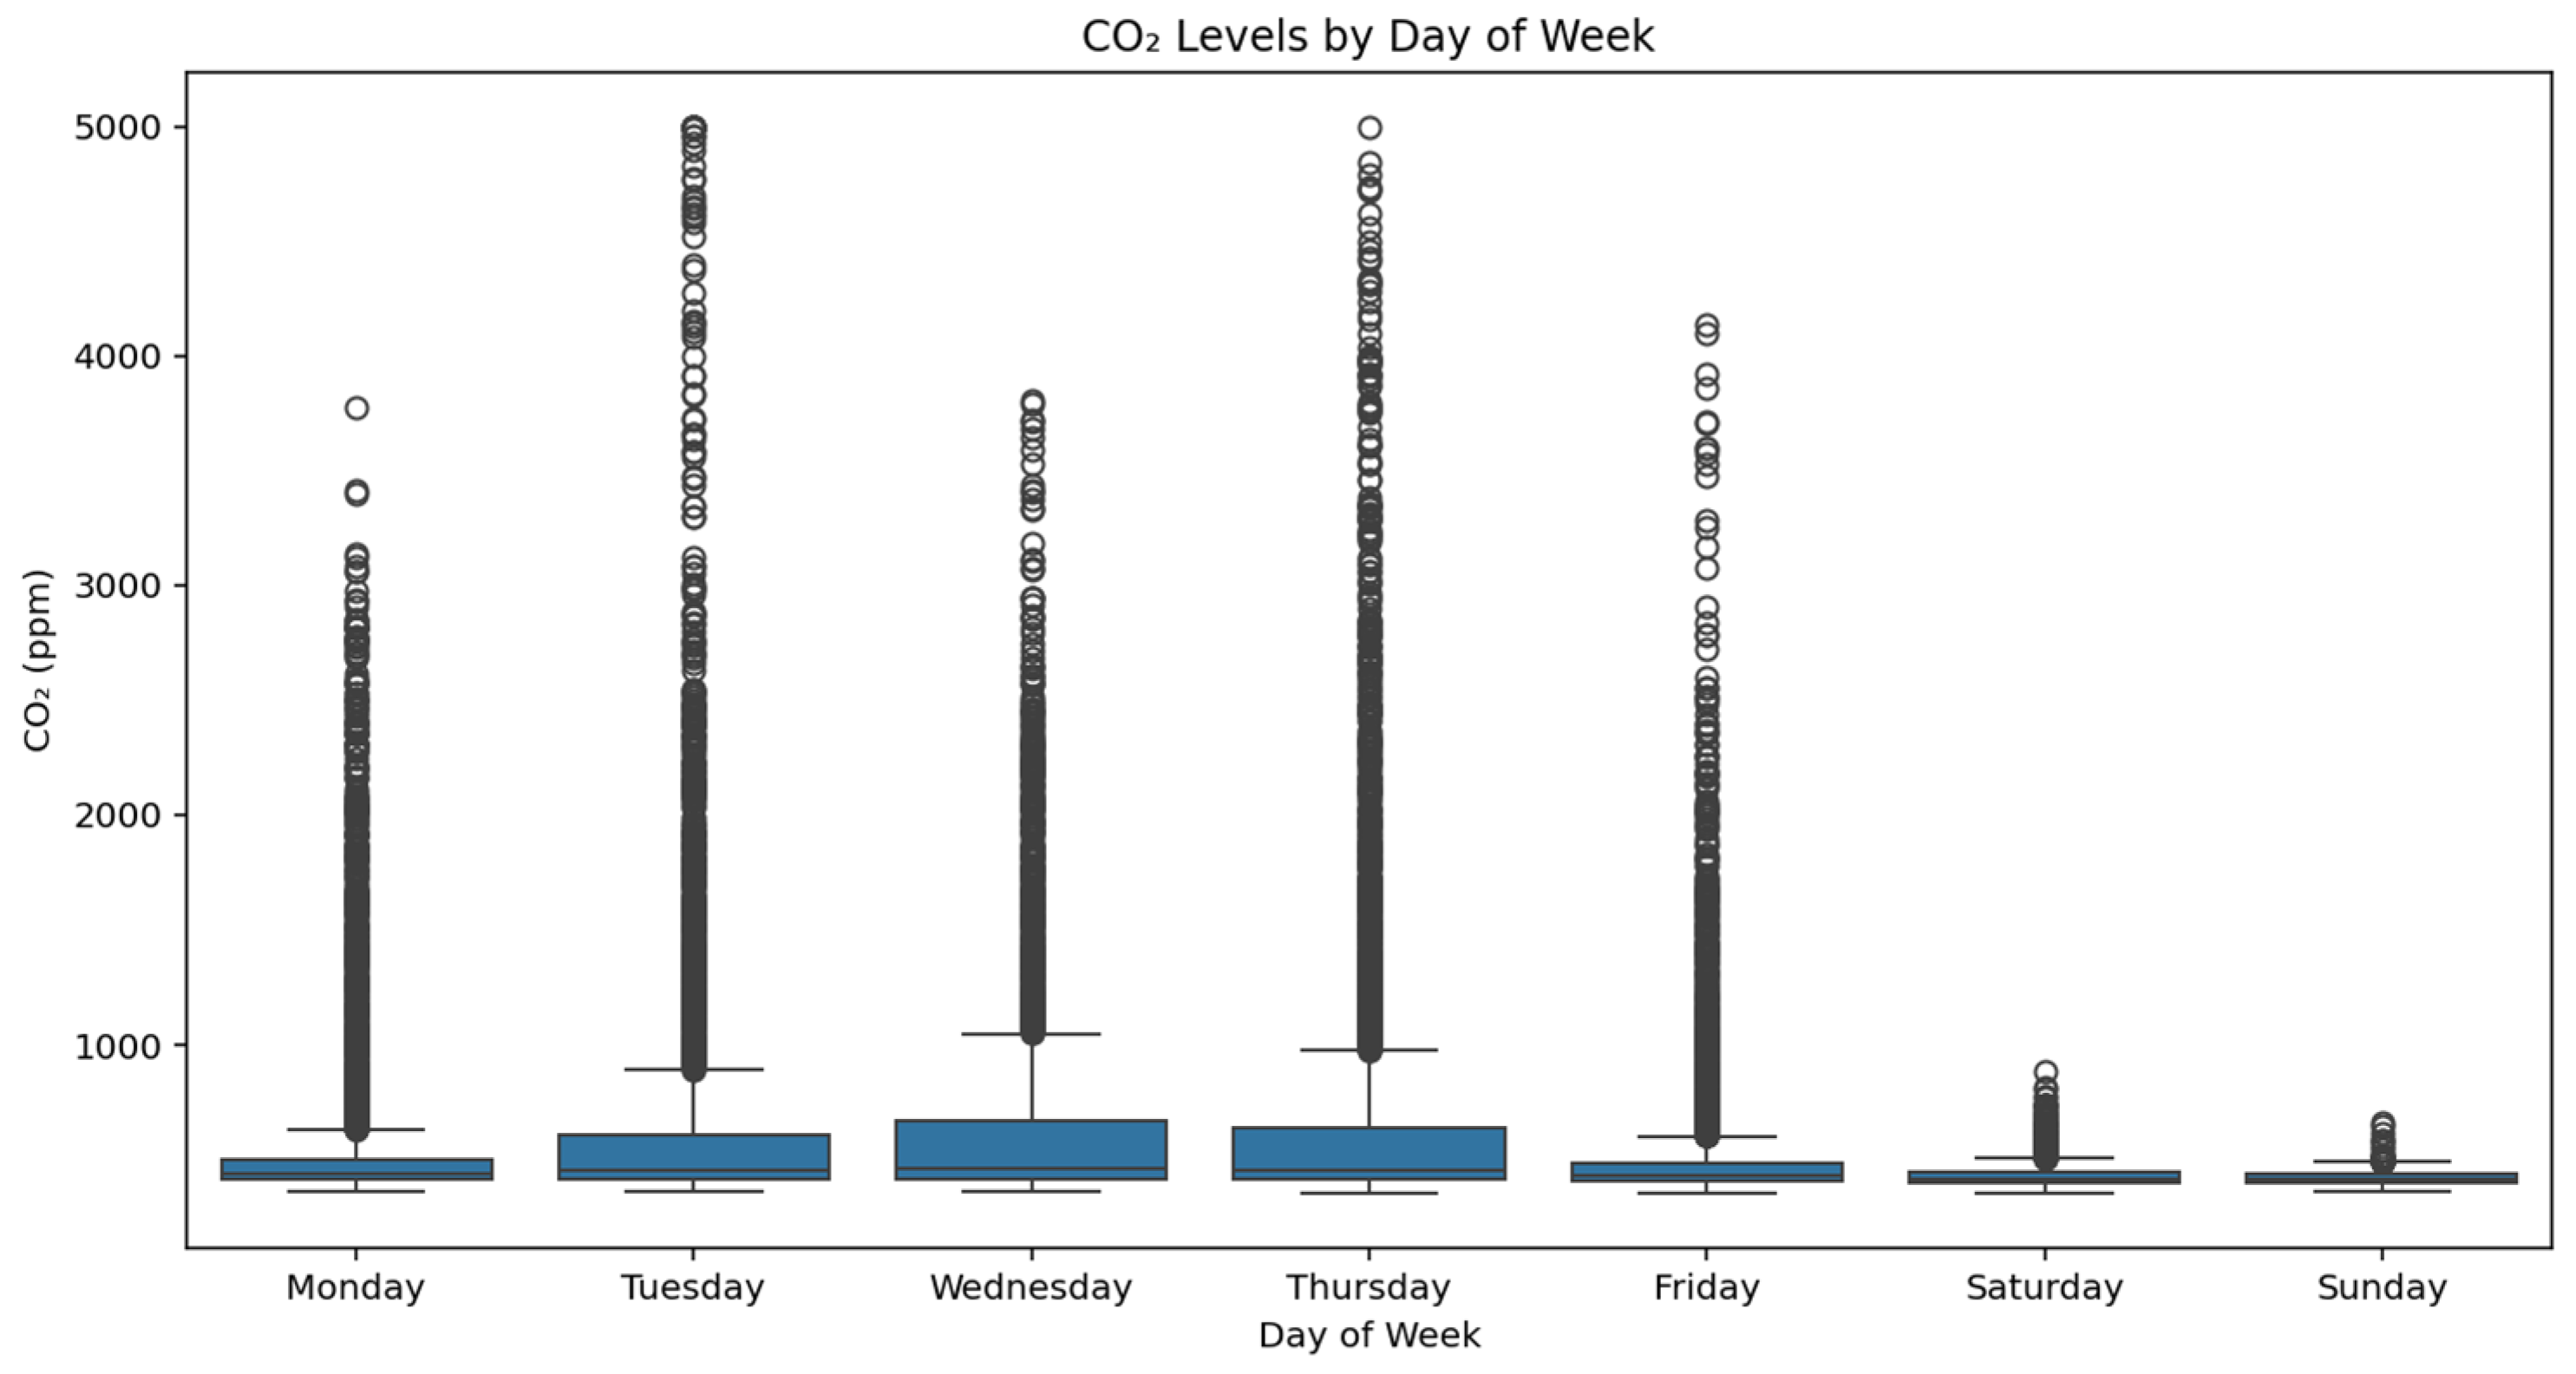
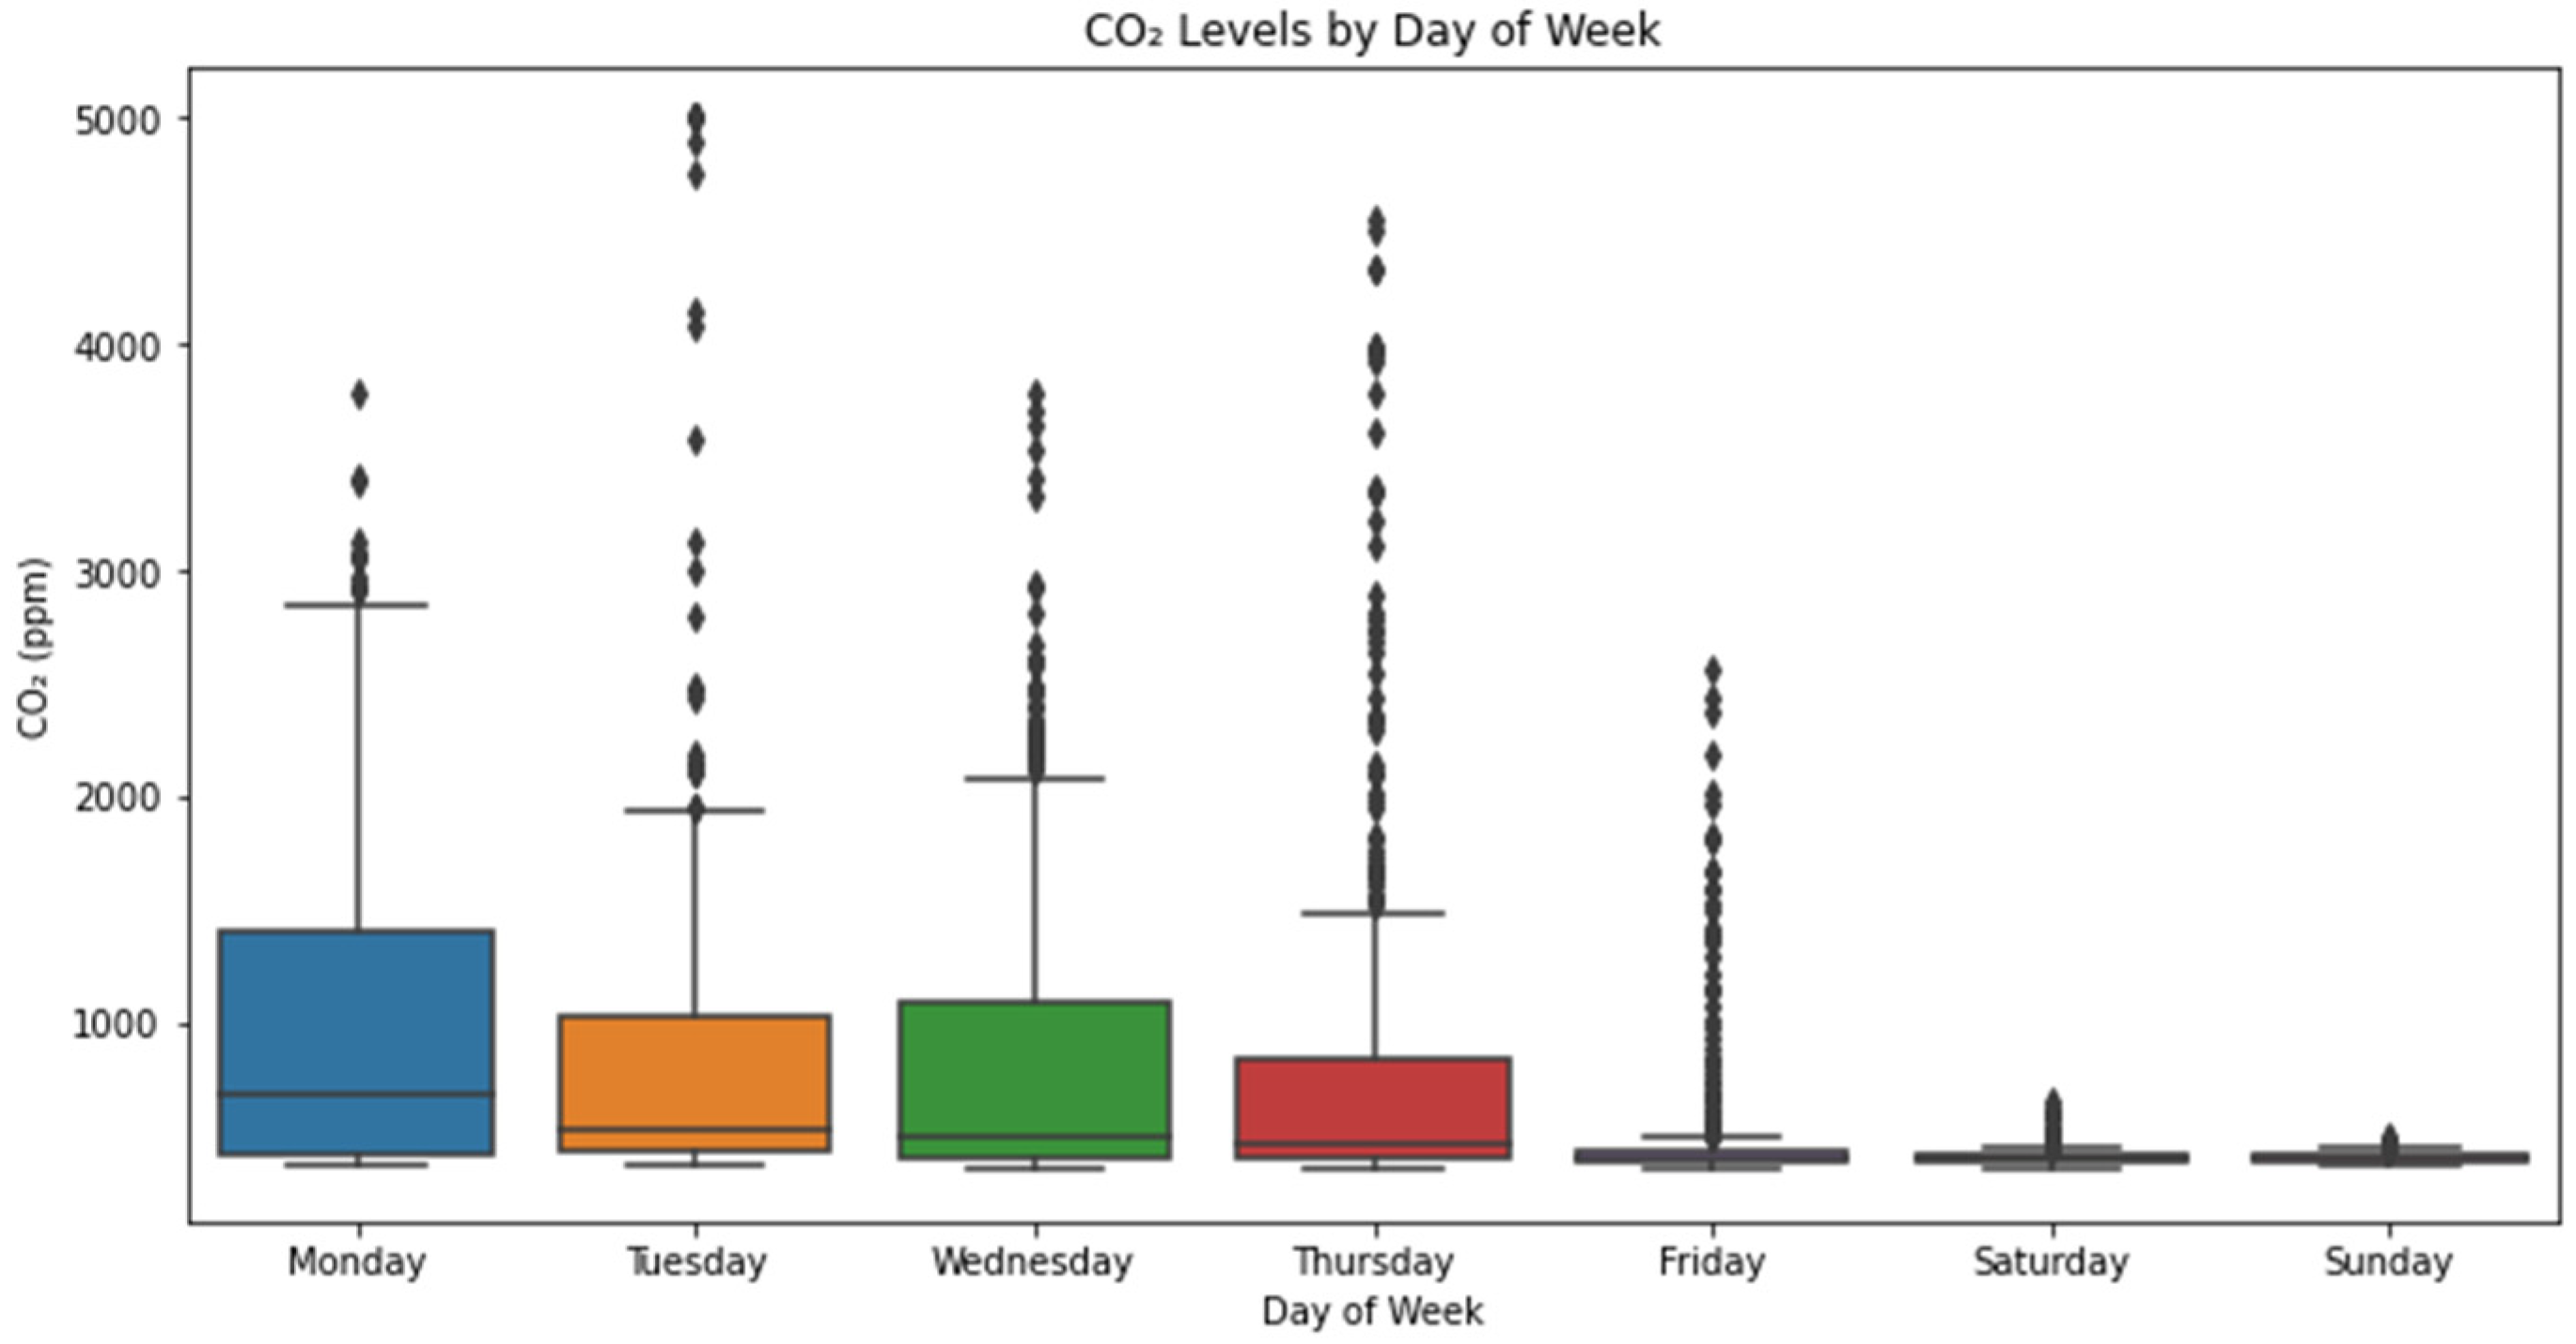
Figure 4 further confirms this, showing that Tuesdays and Wednesdays are the busiest days, whereas Mondays and Fridays see over 50% lower occupancy. The weekend patterns suggest minimal laboratory usage, as indicated by stable and low CO
2 levels.
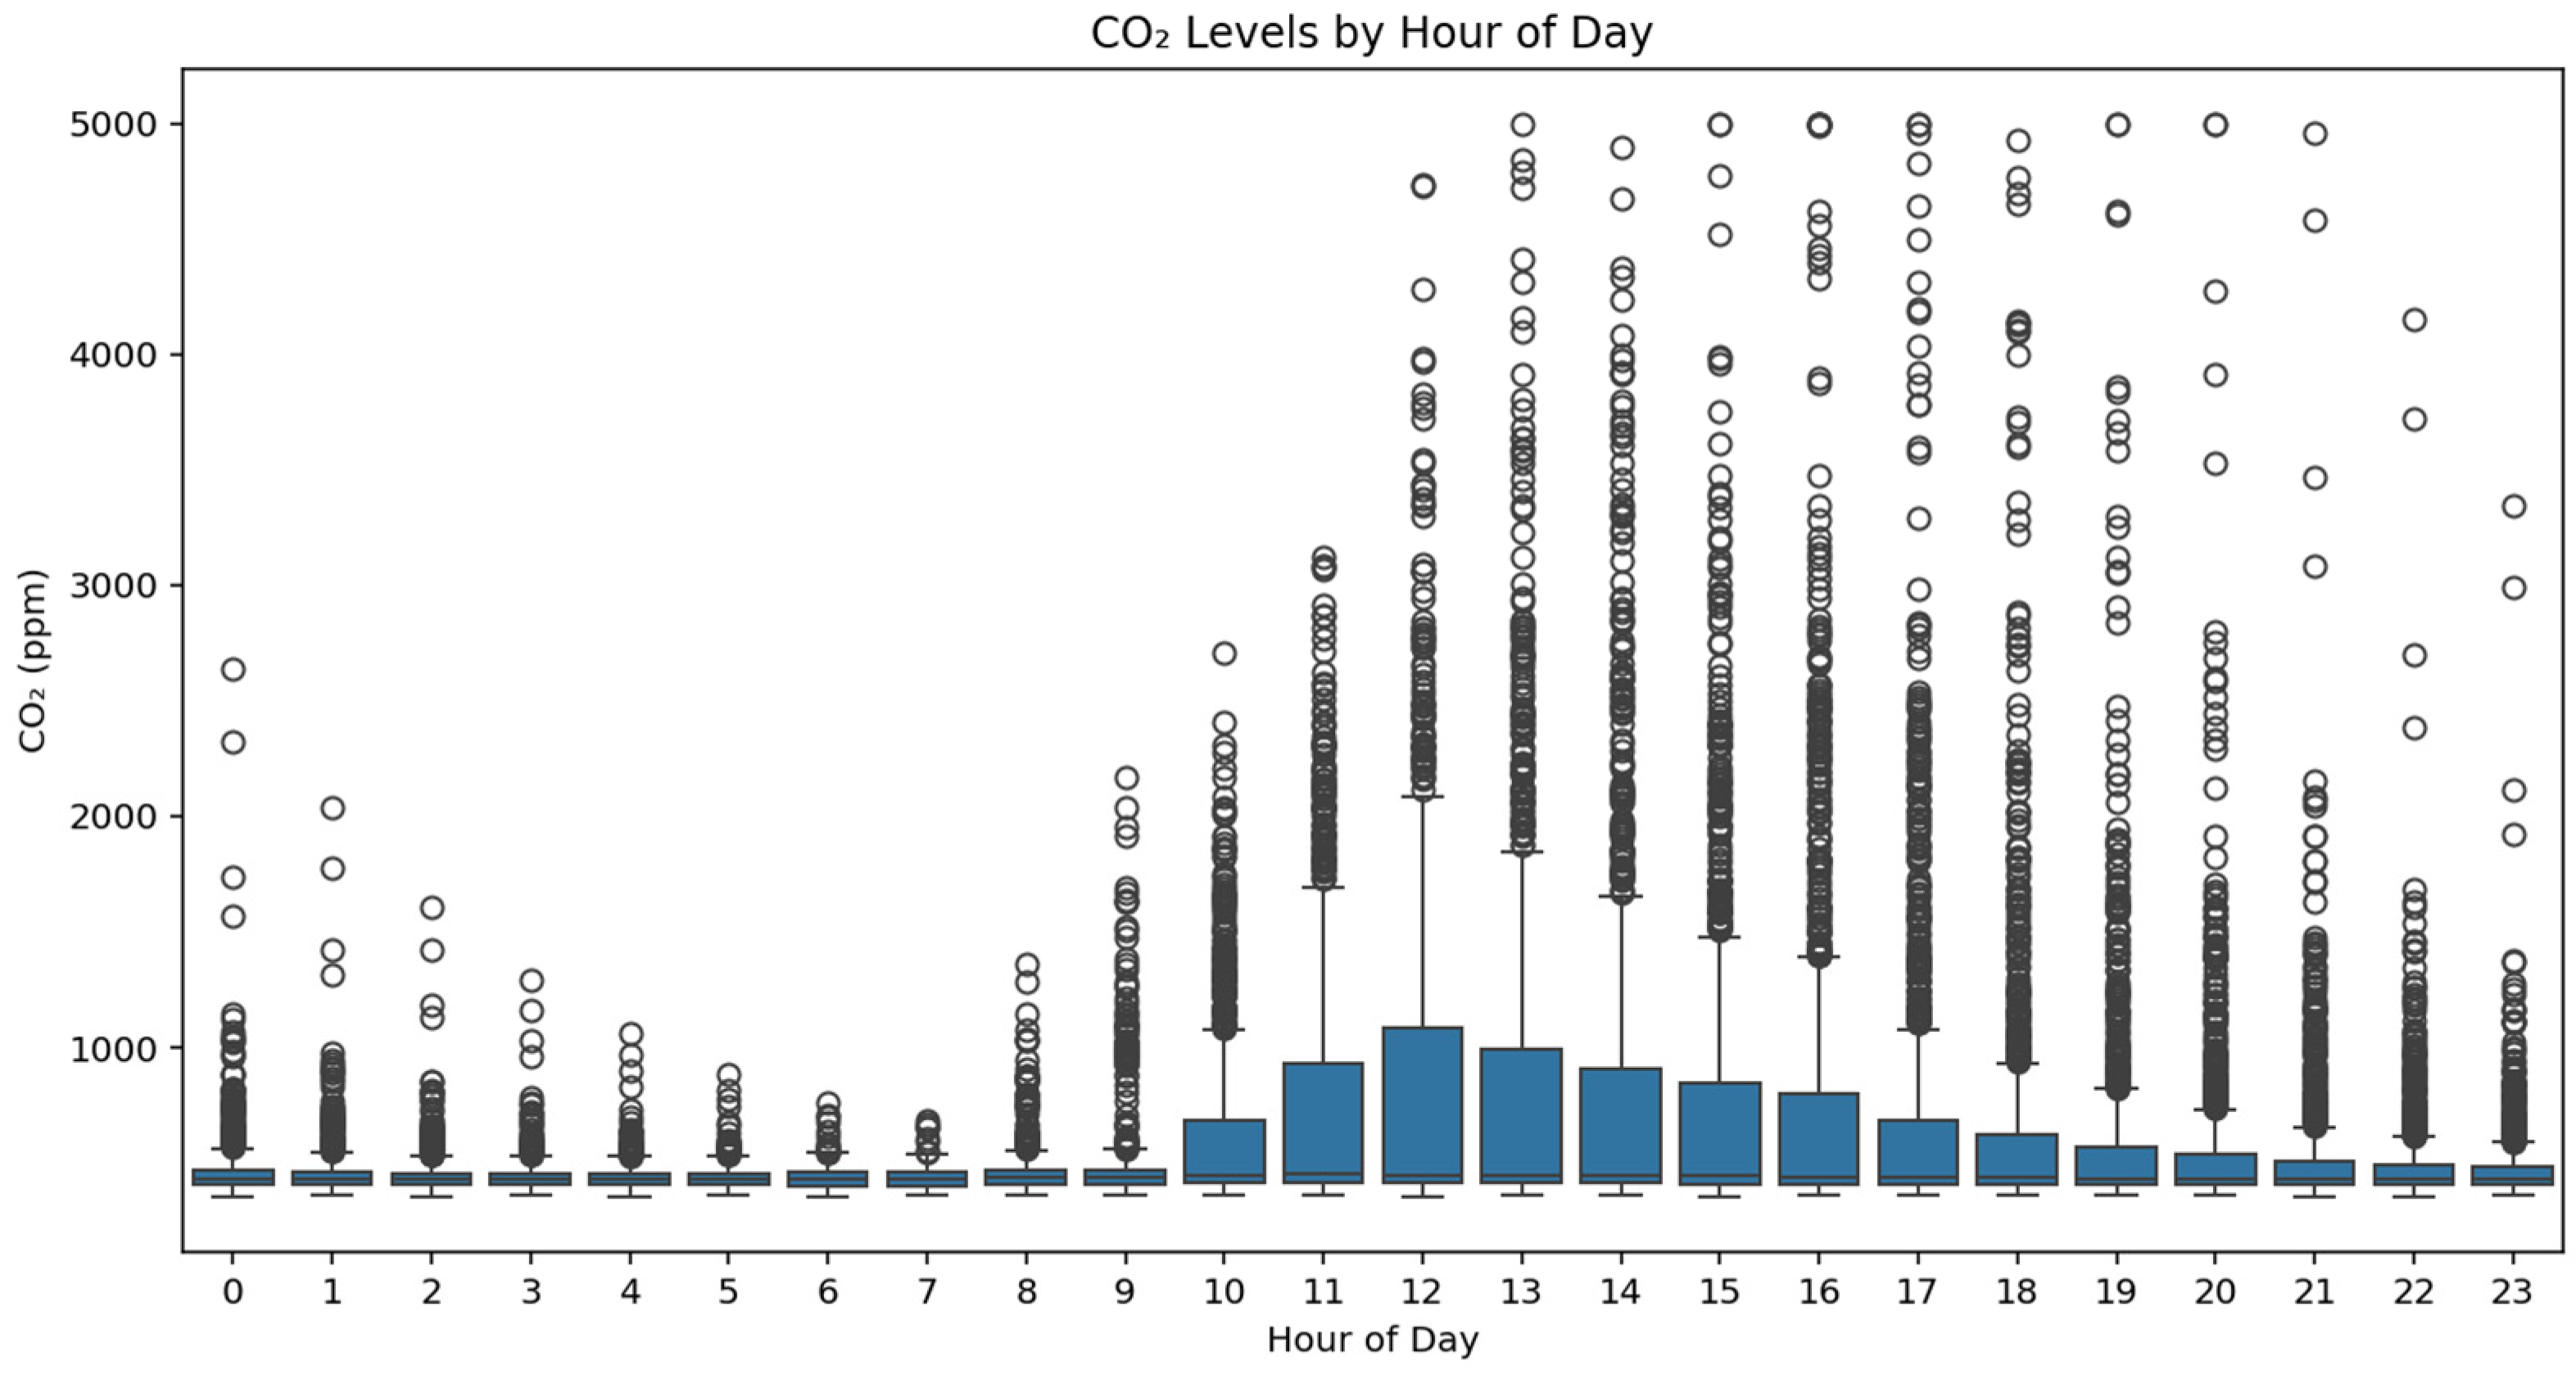
Figure 5 reveals peak occupancy between 11:00–14:00, with the highest CO
2 concentrations observed at 12:00. The sharp variations at this time likely result from increased people flow and the inertia of CO
2 accumulation from the morning period. Our measurements were not disturbed by the ventilation and air conditioning systems. The lowest recorded CO
2 levels occur at 07:00, reflecting the unoccupied state of the laboratory before work hours.
Figure 6,
Figure 7 and
Figure 8 provide further validation of the model’s accuracy in predicting occupancy.
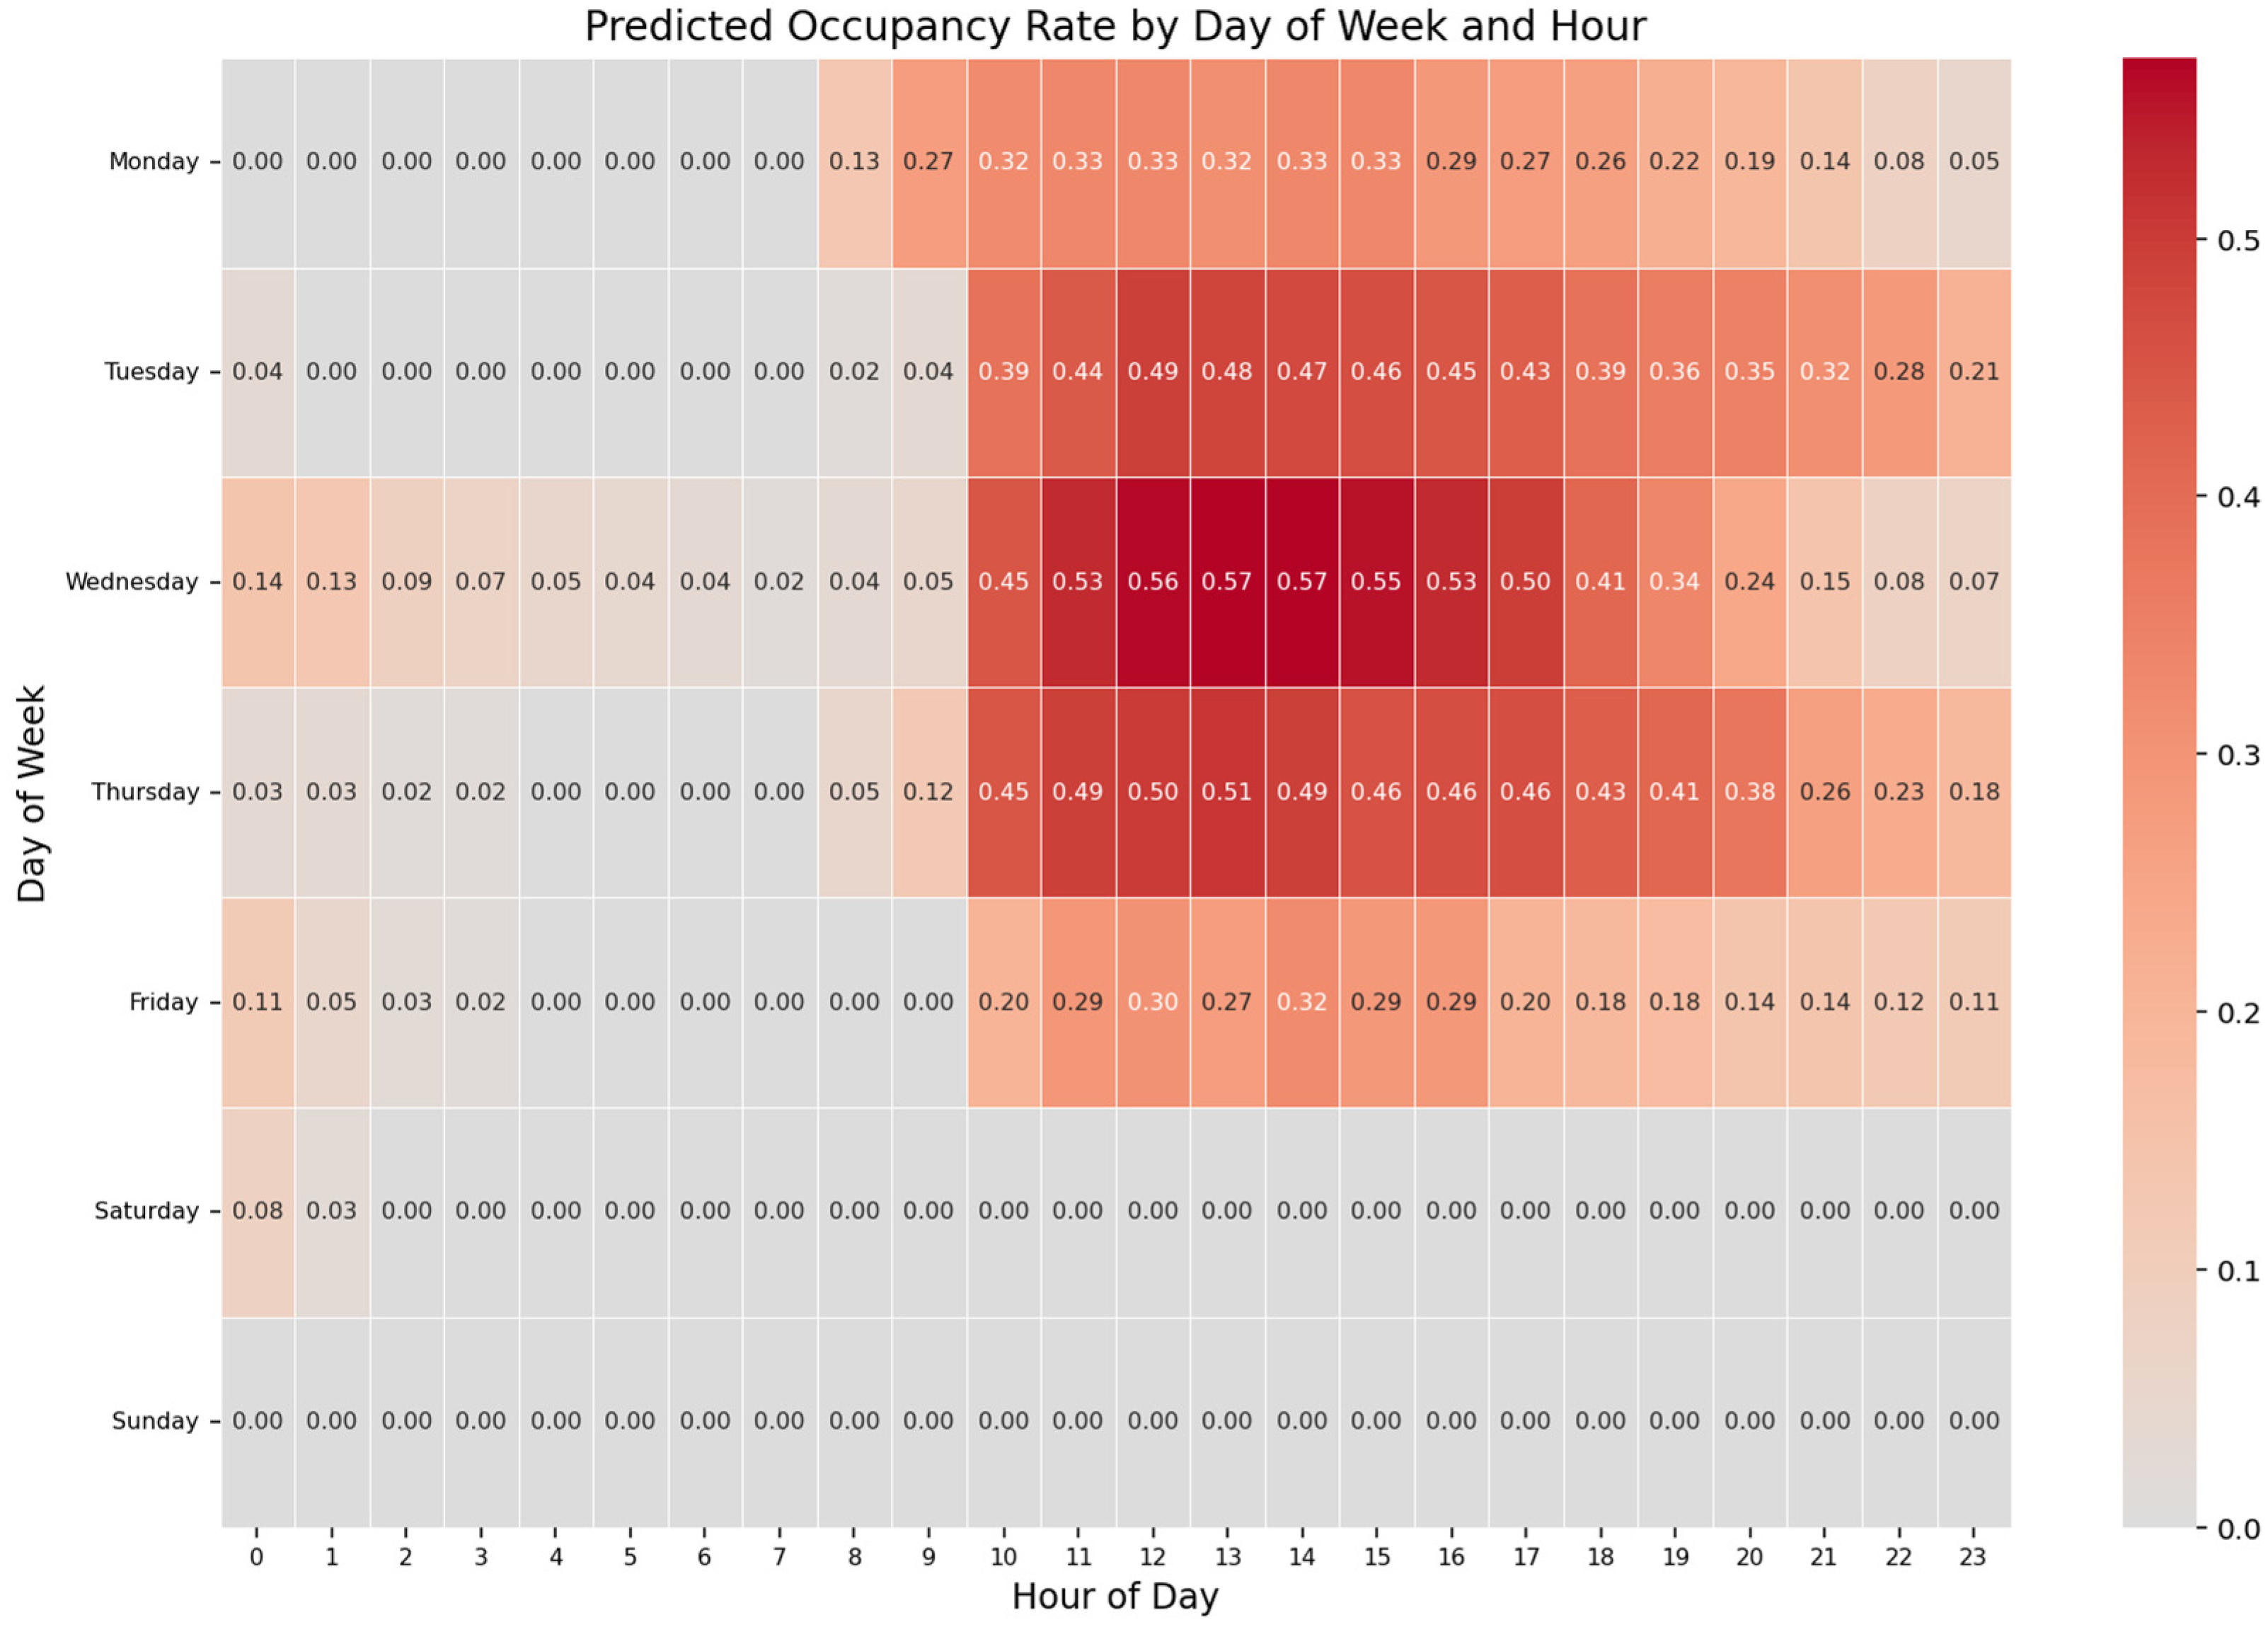
Figure 6 shows that actual occupancy is concentrated between 09:00 and 18:00, aligning with typical work hours.
Figure 7 demonstrates that the predicted occupancy rate closely matches the actual occupancy trends, highlighting the model’s reliability.
Figure 8 reveals minor discrepancies, particularly on Wednesday at 14:00 and Thursday at 20:00, though overall deviations remain minimal. These findings reinforce the robustness of the model while suggesting areas for improvement in capturing subtle occupancy variations during specific time slots.
We investigated two model variants: a short-term model and a long-term model. We found that developing a reliable model was not possible with a dataset smaller than two months. In this specific case, the short-term model outperformed the long-term model, primarily due to the regular weekly occupancy of the laboratory. This was shown in
Figure 9 and
Figure 10. The data also suggest that, in some cases, short-term predictions can be more accurate than long-term predictions due to holidays, vacations, and breaks that disrupt the weekly occupancy cycle. However, in terms of overall results, the short-term model is prone to bias. For example, we observed periods with lower occupancy on Fridays (
Figure 11) that disrupt the model’s predictions, which may not hold true in other contexts, such as the summer semester. In such cases, the stability of the long-term model is preferable. Future research could explore hybrid models that integrate the advantages of both short-term and long-term approaches.
A primary limitation of our research is the lack of investigation surrounding the opening of windows and doors, which would significantly influence both the results and model performance. Ventilation typically occurs every 90 min, during 15 min breaks. Academic teachers generally do not open windows during classes due to excessive noise from the street. Our findings revealed that indoor air quality in the laboratory was often suboptimal, particularly after extended class sessions. In addition, the data labeling process was prone to errors. Furthermore, the model does not account for the inertia of CO2 level measurements, which further affects the outcomes. Although heatmaps generally indicate higher occupancy levels during later hours compared to morning hours, this trend may be influenced by the measurement inertia.
An alternative solution to the presented approach for occupancy estimation is camera-based, as it directly captures the presence of individuals [
22,
23]. However, significant drawbacks make it less practical in certain scenarios. These include higher energy requirements, the need for precise camera placement, susceptibility to lighting interference, and privacy concerns. Unlike the CO
2-based approach presented in this study, which preserves privacy, camera-based methods are not feasible for privacy-sensitive applications.
Nikolaos Schizas et al. [
24], in their survey, explored a Tiny Machine Learning (TinyML) paradigm in the areas of hardware, software, and algorithms designed to process sensor data on ultra-low-power devices. They identified key obstacles and outlined future directions for TinyML research. They provided a comprehensive list of existing TinyML-based toolkits for training in various TinyML application areas. The TinyML concept could be adopted in this work, as the design of our proposed algorithm can be adapted to machine learning-supported processing devices. However, this approach requires adjusting the entire processing pipeline to accommodate the limitations and constraints of such a target device. Our system is designed with a fully automated workflow for scalability: we developed a daemon that continuously monitors the API status and updates the database file automatically. Our proposed server-based architecture supports rapid deployment; new model versions can be deployed on our processing server within minutes, enabling on-the-fly retraining.
Future research could focus on incorporating additional environmental parameters, such as humidity and temperature, to enhance predictive accuracy, as well as deploying the model across diverse settings to assess its generalizability. This approach not only advances occupancy estimation but also contributes to broader applications in building management, security, and energy optimization.


