Article

OR-MTL: A Robust Ordinal Regression Multi-Task Learning Framework for Partial Discharge Diagnosis in Gas-Insulated Switchgear

College of Electrical and Power Engineering, Taiyuan University of Technology, Taiyuan 030024, China
*
Author to whom correspondence should be addressed.
Electronics 2025, 14(7), 1262; https://doi.org/10.3390/electronics14071262
Submission received: 6 March 2025 / Revised: 20 March 2025 / Accepted: 22 March 2025 / Published: 23 March 2025

Abstract

:
This paper proposes a novel Ordinal Regression Multi-Task Learning (OR-MTL) framework to address challenges in multi-task diagnosis of PD in Gas-Insulated Switchgear (GIS). GIS PD diagnosis typically involves tasks such as discharge-type identification and severity assessment, which is essentially an ordinal regression problem facing challenges such as high label noise and inconsistent ranking of prediction outcomes. To address these challenges, the OR-MTL framework introduces two key innovations: a dynamic task-weighting strategy based on excess risk estimation, which mitigates the negative impact of label noise on multi-task learning weight allocation, and an ordinal regression loss function based on conditional probability, which ensures consistent prediction ranking through conditional probability chains. Experiments on GIS PD datasets demonstrate that the excess risk-based task-weighting strategy exhibits superior robustness compared to traditional methods in high-noise environments, while the proposed ranking consistency loss function significantly improves the accuracy of severity assessment and reduces errors. Ablation studies further validate the effectiveness of the complete OR-MTL framework. This research not only provides an efficient solution for GIS PD diagnosis but also offers new insights and methodologies for multi-task learning involving ordinal regression tasks.

1. Introduction

Gas-Insulated Switchgear (GIS) is widely utilized in modern power systems due to its high reliability and compact structure [1]. However, partial discharge (PD) phenomena within GIS often indicate potential insulation defects [2], and, if not promptly detected and diagnosed, can lead to severe equipment failures [3]. Therefore, accurate GIS PD diagnosis is of paramount importance for ensuring the safe and stable operation of power grids.
Currently, data-driven GIS PD diagnostic methods have become a prominent research focus. In the field of GIS PD diagnosis, type identification is one of the most fundamental and critical tasks. To accurately identify different types of PD signals, researchers have extensively explored deep learning techniques and proposed various innovative approaches. For instance, early studies attempted to classify PD patterns using Deep Belief Networks (DBNs) [4]. With the continuous advancement of deep learning technology, researchers have introduced more advanced network architectures, such as Residual Networks (ResNets) [5,6] and DenseNet models [7], combined with techniques like transfer learning [8,9] and knowledge graphs [5], to enhance the generalization ability of models in small-sample and complex environments. Furthermore, novel deep learning models, such as Generative Adversarial Networks (GANs) [6,8] and capsule networks [9], have also been applied to PD-type identification, aiming for superior performance in feature extraction and pattern classification. These research efforts have significantly improved the accuracy and robustness of GIS PD-type identification, laying a foundation for equipment condition assessment.
Severity assessment is another crucial aspect of GIS PD diagnosis and directly impacts the effectiveness of equipment maintenance decisions. To more precisely assess the severity of PD, researchers have begun to explore more diverse methodologies. For example, some studies have attempted to utilize semantic analysis techniques [10], integrating structured and unstructured text information to comprehensively evaluate PD ultra-high-frequency signals. Deep learning models, such as Stacked Sparse Autoencoders (SSAEs) [11], have also been applied to PD severity assessment, aiming to automatically extract effective features from complex data. In addition, feature selection algorithms [12] and methods combining Long Short-Term Memory (LSTM) networks with ensemble learning [13] have been proposed to overcome the limitations of traditional methods in feature engineering and time-series data processing and achieve more reliable severity assessment.
However, the aforementioned studies largely treat type identification and severity assessment as independent tasks, overlooking the potential intrinsic connections between them and the performance gains that joint analysis could offer. The rise of multi-task learning methods [14] provides a new perspective for addressing this issue. Multi-task learning can simultaneously train models for multiple related tasks, improving learning efficiency and generalization ability through shared representations and knowledge transfer, thereby achieving superior diagnostic performance under limited data conditions. Recent applications in GIS PD diagnosis have explored MTL networks integrated with cutting-edge technologies such as edge computing [15], subdomain adaptation [16], and digital twins [17] to develop intelligent and efficient condition assessment frameworks. Nevertheless, existing research utilizing multi-task learning for GIS PD diagnosis has paid insufficient attention to the ordinal regression nature of the severity assessment task.
Ordinal regression [18] refers to multi-classification tasks where there is a natural order among the categories. Multi-task ordinal regression methods closely related to this research have demonstrated unique advantages and potential in other fields. For instance, Gao et al. [19] viewed multi-location spatial event scale prediction as a multi-task ordinal regression problem, imposing similar event scale patterns on spatially closer tasks. Wang et al. [20] modeled multiple ordinal regression tasks through structured regularization terms and learned a series of thresholds to partition ordered categories. Zhao et al. [21] applied ordinal multi-task learning to image analysis tasks, improving segmentation performance by explicitly modeling the hierarchical relationships among object parts. Xiao et al. [22] focused on adaptively learning weights for different ordinal regression tasks to enhance accuracy while better understanding the relationships between tasks. These studies demonstrate that multi-task ordinal regression methods offer significant advantages in handling tasks with inherent hierarchical relationships.
Despite the progress made in multi-task ordinal regression problems, two key challenges remain in developing effective frameworks for GIS PD diagnosis. First, severity assessment is essentially an ordinal regression problem that typically contains more label noise due to subjective annotation and the absence of well-defined quantitative boundaries between adjacent severity levels. Existing MTL methods that dynamically adjust task weights often rely on loss magnitude to measure task difficulty. However, this approach is susceptible to high label noise, as noisy tasks tend to have higher losses, leading to over-allocation of weights and reduced overall performance. Second, maintaining ranking consistency in severity prediction results is crucial. This implies that when decomposing the ordinal regression task into binary classification sub-tasks, the output probabilities from adjacent classifiers must exhibit monotonicity, reflecting the intrinsic order of the categories. Traditional regression or classification methods often fail to preserve these ranking relationships, leading to inconsistent prediction rankings and consequently affecting diagnostic accuracy.
As an example, GIS PD can originate from different types of insulation defects, such as metallic protrusions, floating electrodes, free metallic particles, and insulator gaps. To reflect the degree of insulation deterioration, PD is classified into three severity levels: initial, developing, and severe. Using multi-task learning for GIS PD diagnosis enables simultaneous type identification and severity assessment through shared representations. Considering that severity assessment is an ordinal regression task, it is crucial to overcome the impact of its label noise on multi-task weight allocation and maintain ranking consistency in its predictions.
To address these challenges, this paper proposes a novel multi-task learning framework—Ordinal Regression Multi-Task Learning (OR-MTL)—which integrates ranking consistency into severity assessment while dynamically adjusting task weights based on the excess risk of each task to enhance robustness against label noise. Our approach reconstructs the severity prediction task using a structured probability model with enforced monotonicity constraints to ensure ranking consistency. Additionally, we introduce a noise-robust task-weighting strategy based on excess risk estimation, which determines task priorities based on relative convergence progress rather than raw loss values. Through joint optimization of these components, OR-MTL achieves higher accuracy and stability in GIS PD diagnosis. The main contributions of this paper are summarized as follows:
  • A novel multi-task learning framework, known as OR-MTL, is proposed for simultaneous discharge-type identification and severity assessment in GIS PD diagnosis, explicitly incorporating the ordinal regression nature inherent to the severity assessment task;
  • A dynamic task-weighting strategy based on excess risk estimation is developed to mitigate the negative impact of label noise on other tasks within multi-task learning;
  • Ranking consistency is incorporated into severity assessment, ensuring that the severity predictions conform to objective physical principles and enhancing the reliability of the assessment results;
  • Extensive experiments on a GIS PD dataset demonstrate that OR-MTL outperforms existing methods in both type identification and severity assessment tasks, especially under noisy conditions.
The remainder of this paper is organized as follows. Section 2 details the excess risk-based dynamic task-weighting strategy. Section 3 formalizes the conditional probability-based ordinal regression loss. Section 4 presents the experimental configurations, dataset characteristics, and comparative results analysis. Section 5 concludes with future research directions.

2. Excess Risk-Based Task Weighting for GIS PD Diagnosis

In multi-task learning (MTL), balancing the optimization of multiple tasks is crucial for improving overall performance. Traditional methods often employ static or loss-based weighting strategies, which may assign higher weights to tasks with larger losses. However, this approach can be problematic when some tasks have high label noise, as these tasks typically exhibit larger losses and are consequently assigned excessively high weights, ultimately impacting overall model performance negatively.
Ordinal regression tasks, such as severity assessment, are particularly prone to substantial label noise due to the lack of clear quantitative boundaries between adjacent levels and the subjectivity inherent in the labeling process. Existing research on label noise [23,24] has successfully mitigated its impact on the noisy task itself to some extent, whereas this paper focuses on reducing the influence of label noise on other tasks within multi-task learning. To address this issue, this paper introduces a dynamic task-weighting strategy based on excess risk estimation [25], as outlined in Algorithm 1. This strategy prioritizes tasks based on their learnability rather than raw loss values. Excess risk quantifies the discrepancy between the current task performance and its optimal achievable performance, rendering it a robust metric for adjusting task weights in noisy environments.
Algorithm 1 Dynamic task weighting based on excess risk
  • Require: Model parameter learning rate η θ , task weight learning rate η w
  •     Initialize θ sh ( 1 ) , θ 1 ( 1 ) , θ 2 ( 1 ) and w k ( 1 ) = [ 0.5 , 0.5 ]
  •     for  t = 1 to epoch do
  •        for  T k = T 1 , T 2  do
  •          Calculate task losses k ( t )
  •          Calculate gradients g k ( t ) = θ sh , θ k k ( t )
  •          Estimate Hessian matrix H k ( t ) using Equation (10)
  •          Estimate excess risk E k ( t ) using Equation (9)
  •          Update task-specific parameters θ k ( t + 1 ) θ k ( t ) η θ θ k k ( t )
  •        end for
  •        Update task weights w k ( t + 1 ) using Equation (13)
  •        Calculate weighted total loss ( t ) = k w k ( t + 1 ) k ( t )
  •        Update shared parameters θ sh ( t + 1 ) θ sh ( t ) η θ θ sh ( t )
  •     end for

2.1. Multi-Task Learning

The GIS PD multi-task diagnosis investigated in this paper includes two tasks: discharge-type identification ( T 1 ) and severity assessment ( T 2 ). The given dataset is defined as D = { x ( n ) , y 1 ( n ) , y 2 ( n ) } n = 1 N , containing N training samples, where x ( n ) X represents the input signal of the n-th sample (only single-input scenarios are considered in this study, i.e., all tasks share the same input). y 1 ( n ) Y 1 and y 2 ( n ) Y 2 represent the labels of the n-th sample for the two tasks, respectively. Each task has a loss function, denoted as L 1 and L 2 . The objective of multi-task learning is to minimize the total loss function L tot , which is the weighted sum of the loss functions for each task, expressed as
L tot = k = 1 2 w k L k ( θ sh , θ k ) ,
where w k represents the weight of the loss function for task T k , typically determined by the importance or difficulty of the task; θ sh represents the parameters shared among tasks in the multi-task model; and θ k represents the task-specific model parameters for the k-th task.

2.2. Excess Risk

Consider input data x X and its label y Y from distribution D , with loss function L. The expected loss (risk) of a prediction model θ : X Y is defined as [26]
( θ ) = E ( x , y ) D [ L ( θ ( x ) , y ) ] .
Let θ H = arg min θ H E ( x , y ) D [ L ( θ ( x ) , y ) ] be the optimal model within the hypothesis space H , and let θ Bayes = arg min θ E ( x , y ) D [ L ( θ ( x ) , y ) ] be the optimal solution among all possible models, i.e., the Bayes optimal model. The expected loss of θ can be further decomposed into
( θ ) = e est + e apr + e Bayes ,
where e est = ( θ ) ( θ H ) is the estimation error; e apr = ( θ H ) ( θ Bayes ) is the approximation error; and e Bayes = ( θ Bayes ) is the Bayes error.
When the hypothesis space H is sufficiently expressive, the approximation error e apr asymptotically approaches zero. In contrast, the Bayes error e Bayes is irreducible, stemming from the inherent randomness in data generation processes (e.g., label noise). This property, intrinsic to the dataset, leads to an increase in e Bayes under high label noise. Traditional risk metrics (e.g., ( θ ) ) conflate reducible and irreducible errors, rendering them unreliable for performance evaluation in noisy settings.
To address this limitation, excess risk emerges as a more principled metric. It quantifies the discrepancy between the model’s current risk and the theoretically achievable minimum within H , thereby isolating reducible errors from e Bayes . In this study, where the GIS PD diagnosis model structure fixes θ to reside in H , excess risk E is defined as
E ( θ ) = e est = ( θ ) ( θ H ) .
Excess risk measures the distance between the model’s risk and the optimal achievable risk within H , effectively filtering out label noise effects. Since dataset quality (and thus e Bayes ) is often uncontrollable, E serves as a robust performance metric, particularly under label noise. By focusing exclusively on improvable risk components, it serves as a reliable indicator of model efficacy. However, direct computation of E is generally infeasible due to the inaccessibility of θ H , necessitating specialized estimation methods.

2.3. Excess Risk Estimation Based on Taylor Approximation

For notational simplicity, we denote θ k as the combined parameters [ θ sh , θ k ] in subsequent derivations. Since directly computing the risk of the optimal attainable model ( k ( θ k ) ) is infeasible, this work employs a local optimality approximation via a second-order Taylor expansion. For task-specific risk k , assuming continuous second-order derivatives, the risk at parameter θ k ( t ) is expanded as
k ( θ k ) = k ( θ k ( t ) ) + ( θ k θ k ( t ) ) g k ( t ) + 1 2 ( θ k θ k ( t ) ) H k ( t ) ( θ k θ k ( t ) ) + o ( θ k θ k ( t ) 2 ) ,
where g k ( t ) is the gradient of k at θ k ( t ) ; H k ( t ) is the Hessian matrix of k at θ k ( t ) ; and o ( | | θ k θ k ( t ) | | 2 ) is the Peano remainder term of the Taylor expansion. Substituting the locally optimal parameters θ k into Equation (5) and neglecting the remainder term, the excess risk can be estimated as
E k ( θ k ( t ) ) k ( θ k ( t ) ) k ( θ k ) ( θ k ( t ) θ k ) g k ( t ) 1 2 ( θ k ( t ) θ k ) H k ( t ) ( θ k ( t ) θ k ) .
To resolve the parameter difference ( θ k ( t ) θ k ) , we perform a first-order Taylor expansion of the gradient k ( θ k ) at θ k ( t ) :
k ( θ k ) = g k ( t ) + H k ( t ) ( θ k θ k ( t ) ) + o ( θ k θ k ( t ) ) .
Substituting θ k into Equation (7) and leveraging the local optimality condition k ( θ k ) = 0 (with remainder terms neglected), we obtain
θ k ( t ) θ k H k ( t ) 1 g k ( t ) .
Substituting Equation (8) into Equation (6) yields the simplified excess risk estimator:
E k ( θ k ( t ) ) g k ( t ) H k ( t ) 1 g k ( t ) 1 2 g k ( t ) H k ( t ) 1 H k ( t ) H k ( t ) 1 g k ( t ) = 1 2 g k ( t ) H k ( t ) 1 g k ( t ) .
For computational efficiency, the constant coefficient 1 / 2 
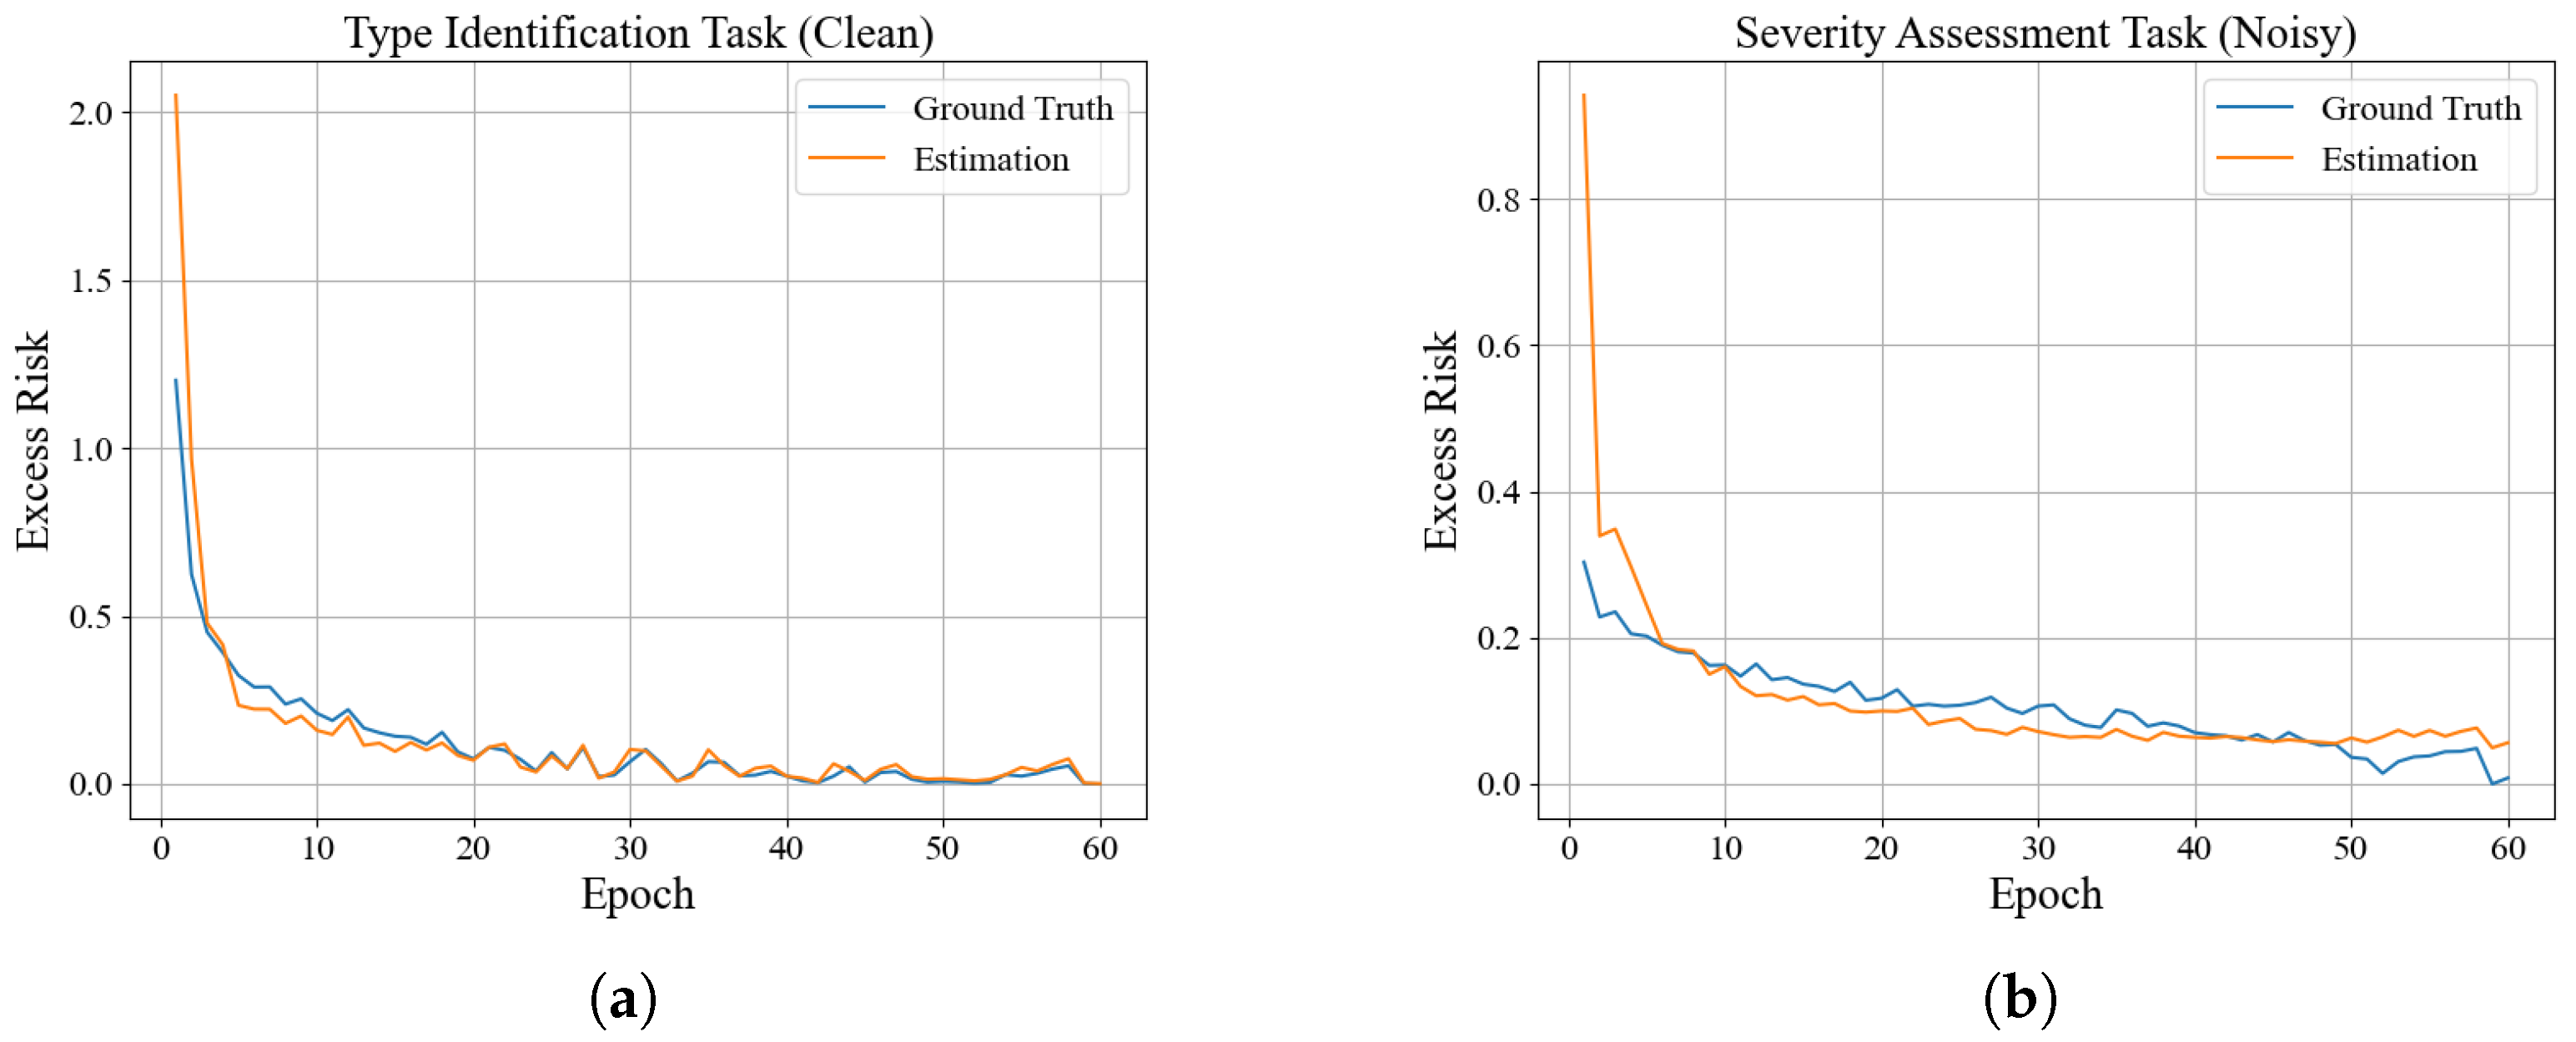
may be omitted. In the derivation from Equations (6)–(9), the Taylor expansion approximation was employed. When the parameters approach the local optimum, higher-order terms of the loss function can be reasonably neglected. The validity of this approximation naturally improves as training proceeds and parameters approach their local optimal values. Additionally, the experiments in Section 4.3.1 empirically demonstrate that this approximation remains accurate and effective.
To further reduce computational overhead, we adopt a diagonal approximation of the empirical Fisher information matrix [27] for Hessian estimation. This approach constructs a diagonal matrix by accumulating outer products of historical gradients. Specifically, let g k ( τ ) denote the gradient of task T k at training step τ . The Hessian approximation at step t is given by
H k ( t ) diag τ = 1 t g k ( τ ) g k ( τ ) 1 2 ,
where diag ( · ) extracts the main diagonal elements to form a diagonal matrix. This approximation achieves O ( d ) computational complexity (with d being parameter dimensionality), ensuring practical feasibility for large-scale models. Although the diagonal approximation of the Hessian matrix may introduce a certain degree of accuracy loss, it significantly improves computational efficiency. Considering that our primary goal is to allocate task weights based on relative excess risk rather than obtaining precise Hessian estimations, the potential accuracy trade-off involved in this approximation is practically acceptable.

2.4. Exponential Gradient-Based Weight Update

Following the estimation of excess risk, the task weights must be systematically updated. To establish an optimal task-weighting strategy, the multi-task learning framework for GIS PD diagnosis is formulated as a minimax optimization problem:
min θ sh , θ 1 , θ 2 max w Δ 1 k = 1 2 w k E k ( θ sh , θ k ) ,
where w denotes the task weight vector and Δ 1 represents the 1-dimensional probability simplex, enforcing non-negative weights that sum to unity.
While the one-hot solution for w in Equation (11) maximizes the weighted excess risk, it exhibits instability due to its exclusion of gradient information from auxiliary tasks, which potentially compromises training efficiency. To address this limitation, online mirror descent (OMD) [28] is implemented with KL divergence regularization to design the weight update rule. Following the iterative OMD framework, the weight vector is updated by solving
w ( t + 1 ) = arg min w Δ 1 η w w E ( t ) , w + D KL ( w w ( t ) ) ,
where η w is the learning rate for weights, w E ( t ) = [ E 1 ( θ sh , θ 1 ) , E 2 ( θ sh , θ 2 ) ] denotes the gradient of the weighted excess risk with respect to w, · , · is the inner product operator, and D KL ( α β ) = i α i ln ( α i / β i ) defines the KL divergence. Solving this using Lagrange multipliers yields the closed-form update:
w k ( t + 1 ) = w k ( t ) exp η w E k ( θ sh ( t ) , θ k ( t ) ) l = 1 2 w l ( t ) exp η w E l ( θ sh ( t ) , θ l ( t ) ) ,
where the denominator acts as a normalization factor to preserve the Δ 1 simplex constraint. This exponential weighting mechanism dynamically prioritizes tasks with elevated excess risks, thereby mitigating the adverse impact of label noise on weight allocation.

3. Severity Assessment Loss Function Based on Conditional Probability Ordinal Regression

In GIS PD diagnosis, severity assessment is an ordinal regression problem, where severity levels possess a natural order (e.g., normal, initial, developing, and severe). Unlike traditional classification methods, ordinal regression requires maintaining ranking consistency in prediction results (described in detail in Section 3.1) to ensure the reasonableness of predictions. Failure to maintain this ordering affects the reliability of prediction results and may lead to reduced prediction accuracy. Recent solutions for ensuring ranking consistency [29,30] typically require modifications to neural network structures. In contrast, this paper explores a loss function that inherently ensures ranking consistency and can be directly applied to any neural network architecture. Therefore, this paper adopts ordinal regression based on conditional probability [31] to ensure ranking consistency in severity assessment predictions, as shown in Algorithm 2.
Algorithm 2 Conditional probability-based ordinal regression loss function
  • Require: Batch sample probability predictions b ( x ) , batch sample labels y 2
  •     Initialize loss L 2 = 0 , sample count S = 0
  •     for  j = 1 to 3 do
  •        Select relevant samples for current binary classification S j ( n | y 2 ( n ) > r j 1 )
  •        if  | S j | > 0  then
  •          Convert binary labels y 2 [ j ] { I { y 2 ( n ) > r j } | n S j }
  •          Select relevant predictions for current binary classification b j ( x ( n ) ) b ( x ) [ S j , j ]
  •          Calculate current binary classification loss function
  •           L 2 [ j ] = n ( y 2 [ j ] log ( b j ( x ( n ) ) ) + ( 1 y 2 [ j ] ) log ( 1 b j ( x ( n ) ) ) )
  •           L 2 L 2 + L 2 [ j ]
  •           S S + | S j |
  •        end if
  •     end for
  •     return  L 2 / S

3.1. Ranking Consistency in Severity Assessment

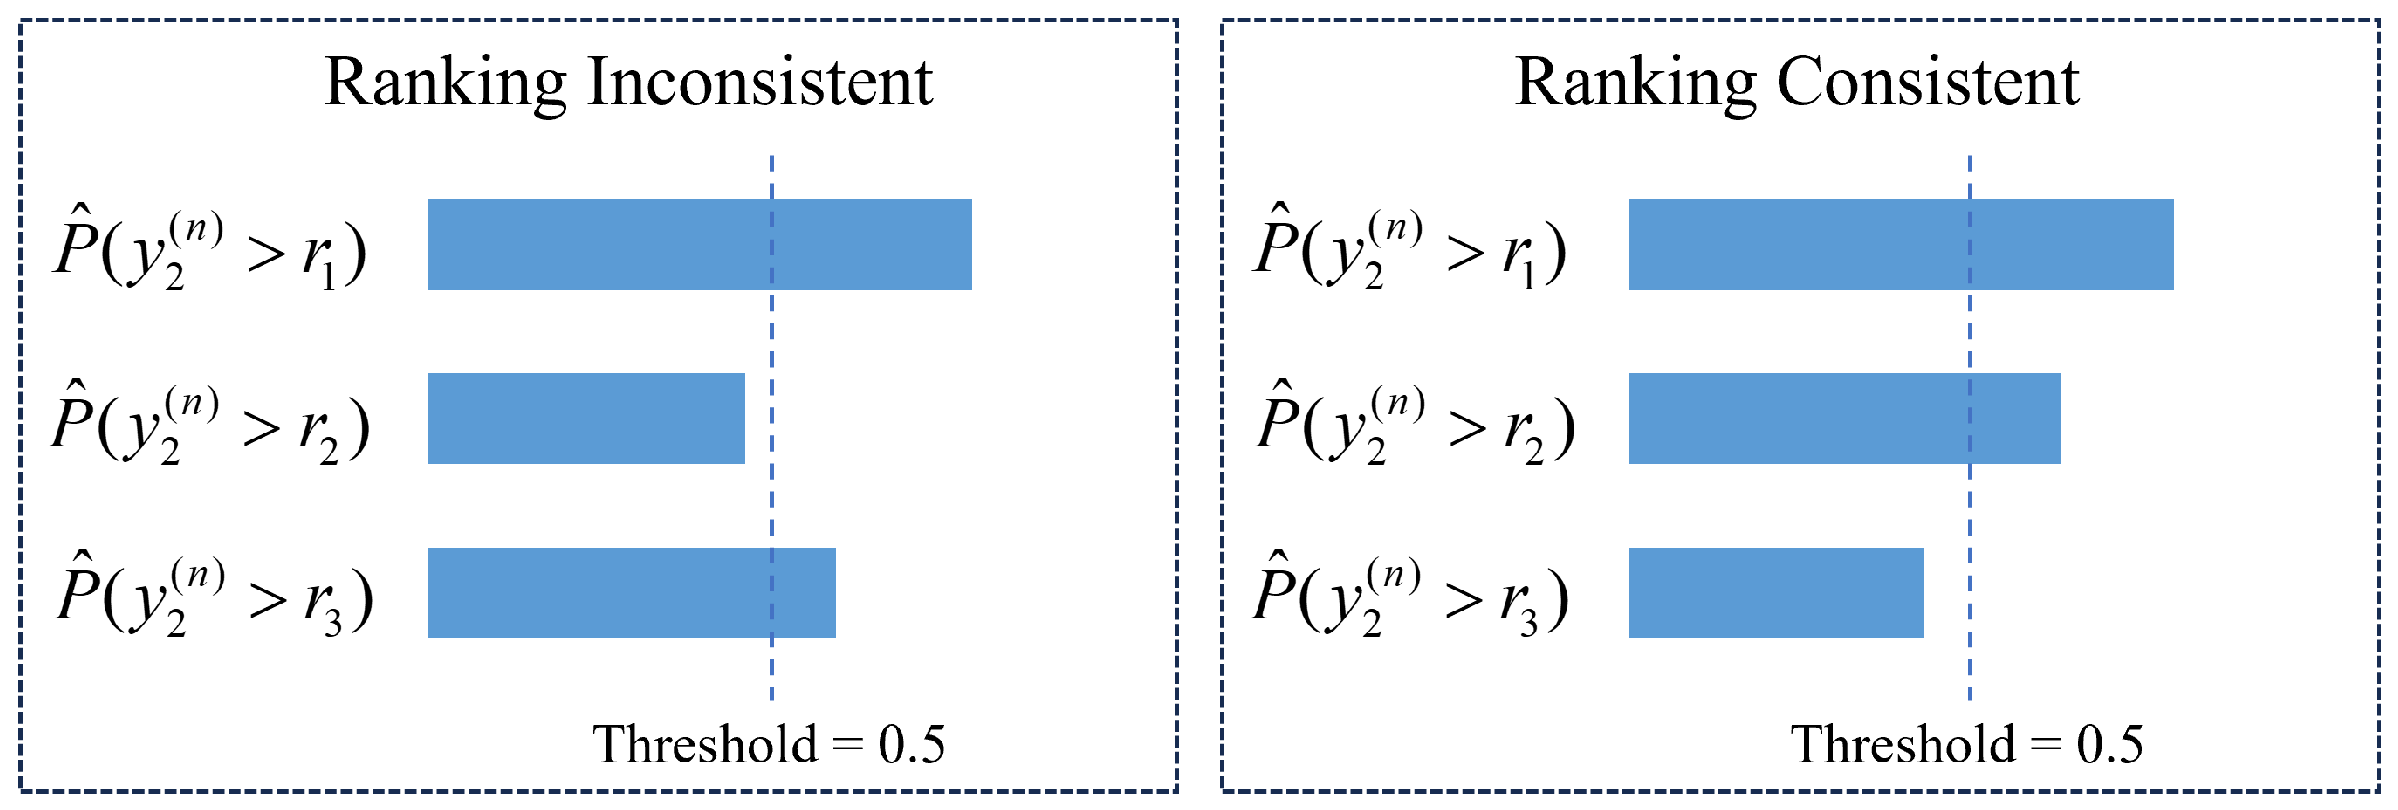
The severity levels of GIS PD are categorized into four distinct classes: “normal” ( r 1 ), “initial” ( r 2 ), “developing” ( r 3 ), and “severe” ( r 4 ), formally represented as y 2 ( n ) Y 2 = { r i } i = 1 4 . Unlike conventional multi-class classification, severity assessment constitutes an ordinal regression problem, where explicit partial ordering relations exist between classes: r 1 r 2 r 3 r 4 , reflecting the progressive escalation of discharge severity.
Traditional multi-class classification approaches fail to capture these ordinal relationships and assign uniform misclassification costs across all errors (e.g., penalizing misclassification of r 4 as r 3 equivalently to r 1 ), which contradicts practical diagnostic requirements. The mainstream approach to handling ordinal regression problems is based on the extended binary classification framework [32], which decomposes an I-class ordinal regression problem ( I = 4 in our case) into I 1 binary classification sub-tasks. Specifically, the ordinal labels are reformulated into binary labels y 2 ( n ) [ j ] { 0 , 1 } for j { 1 , 2 , 3 } . The predicted severity level y ^ 2 ( n ) = r i (where i { 1 , 2 , 3 , 4 } ) is determined by
i = 1 + j = 1 3 I P ^ ( y 2 ( n ) > r j ) > 0.5 ,
where P ^ ( y 2 ( n ) > r j ) [ 0 , 1 ] denotes the probabilistic output of the j-th binary classifier, indicating the likelihood that the sample’s severity exceeds r j , and I { · } represents the indicator function. Critically, this formulation inherently lacks ranking consistency guarantees—there exists no enforced monotonicity constraint ensuring that P ^ ( y 2 ( n ) > r 1 ) P ^ ( y 2 ( n ) > r 2 ) P ^ ( y 2 ( n ) > r 3 ) .
As illustrated in Figure 1, consider a PD sample with severity label r 3 (“developing”). Both consistent and inconsistent probability profiles may yield identical final predictions ( y ^ 2 ( n ) = r 3 ) through Equation (14). However, the inconsistent case (violating monotonicity) achieves correct classification merely by coincidence rather than reliable ordinal reasoning. This underscores the necessity of enforcing ranking consistency to ensure physically plausible and interpretable severity predictions, aligned with GIS insulation degradation patterns.

3.2. Conditional Probability Modeling

For the severity assessment task, given the dataset D 2 = { x ( n ) , y 2 ( n ) } n = 1 N , the ordinal severity labels y 2 ( n ) are extended into binary labels y 2 ( n ) [ j ] { 0 , 1 } , indicating whether the severity exceeds threshold r j ( j { 1 , 2 , 3 } ). While the OR-MTL framework similarly configures three outputs in its severity assessment branch to address these binary sub-tasks, conventional implementations fail to guarantee ranking consistency in predictions. To address this limitation, a structured conditional probability modeling approach is adopted to enforce ordinal constraints explicitly.
Specifically, the severity assessment branch estimates a sequence of conditional probabilities through a constrained training paradigm (detailed in Section 3.3, where the output of the j-th binary task b j ( x ( n ) ) corresponds to
b j ( x ( n ) ) = P ^ ( y 2 ( n ) > r 1 ) j = 1 , P ^ ( y 2 ( n ) > r j y 2 ( n ) > r j 1 ) j > 1 .
The conditional relationship { y 2 ( n ) > r j } { y 2 ( n ) > r j 1 } inherently reflects the physical reality that surpassing a higher severity threshold r j necessitates prior exceedance of its predecessor r j 1 . By applying the probabilistic chain rule, these conditional probabilities are transformed into joint probabilities:
P ^ ( y 2 ( n ) > r i ) = j = 1 i b j ( x ( n ) ) .
Given 0 b j ( x ( n ) ) 1 for all j, the following monotonicity property is analytically guaranteed:
P ^ ( y 2 ( n ) > r 1 ) P ^ ( y 2 ( n ) > r 2 ) P ^ ( y 2 ( n ) > r 3 ) .
This formulation ensures that the probability of exceeding higher severity thresholds decreases monotonically, thereby intrinsically preserving ranking consistency across all binary sub-tasks. The resulting predictions align with the ordinal structure of severity progression while enhancing model interpretability and diagnostic reliability.

3.3. Conditional Subset-Based Training and Prediction

The severity assessment branch of OR-MTL aims to estimate the base probability b 1 ( x ( n ) ) and conditional probabilities b 2 ( x ( n ) ) and b 3 ( x ( n ) ) . Estimating b 1 ( x ( n ) ) constitutes a standard binary classification task under the extended binary framework, utilizing binary labels y 2 ( n ) [ 1 ] . To estimate conditional probabilities such as P ^ ( y 2 ( n ) > r 2 y 2 ( n ) > r 1 ) , the model focuses exclusively on the subset of training data where y 2 ( n ) > r 1 . Consequently, when minimizing the binary cross-entropy loss over these conditional subsets, the output probabilities for each binary task inherently preserve their conditional probability interpretations.
To model the conditional probabilities defined in Equation (15), conditional training subsets are constructed to compute loss functions minimized via backpropagation. These subsets are derived from the original training set as follows:
S 1 : x ( n ) , y 2 ( n ) , n { 1 , , N } , S 2 : x ( n ) , y 2 ( n ) y 2 ( n ) > r 1 , S 3 : x ( n ) , y 2 ( n ) y 2 ( n ) > r 2 ,
where N = | S 1 | | S 2 | | S 3 | and | S j | denotes the cardinality of subset S j . Each subset S j (for j 2 ) contains only samples with severity levels exceeding r j 1 , ensuring the model learns sequential relationships between severity grades.
For training via backpropagation, the binary cross-entropy loss is adopted for each probability prediction unit b j ( x ( n ) ) :
L 2 [ j ] = 1 | S j | n S j I y 2 ( n ) > r j log b j ( x ( n ) ) + I y 2 ( n ) r j log 1 b j ( x ( n ) ) .
The total loss L 2 for the severity assessment task is formulated as a weighted sum:
L 2 = j = 1 3 λ j L 2 [ j ] , where λ j = | S j | | S 1 | + | S 2 | + | S 3 | .
Here, the sample size-driven adaptive weights λ j mitigate distribution imbalance caused by hierarchical subset construction through sample count normalization.
To predict the severity level r i ( n ) for the n-th sample, the rank index i ( n ) is computed by thresholding the product of conditional probabilities and summing binary indicators:
i ( n ) = 1 + j = 1 3 I m = 1 j b m ( x ( n ) ) > 0.5 .
Thus, the severity prediction for the n-th training sample is r i ( n ) .

4. Experiments and Analysis

4.1. Establishment of GIS PD Dataset

4.1.1. Data Acquisition

The GIS PD signals analyzed in this study were collected from a 220 kV GIS PD simulation platform, as illustrated in Figure 2. The platform retains the original GIS structure, including linear, L-shaped, and T-shaped compartments, and employs motorized telescopic rods to simulate insulation defects that induce PD. The experimental wiring schematic is shown in Figure 3. The key components of the platform are a 380 V/50 Hz AC power supply, a corona-free transformer with a rated voltage of 150 kV and a capacity of 30 kVA, a capacitive voltage divider (rated voltage 150 kV, capacitance 300 pF, and division ratio 1000:1), and a protective resistor of 10 k Ω .
Four types of insulation defects were modeled: metallic protrusions (MPs), floating electrodes (FEs), free metallic particles (FMPs), and insulator gaps (IGs). PD signals were captured using an XD5352 multi-channel PD detector (manufactured by Hangzhou Xihu Electronics Research Institute, Hangzhou, China) equipped with acoustic emission (AE) sensors and ultra-high-frequency (UHF) sensors. The key sensor parameters are summarized in Table 1. Upon detection by UHF sensors, the signals underwent envelope detection to extract signal envelopes, preserving the peak amplitude and phase characteristics of PD pulses while reducing signal frequency. This approach maintained measurement accuracy while alleviating sampling rate requirements for the PD detector. A calibrated current pulse PD detector was additionally employed to quantify apparent discharge magnitudes.
To simulate the gradual progression from incipient discharge to insulation breakdown, a step-up voltage application protocol was adopted. For each type of defect, the voltage at which PD first occurred was used as the initial voltage, which was then gradually increased until breakdown or near-breakdown. Each defect underwent nine voltage stages, with 30-minute durations per stage. During data acquisition, only one defect type was activated per experiment, and phase-resolved pulse sequence (PRPS) data from AE and UHF sensors were recorded. In this study, PRPS data from both AE and UHF sensors contained 64 power-frequency periods, with each period divided into 64 phases, resulting in 64 × 64 matrices for both sensor types. To comprehensively utilize PD detection data, we combined the AE and UHF data for each PD instance by stacking them into a 64 × 64 × 2 tensor, which served as the input sample for our model.
In this study, each sample was annotated with two distinct labels: defect type and severity level. Considering the inclusion of normal samples (without PD), there were five categories for defect type (including normal) and four levels for severity assessment (including normal). A total of 2500 PRPS datasets were collected, comprising 600 samples per defect type (four defects × 600 = 2400 samples) and 100 background noise samples (no PD conditions). Each defect category included 200 samples per severity level (excluding normal conditions). To facilitate robust machine learning model development, the dataset was partitioned into a training set containing 1625 labeled samples for model optimization and a test set containing 875 labeled samples for performance evaluation. This partitioning strategy ensures model generalizability and stability.

4.1.2. Severity Classification

Based on the severity classification standard for GIS PD proposed by the State Grid Corporation of China [33], the collected AE and UHF PRPS signals of PD were labeled as one of three severity levels: initial, developing, and severe. Severity labels were assigned according to apparent discharge magnitudes combined with field expert experience, rather than directly relying on AE/UHF signal characteristics. The classification criteria for different defect types under each severity level are detailed in Table 2, which describes the PD features across severity gradations and lists the corresponding voltage levels applied in this study.

4.2. Training and Evaluation

The deep learning models were trained on a server running Ubuntu 18.04, equipped with an Intel Xeon Platinum 8255C CPU and an NVIDIA RTX 3080 GPU. All implementations were developed using PyTorch 1.8.1. Since the focus of this study was not the base network architecture, all models used the same backbone network as the encoder. SqueezeNet1.1 was selected as the base network to balance computational efficiency and feature extraction capability. The Adam optimizer was used for model training with an initial learning rate of 10 4 , a task weight update step size η w of 0.01, a batch size of 8, and 60 training epochs.
To simulate potential label noise in practical severity assessment scenarios, synthetic label noise was injected into a subset of the severity assessment training data, while the test dataset remained noise-free throughout the experiments. Symmetric noise injection was implemented by uniformly and randomly flipping ground-truth labels to other possible classes. By adjusting the proportion of noise-contaminated samples in the training data, varying noise levels were introduced to evaluate algorithmic robustness. In subsequent discussions, the task with injected label noise is referred to as the noisy task, while the unperturbed counterpart is referred to as the clean task. The noise level is defined as the percentage of corrupted labels in the noisy task.
For both discharge-type identification and severity assessment tasks, classification accuracy was employed as the primary evaluation metric. To account for the ordinal regression nature of severity assessment, two additional metrics were introduced:
MAE = 1 N n = 1 N y 2 ( n ) y ^ 2 ( n ) ,
RMSE = 1 N n = 1 N y 2 ( n ) y ^ 2 ( n ) 2 ,
where y ^ 2 ( n ) denotes the predicted severity level for the n-th sample. These metrics quantify the deviation between predicted and actual severity rankings.

4.3. Results Analysis

4.3.1. Excess Risk Estimation

To validate the accuracy of the proposed excess risk estimation method, the estimated values during training were compared with their ground truths. The ground-truth excess risk was calculated by subtracting the optimal attainable loss (observed during training) from the empirical loss at each training epoch, in alignment with the definition provided in Equation (4). A fixed scaling factor was applied to the estimated excess risks to eliminate proportionality effects inherent to the calculation process, ensuring better alignment between the estimated and true values. Since task weighting depends on the relative ratios of excess risks across tasks, proportional scaling does not affect the weighting strategy. Figure 4 illustrates the comparison between the estimated and ground-truth excess risks for both tasks under a noise level of 0.4.
As shown in Figure 4, the estimated excess risks exhibited a strong correlation with the ground-truth values, particularly after the 10th training epoch, where the estimates accurately reflected the actual variations in risk. Notably, significant deviations between estimated and true values occurred during the initial training phase (especially in the first two epochs). This discrepancy arose because the Taylor expansion-based estimation method assumes proximity to the optimal parameters, an assumption violated in early training stages when model parameters were far from their attainable optima. As training progressed and parameters approached optimality, the estimated values became closer to the ground truth. The severity assessment task exhibited higher estimation errors than the discharge-type identification task, as label noise impeded parameter convergence toward the attainable optimum. Nevertheless, these errors remained within acceptable bounds for robust task-weight allocation.

4.3.2. Comparative Performance of Task-Weighting Strategies

To demonstrate the superiority of the proposed excess risk (ER)-based weighting strategy in handling label noise inherent to ordinal regression tasks, we systematically compared it with two established approaches: MGDA [34] and GradNorm [35]. The temporal evolution of task weights and training accuracy under a label noise level of 0.3 is illustrated in Figure 5.
Figure 5a shows the weight changes for the discharge-type identification task. All methods adhered to the constraint that task weights sum to unity, with only the type identification task weight being explicitly visualized in this two-task framework. The MGDA strategy initially assigned minimal weight to the type identification task, gradually increasing its allocation as training progressed. This behavior stemmed from MGDA’s inherent preference for tasks with smaller gradients. The severity assessment task containing label noise had slower loss reduction and smaller gradients, thus receiving more weight. GradNorm assigned equal initial weights to both tasks, but as training progressed, the weight for the type identification task decreased significantly. This occurred because GradNorm tended to allocate more weight to tasks with smaller gradient norms and slower learning rates. Since the severity assessment task had a slower loss reduction, it was considered to have a slower learning rate and thus received more weight. In contrast, ER allocated weights based on task excess risk, eliminating the interference of label noise in the severity assessment task, preventing weights from being excessively biased toward the noisy task, and ensuring that the clean task was not affected by label noise in the noisy task.
As shown in Figure 5b, MGDA’s initially low weight allocation to the discharge-type identification task clearly affected its accuracy. While GradNorm achieved parity with ER in later stages, its performance in the first half remained inferior due to premature emphasis on the noisy task. Notably, neither MGDA nor GradNorm’s over-weighting of the severity assessment task translated into superior performance on that task (Figure 5c), as persistent label noise fundamentally limited achievable accuracy regardless of weight allocation intensity.
Figure 6 shows the loss values of the two tasks at model convergence, both without label noise and with a label noise level of 0.5. All strategies successfully minimized both tasks’ losses in noise-free environments. However, when severity assessment labels were corrupted, all methods exhibited expected loss inflation in the noisy task, but their clean task preservation capabilities diverged markedly. By allocating too much weight to the noisy task, MGDA and GradNorm caused the clean task to be affected to varying degrees, whereas by allocating task weights based on excess risk, the ER weight allocation strategy avoided the impact of the noisy task on the clean task.
To demonstrate the robustness of the ER task-weighting strategy to label noise, Figure 7 compares the clean task weights, clean task accuracy on the test set, and overall accuracy for the three weight allocation strategies under different noise levels.
As shown in Figure 7a, under different noise levels, the ER strategy consistently maintained a high weight allocation to the clean task, never falling below 0.45 and being basically unaffected by the noisy task. In contrast, MGDA and GradNorm exhibited a decreasing trend in weight allocation to the clean task as the noise level increased, clearly affected by the noisy task. Figure 7b shows that as the noise level increased, the accuracy of the clean task decreased for all methods, but ER showed the smallest decrease, with the discharge-type identification task accuracy under a noise level of 0.5 only about 1% lower than the accuracy without noise, whereas with the other two weighting strategies, the discharge-type identification task accuracy decreased by 3–4%. Figure 7c shows that, although the average performance of multi-task models inevitably deteriorated as the noise level in the noisy task increased, the ER task-weighting strategy allowed the clean task to largely avoid the impact of the noisy task, maintaining higher accuracy, thus making the average model performance better than models using the other two weighting strategies.

4.3.3. Ranking Consistency

To verify the performance enhancement of the conditional probability-based ranking consistency (CPRC) loss function in OR-MTL for ordinal regression tasks (i.e., severity assessment), comparative experiments were conducted against conventional cross-entropy (CE) loss and ordinal regression (OR) loss [36], without explicit ranking guarantees. The results are summarized in Table 3.
As evidenced in Table 3, CPRC achieved the highest accuracy for the severity assessment task, followed by OR, with CE being the lowest. The superior performance of OR over CE confirms the rationality of decomposing the severity assessment task, which has four levels, into three binary classification sub-tasks, as it can utilize the ordinal relationships between adjacent severity levels to some extent. CPRC’s superior performance over OR demonstrates the importance of ensuring ranking consistency in predictions for ordinal regression tasks. These predictions add constraints based on physical laws, making them more aligned with objective facts. The supplementary metrics for the severity assessment task further confirm the superiority of CPRC. MAE reflects the magnitude of true prediction errors, and CPRC has smaller true errors than the other two loss functions. RMSE is more sensitive to large errors, meaning CPRC also has fewer large errors than the other two, which is crucial in severity assessment tasks. For example, misclassifying “severe” as “developing” has a very different impact than misclassifying it as “normal”. Since these loss functions are all used for the severity assessment task branch, different loss functions have minimal impact on the type identification task. The accuracy of type identification was not the focus of this comparison, so this metric was not analyzed in depth.

4.3.4. Ablation Study

To intuitively demonstrate the effectiveness of OR-MTL’s optimizations for ordinal regression tasks in multi-task learning, ablation experiments were conducted. Using a combination of the cross-entropy loss function for the severity assessment task and no special weight allocation strategy in the multi-task model (i.e., equal weights for all tasks) as the baseline, the experiments compared the scenarios of only introducing the CPRC loss function, only introducing the ER task-weighting strategy, and introducing both improvements simultaneously. The results are shown in Table 4.
In Table 4, it can be observed that when using the CPRC loss function for the severity assessment task, the accuracy of this task improved compared to using the CE loss function, with corresponding reductions in MAE and RMSE. When using the ER task weight allocation strategy in the multi-task model, the type identification task was largely unaffected by label noise in the severity assessment task, achieving higher accuracy. As the complete OR-MTL framework achieved improvements in both type identification and severity assessment tasks, it also demonstrated better performance in terms of overall accuracy.
Figure 8 presents the confusion matrices of the complete OR-MTL framework for both the type identification and severity assessment tasks. These matrices provide a detailed view of the model’s classification accuracy and error patterns, facilitating the performance evaluation regarding missing fault events (false negatives) and false alarms (false positives). Missing fault events are represented by the off-diagonal elements in each row, while false alarms are shown in the off-diagonal elements of each column. The confusion matrices reveal critical patterns relevant to maintenance decisions: for the type identification task, the high values along the diagonal demonstrate strong detection capability across all defect types; for the severity assessment task, misclassifications predominantly occur between adjacent severity levels, which present significantly lower operational risks from a maintenance perspective compared to misclassifications between distant levels.
In summary, the CPRC loss function can improve model performance on ordinal regression tasks, while the ER task weight allocation strategy can avoid the impact of high label noise in ordinal regression tasks on clean tasks through more reasonable weight allocation. Combining these two improvements can effectively enhance the overall performance of multi-task models containing ordinal regression tasks.

5. Conclusions

This paper proposes an Ordinal Regression Multi-Task Learning (OR-MTL) framework to address the ordinal regression nature of the severity assessment task in GIS PD multi-task diagnosis, which addresses two key issues introduced by ordinal regression tasks in multi-task learning.
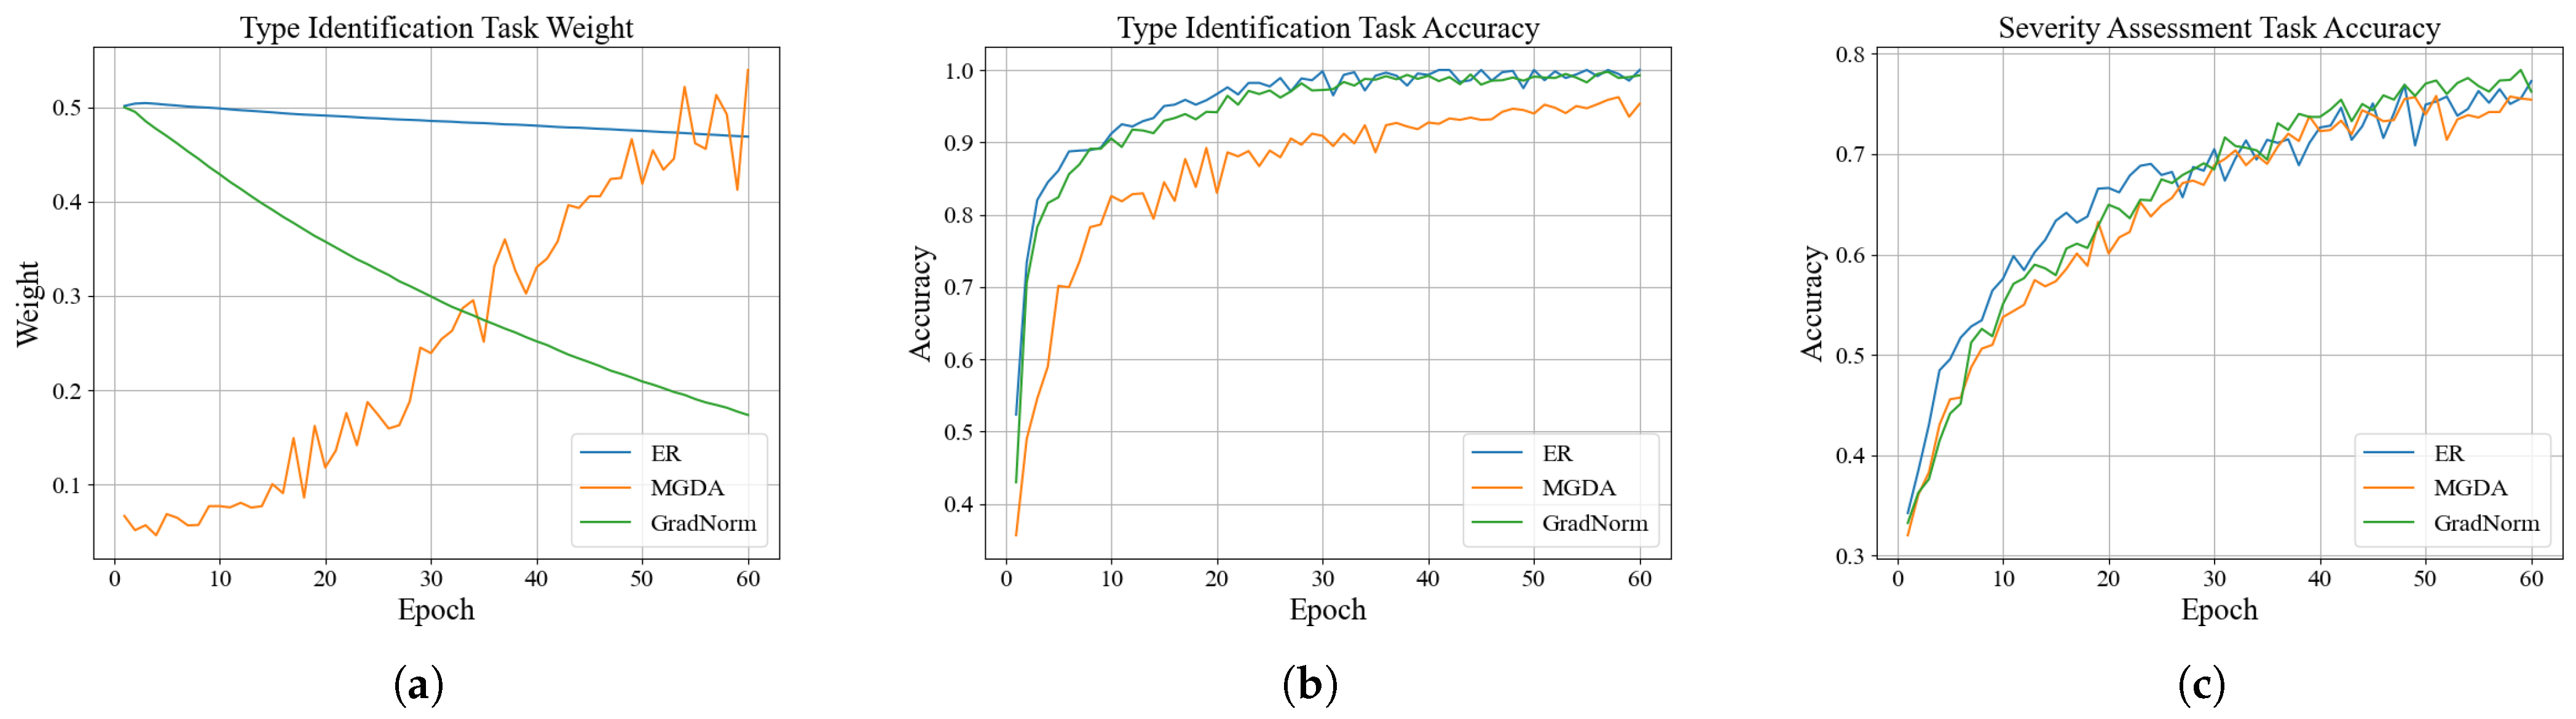
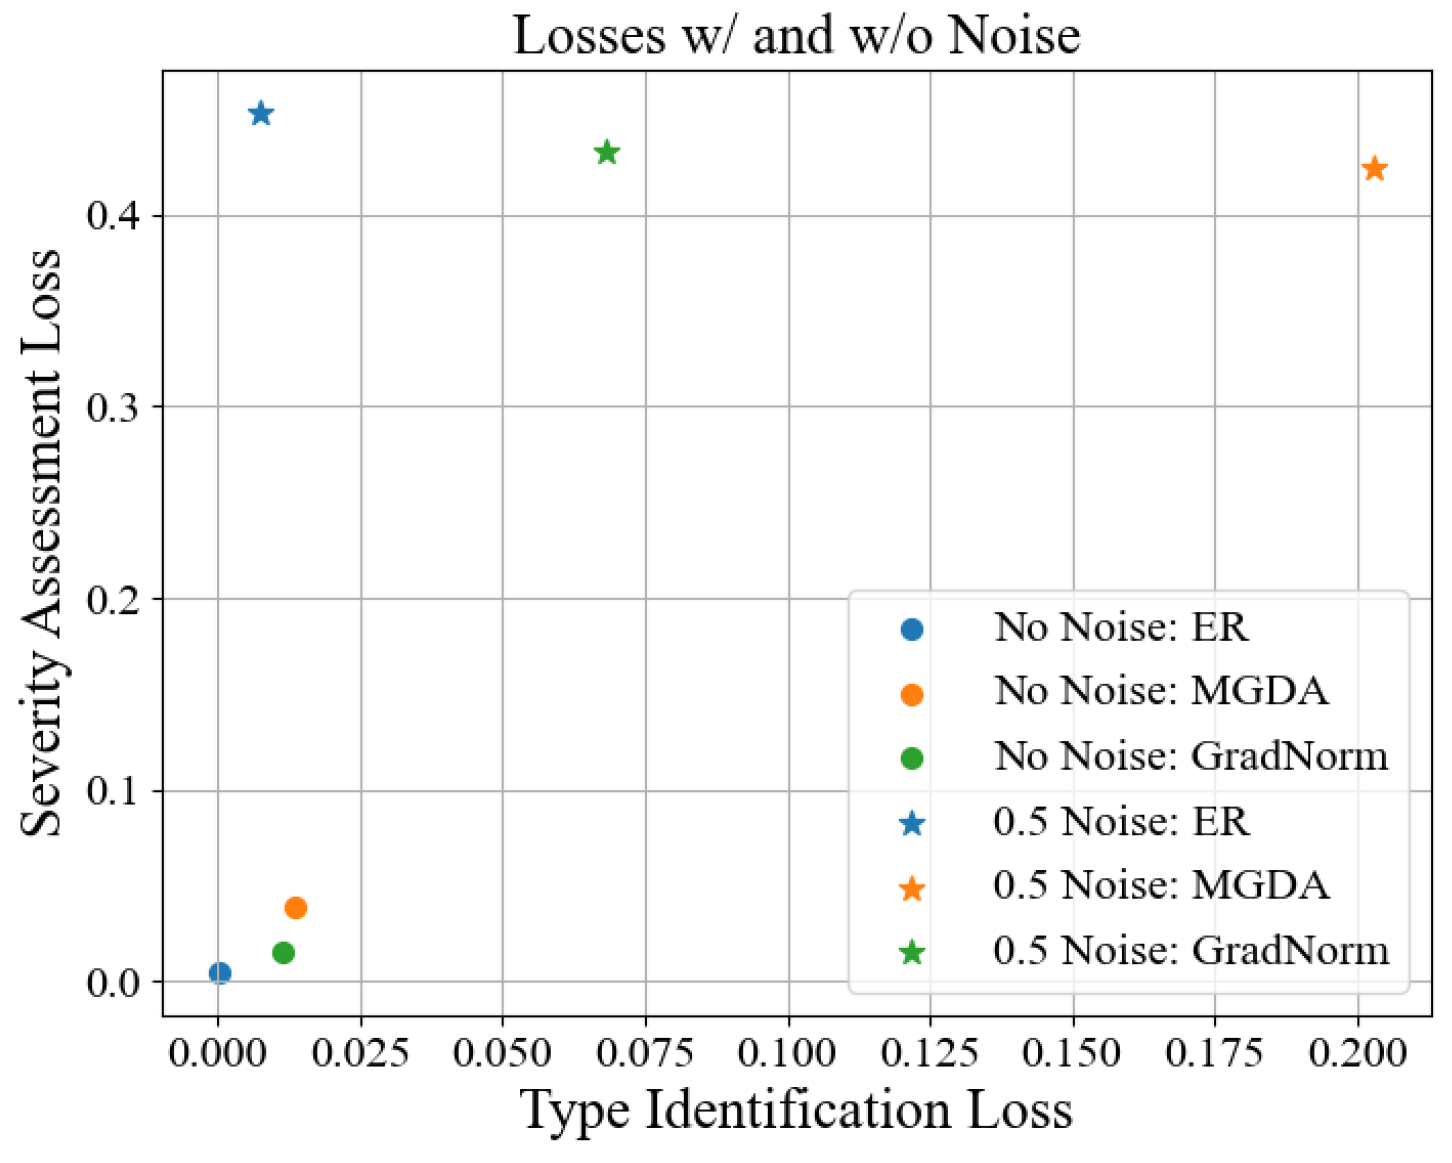
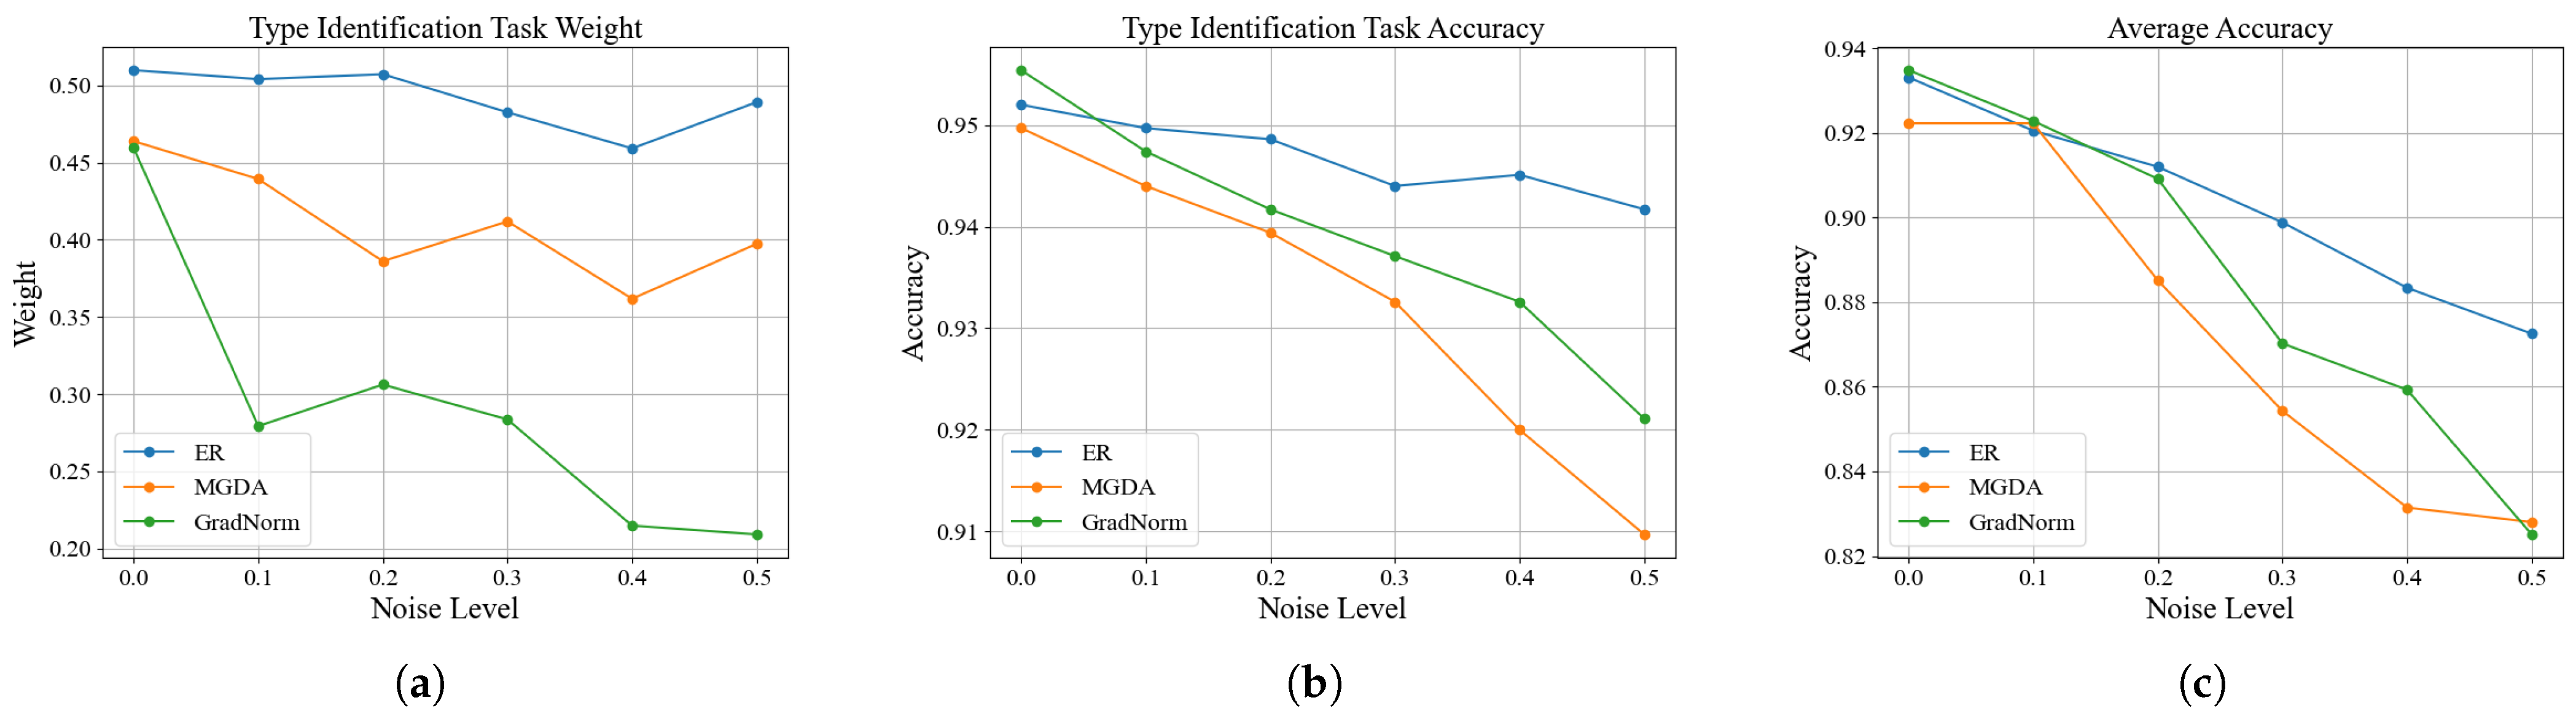
First, by addressing the impact of label noise in ordinal regression tasks on task weight allocation, this paper proposes a dynamic task-weighting strategy based on excess risk. This strategy adjusts the weights by estimating task excess risk rather than the original loss, effectively mitigating the impact of label noise in the severity assessment task on the discharge-type identification task. Experimental results show that under different noise levels, this strategy consistently maintains high weights and accuracy for clean tasks, demonstrating greater robustness than traditional methods.
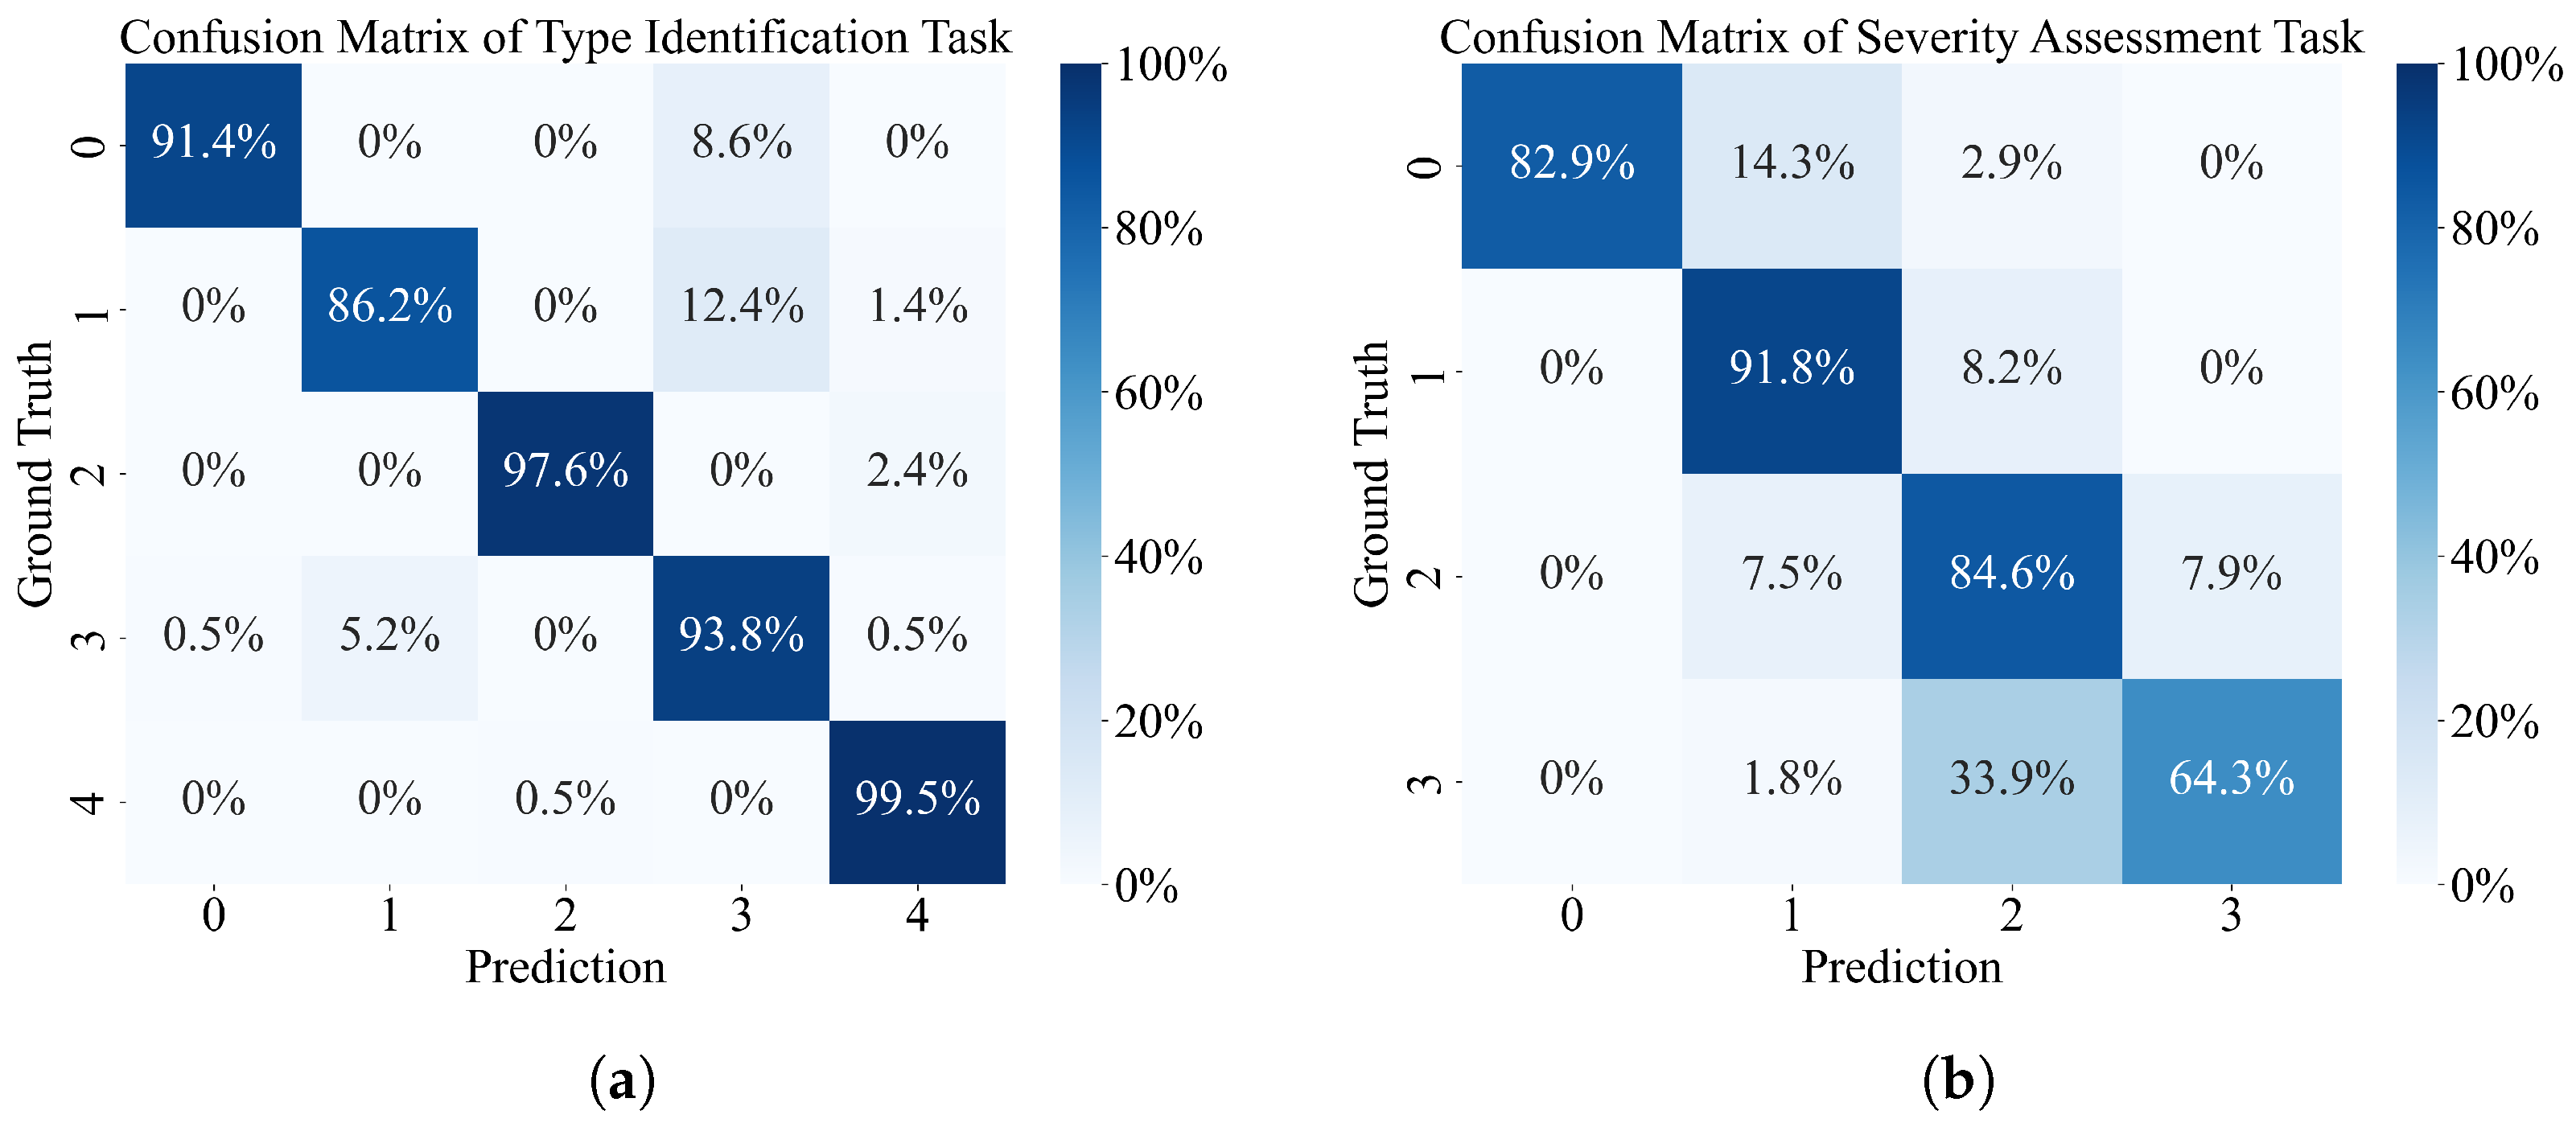
Second, by addressing the ranking inconsistency problem in ordinal regression predictions, this paper introduces a conditional probability-based ordinal regression loss function, which ensures ranking consistency in severity predictions through a conditional probability sequence. Experiments demonstrate that this loss function outperforms the traditional cross-entropy and ordinary ordinal regression loss functions in terms of severity assessment accuracy, mean absolute error, and root mean squared error. Ablation experiments further confirm that the complete OR-MTL framework achieves optimal performance in both the discharge-type identification and severity assessment tasks.
Due to the lack of publicly available GIS PD datasets and the practical challenges in obtaining defect samples from actual operating environments, the validation in this study was conducted solely on a laboratory-generated dataset. In future work, we plan to cooperate closely with power utilities to collect additional real-world GIS PD data, aiming to further verify and enhance the generalizability of our proposed method. This research not only provides more effective technical support for the intelligent operation and maintenance of GIS equipment but also offers new insights into multi-task learning involving ordinal regression tasks.

Author Contributions

Conceptualization, J.L. and J.T.; methodology, J.L.; software, J.L.; validation, J.L. and G.L.; formal analysis, J.L.; investigation, J.L.; resources, J.L., J.T. and G.L.; data curation, J.L. and J.T.; writing—original draft preparation, J.L.; writing—review and editing, J.T. and G.L.; visualization, J.L.; supervision, J.T.; project administration, J.L. and J.T.; funding acquisition, J.L. and G.L. All authors have read and agreed to the published version of the manuscript.

Funding

This research was funded by the Fundamental Research Program of Shanxi Province (Grant Nos. 202403021222054 and 202403021222058).

Data Availability Statement

The raw data supporting the conclusions of this article will be made available by the authors upon request.

Conflicts of Interest

The authors declare no conflicts of interest.

References

  1. Khan, Q.; Refaat, S.S.; Abu-Rub, H.; Toliyat, H.A. Partial discharge detection and diagnosis in gas insulated switchgear: State of the art. IEEE Electr. Insul. Mag. 2019, 35, 16–33. [Google Scholar] [CrossRef]
  2. Li, J.; Han, X.; Liu, Z.; Li, Y. Review on Partial Discharge Measurement Technology of Electrical Equipment. High Volt. Eng. 2015, 41, 2583–2601. [Google Scholar] [CrossRef]
  3. Tang, Z.; Tang, M.; Li, J.; Wang, J.; Wu, C.; Wang, K. Review on Partial Discharge Pattern Recognition of Electrical Equipment. High Volt. Eng. 2017, 43, 2263–2277. [Google Scholar] [CrossRef]
  4. Karimi, M.; Majidi, M.; MirSaeedi, H.; Arefi, M.M.; Oskuoee, M. A Novel Application of Deep Belief Networks in Learning Partial Discharge Patterns for Classifying Corona, Surface, and Internal Discharges. IEEE Trans. Ind. Electron. 2020, 67, 3277–3287. [Google Scholar] [CrossRef]
  5. Tian, J.; Song, H.; Sheng, G.; Jiang, X. Knowledge-Driven Recognition Methodology of Partial Discharge Patterns in GIS. IEEE Trans. Power Deliv. 2022, 37, 3335–3344. [Google Scholar] [CrossRef]
  6. Xu, C.; Chen, J.; Liu, W.; Lv, Z.; Li, P.; Zhu, M. Pattern Recognition of Partial Discharge PRPD Spectrum in GIS Based on Deep Residual Network. High Volt. Eng. 2022, 48, 1113–1123. [Google Scholar] [CrossRef]
  7. Fu, Y.; Liang, L.; Huang, W.; Huang, G.; Huang, P.; Zhang, Z.; Chen, C.; Wang, C. Partial Discharge Pattern Recognition Method Based on Transfer Learning and DenseNet Model. IEEE Trans. Dielectr. Electr. Insul. 2023, 30, 1240–1246. [Google Scholar] [CrossRef]
  8. Wang, Y.; Yan, J.; Yang, Z.; Wu, Y.; Wang, J.; Geng, Y. Generative Zero-Shot Learning for Partial Discharge Diagnosis in Gas-Insulated Switchgear. IEEE Trans. Instrum. Meas. 2023, 72, 3512011. [Google Scholar] [CrossRef]
  9. Wu, Y.; Yan, J.; Xu, Z.; Sui, G.; Qi, M.; Geng, Y.; Wang, J. Subdomain Adaptation Capsule Network for Partial Discharge Diagnosis in Gas-Insulated Switchgear. Entropy 2023, 25, 809. [Google Scholar] [CrossRef]
  10. Meng, X.; Song, H.; Dai, J.; Luo, L.; Sheng, G.; Jiang, X. Severity Evaluation of UHF Signals of Partial Discharge in GIS Based on Semantic Analysis. IEEE Trans. Power Deliv. 2022, 37, 1456–1464. [Google Scholar] [CrossRef]
  11. Tang, J.; Jin, M.; Zeng, F.; Zhang, X.; Huang, R. Assessment of PD severity in gas-insulated switchgear with an SSAE. IET Sci. Meas. Technol. 2017, 11, 423–430. [Google Scholar] [CrossRef]
  12. Tang, J.; Jin, M.; Zeng, F.; Zhou, S.; Zhang, X.; Yang, Y.; Ma, Y. Feature Selection for Partial Discharge Severity Assessment in Gas-Insulated Switchgear Based on Minimum Redundancy and Maximum Relevance. Energies 2017, 10, 1516. [Google Scholar] [CrossRef]
  13. Song, H.; Dai, J.; Li, Z.; Luo, L.; Sheng, G.; Jiang, X. An Assessment Method of Partial Discharge Severity for GIS in Service. Proc. CSEE 2019, 39, 1231–1241. [Google Scholar] [CrossRef]
  14. Zhang, Y.; Yang, Q. A Survey on Multi-Task Learning. IEEE Trans. Knowl. Data Eng. 2022, 34, 5586–5609. [Google Scholar] [CrossRef]
  15. Ji, J.; Shu, Z.; Li, H.; Lai, K.X.; Lu, M.; Jiang, G.; Wang, W.; Zheng, Y.; Jiang, X. Edge-Computing-Based Knowledge Distillation and Multitask Learning for Partial Discharge Recognition. IEEE Trans. Instrum. Meas. 2024, 73, 5008011. [Google Scholar] [CrossRef]
  16. Wang, Y.; Yan, J.; Zhang, W.; Yang, Z.; Wang, J.; Geng, Y.; Srinivasan, D. Mutitask Learning Network for Partial Discharge Condition Assessment in Gas-Insulated Switchgear. IEEE Trans. Ind. Inform. 2024, 20, 11998–12009. [Google Scholar] [CrossRef]
  17. Yan, J.; Wang, Y.; Zhang, W.; Wang, J.; Geng, Y.; Srinivasan, D. Domain-alignment multitask learning network for partial discharge condition assessment with digital twin in gas-insulated switchgear. Meas. Sci. Technol. 2024, 35, 065109. [Google Scholar] [CrossRef]
  18. Gutiérrez, P.A.; Pérez-Ortiz, M.; Sánchez-Monedero, J.; Fernández-Navarro, F.; Hervás-Martínez, C. Ordinal Regression Methods: Survey and Experimental Study. IEEE Trans. Knowl. Data Eng. 2016, 28, 127–146. [Google Scholar] [CrossRef]
  19. Gao, Y.; Zhao, L. Incomplete Label Multi-Task Ordinal Regression for Spatial Event Scale Forecasting. In Proceedings of the AAAI Conference on Artificial Intelligence, New Orleans, LA, USA, 2–7 February 2018; Volume 32. [Google Scholar] [CrossRef]
  20. Wang, L.; Zhu, D. Tackling ordinal regression problem for heterogeneous data: Sparse and deep multi-task learning approaches. Data Min. Knowl. Discov. 2021, 35, 1134–1161. [Google Scholar] [CrossRef]
  21. Zhao, Y.; Li, J.; Zhang, Y.; Song, Y.; Tian, Y. Ordinal Multi-Task Part Segmentation with Recurrent Prior Generation. IEEE Trans. Pattern Anal. Mach. Intell. 2021, 43, 1636–1648. [Google Scholar] [CrossRef]
  22. Xiao, Y.; Zeng, M.; Liu, B.; Zhao, L.; Kong, X.; Hao, Z. Multi-task ordinal regression with task weight discovery. Knowl.-Based Syst. 2024, 305, 112616. [Google Scholar] [CrossRef]
  23. Zhang, J.; Song, B.; Wang, H.; Han, B.; Liu, T.; Liu, L.; Sugiyama, M. BadLabel: A Robust Perspective on Evaluating and Enhancing Label-Noise Learning. IEEE Trans. Pattern Anal. Mach. Intell. 2024, 46, 4398–4409. [Google Scholar] [CrossRef] [PubMed]
  24. Oyen, D.; Kucer, M.; Hengartner, N.; Singh, H.S. Robustness to Label Noise Depends on the Shape of the Noise Distribution. Adv. Neural Inf. Process. Syst. 2022, 35, 35645–35656. [Google Scholar]
  25. He, Y.; Zhou, S.; Zhang, G.; Yun, H.; Xu, Y.; Zeng, B.; Chilimbi, T.; Zhao, H. Robust multi-task learning with excess risks. In Proceedings of the 41st International Conference on Machine Learning (ICML’24), Vienna, Austria, 21–27 July 2024; Volume 235, pp. 18094–18114. [Google Scholar]
  26. Bach, F. Learning Theory from First Principles; Adaptive Computation and Machine Learning; The MIT Press: Cambridge, MA, USA, 2024. [Google Scholar]
  27. Amari, S.I. Natural Gradient Works Efficiently in Learning. Neural Comput. 1998, 10, 251–276. [Google Scholar] [CrossRef]
  28. Hazan, E. Introduction to Online Convex Optimization; Now Publishers: Norwell, MA, USA, 2016. [Google Scholar]
  29. Cao, W.; Mirjalili, V.; Raschka, S. Rank consistent ordinal regression for neural networks with application to age estimation. Pattern Recognit. Lett. 2020, 140, 325–331. [Google Scholar] [CrossRef]
  30. Wang, Y.; Tanaka, S.; Yokoyama, K.; Wu, H.T.; Fang, Y. Two-sided Rank Consistent Ordinal Regression for Interpretable Music Key Recommendation. In Proceedings of the 2022 ACM SIGIR International Conference on Theory of Information Retrieval (ICTIR’22), Madrid, Spain, 11–12 July 2022; pp. 223–231. [Google Scholar] [CrossRef]
  31. Shi, X.; Cao, W.; Raschka, S. Deep neural networks for rank-consistent ordinal regression based on conditional probabilities. Pattern Anal. Appl. 2023, 26, 941–955. [Google Scholar] [CrossRef]
  32. Li, L.; Lin, H.T. Ordinal Regression by Extended Binary Classification. In Advances in Neural Information Processing Systems; MIT Press: Cambridge, MA, USA, 2006; Volume 19. [Google Scholar]
  33. Ji, X. Manual for Abnormal Judgment in Live Inspection of GIS Equipment; China Electric Power Press: Beijing, China, 2017. [Google Scholar]
  34. Sener, O.; Koltun, V. Multi-Task Learning as Multi-Objective Optimization. In Advances in Neural Information Processing Systems; Curran Associates, Inc.: San Francisco, CA, USA, 2018; Volume 31. [Google Scholar]
  35. Chen, Z.; Badrinarayanan, V.; Lee, C.Y.; Rabinovich, A. GradNorm: Gradient Normalization for Adaptive Loss Balancing in Deep Multitask Networks. In Proceedings of the 35th International Conference on Machine Learning, Stockholm, Sweden, 10–15 July 2018; PMLR: New York, NY, USA, 2018; pp. 794–803. [Google Scholar]
  36. Niu, Z.; Zhou, M.; Wang, L.; Gao, X.; Hua, G. Ordinal Regression With Multiple Output CNN for Age Estimation. In Proceedings of the IEEE Conference on Computer Vision and Pattern Recognition, Las Vegas, NV, USA, 27–30 June 2016; pp. 4920–4928. [Google Scholar]
Figure 1. Schematic diagram of ranking consistency in GIS PD severity assessment.
Electronics 14 01262 g001
Figure 2. Gas-Insulated Switchgear (GIS) Partial Discharge (PD) simulation experiment platform.
Electronics 14 01262 g002
Figure 3. Schematic wiring diagram for GIS PD simulation experiment.
Electronics 14 01262 g003
Figure 4. Excess risks during training (noise level: 0.4). (a,b) Excess risks for the discharge-type identification and severity assessment tasks, respectively.
Electronics 14 01262 g004
Figure 5. Temporal evolution of task weights and training accuracy during the learning process. (a) Weight variations for the type identification task. (b,c) Variations in training accuracy for the discharge-type identification task and the severity assessment task, respectively.
Electronics 14 01262 g005
Figure 6. Impact of label noise on task-specific loss at model convergence.
Electronics 14 01262 g006
Figure 7. Performance under varying noise levels at model convergence. (a) Task weights allocated to the discharge-type identification task. (b) Test accuracy of the discharge-type identification task. (c) Average test accuracy.
Electronics 14 01262 g007
Figure 8. Confusion matrices generated by the complete OR-MTL framework: (a,b) Confusion matrices for the discharge-type identification and severity assessment tasks, respectively.
Electronics 14 01262 g008
Table 1. Parameters of instruments and equipment used in PD detection experiment.
InstrumentKey Specifications
PD DetectorChannels: 2; Resolution: 16-bit; Sampling Rate: 250 MS/s; Dynamic Range: ≥60 dB
AE SensorDetection Band: 10–300 kHz; Peak Sensitivity: ≥65 dB; Average Sensitivity: ≥55 dB
UHF SensorDetection Band: 300–1500 MHz; Average Effective Height: ≥11 mm
Table 2. Severity definitions for PD of different defect types.
Defect InitialDevelopingSevere
MPDescriptionDischarges predominantly occur in the negative half-cycle with narrow phase intervals.Increased discharges in the positive half-cycle, higher amplitudes, and broader phase intervals.Further amplitude growth with “double-peak” characteristics in the negative half-cycle.
Applied Voltage (kV)23.6, 25.5, 27.329.2, 31.1, 33.0, 34.936.8, 38.7
FEDescriptionSparse discharges with large and stable amplitudes.Increased discharge frequencies and broader phase intervals.Continuous frequency growth and a leftward shift of initial discharge phases.
Applied Voltage (kV)14.7, 17.821.0, 24.1, 27.230.4, 33.5, 36.6, 39.7
FMPDescriptionIntermittent low-amplitude discharges without distinct phase features.Significant increase in discharge frequency and amplitude.Continuously rising repetition rates and amplitudes.
Applied Voltage (kV)17.8, 20.4, 23.125.7, 28.3, 31.033.6, 36.2, 38.9
IGDescriptionLow-amplitude discharges clustered in the rising edge of the power-frequency cycle (<90° phase span for a single discharge cluster).Discharge amplitude significantly grows, covering the entire rising edge (≃90° phase span for a single discharge cluster).High-amplitude discharges spanning the entire power-frequency cycle.
Applied Voltage (kV)15.2, 17.8, 20.4, 23.025.6, 28.230.8, 33.4, 36.0
Table 3. Performance comparison of multi-task models using different severity assessment loss functions.
Loss FunctionType IdentificationSeverity Assessment
AccuracyAccuracyMAERMSE
CE95.20%90.63%0.09940.3330
OR95.31%91.43%0.08570.2928
CPRC95.09%92.00%0.08000.2828
Best results are highlighted in bold.
Table 4. Performance of multi-task models on the test set (training set noise level: 0.5).
MethodType IdentificationSeverity AssessmentOverall
AccuracyAccuracyMAERMSEAccuracy
CE + EW92.68%78.29%0.25140.567771.31%
CPRC + EW92.80%79.89%0.21030.478174.06%
CE + ER94.05%78.97%0.25710.592373.71%
CPRC + ER94.17%80.34%0.20340.466075.54%
Best results are highlighted in bold.
Disclaimer/Publisher’s Note: The statements, opinions and data contained in all publications are solely those of the individual author(s) and contributor(s) and not of MDPI and/or the editor(s). MDPI and/or the editor(s) disclaim responsibility for any injury to people or property resulting from any ideas, methods, instructions or products referred to in the content.

