1. Introduction
The development of power supplies presenting high power density at affordable cost is one of the main targets of any modern industry [
1,
2,
3]. With this perspective, Gallium Nitride (GaN) is an enabler technology because it allows for increasing the converters’ switching frequency, thus helping to reduce the size of the passive components [
4,
5,
6]. On the other hand, the reduced thermal performance caused by high levels of integration and PCB board reduction creates obstacles for high power density [
7]. Hence, it is essential to implement specific control strategies to maximize the efficiency of the power converter [
8].
This aspect is also extremely important in offline power converters [
9]. They present an input bridge rectifier and bulk capacitor to provide a pre-unregulated DC voltage to supply the downstream switching converter. In particular, the bulk capacitor supplies the downstream converter when the instantaneous line voltage is below the DC bus. However, the line current is a non-sinusoidal, but narrow pulse waveform, with a very high peak current, due to this capacitor input filter, which leads to high harmonic content that causes a significant reduction in the power factor (PF) [
10].
The International Electrotechnical Commission (IEC) has published standards, e.g., IEC61000-3-2 [
11], to provide harmonic current emission limits for any low-power commercially available equipment with an input current less than or equal to 16 A per phase. To comply with this regulation, a high Power Factor Correction (PFC) switching pre-regulator is interposed between the input rectifier bridge and the bulk capacitor. The PFC is designed to draw a sinusoidal input current in phase with the line voltage. This significantly increases the PF and reduces the total harmonic distortion (THD) below the limits imposed by the regulations [
12]. The PFC typically provides an output voltage with a narrow ripple superimposed on a DC value (usually 400 V). Therefore, the downstream converter can be designed to operate with an almost constant input voltage, thus facilitating the optimal design of the converter to increase efficiency and reduce costs [
13].
As aforementioned, the development of control strategies to maximize efficiency is crucial for enhancing the power density of off-line converters with a two-stage architecture, because the overall efficiency depends on each stage [
14]. In this context, this paper introduces a novel technique that enables the PFC to operate intermittently when the output power is below the limits imposed by IEC61000-3-2, significantly reducing PFC losses and improving system efficiency. The main novelty is that the proposed converter starts intermittent operation in a more efficient way than state-of-the-art methods, as will be detailed in the following sections. Moreover, the PFC’s output voltage fluctuation is constrained across the entire input voltage range, which typically varies from 90 Vac to 264 Vac, allowing for the design of the subsequent converter, a flyback, with a narrow input voltage range. This leads the flyback to reach higher efficiency and more compact dimensions compared to traditionally controlled two-stage converters.
The paper is structured as follows:
Section 2 presents an overview of the control techniques which have been proposed so far to address the aforementioned issue. This section also briefly recalls the operation of a Quasi-Resonant Flyback (QRF) converter, which is particularly useful for completeness.
Section 3 introduces the proposed hiccup mode technique and describes in detail its functioning in a two-stage converter and how it can help to improve the efficiency and power density of the power converter. Finally,
Section 4 provides the simulation results, which confirm the predictions of the previous sections. From there, the main conclusions are drawn.
2. Control Strategies
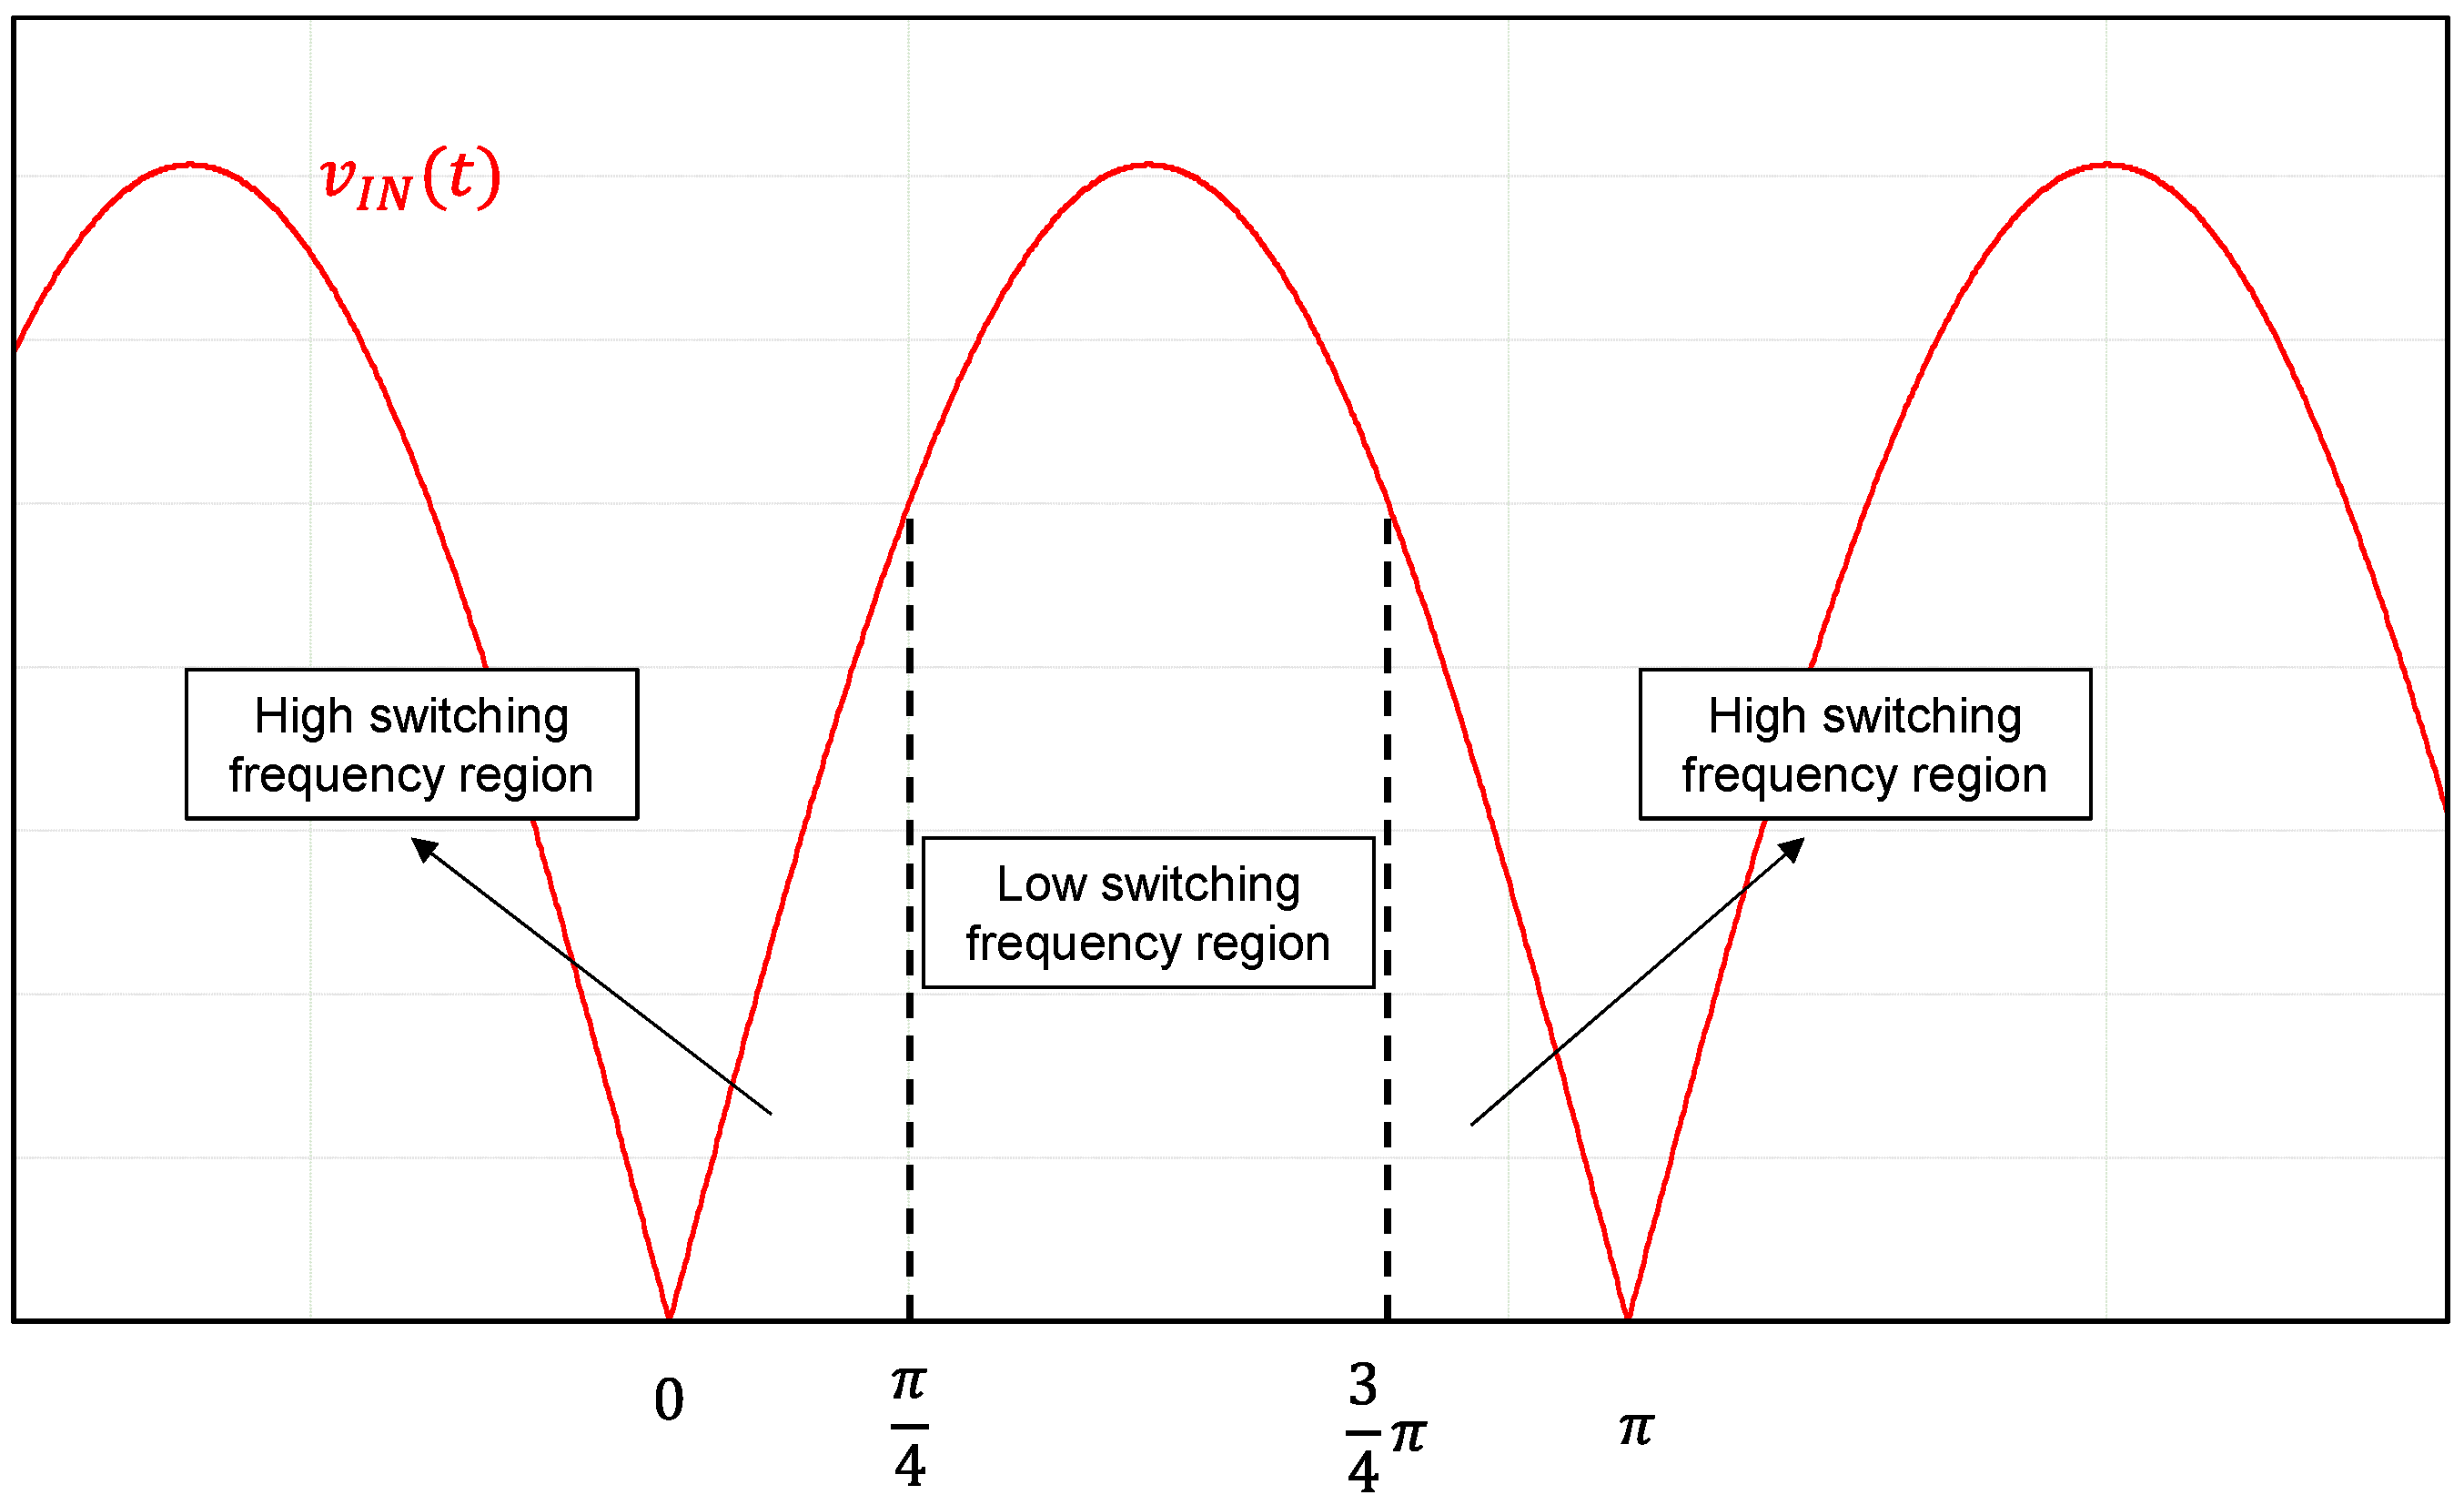
Various control strategies have been proposed so far to enhance the performance of two-stage converter architectures. In [
15], the switching frequency of the PFC is changed according to the value of the main half-line cycle (
Figure 1).
The switching frequency is reduced when the phase angle range is
, i.e., where the input voltage is higher, to reduce the switching losses. On the other hand, it is increased in the range of
and
, to limit the distortion of the zero-crossing point and maintain a sufficient PF.
Figure 1 shows the principle of this method. However, the control strategy neglects the output power and, consequently, the efficiency at medium or light load is significantly lower than with the single-stage converter. Additionally, the harmonic content of the system is greater than with standard control PFC.
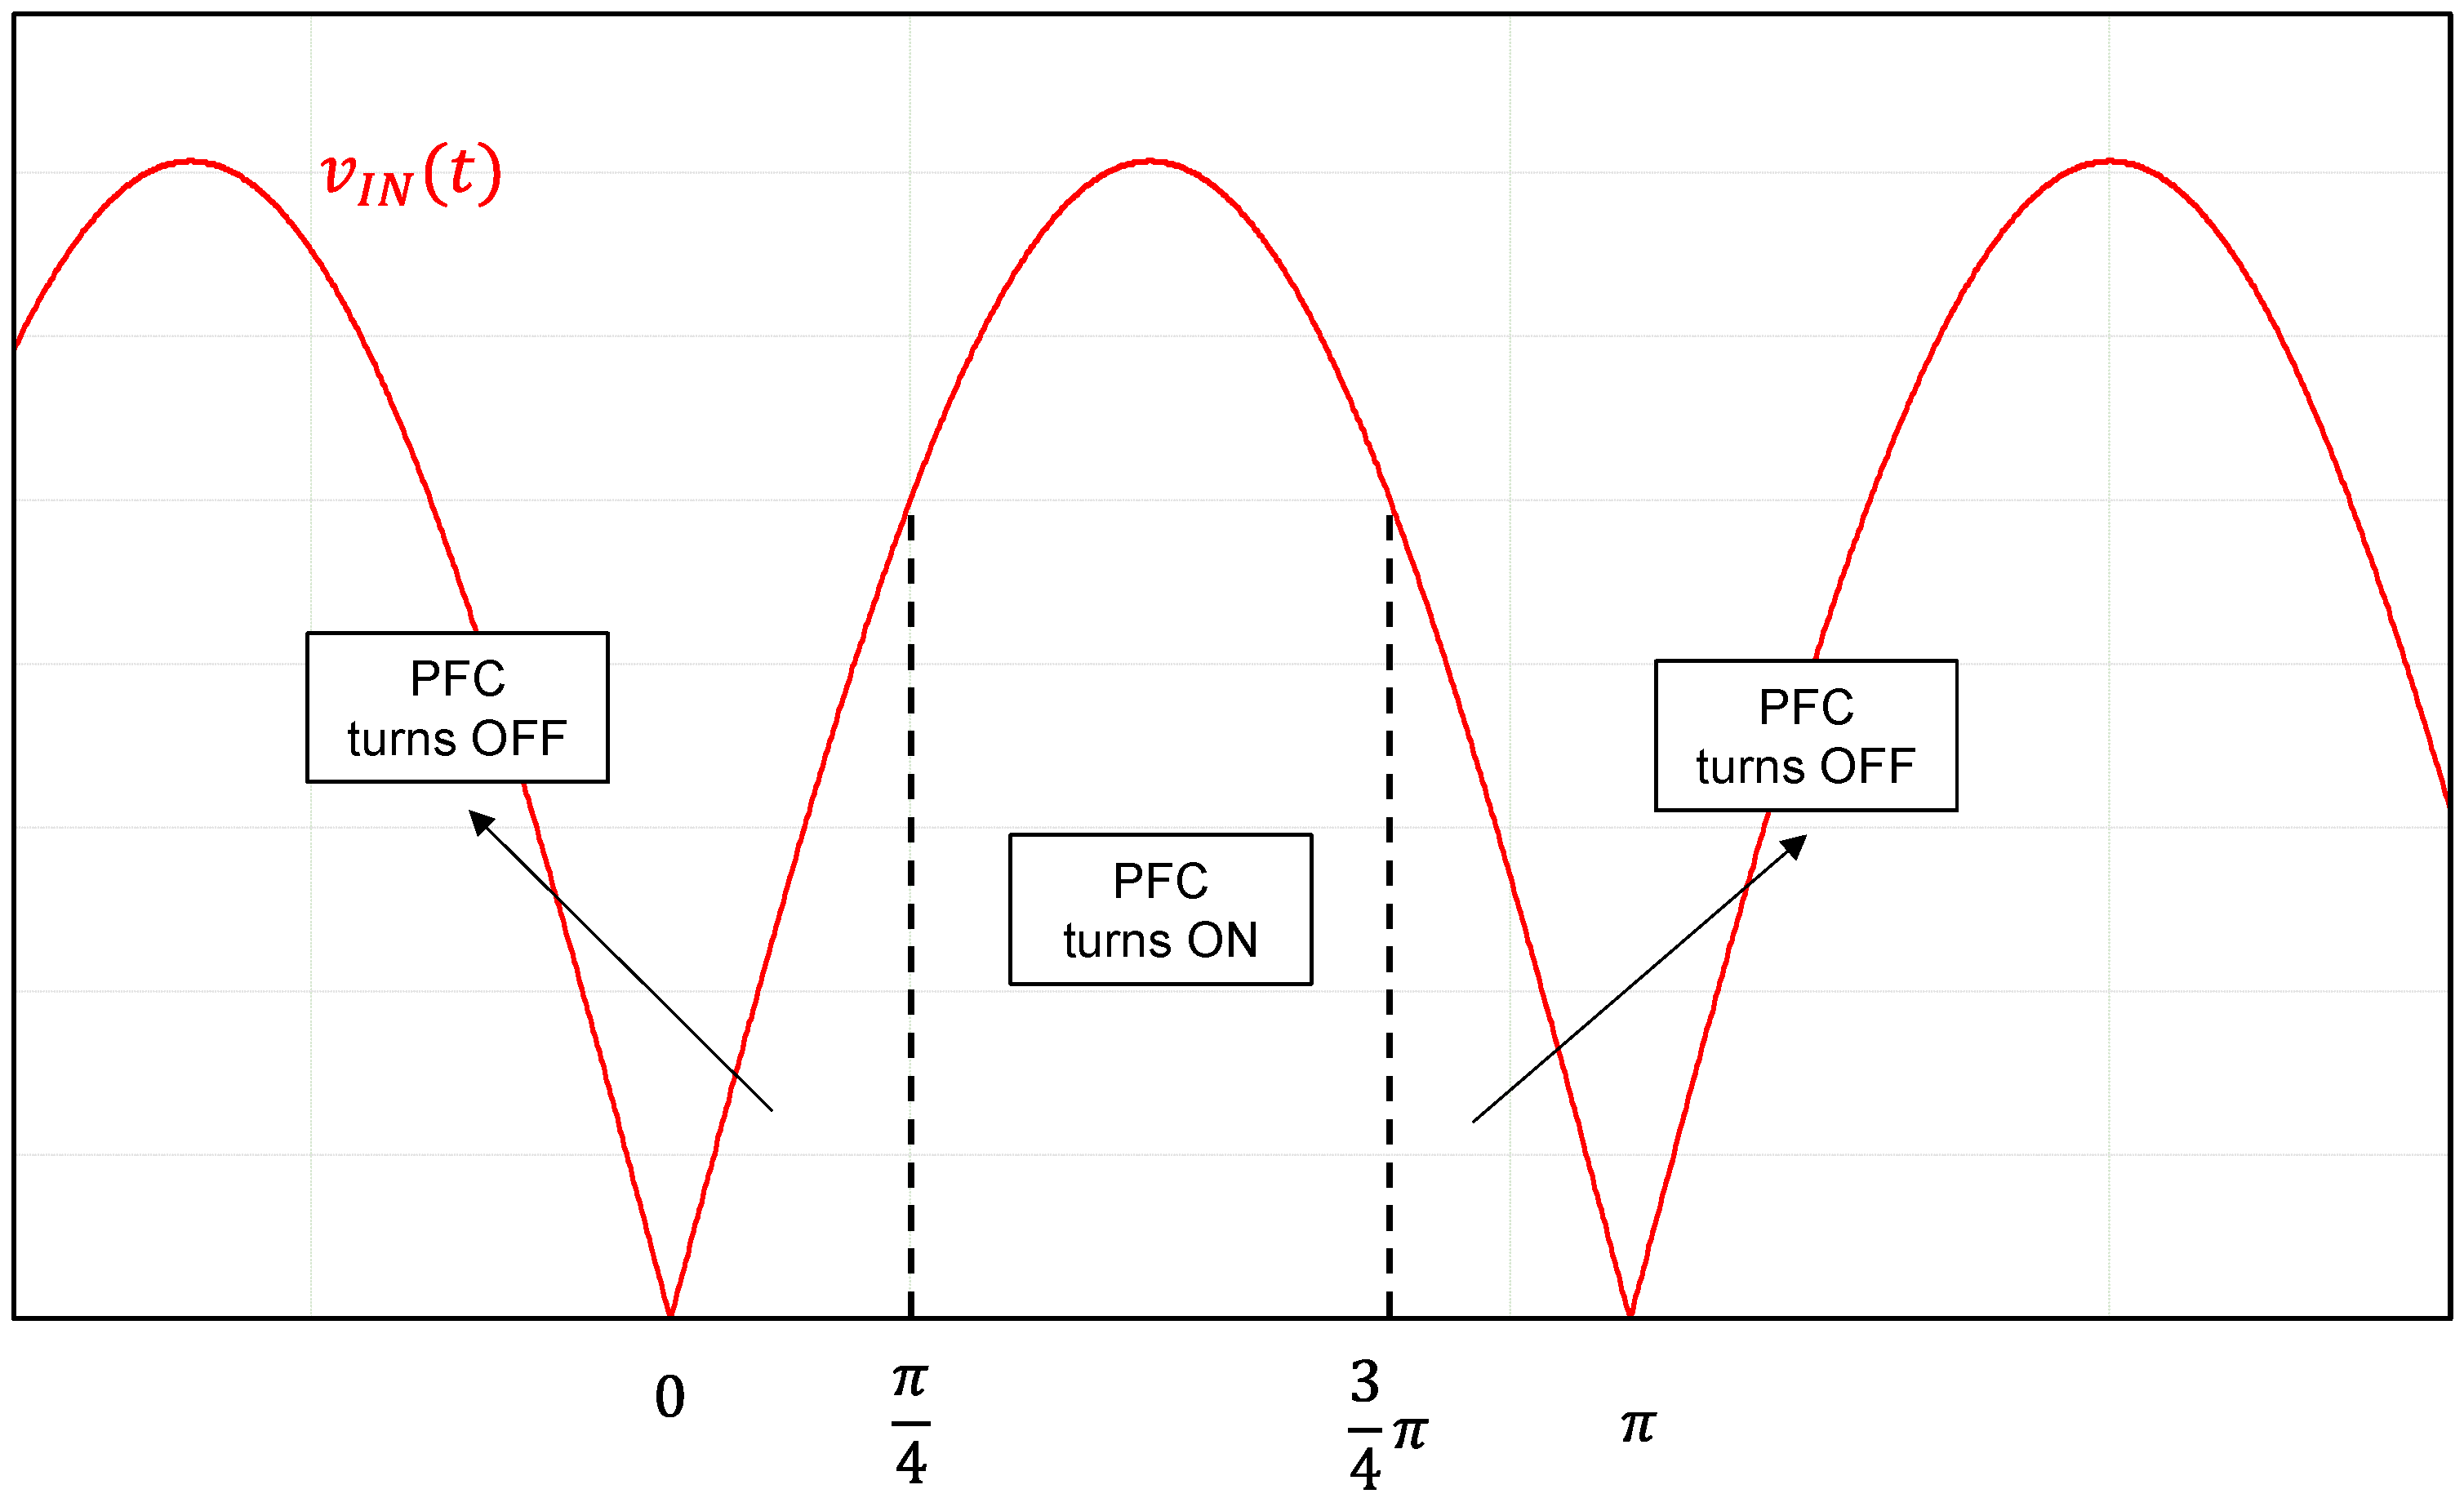
Another interesting technique is proposed in [
16], where the PFC is intermittently turned off, depending on the efficiency. The technique restricts the operations of a converter to only two operating conditions: the PFC converter is turned on only in the region where the conduction losses are minimized; otherwise, it is turned off to reduce the losses virtually to zero. More specifically, the PFC converter is enabled around the line current peaks while it is kept off near the zero-crossings of the line current. The drawback of this method is that the efficiency of power converters at medium and light loads is mainly determined by switching losses, core losses of magnetic components, and drive losses of semiconductor switches, which are all losses dependent on voltage. Consequently, in these load conditions, the PFC is enabled precisely in the region where the switching losses are most significant.
Figure 2 shows the principle of this method.
In [
17], the power switch of the PFC is turned on within the region centered around the voltage peaks of the main, while the off-state interval of the PFC is variable because it is determined according to the power delivered by the PFC and absorbed by the supplied load. This technique provides stable operations and constant frequency operation with no acoustic noise at low loads. The limited transient response is the main drawback of this technique. Also, an internal counter and look-up table are required, thus increasing the cost of the controller.
Finally, a popular and simple solution to improve the system efficiency is turning off the PFC when unnecessary. According to the standard IEC61000-3-2, the power adapters and chargers, including USB-PD converters, belong to class D. When the input power exceeds 75 W there are distortion limits dictated in the standard. Hence, the PFC stage can be turned off when the power converter operates below these limits [
18,
19].
Although this simple solution improves the converter efficiency, it also brings some undesired drawbacks that are not acceptable in some cases [
19,
20]. Firstly, if the downstream switching converter is optimized to work with a constant input voltage (usually 400 V) then the downstream DC-DC stage works with different mains voltage input (e.g., from 85 Vac to 264 Vac) when the PFC is switched off. This causes higher conduction losses due to the increased rms primary current, and higher power losses in magnetic components. As a result, the power converter must be oversized to reduce the inefficiency introduced by the extra conduction losses and the magnetic losses. A second important drawback arises during the transition from light to heavy load, which involves the turning on of the PFC. During the interval the PFC reaches the steady state condition, the DC-DC converter may not correctly maintain the output voltage regulation [
19,
20]. This phenomenon is more probable when the system is supplied with a low input voltage (e.g., USA input voltage range, 110 Vac), resulting in unacceptable output voltage undershoots or overload triggering. To avoid these problems during the power-on time of the PFC, the downstream DC-DC converter must be designed to operate in a wide range. However, wide-range operation implies worsened performances as well as increased system dimension and cost. Specifically, for DC-DC converters in the range of 120–140 W, a peak current mode control (PCM) flyback converter topology is commonly used, thanks to its simplicity and flexibility. Unfortunately, the PCM flyback converter operating in continuous conduction mode (CCM) with a duty cycle approaching 50% or higher exhibits the well-known sub-harmonic instability behavior [
21], which requires a specific slope compensation technique to solve it [
22]. Alternatively, the converter can be designed to operate, when in CCM, with a duty cycle below 50%. This can be performed either by reducing the reflected voltage of the flyback, i.e., the output voltage reported to the primary winding through the primary to secondary turn ratio (
), or by increasing the input capacitor. In both cases, the flyback may operate in a sub-optimized state, and the dimensions and the cost of the system significantly increase.
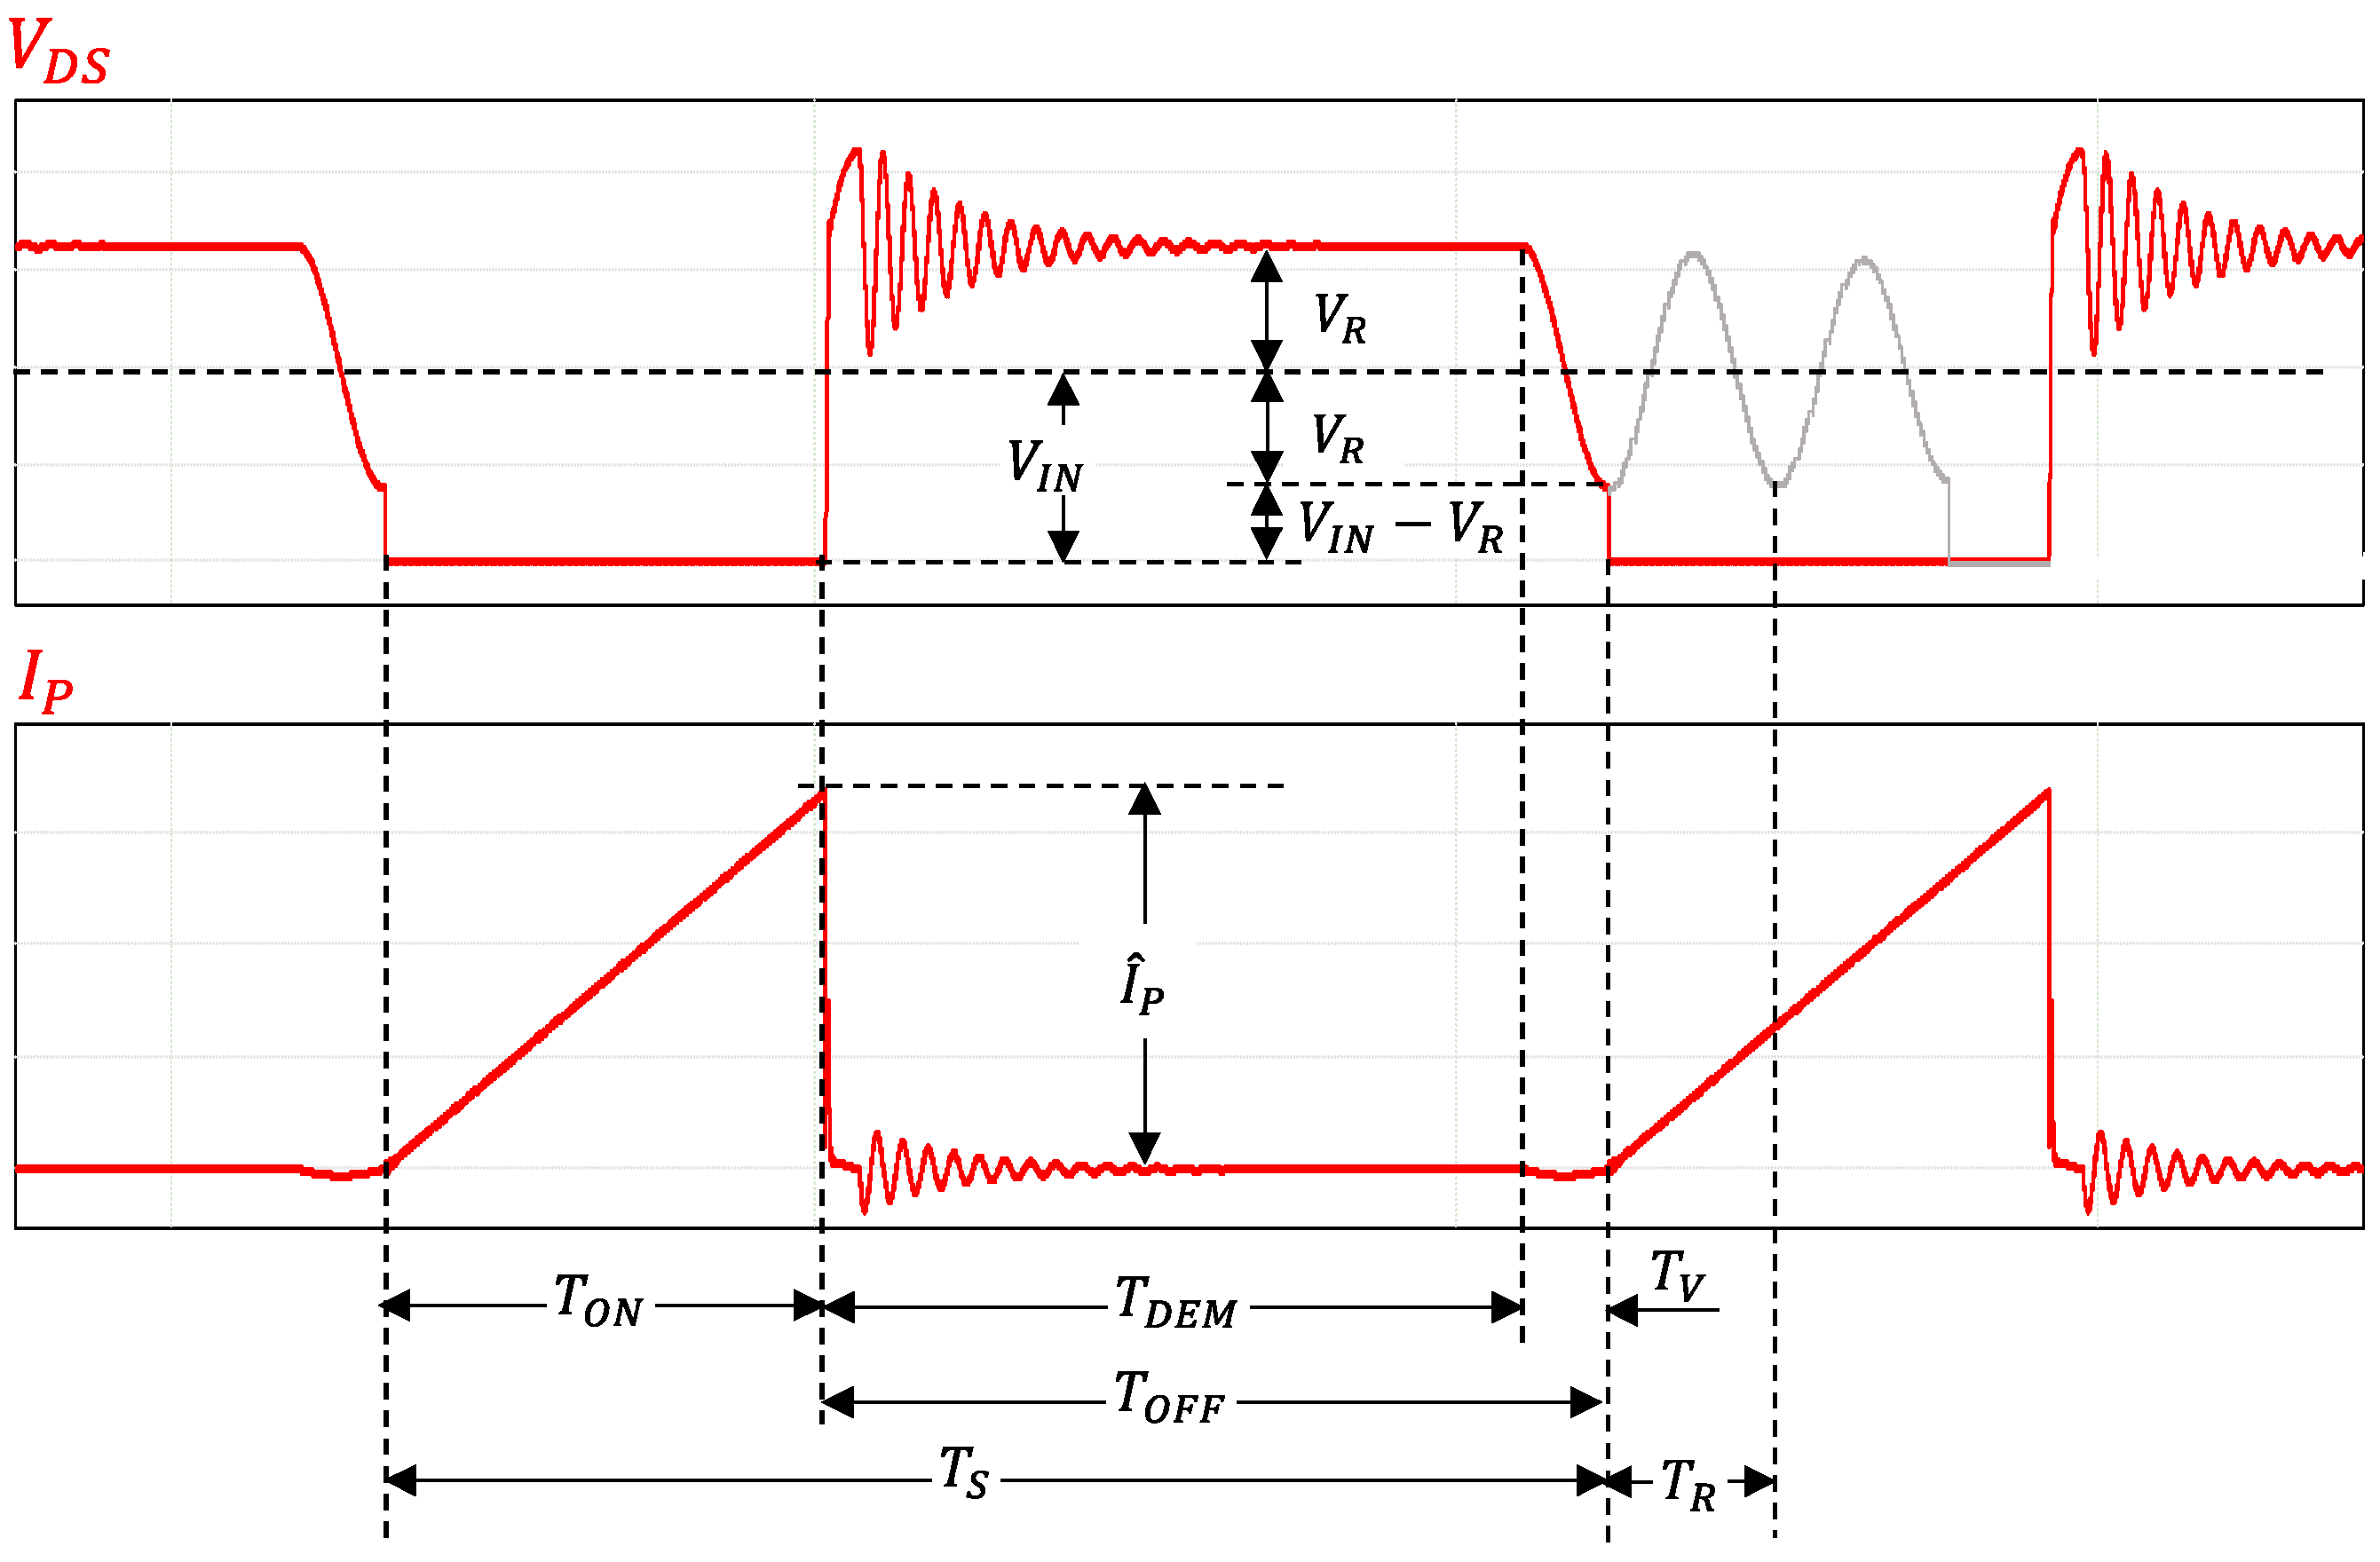
Very often, a Quasi-Resonant Flyback (QRF) converter is used since it does not, by definition, suffer from sub-harmonic instability when operated in discontinuous conduction mode (DCM) at a variable switching frequency. The main waveforms of a QR Flyback are reported in
Figure 3.
The turn-on switching losses, as well as the transformer’s parasitic capacitance losses, are minimized because the power switch always turns on at the drain-source voltage,
, resonant valley; i.e., when
[
23], where
is the input voltage. However, the switching frequency depends on the operative condition once the system’s parameters have been set.
A theoretical analysis of the QR Flyback [
24] reveals that the switching frequency,
FSW, can be set according to the following equation:
where
is the resonance frequency between the transformer’s magnetizing inductance,
, and the drain’s equivalent capacitance
(sum of output capacitance of the power switch,
, and the parasitic capacitance of the transformer,
). Finally,
is the transition frequency, i.e., the frequency necessary to operate in transition mode, i.e., with
, which would occur if
. The transition frequency can be expressed by the formula:
where
is the transformer’s input power and
.
The efficiency of the transformer is typically quite high, then
is approximately equal to the input power of the converter,
,. Given that the QRF is operated in DCM, the primary current is given by:
where
is the output power and
is the efficiency of the DC-DC converter.
In most practical cases,
, then
. In this case, combining (3) and (4) it follows that:
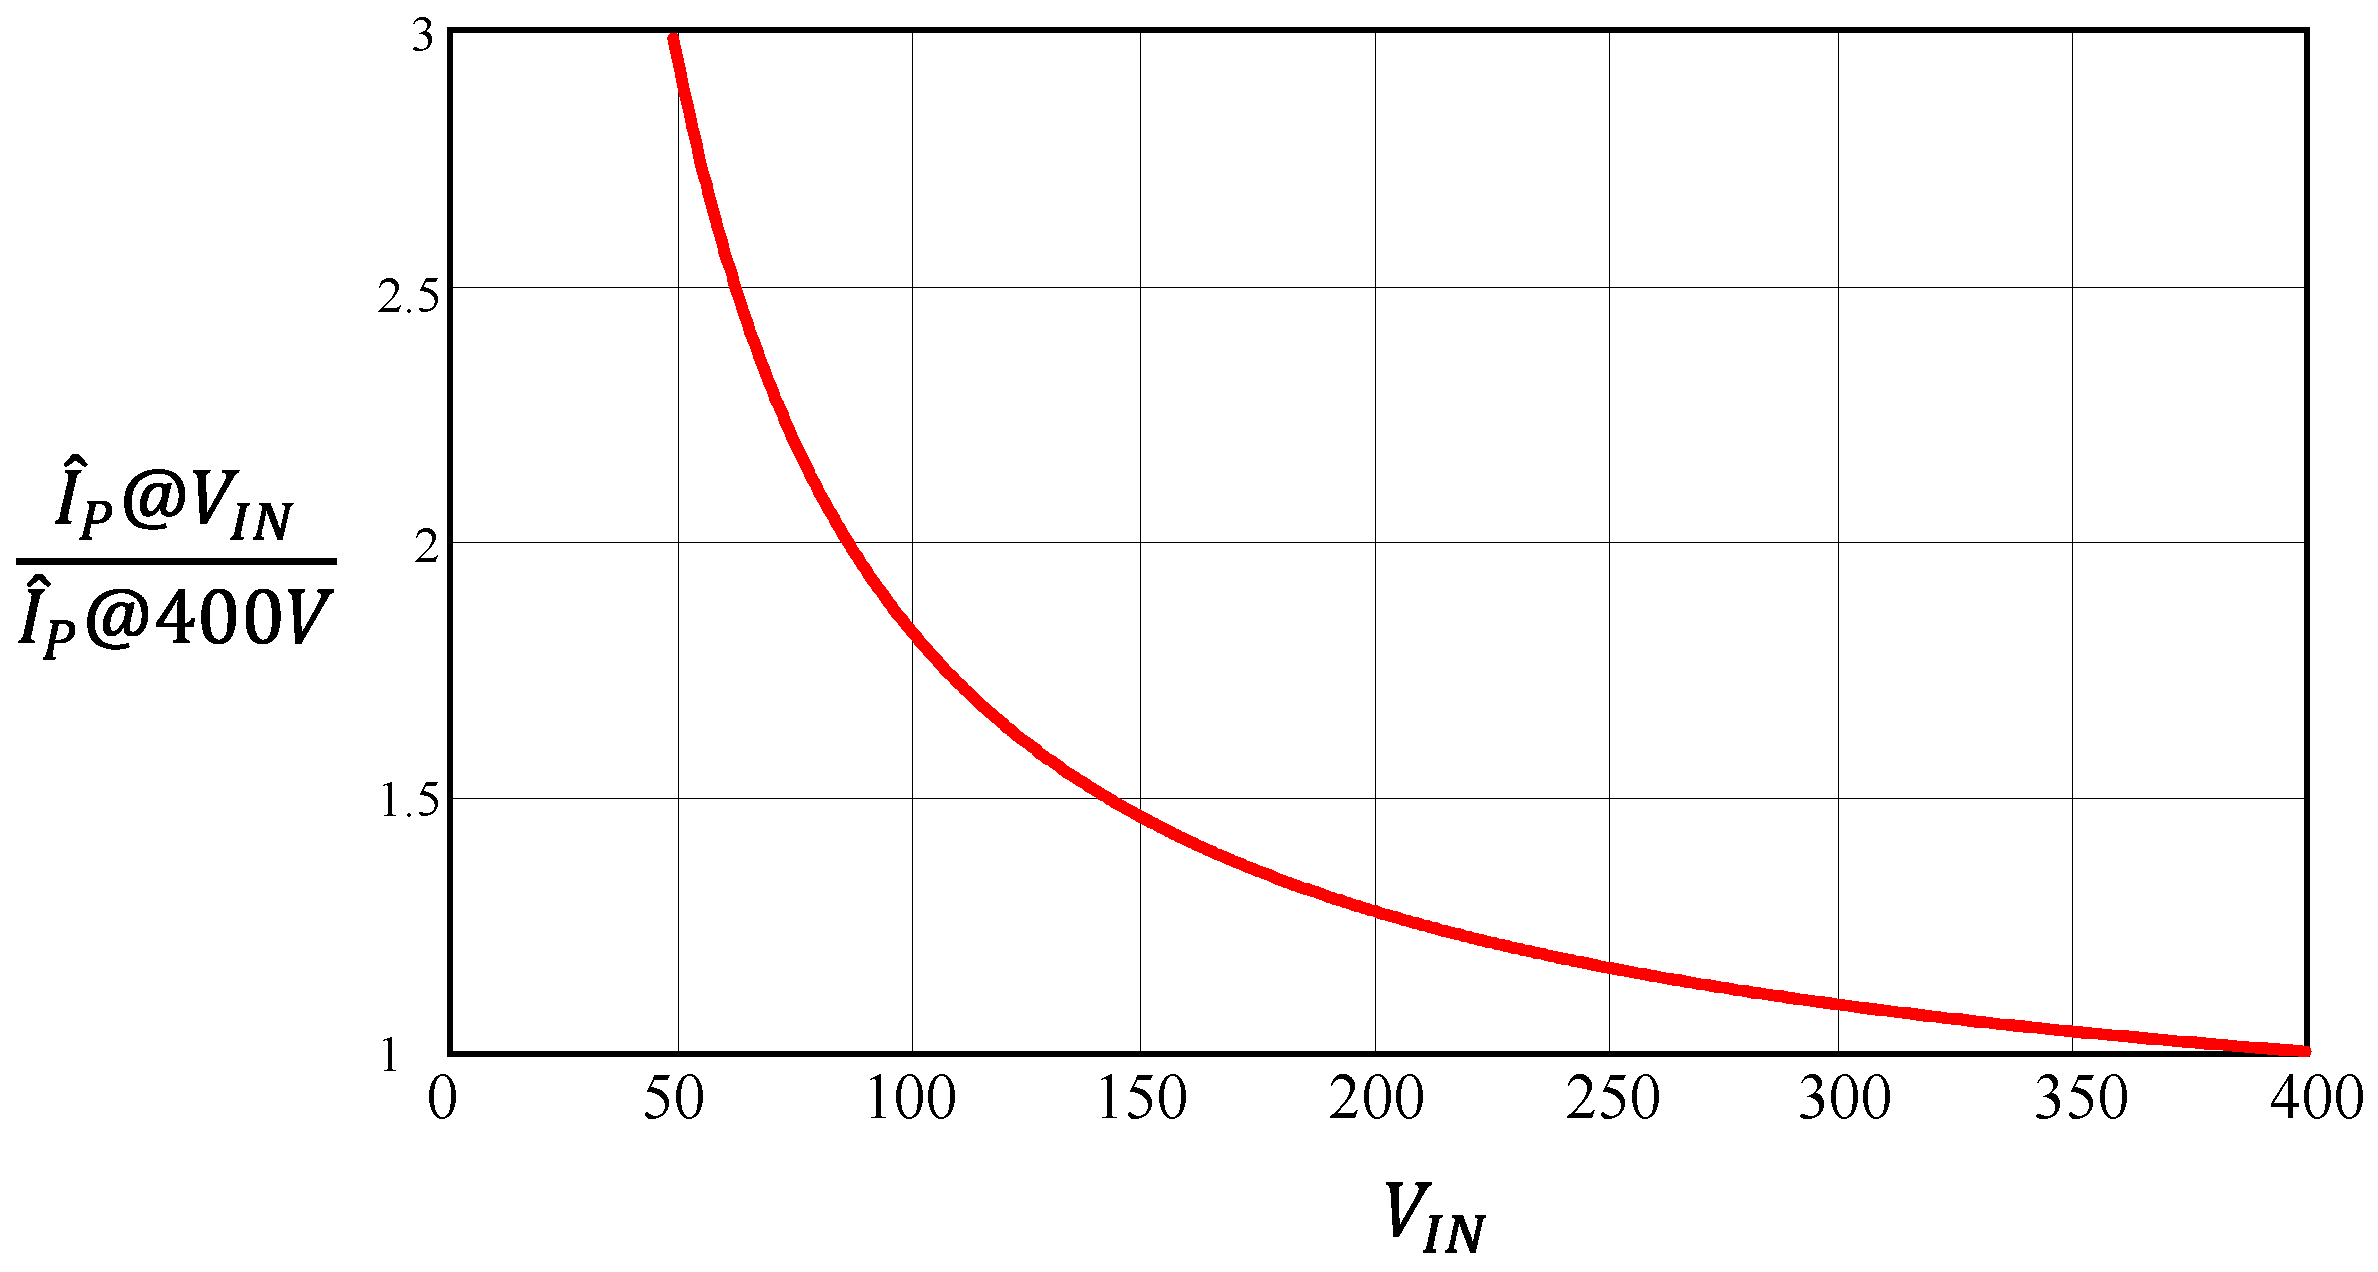
Equation (5) shows that the primary current increases when the input voltage decreases for a given output power and assigned reflected voltage.
Figure 4 shows a typical trend of the normalized primary current
as function of the input voltage, at 150 W and with a reflected voltage of 150 V. It is possible to note a significant difference between the values of the current at 400 V and at the minimum input voltage.
In many commercial PCM flyback controllers, the max primary peak current,
, is limited to a value beyond which the converter cannot be regulated, and overload protection intervenes. Therefore, it is important to ensure that, during both steady state operations and transient loads, the condition
is always satisfied. Consequently, when the PFC is turned on, the minimum voltage at the input of the converter,
, must satisfy the following inequality:
The increment of , to meet the inequality, must be limited, because it needs an increase in the transformer and bulk capacitor size which will prevent high power density. Therefore, the previous techniques are not the best solutions to adopt. In the next section, our proposed innovative approach to control the PFC is described. It intermittently turns the PFC on and off in a so-called hiccup mode that addresses the aforementioned issues while increasing the overall converter efficiency.
3. Hiccup Mode Operating Principle
The control technique consists of intermittently turning off the PFC according to a new strategy that accounts for the output power.
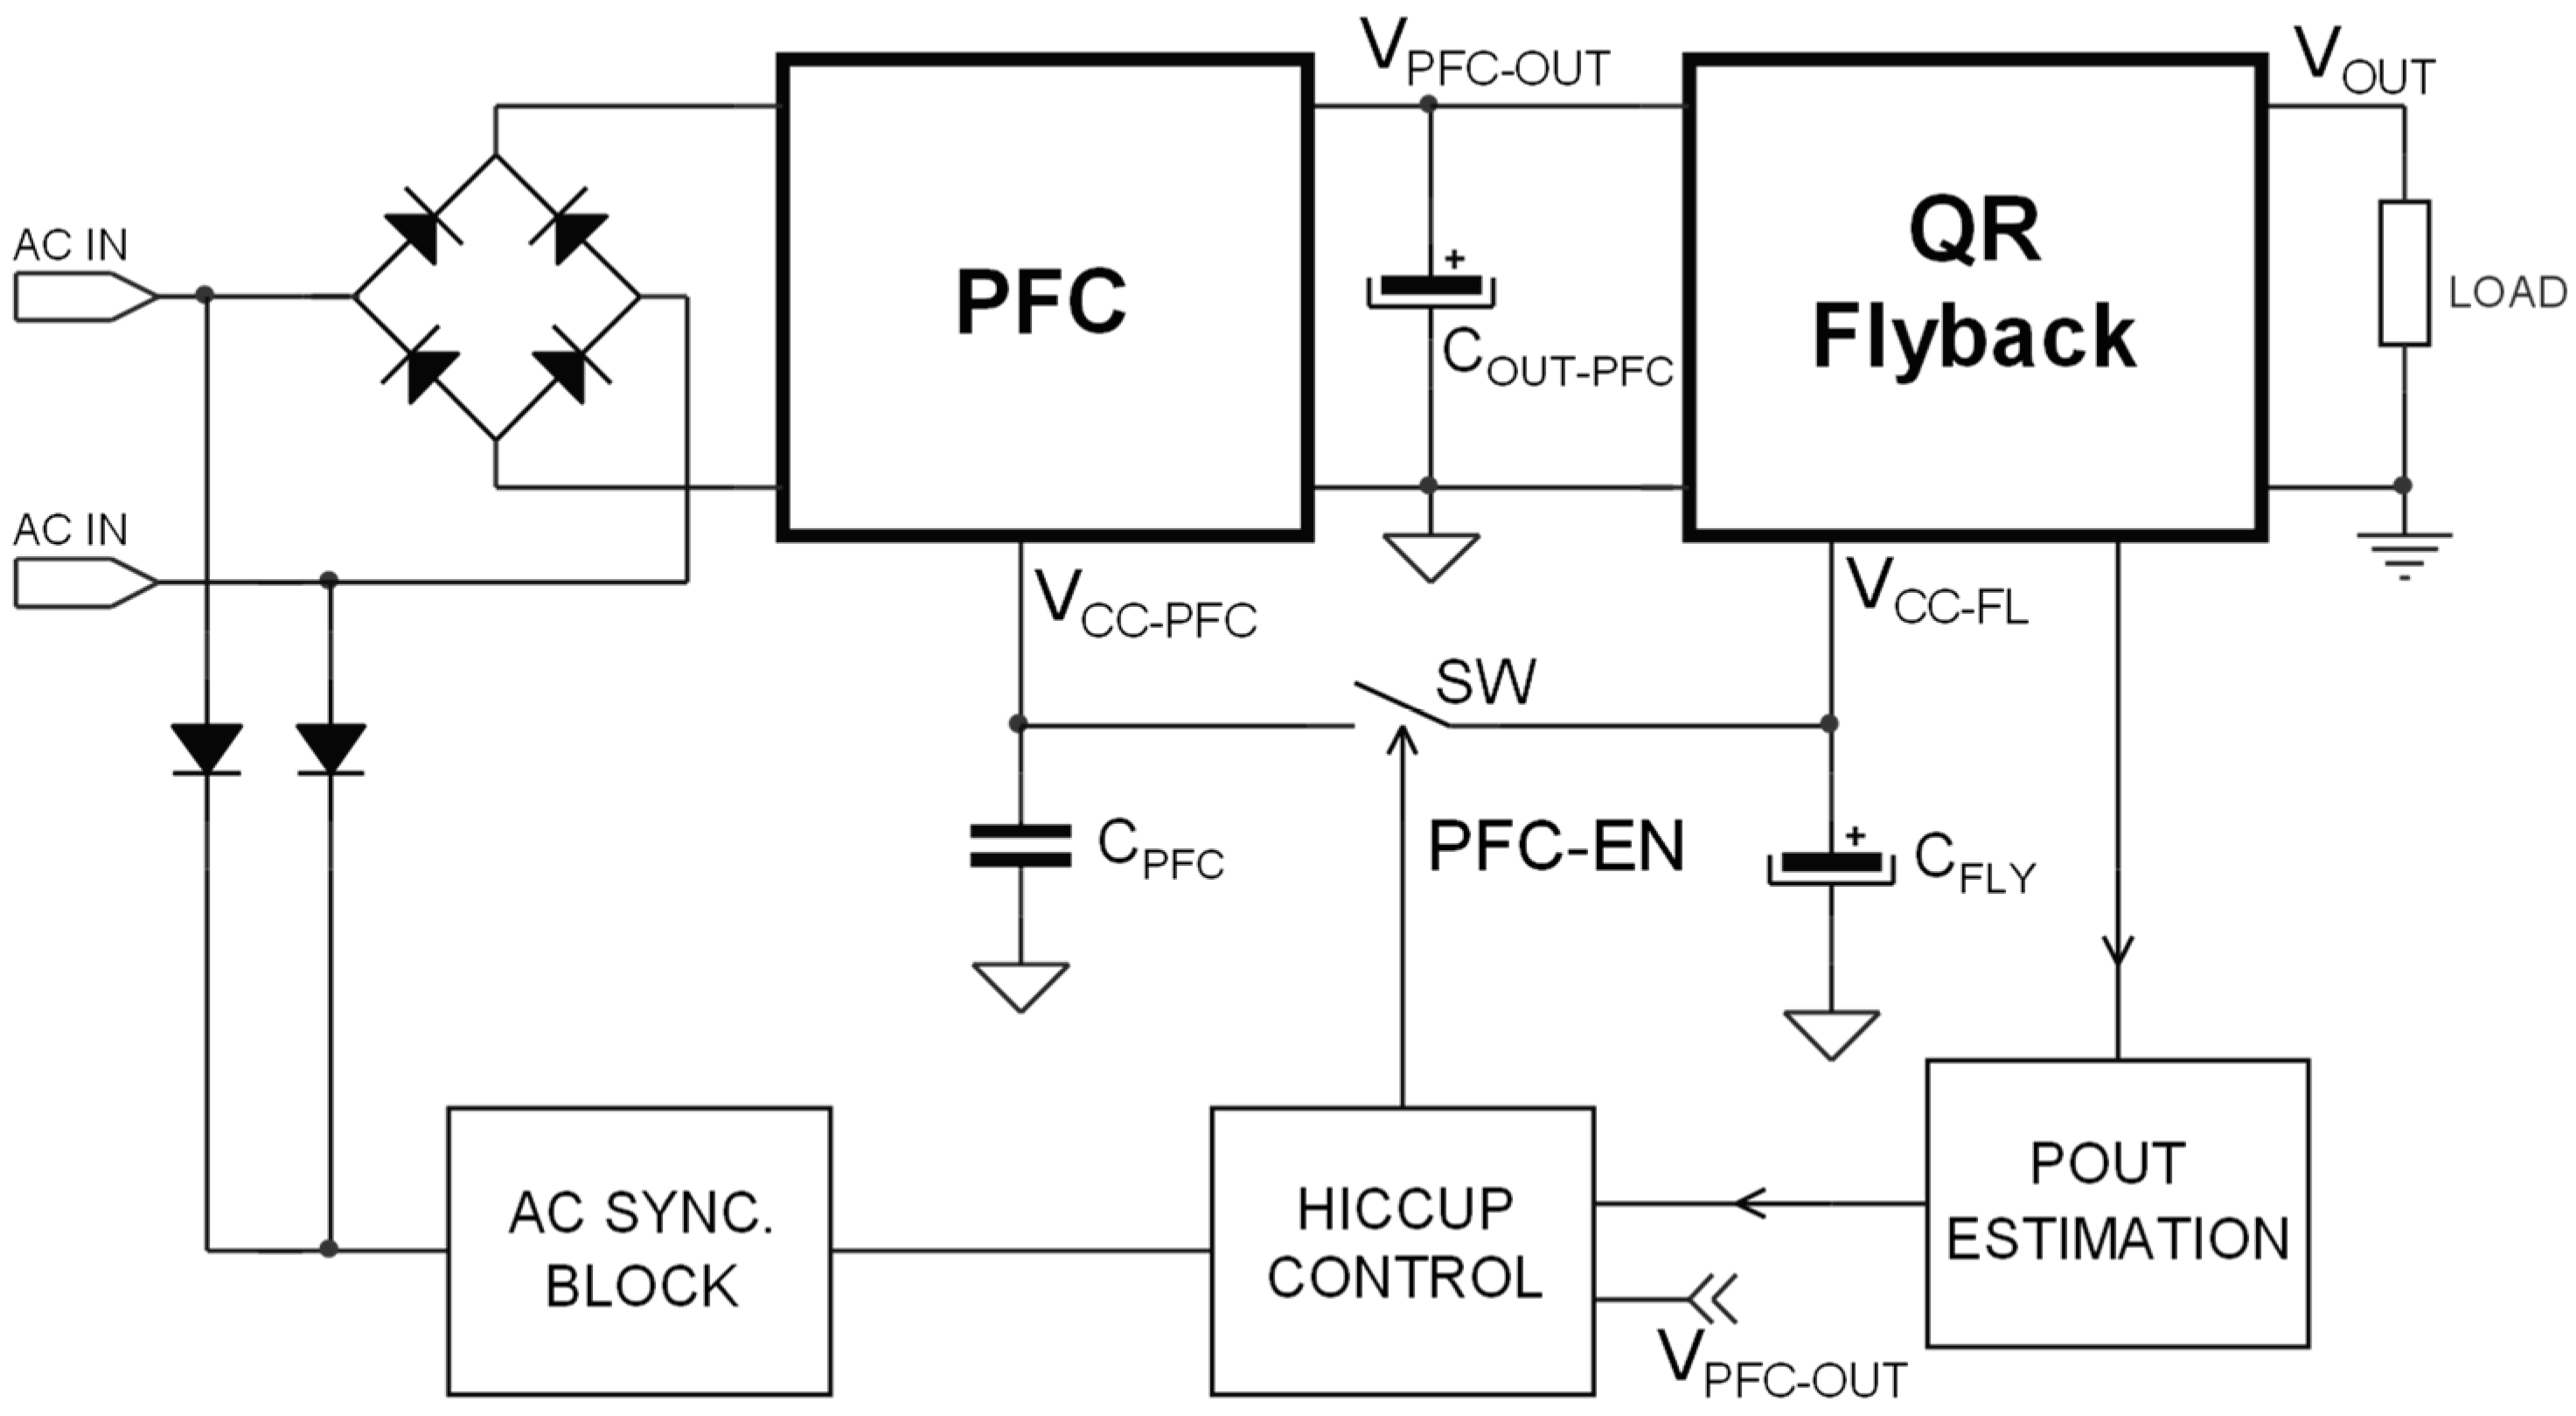
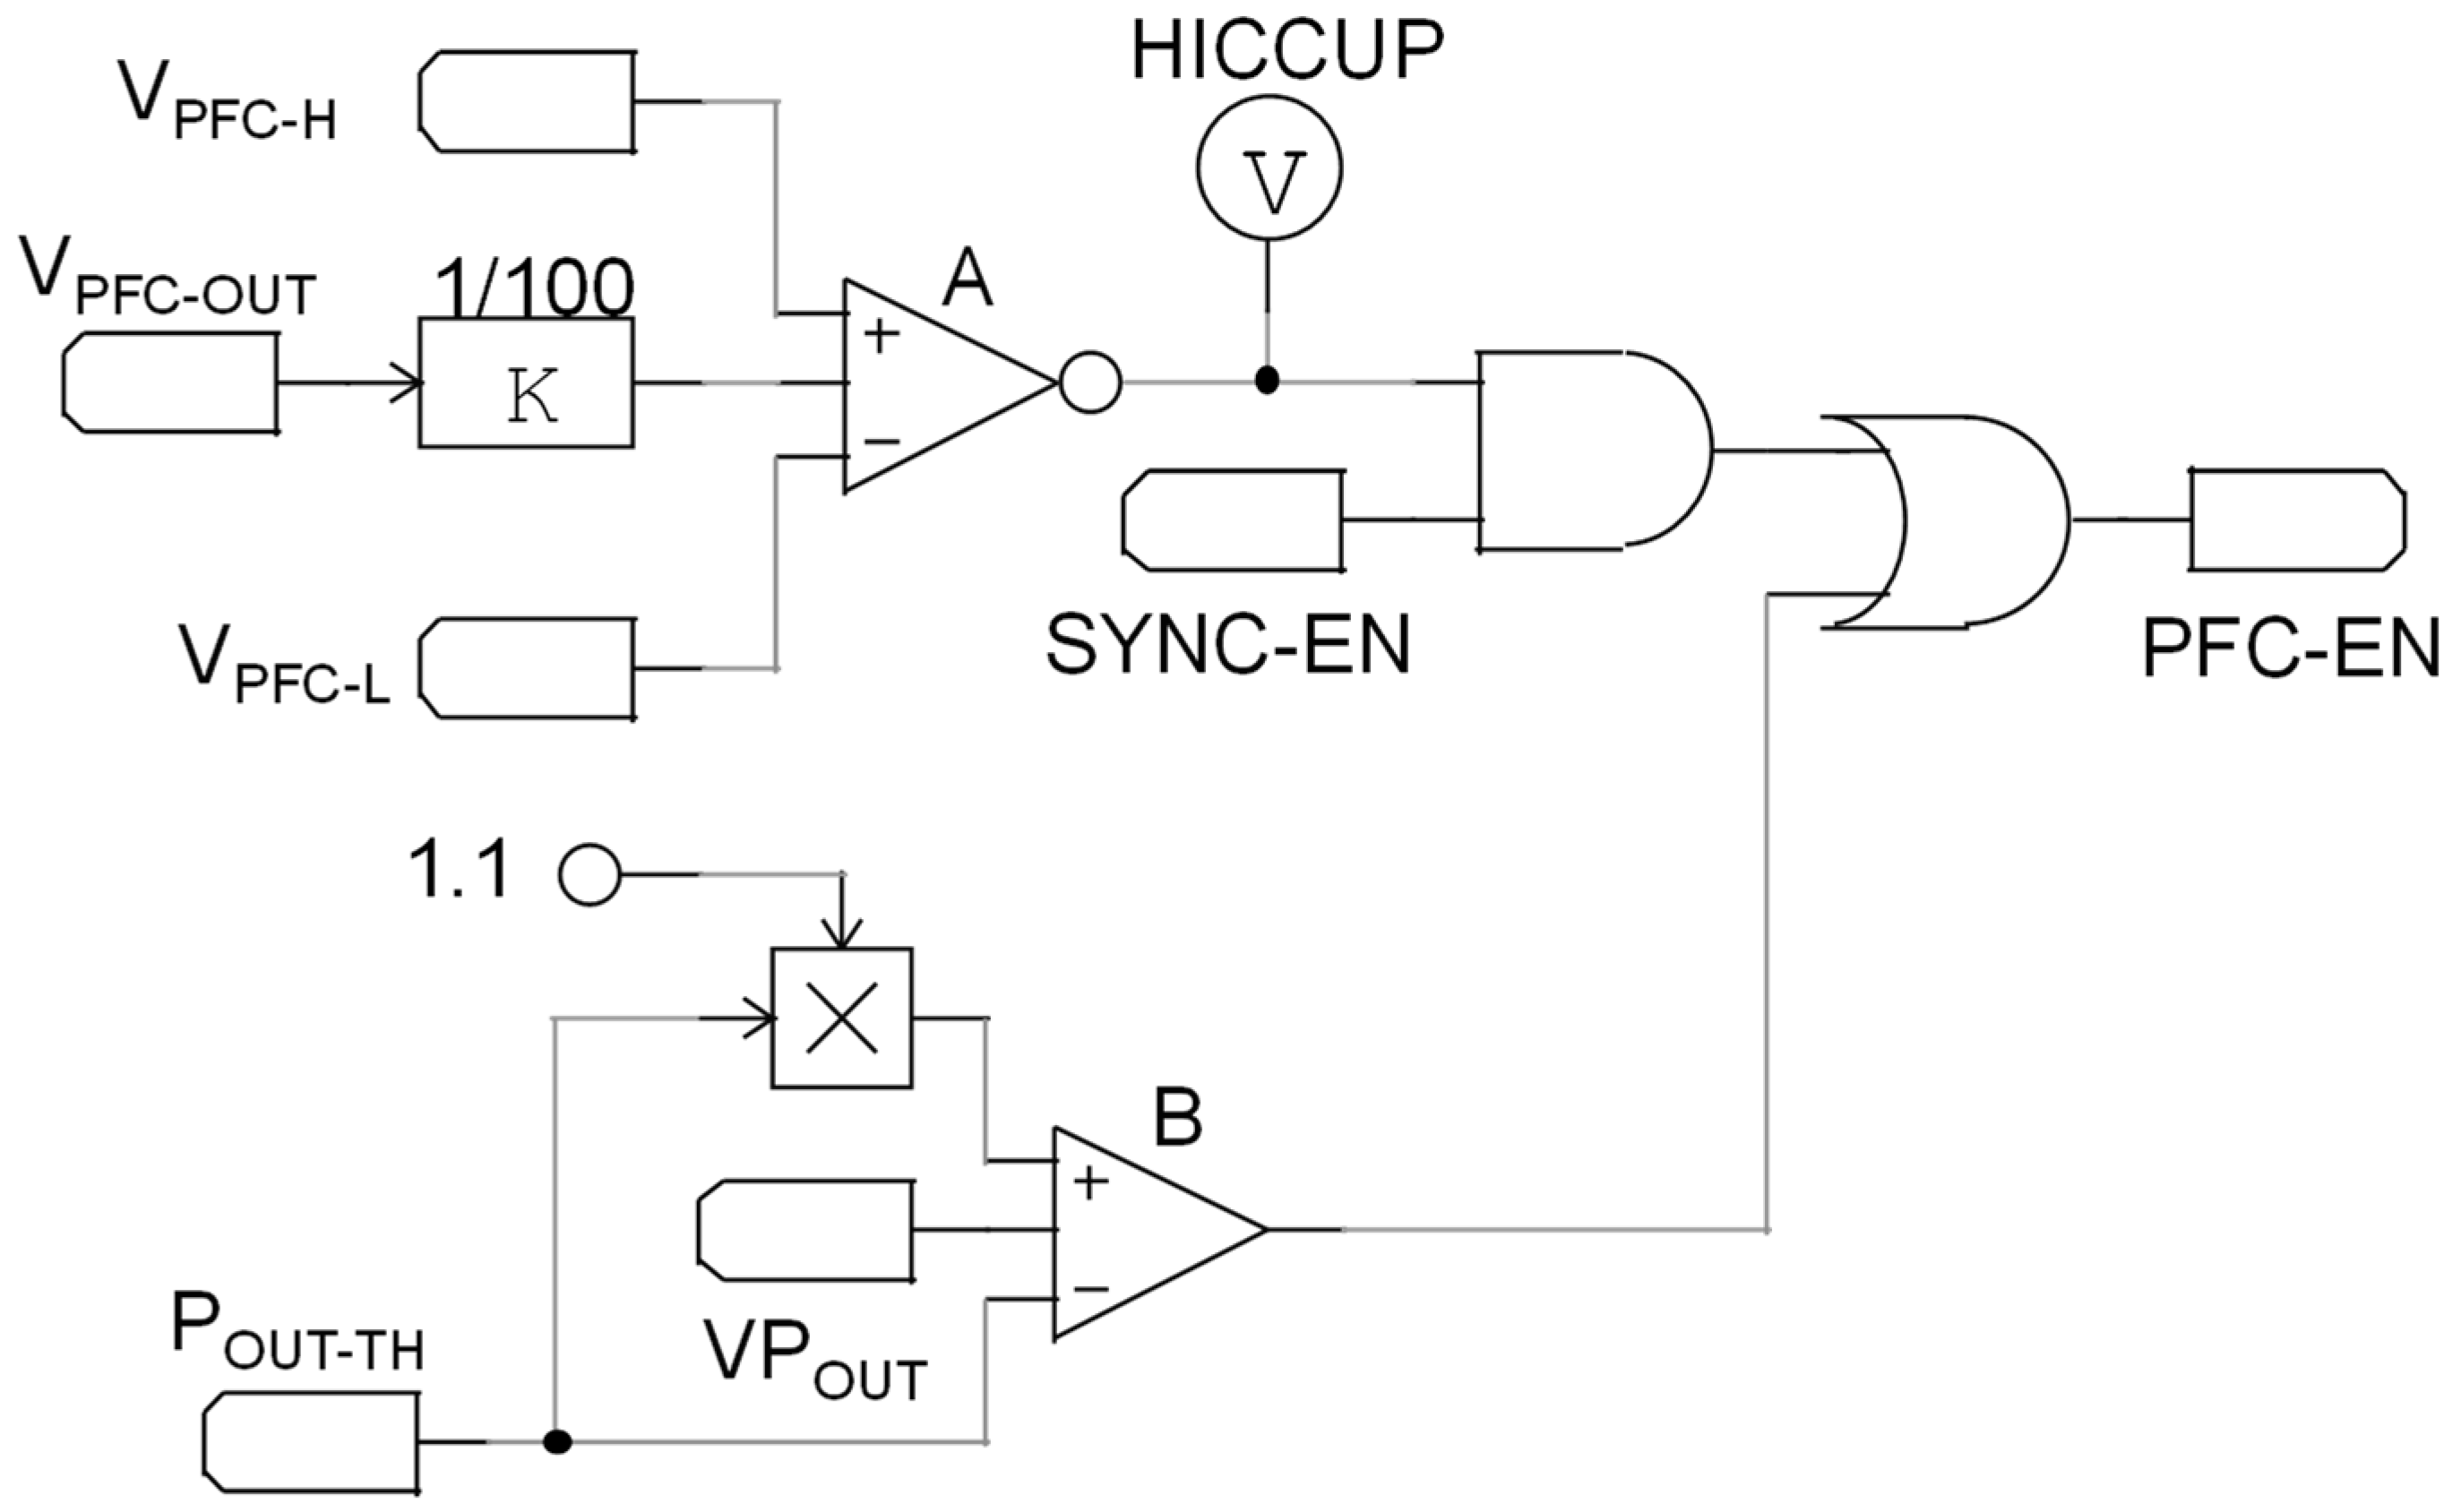
Figure 5 shows a simplified block diagram of the implementation of the proposed hiccup mode (HM) management and
Figure 6 shows its key waveforms.
The Hiccup Control (HC) block receives information about both the output power from a Pout Estimator (PE) block, and the output voltage of the PFC, . The HC block drives a pass switch, , that directly connect the supply pin of the PFC, , to the supply voltage pin of the flyback, .
During operations, the HC logic monitors the output power of the converter and compares this value with an internal threshold,
. As reported in
Figure 6, if
, HC keeps
closed and the system operates like classic two-stages converters: the flyback converter operates with an almost constant input voltage
, while the PFC stage absorbs an input current in phase with the line voltage. During this interval, the input PF is maximized and the THD is reduced below the limits imposed by the IEC61000-3-2. The system’s total efficiency is given by the product of the efficiency of the two power stages.
Conversely, as soon as
goes below the power threshold
, the HC block opens
to activate the hiccup mode: since the value of the capacitor
is in the range of a few hundreds of nF (and
), the voltage
is rapidly discharged down to its undervoltage lockout (UVLO) threshold by the PFC supply current, and the PFC itself is completely shut down. As reported in
Figure 6, at this point the voltage
is discharged from the original steady state value
down to a voltage
. Once this new threshold is reached, the HC turns on the PFC again by connecting, through SW, the flyback’s supply voltage
to the capacitor
. Therefore, during hiccup mode, the PFC will operate with an output voltage comprising between
and
. In this case, the output voltage of the PFC is reduced and kept to a value that will permit the flyback converter to transit from a light or no-load condition to a full load condition without triggering overcurrent limitation (OCL) protection, thus maintaining output voltage regulation. Another important benefit is that, since the flyback converter operates with a lower input voltage, its turn-on switching losses are reduced as well.
The overall efficiency of the converter will be:
where
and
are, respectively, the efficiency of the PFC and of the flyback, whereas
and
are, respectively, the on time and the off time of the PFC during the hiccup mode.
From Equation (7), the average efficiency of the system during hiccup mode is computed as:
Defining
as the “duty-cycle” of the PFC activation during hiccup mode:
and combining (8) and (9), it is straightforward to derive the following equation:
Equation (10) clearly shows that the overall efficiency of the converter increases as the PFC activation time decreases.
During the hiccup mode operation, the PFC output voltage is reduced compared to the value during the steady state. Therefore, an additional advantage of the proposed control is that the flyback converter operates with lower voltage on the drain node which, in turn, leads to a reduction in the turn-on switching losses as well as the transformer’s parasitic capacitance losses [
23].
It is worth noting that the control methodology is fully compatible with any PFC-integrated circuit, as it is turned off using . As explained before, to meet regulation requirements, the PFC can be turned off only below a certain output power level. Therefore, the PE block is one of the essential parts of the system: output voltage and output current can be either directly measured or estimated, then combined in an analog multiplier to obtain the required output power estimation.
During the hiccup, when the voltage
is discharged down to
, the control logic may restart the PFC, to recharge
regardless of the phase angle of the input voltage main. The key point is that the PFC is very efficient near the peak of the sinusoidal input voltage and much less efficient near the zero-crossing region. Maximization of efficiency can be then achieved if the PFC is set to operate only when the phase angle is between
π⁄4 and 3
π⁄4 [
25,
26]. Referring to the input voltage
, the previous condition is met if
; i.e., when
is greater than or equal to
. Therefore, during hiccup mode, if the PFC is synchronized to turn on with an input voltage equal to or higher than 70% of its peak value (
), its efficiency is maximized.
In summary, the proposed method provides higher efficiency at medium or light load in comparison with [
15] thanks to the control of the PFC output capacitor voltage. Moreover, it presents a lower THD. An efficiency better than [
16] is also achieved at these loads levels since the proposed method avoids enabling the PFC where there are high switching losses. Faster responses and lower cost are the advantages with respect to the method described in [
17]. Finally, the advantage of the proposed method in comparison with [
18,
19] are as follows: lower flyback size and cost; prevention of undershoots, and the prevention of overload triggering.
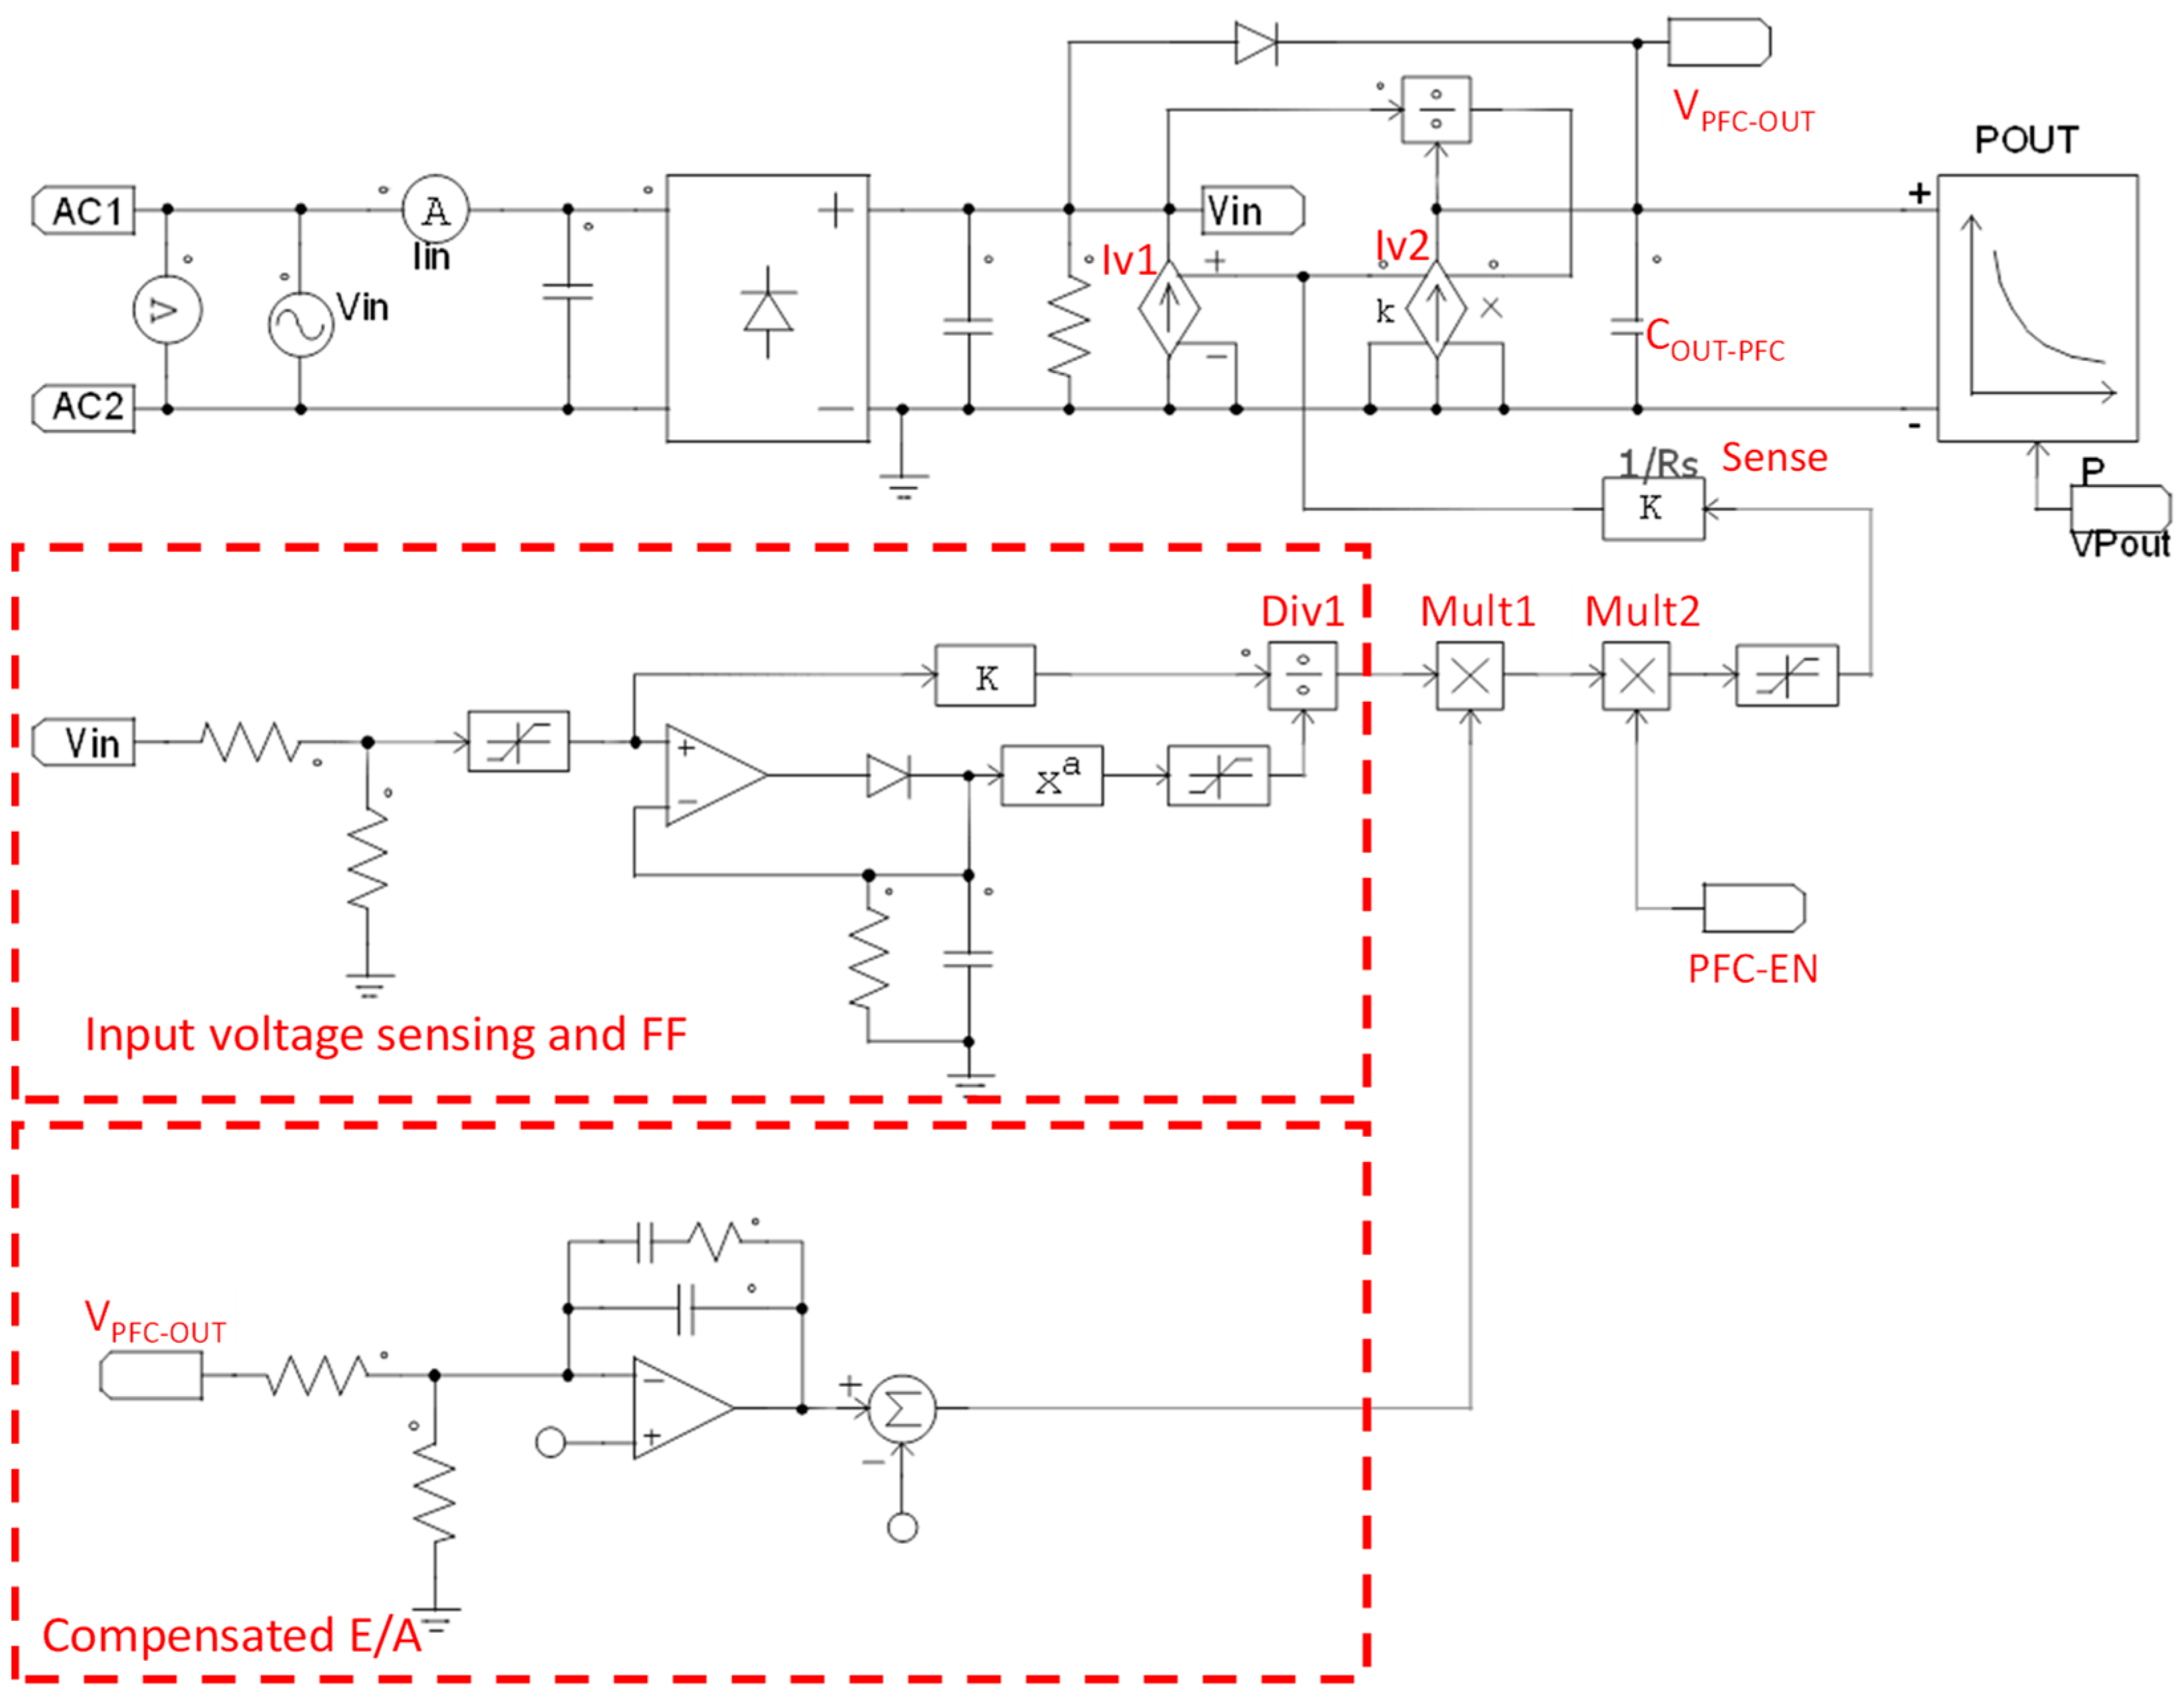
4. Simulation Results
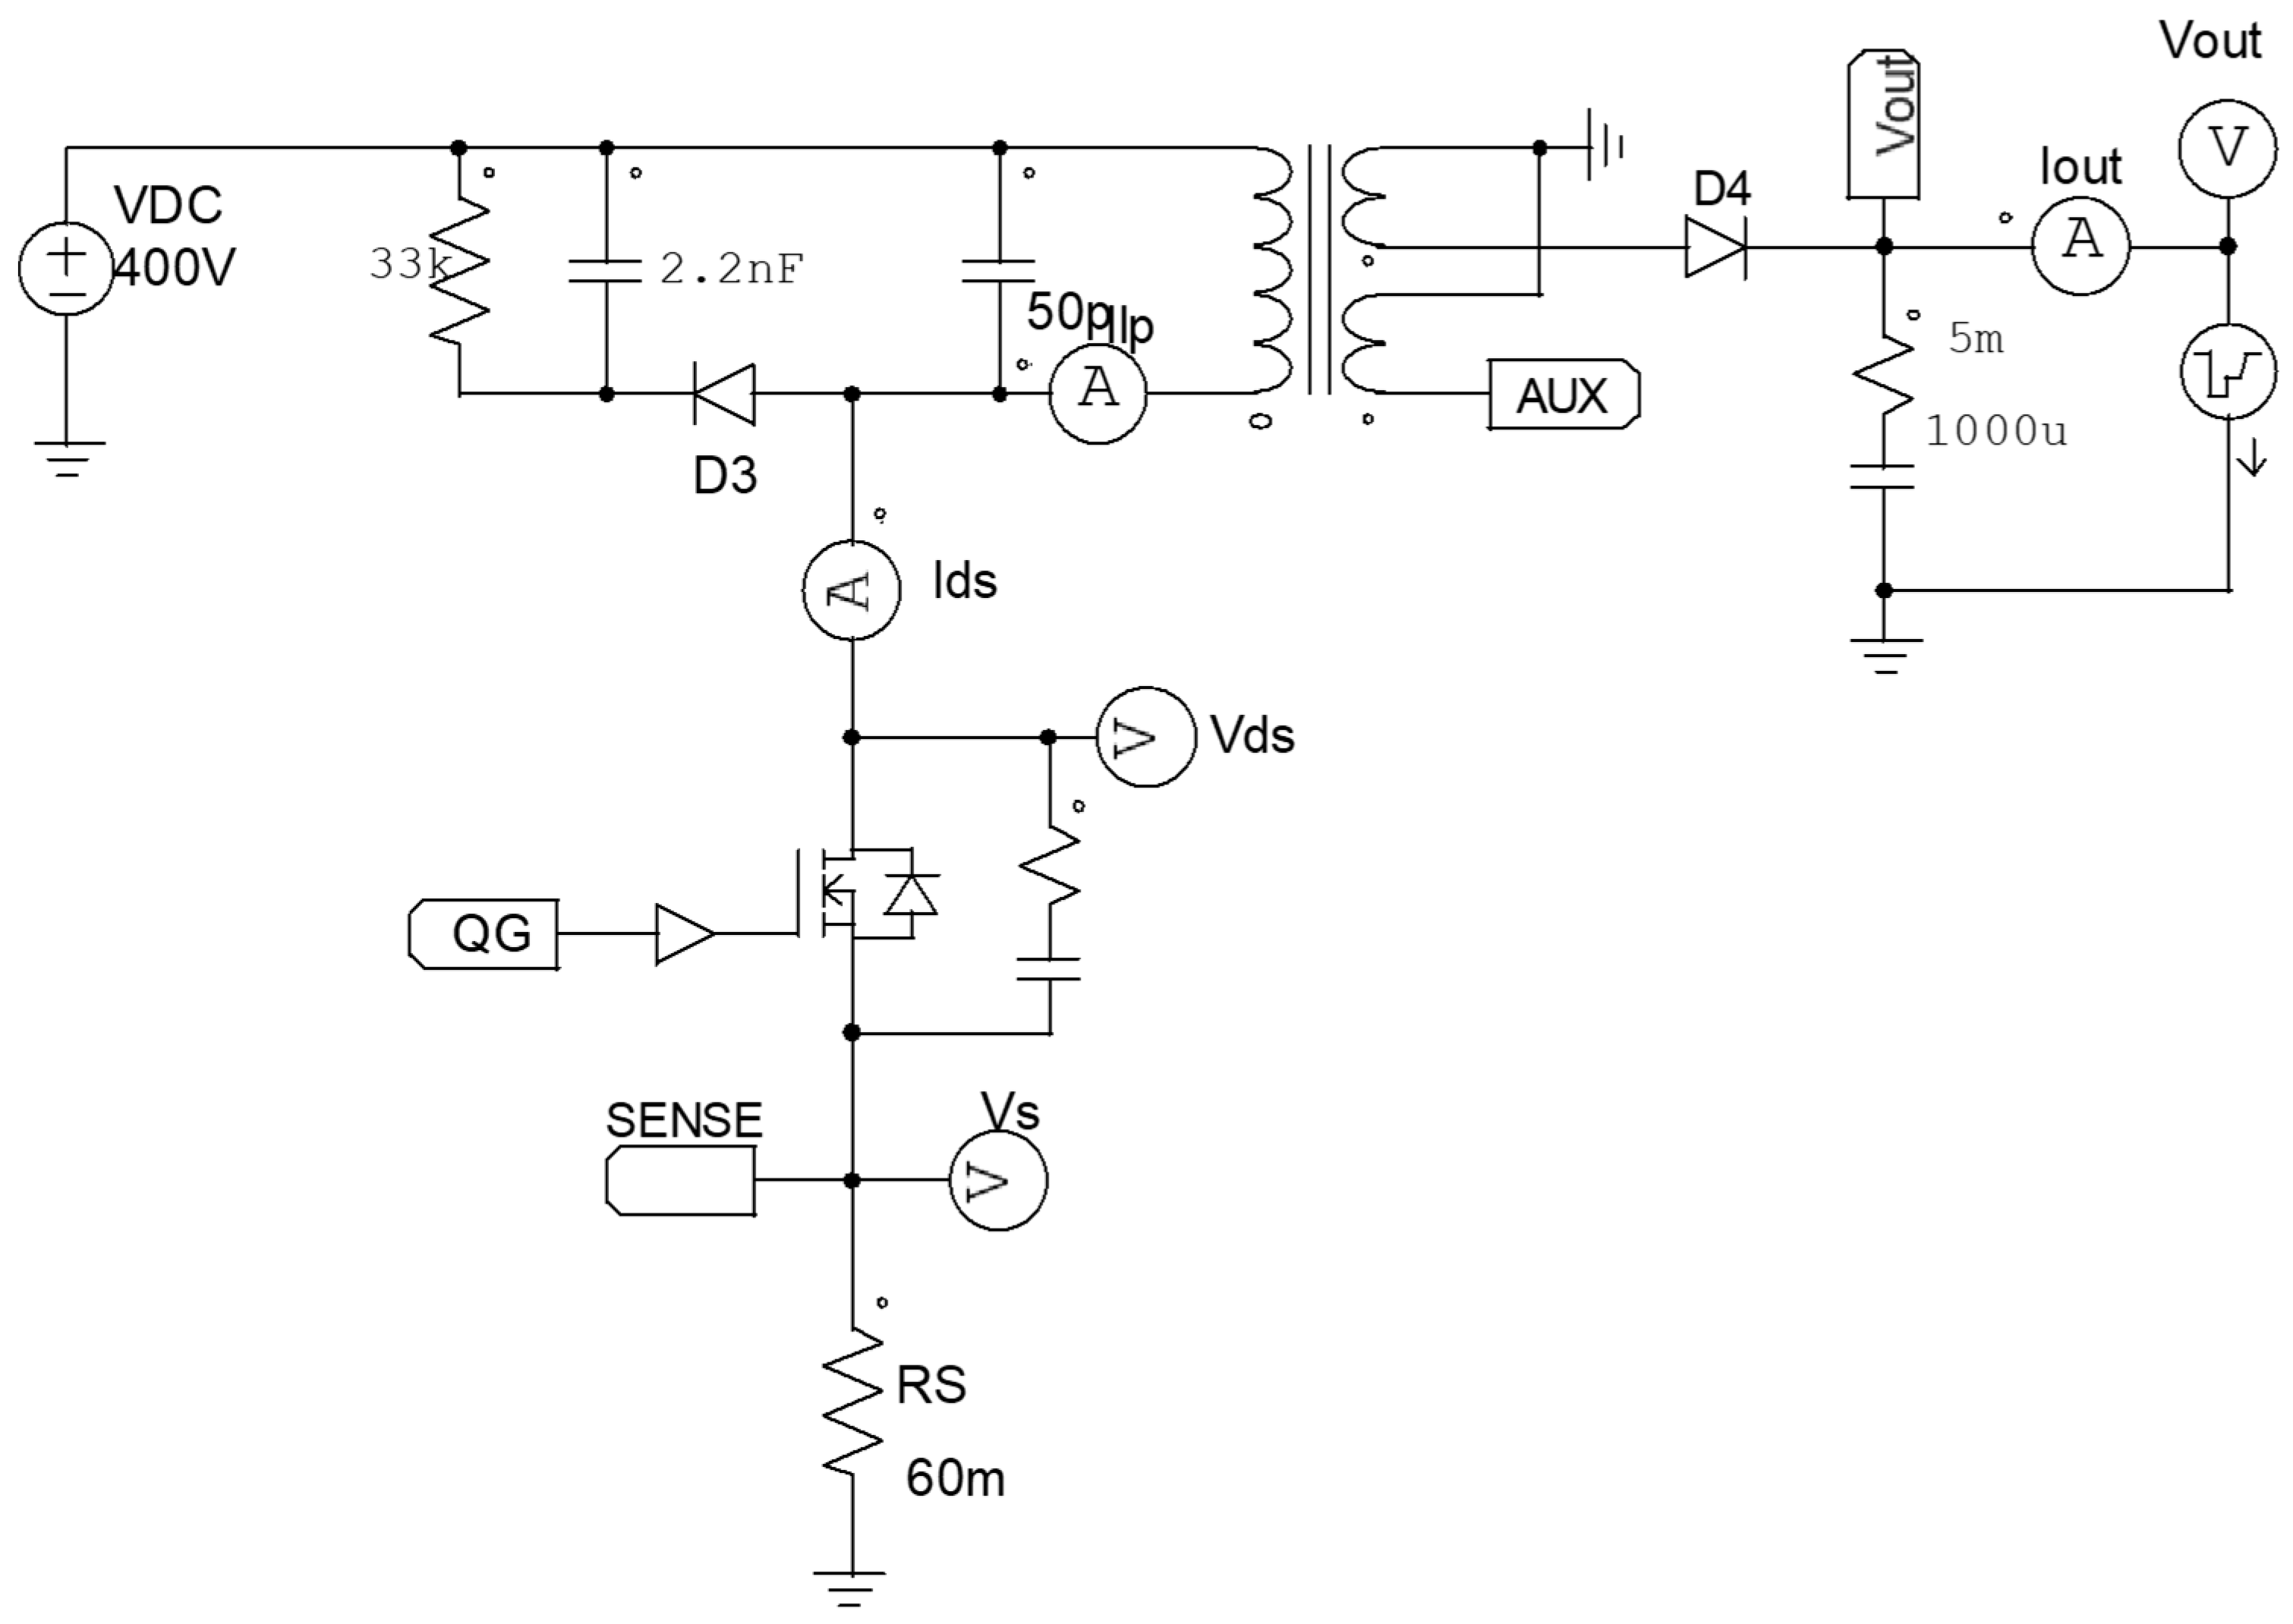
The PFC of the block schematic of
Figure 5, designed to provide an output power of 100 W, has been simulated to validate the hiccup mode concept. Since an accurate analysis requires a simulation several seconds long, a simplified PFC average model has been developed, as shown in
Figure 7. The software PSIM rev2022.1.0.8 has been used for this purpose. The model is based on two voltage-controlled current sources,
and
. The current source
draws a current proportional to the rectified input voltage wave, ensuring that the input voltage and current are in-phase sinusoidal waveforms. The current source
models the sine-squared current that charges the output capacitor
, maintaining output voltage regulation.
Both current sources are controlled by the output voltage of the multiplier Mult1 by a transconductance gain equal to . In detail, the output voltage of Mult1 is obtained by multiplying the signals from the compensated error amplifier with those from the input voltage sense and feedforward block. It is worth noticing that the input voltage feedforward compensation is proportional to .
The purpose of multiplier Mult2 is to model hiccup mode behavior. When hiccup mode is not activated, the HICCUP_EN signal is set high, and the PFC operates in normal mode. Conversely, during hiccup mode, the HICCUP_EN signal is toggled between high and low to determine whether the PFC should operate or be in an idle state.
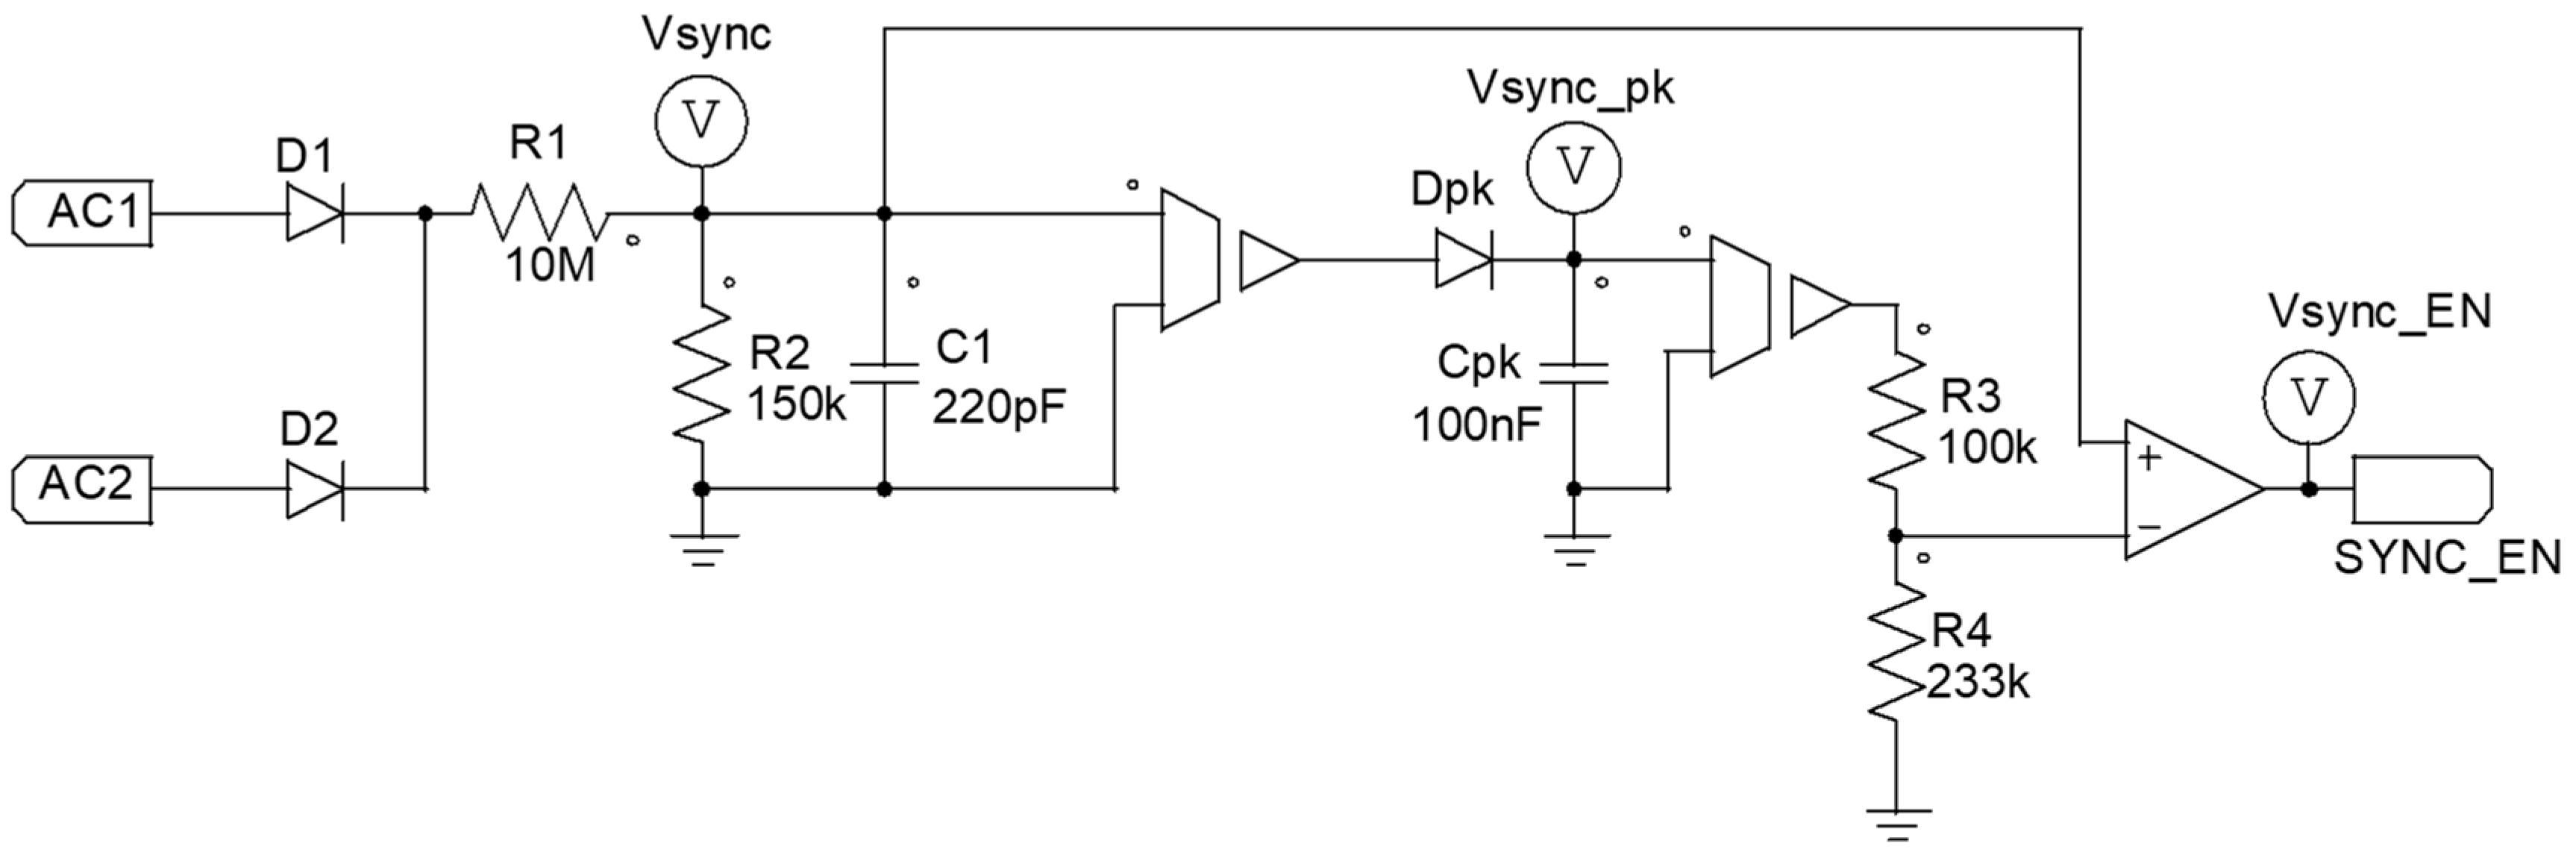
Figure 8 shows the simulation model of the AC synchronization block of
Figure 5, which synchronizes the PFC activation with the AC line during the hiccup mode. Diodes
and
are directly connected to the AC line, and resistors
and
, and capacitor
, are used to reduce its dynamic. The resulting voltage,
, is then compared with a signal that is the 70% of its peak value: a peak detector made by
and
, and a voltage divider made by
and
, are used for this purpose.
Finally, the output of the comparator,
, is set high to enable the PFC to switch within the input voltage window ranging between
and
. This time activation,
, is not constant but depends on the main input frequency: the circuitry of
Figure 8 automatically adjusts this time duration over different frequencies of
.
Figure 9 shows the model of the hiccup control block of
Figure 5. Comparator “B” compares the signal representative of the output power,
, with the power threshold
to enter hiccup mode. When the output power is
, the comparator’s output is set to low, disabling normal mode, and forcing hiccup mode activation. This comparator is also provided with hysteresis that allows the converter to exit hiccup mode with an output power
, which is 10% higher than
.
Comparator “A” is used, during hiccup mode, to set the PFC to operate with an output voltage ranging between
and
. The signal
, from the circuit of
Figure 8, is used to synchronize the PFC to switch only within the time window
.
The main electrical characteristics of the PFC and the main simulation parameters of the related hiccup control circuitry are given in
Table 1.
The simulation in
Figure 10 shows the output power transition of the PFC from 100 W to 40 W. Since the threshold
is set to 50 W, as soon as
crosses this limit, the PFC enters hiccup mode: the PFC output voltage
is discharged from the steady state value of 400 V down to
, then it restarts up to
, thus operating intermittently between these limits until the output power
is increased again above the
threshold.
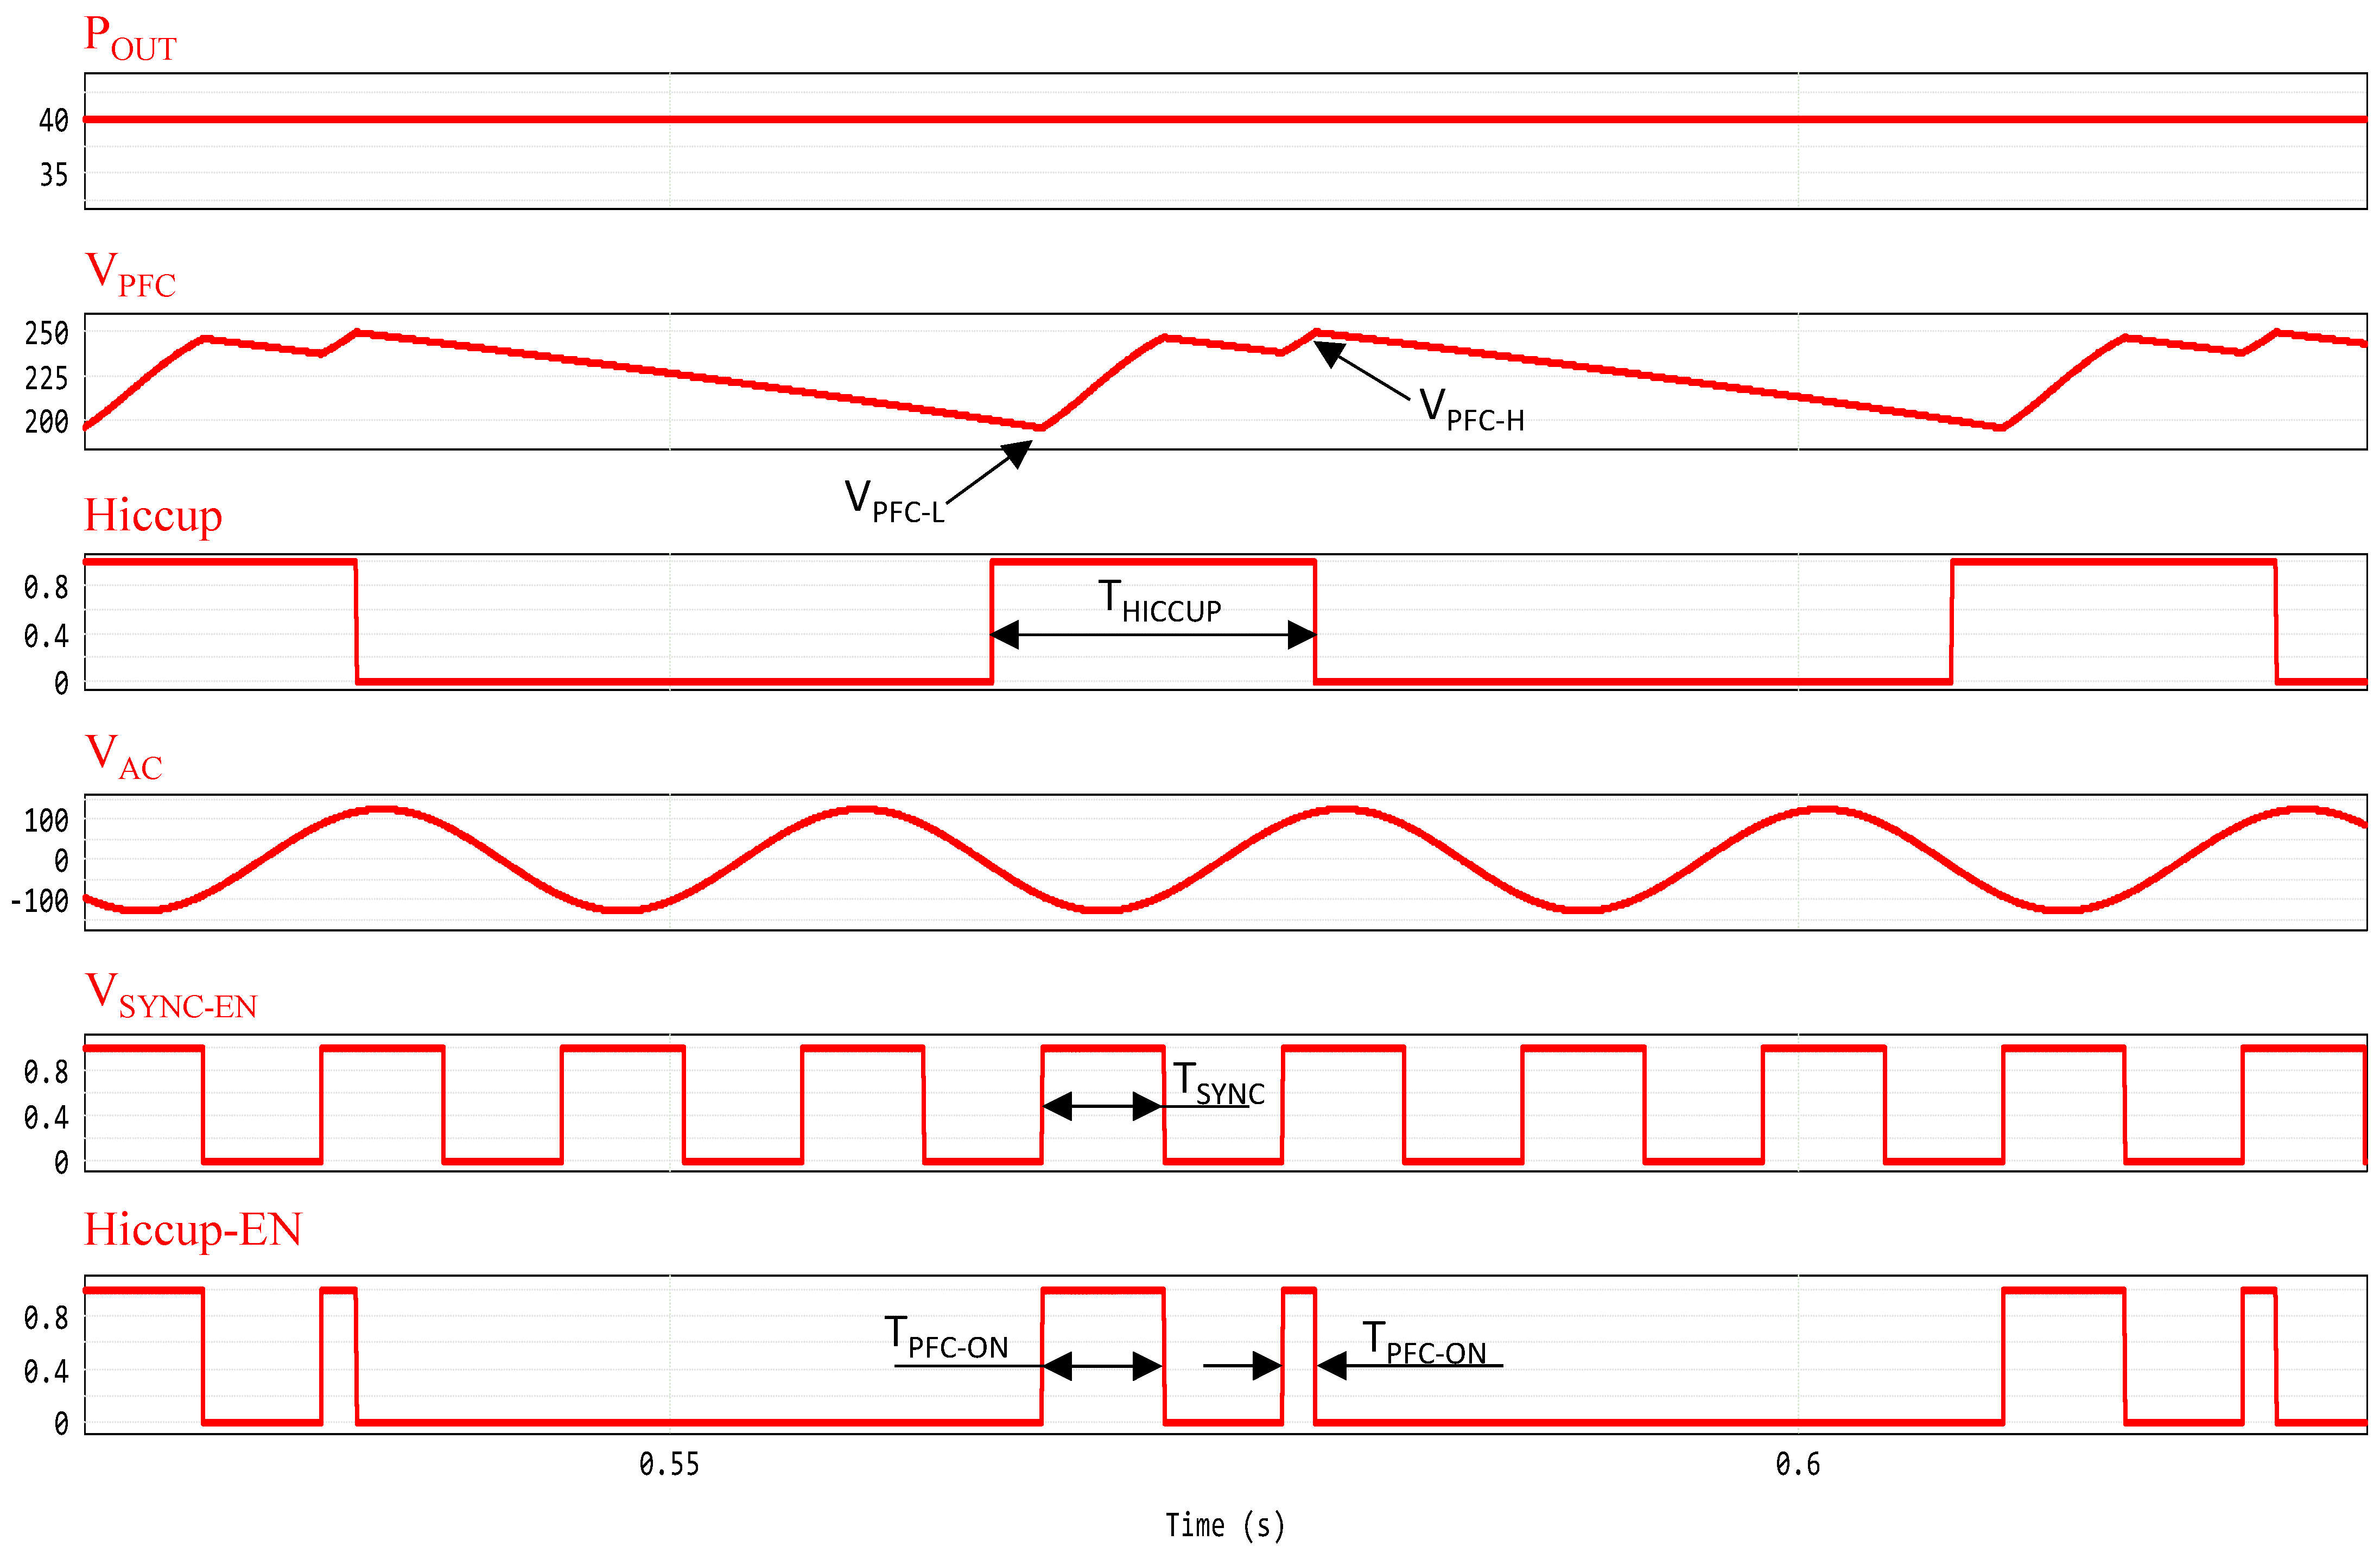
The simulation in
Figure 11 shows the magnification of the simulation of
Figure 10, during hiccup mode. When the PFC output voltage
crosses the threshold
, the output of the comparator “A” from
Figure 9, named
, is set to high; thus, the PFC is enabled to restart. It will restart only when the
signal is also set to high, indicating that synchronization circuit from
Figure 8 has detected an input voltage ranging between
and
. As a result, the PFC will be turned on when
is high, within the time interval
shown in
Figure 11. It is worth noticing that if
does not reach the value
within the time interval
, the PFC will be turned off regardless, and will eventually be turned on at the next activation of the synchronization window to complete the charge phase of
.
A 100 W QR Flyback converter with the electrical characteristics given in
Table 2 has been simulated.
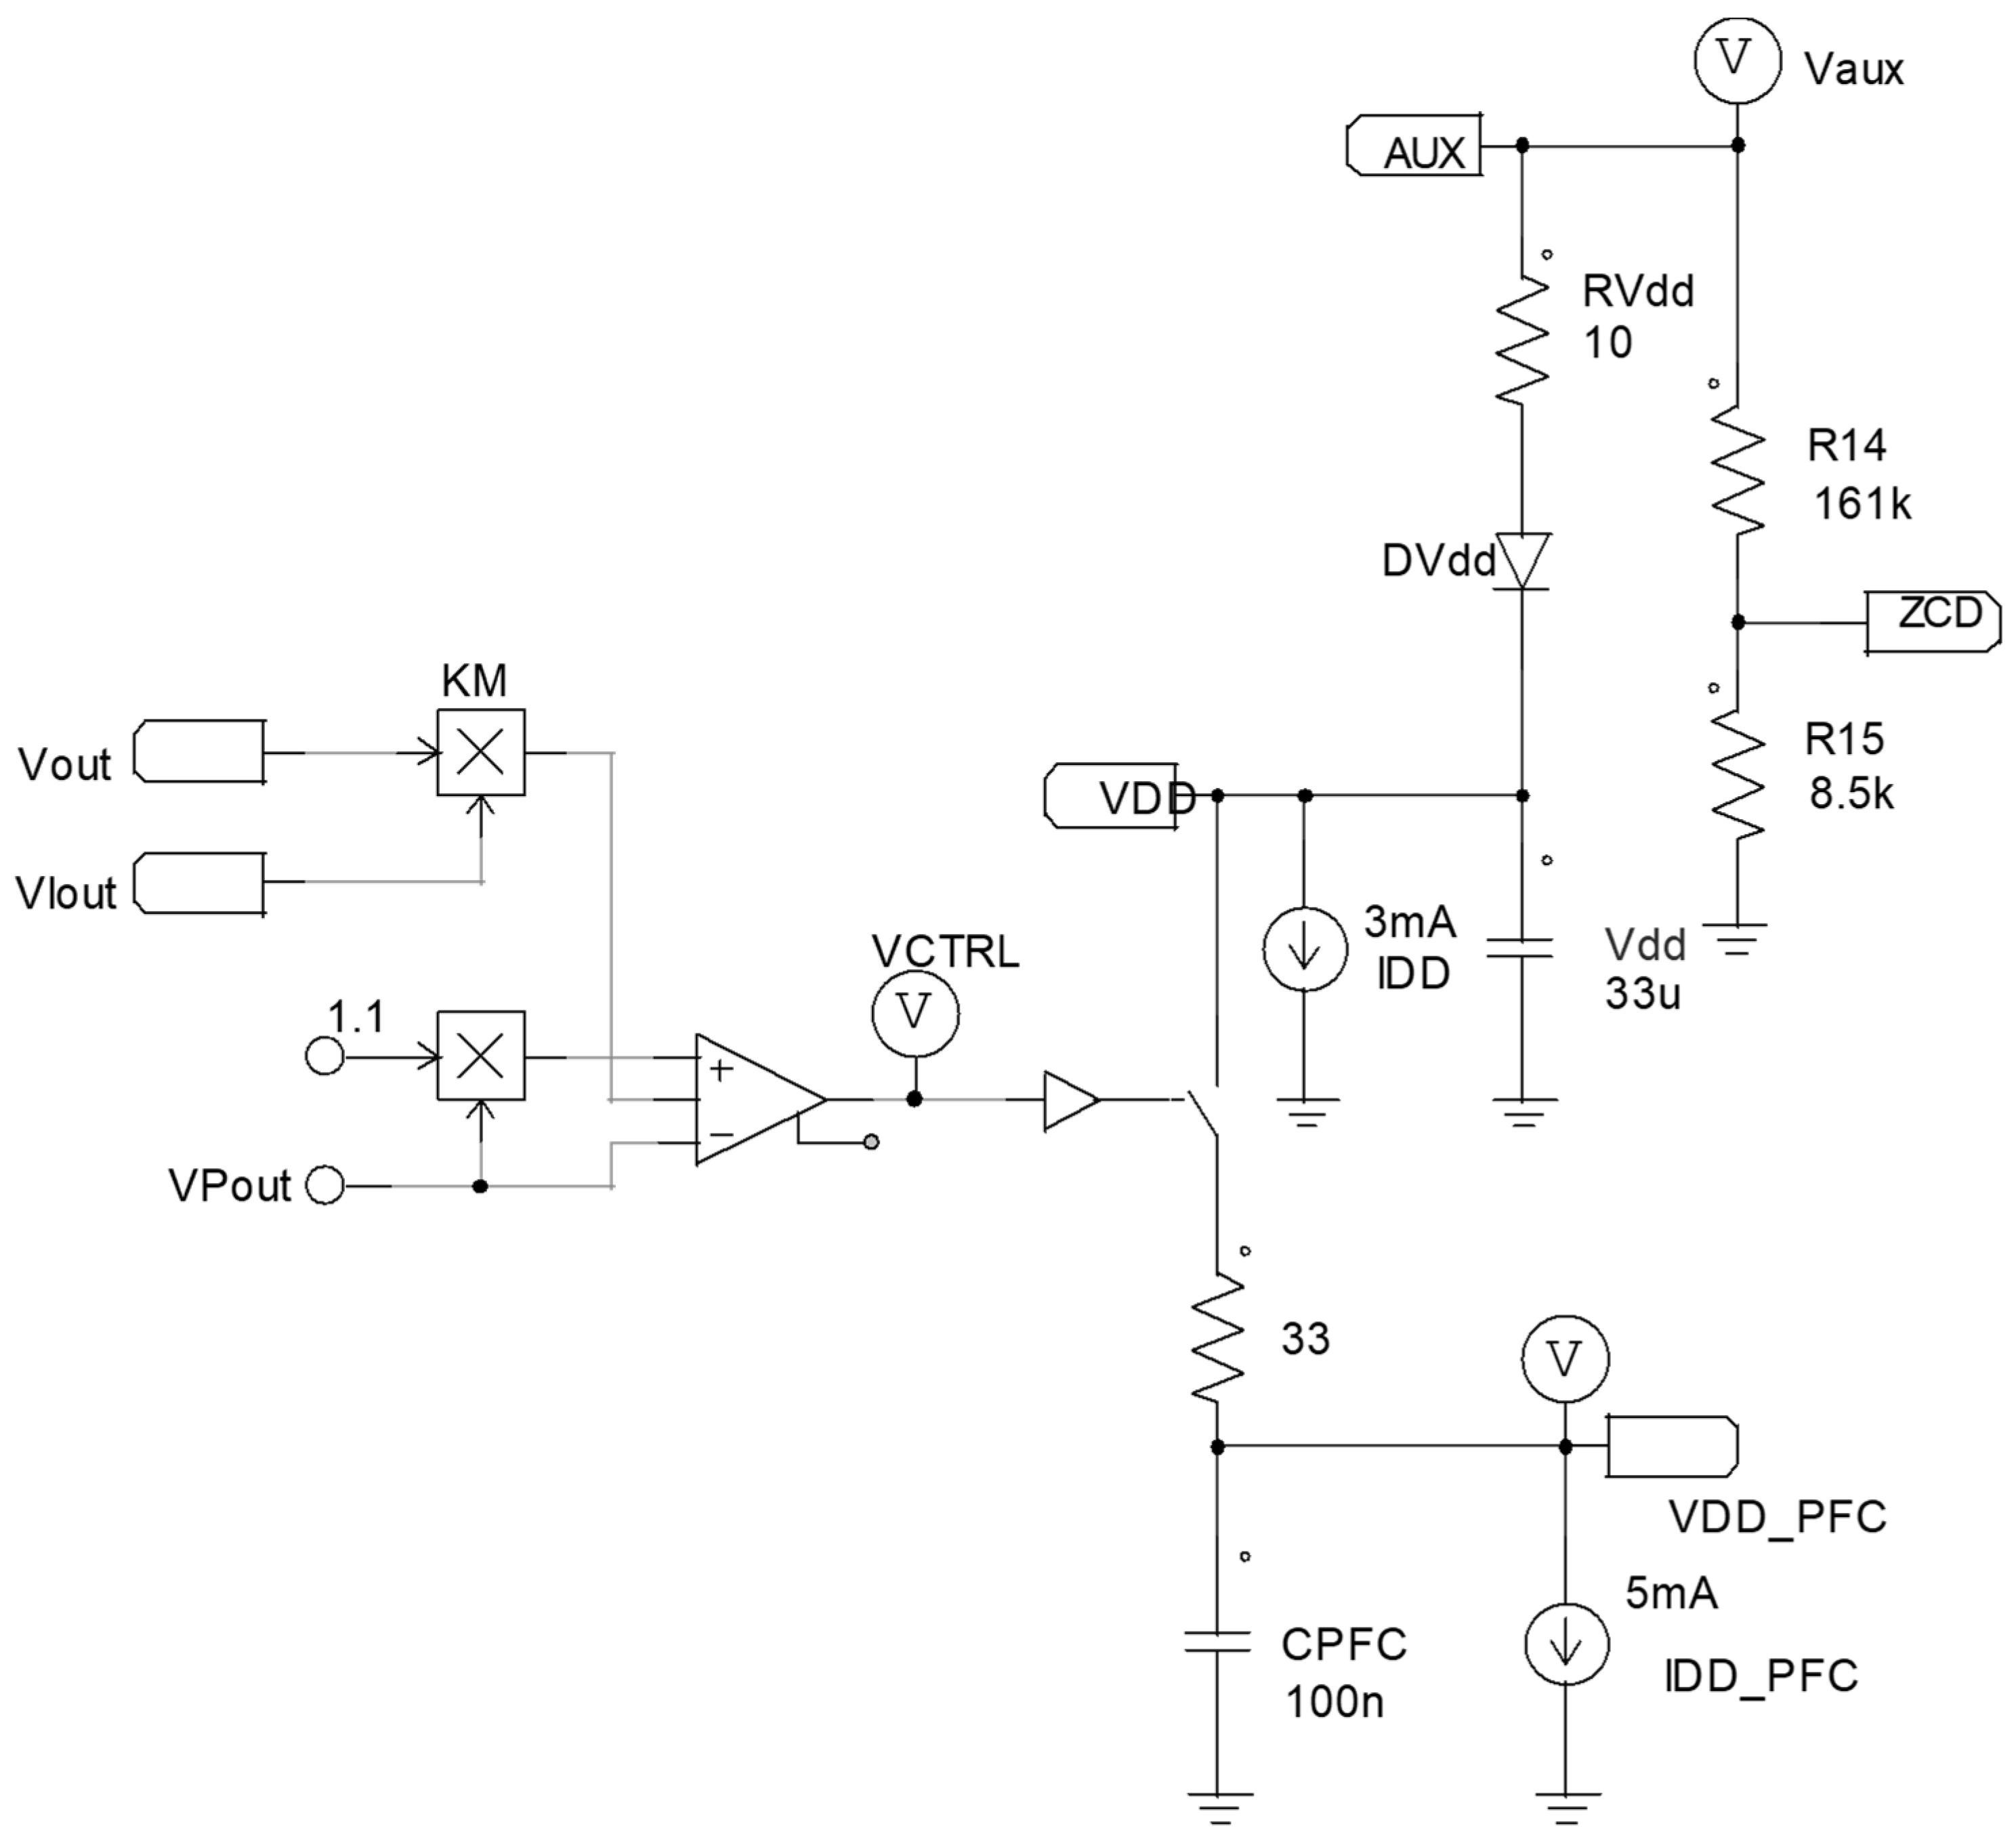
Figure 12 shows the simulation model of the main QR Flyback, whereas
Figure 13 shows the simulation model of the hiccup mode control from
Figure 5. In this model, the evaluation of the output power is performed with multiplication, in the multiplier block
, using the output voltage
and the voltage
, which is proportional to the output current
. The resulting voltage is compared in a comparator with hysteresis, with a reference
, proportional to the threshold
, and with a reference equal to
, proportional to the threshold
.
In the same model, the switch
of
Figure 5 is also included (including its parasitic resistance of 33 Ω), that drives the PFC to operate in hiccup mode. The consumption of the flyback and the PFC has also been modeled.
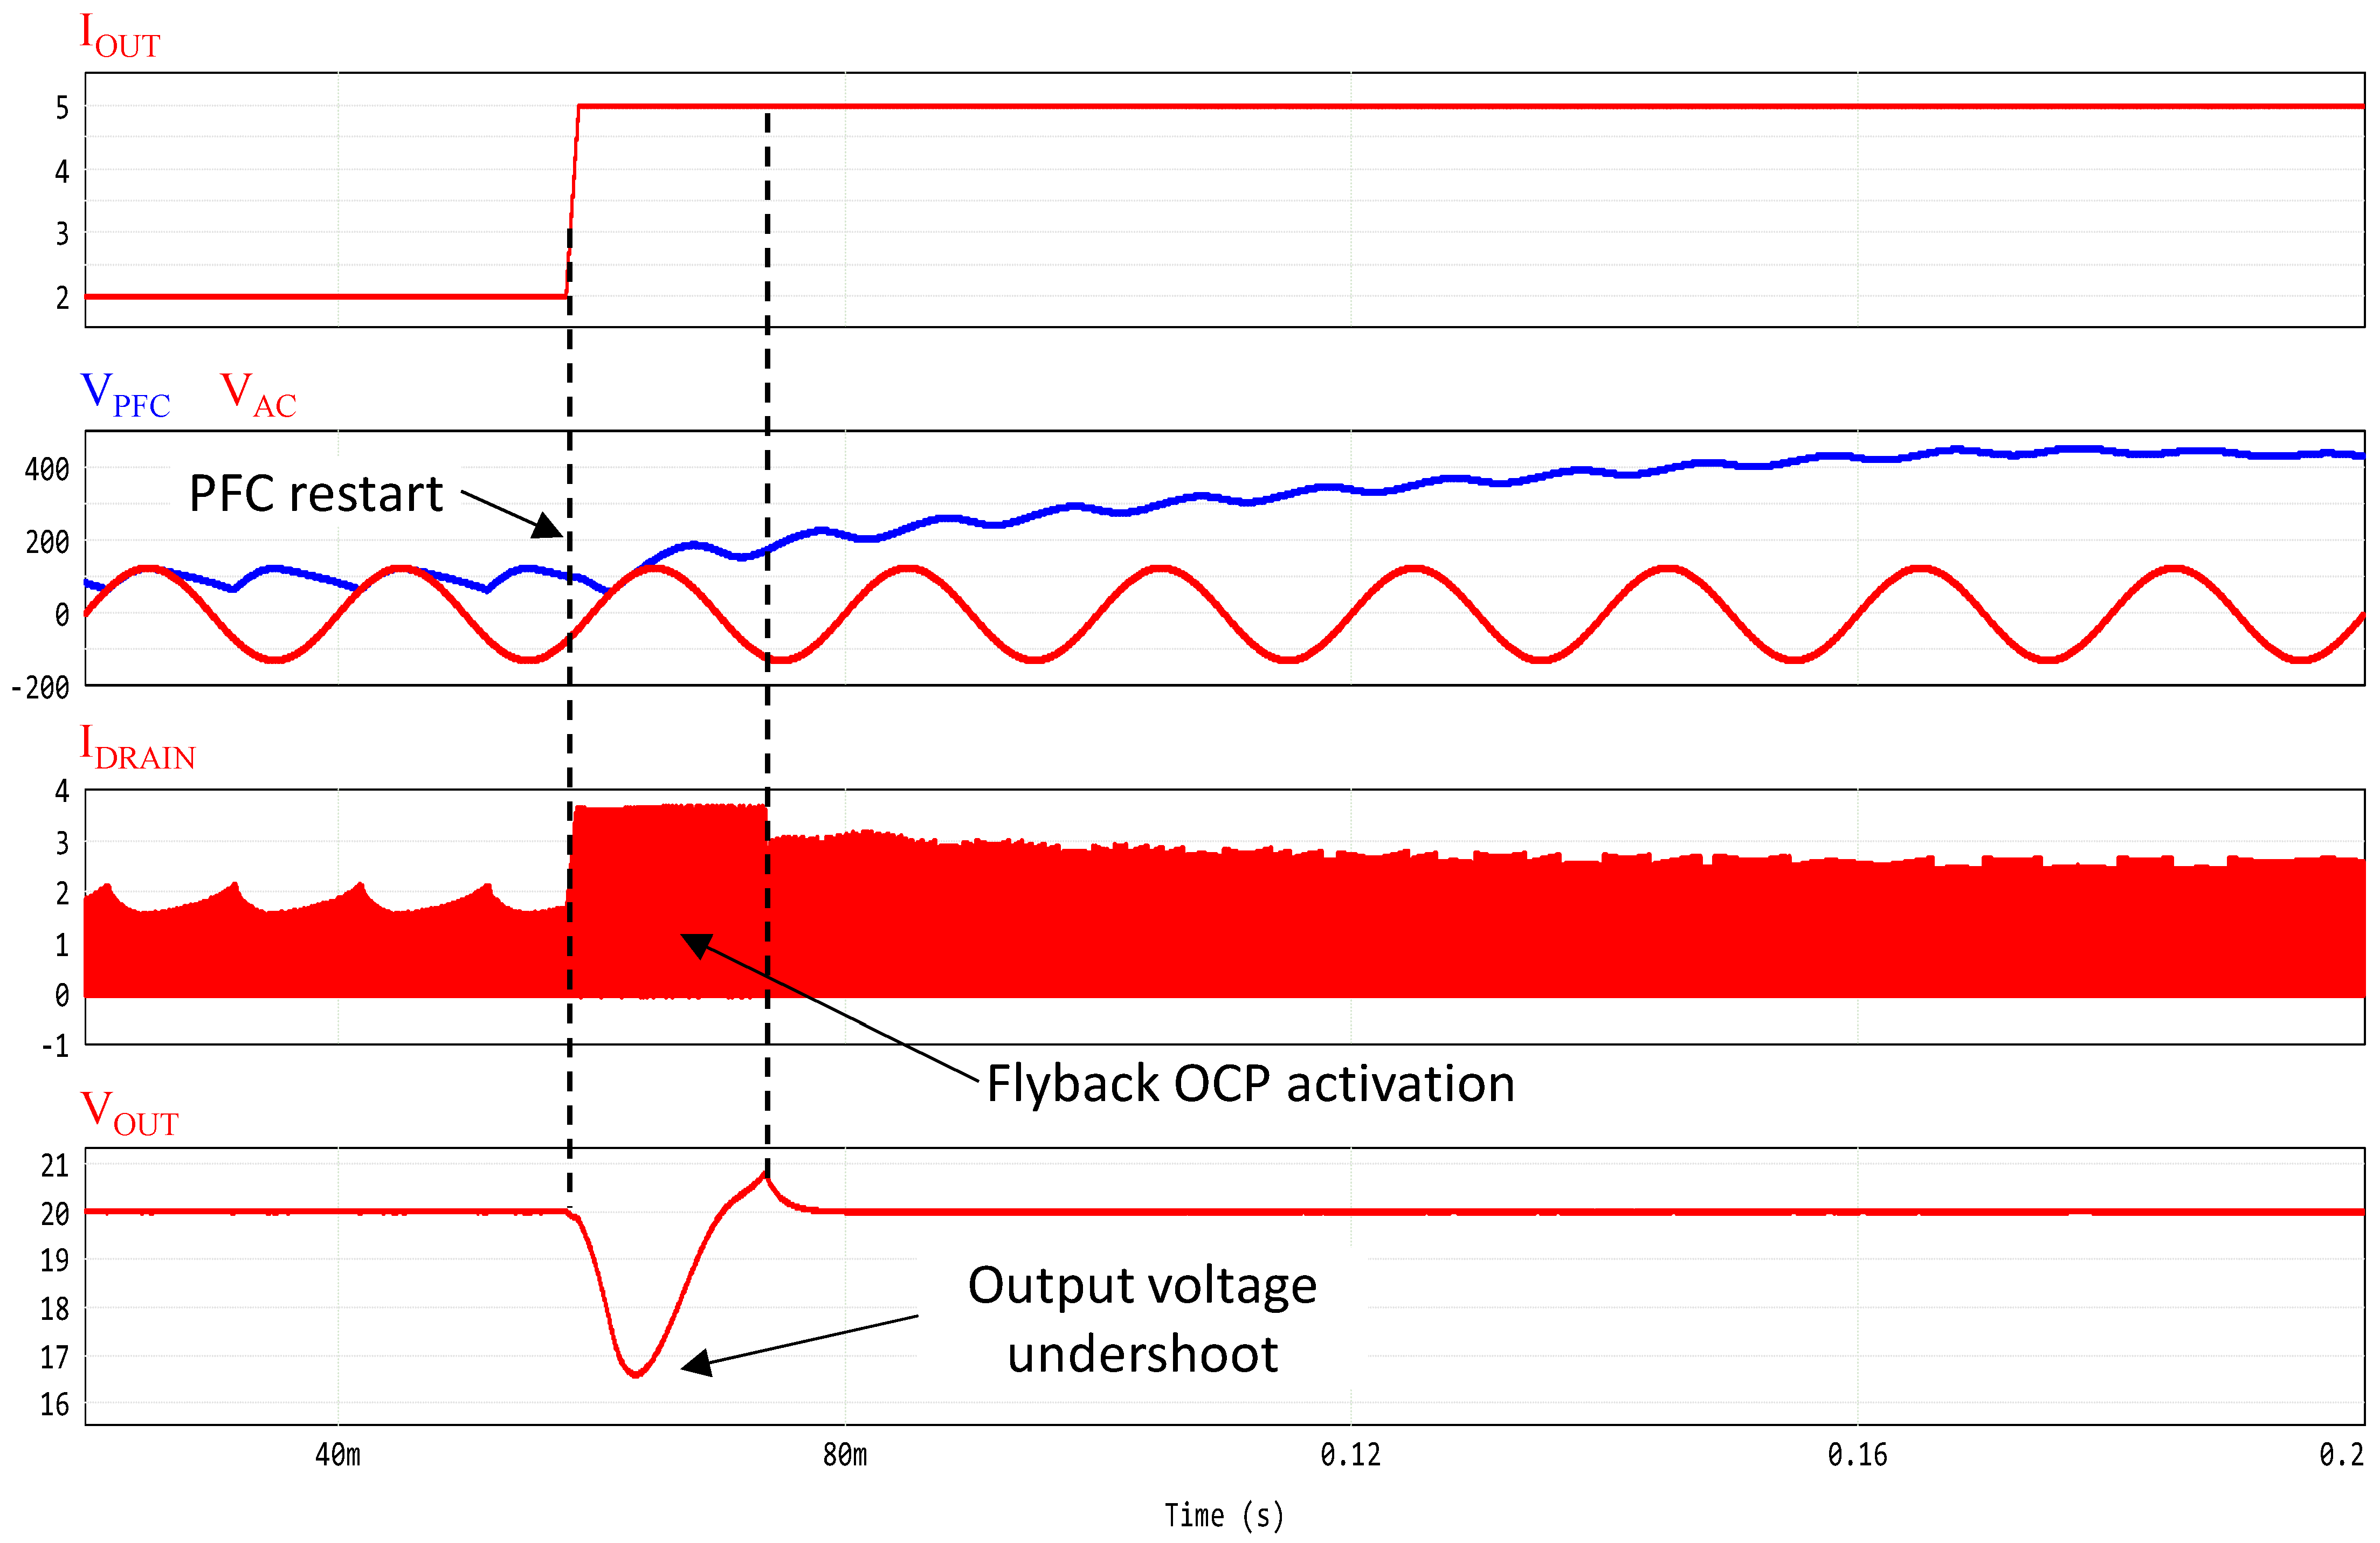
In
Figure 14, a load transition from 40 W to 100 W is simulated, with the input voltage set to 90 V
AC and the PFC completely disable. During the interval that the PFC requires to recover normal operations, the flyback is supplied with a low input voltage while providing full load to the output. Therefore, it temporarily enters an OCL condition, resulting in a temporary loss of regulation with a consequent large undershoot in the output voltage that, in the considered simulation, falls below 17 V.
In
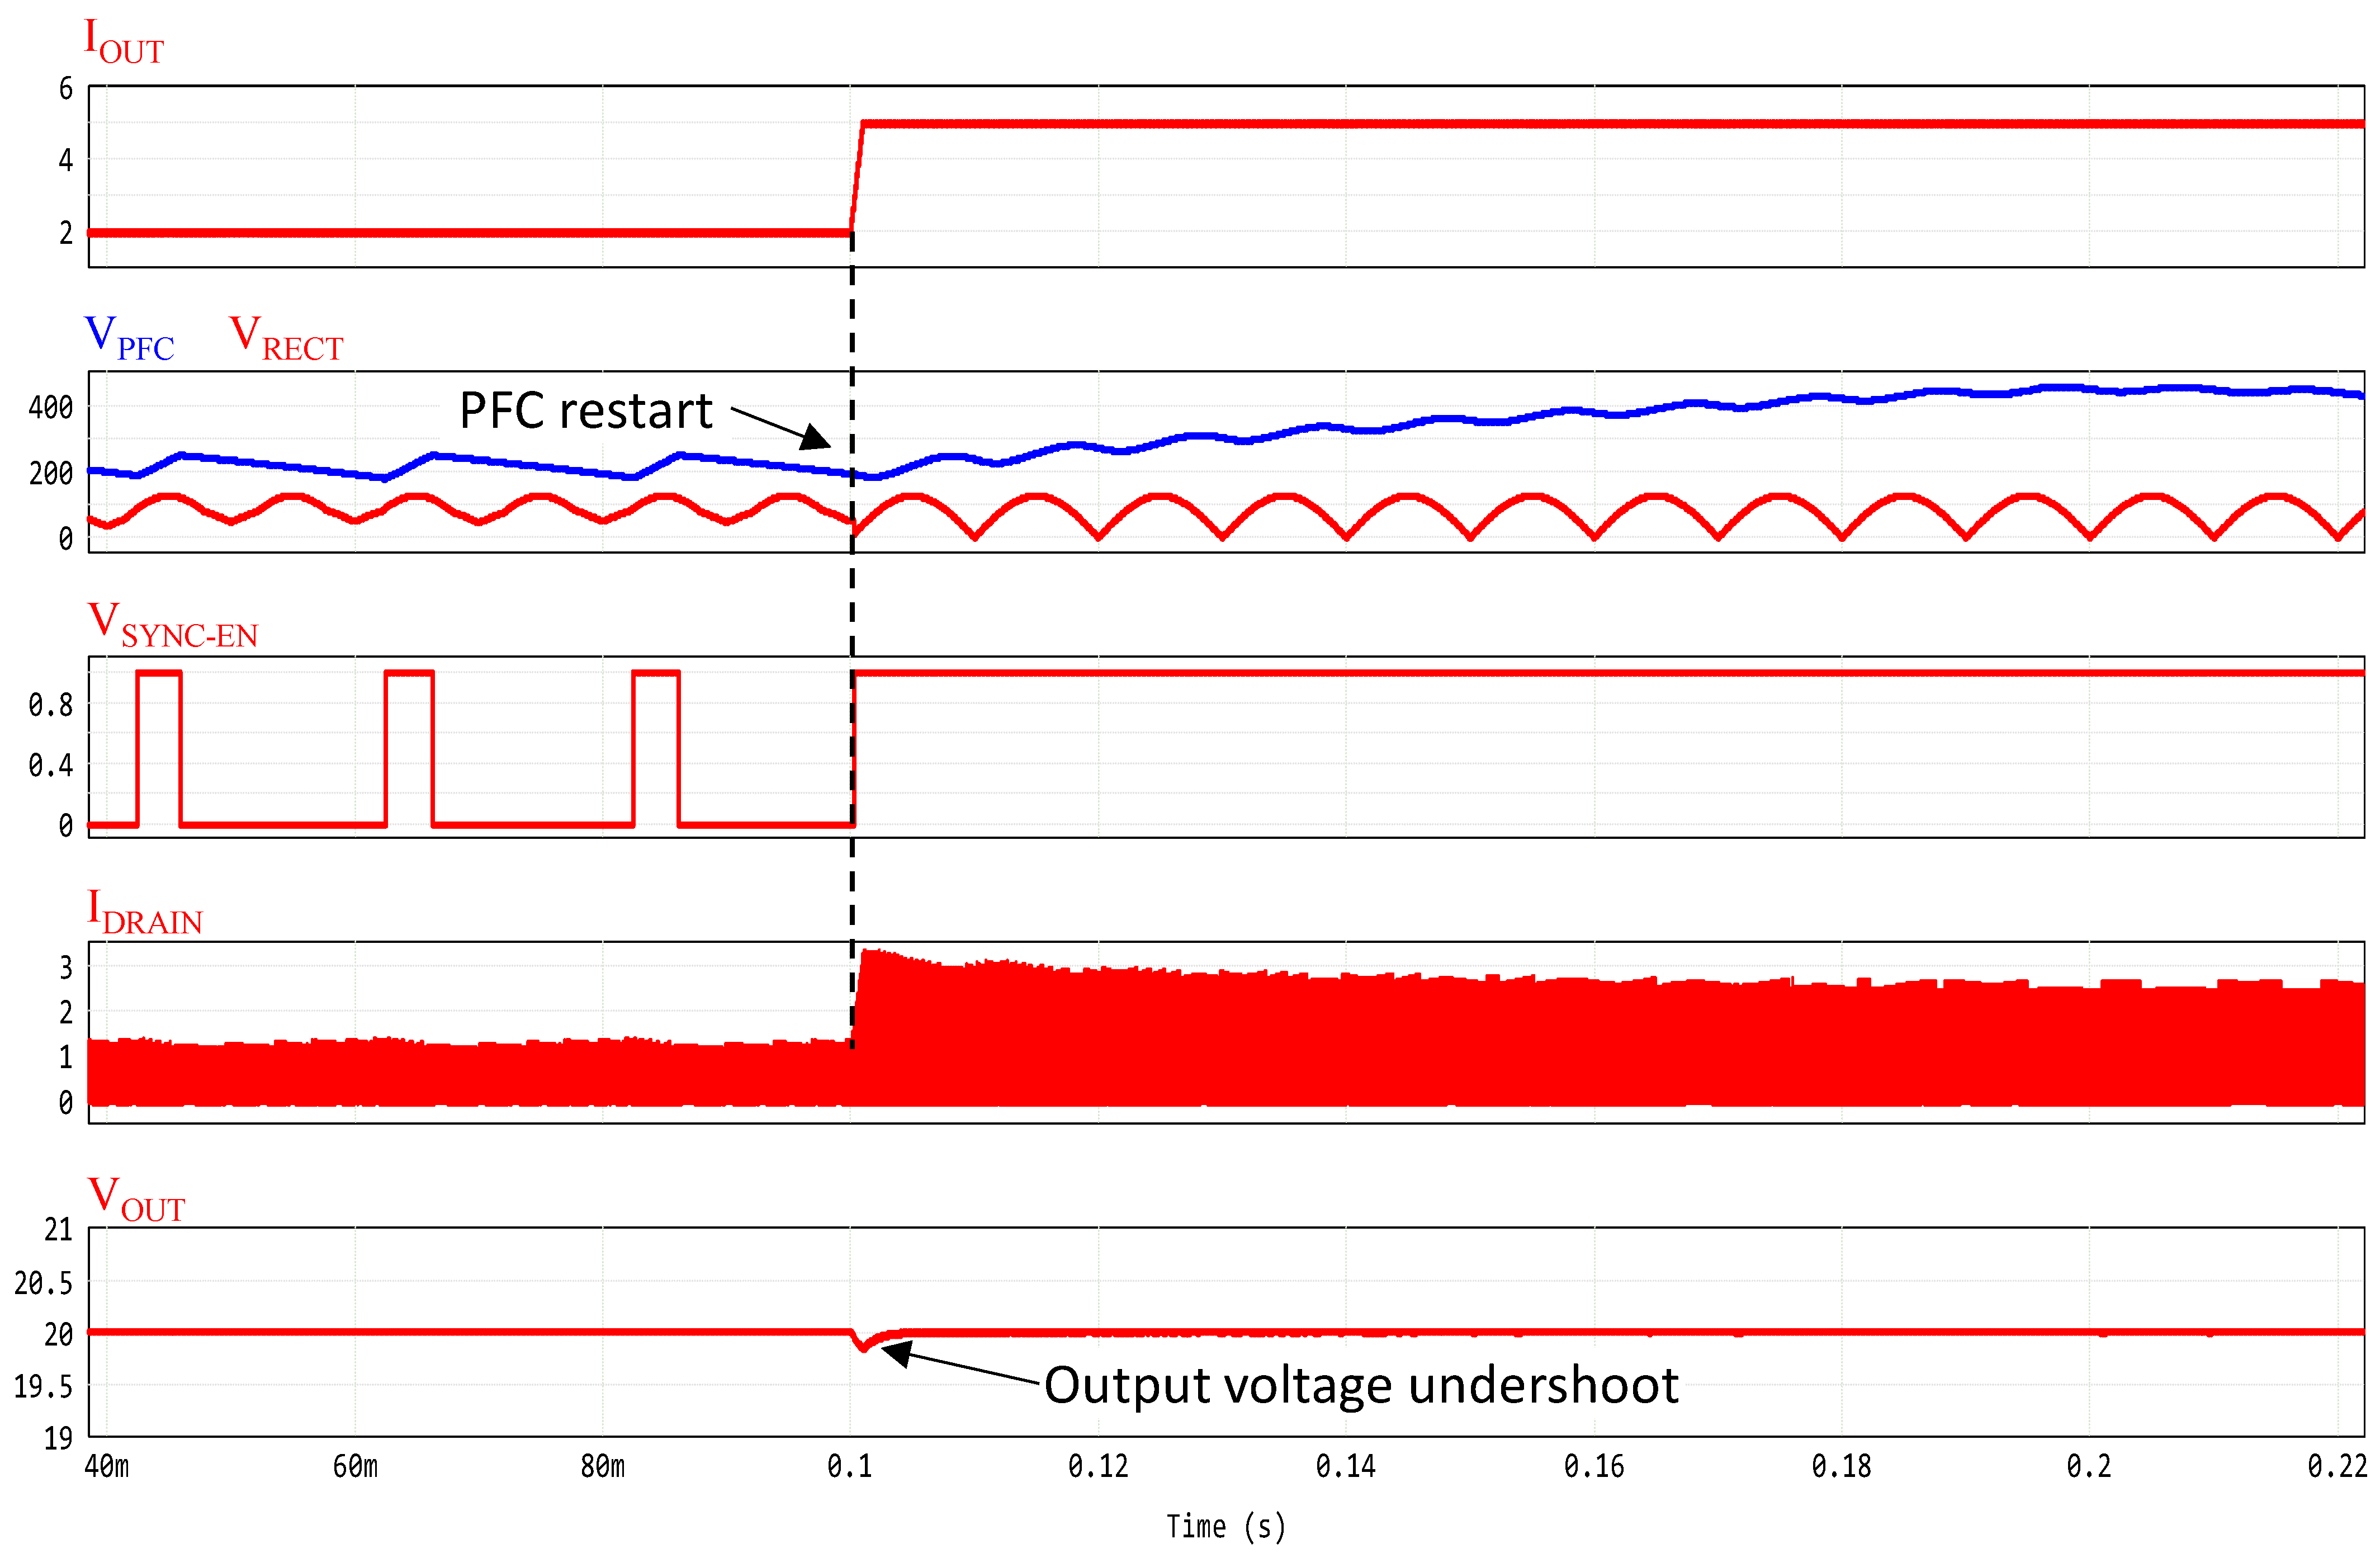
Figure 15, the same test conditions used in
Figure 14 are simulated, but when PFC operates in hiccup mode, its output voltage is always maintained between the values
and
. Therefore, following the same load transition from 40 W to 100 W, the flyback operates with a primary current
, that is, as a direct consequence of Equation (5), lower than before. The result is that the flyback will not enter the OCL, even temporarily, and the output voltage undershoot will be solely dependent on the step response characteristics of its control loop.
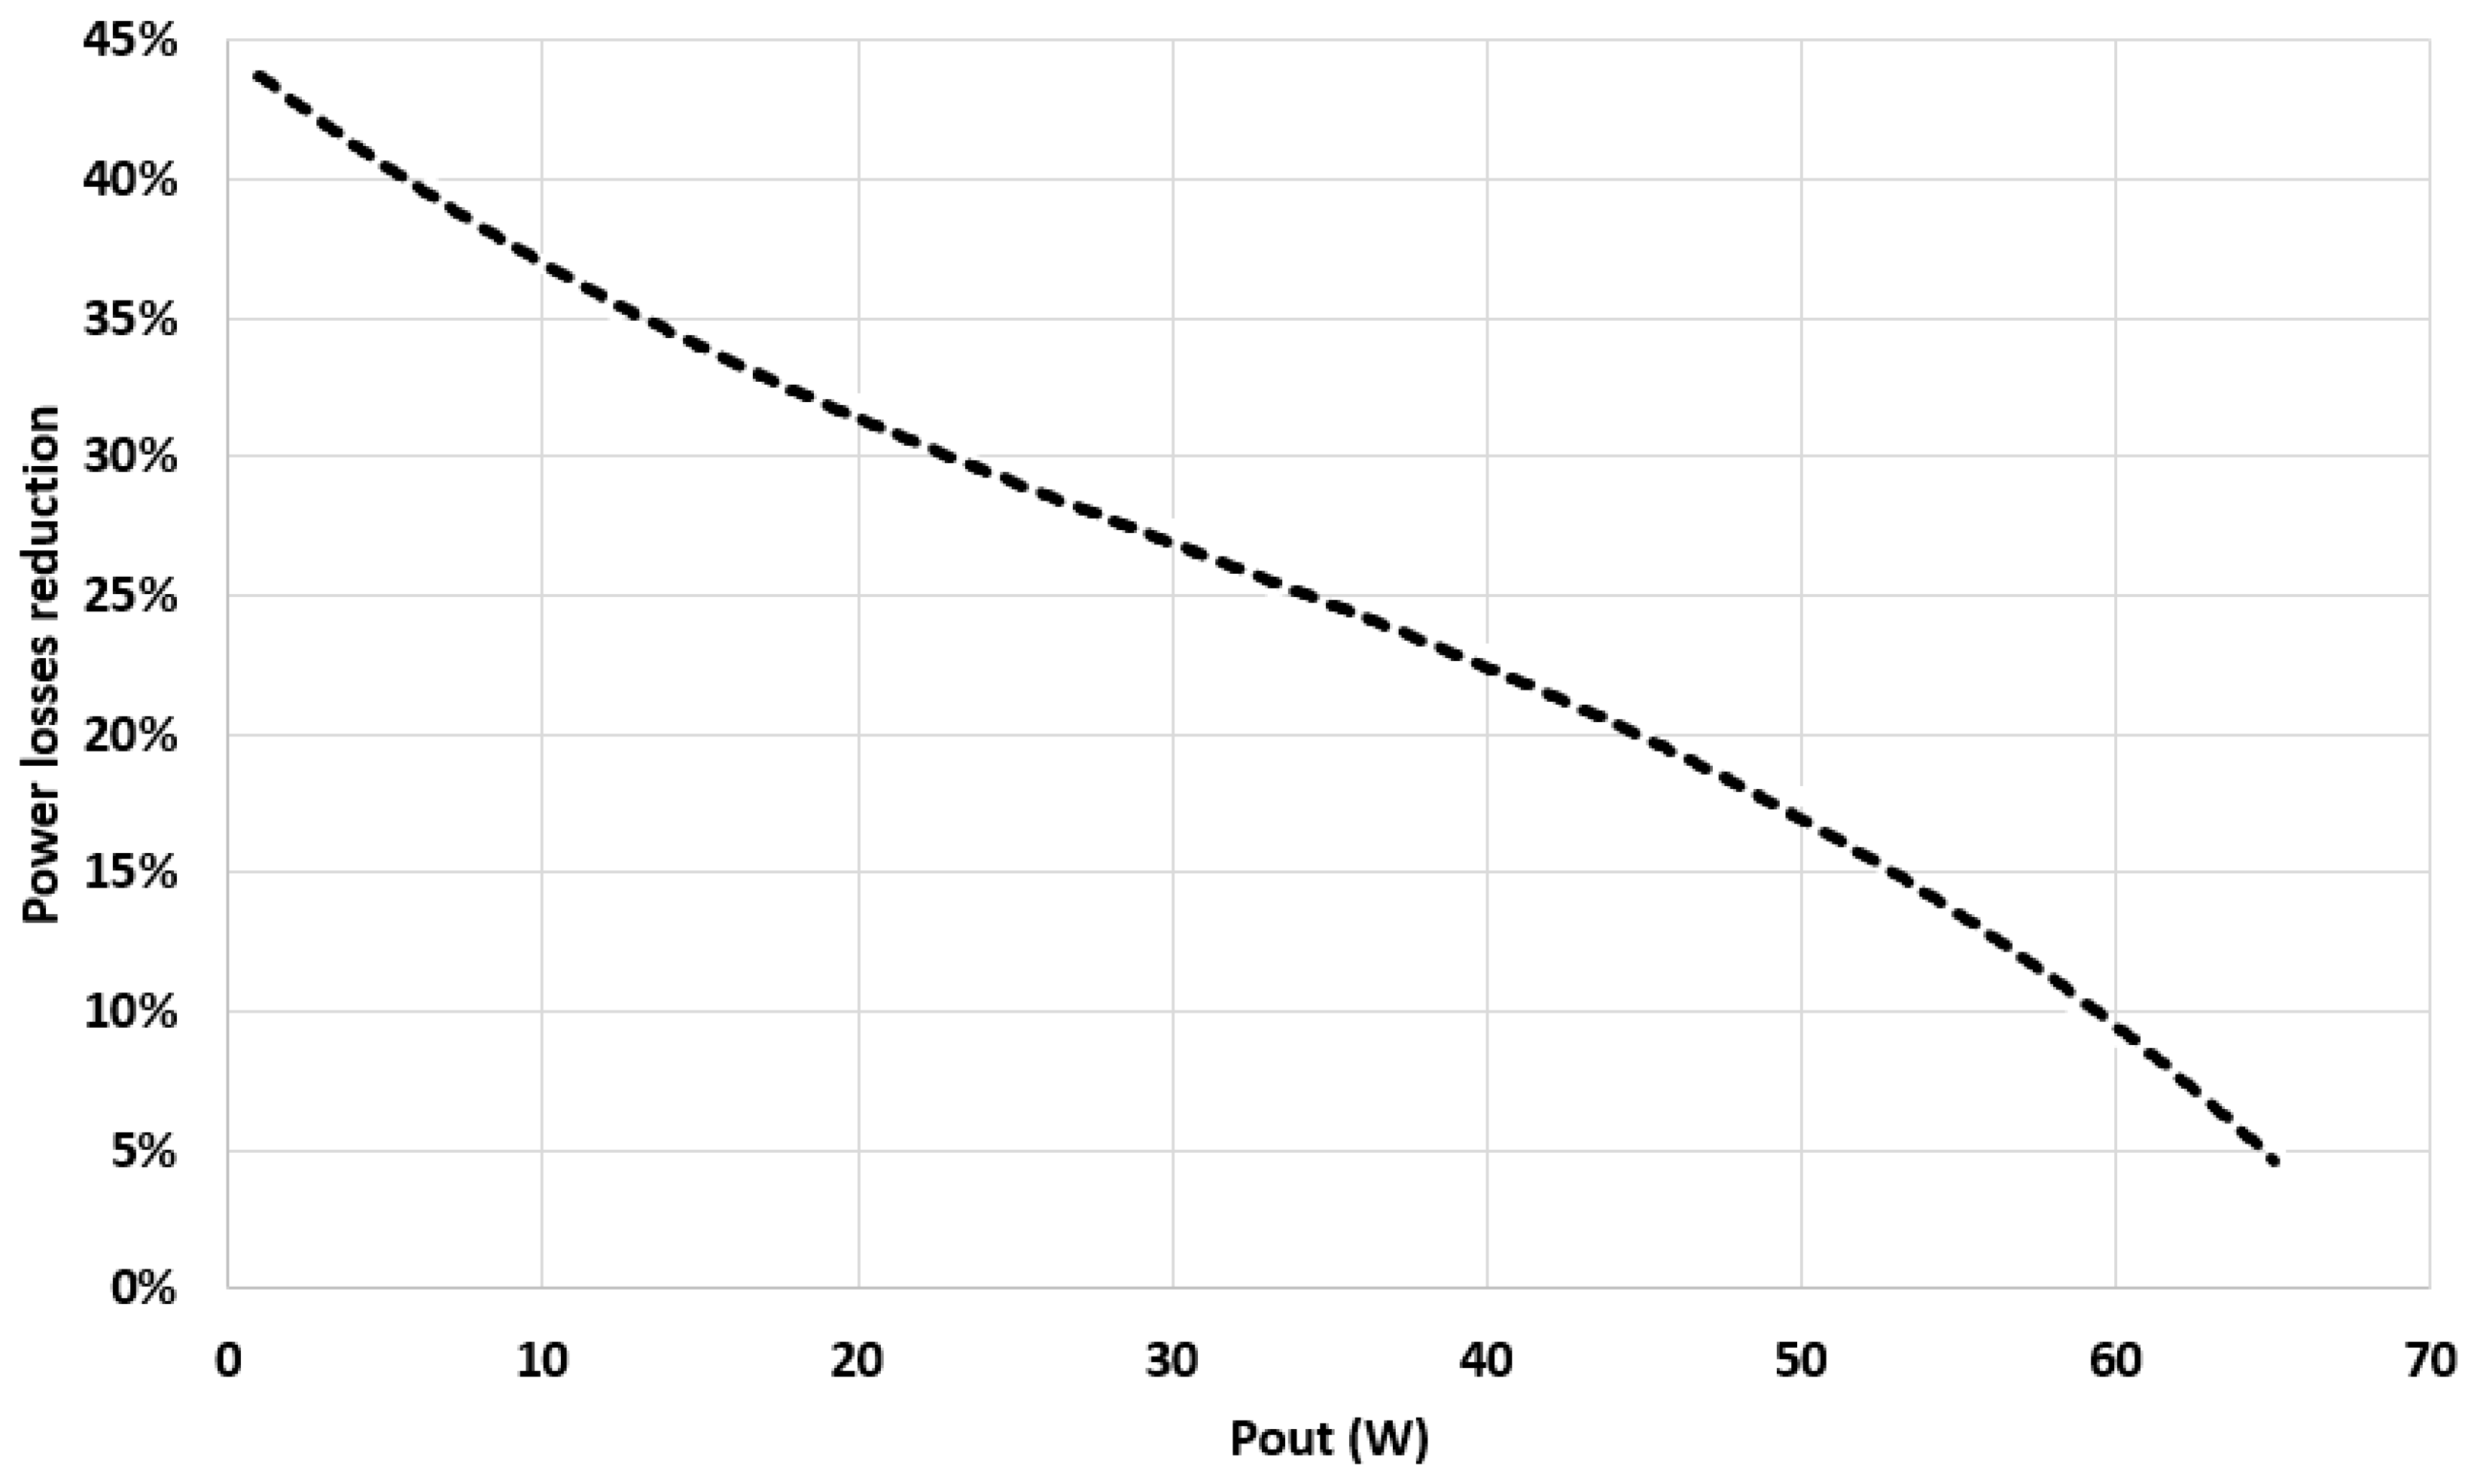
Figure 16 reports, for various load levels (Pout), the improvement achieved by the proposed hiccup control in comparison with the standard PFC control that does not enable PFC turn-off. The figure reports the reduction in power losses expressed as a percentage of standard PFC. At low load, the proposed method presents great advantages, since the power losses are almost halved compared to standard PFC control. As the IEC61000-3-2 power limits, where the PFC cannot be turned off (75 W), are approaching, the advantages of the proposed control technique vanish since it tends to operate as a standard control. It is worth noting that the regulation specifies that (except for lighting final applications) there is no harmonic limit for equipment when working below 75 W. In the case considered in this section, although the power supply is designed for a maximum power of 100 W, there is no harmonic current limit when it operates below 75 W.


