Article

Development and Validation of an Unobtrusive Automatic Sleep Quality Assessment Index (ASQI) for Elderly Individuals

1
Center for Medical Education and Career Development, Fukushima Medical University, Fukushima City 960-1295, Fukushima, Japan
2
Department of Electrical and Electronics Engineering, College of Engineering, Nihon University, Koriyama City 963-8642, Fukushima, Japan
3
Department of Hematological and Biophysical System Sciences Analysis, Graduate School of Medical and Dental Sciences, Institute of Science Tokyo, Tokyo 152-8550, Japan
4
School of Nursing, Fukushima Medical University, Fukushima City 960-1295, Fukushima, Japan
5
School of Computer Science and Engineering, University of Aizu, Aizuwakamatsu City 965-8580, Fukushima, Japan
*
Author to whom correspondence should be addressed.
Electronics 2025, 14(22), 4531; https://doi.org/10.3390/electronics14224531
Submission received: 27 September 2025 / Revised: 15 November 2025 / Accepted: 18 November 2025 / Published: 19 November 2025
(This article belongs to the Special Issue Wearable Sensors for Human Position, Attitude and Motion Tracking)

Abstract

This study presents the development and validation of an unobtrusive automatic sleep quality assessment index (ASQI) designed for elderly individuals. The proposed method utilizes features such as sleep duration, sleep latency, and sleep efficiency, calculated from physiological data—heart rate, respiratory rate, body movements, and bed-exit behavior—captured by a non-contact bed sensor system installed in home environments. Based on these parameters, a six-component sleep quality index was constructed to objectively evaluate nightly sleep. To assess the reliability and validity of ASQI, sleep data were collected from eleven elderly participants over a one-year period. Results showed strong test–retest reliability ( r = 0.91 , p < 0.001 ) and moderate correlation with the widely used Pittsburgh Sleep Quality Index (PSQI) ( r = 0.52 , p < 0.05 ). Furthermore, ASQI successfully differentiated between self-reported good and poor sleepers, achieving a classification accuracy of 85.7%, with a sensitivity of 66.7% and specificity of 93.3%. These findings demonstrate that the ASQI system is a practical and scalable tool for continuous, home-based sleep monitoring in older populations. Its non-intrusive design and objective scoring make it well-suited for personalized sleep management and early detection of sleep-related issues. This work contributes to the growing field of unobtrusive health monitoring and highlights the potential of sensor-based systems in elderly care.

1. Introduction

Insufficient sleep has been linked to a range of chronic diseases and conditions, including diabetes, cardiovascular disease, obesity, and depression, all of which pose significant threats to public health. According to a survey [1], approximately 21.3% of the adult population in Japan reported difficulties such as trouble initiating sleep, maintaining sleep, or experiencing early morning awakenings. Advances in methods for assessing sleep quality and treating sleep disorders offer hope to the millions of individuals affected by insufficient sleep. Sleep quality is a critical component of overall health and well-being, influencing cognitive function, emotional stability, and physical health. While sleep quantity (total sleep time) is often emphasized [1,2], sleep quality—defined by factors such as sleep continuity, depth, and restorative value—has gained increasing attention in both clinical and research settings. The development of reliable and valid tools to assess sleep quality has become a focal point in sleep research. Sleep quality assessment can be broadly categorized into subjective and objective methods [3,4]. Subjective measures, such as self-reported questionnaires and sleep diaries, provide insights into an individual’s perceived sleep experience [5]. These tools are valuable because they capture the psychological and emotional aspects of sleep, which are often not fully reflected in objective measures. For example, the Pittsburgh Sleep Quality Index (PSQI) [6] is a widely used subjective tool that evaluates sleep quality over a one-month period, assessing components such as sleep latency, duration, and disturbances [7]. However, subjective measures have limitations, including recall bias and the inability to capture detailed physiological data. Objective measures, such as polysomnography (PSG) and Actigraphy, provide quantifiable data on sleep architecture and patterns. PSG, often considered the gold standard, records brain activity, eye movements, and muscle tone during sleep [8,9,10]. However, PSG is expensive, intrusive, and impractical for long-term monitoring. Actigraphy, which uses wrist-worn devices to measure movement and infer sleep–wake patterns, offers a more practical alternative [11]. Despite their advantages, objective measures may not always align with subjective perceptions of sleep quality, underscoring the need for a multimodal approach to sleep assessment [9,11,12].
The rapid development of wearable technology has revolutionized sleep monitoring, enabling continuous, unobtrusive, and real-time assessment of sleep quality [13,14]. Wearable devices, such as smartwatches and fitness trackers, leverage sensors like accelerometers, heart rate monitors, and photoplethysmography (PPG) to collect data on sleep stages, heart rate variability, and respiratory rate [13,14]. These devices provide a convenient and cost-effective alternative to traditional methods, making sleep monitoring accessible to a broader population [13,14]. One of the key features of wearable sleep monitoring systems is their ability to integrate subjective and objective data. For instance, some devices allow users to input their perceived sleep quality, which can then be compared with physiological data to identify discrepancies and provide personalized feedback [15]. Additionally, advancements in machine learning and artificial intelligence have enhanced the accuracy of wearable devices in detecting sleep disorders, such as insomnia and sleep apnea [13].
Unobtrusive sleep monitoring systems, such as bed sensors and ambient devices, represent another significant advancement [16]. These systems use non-contact methods, such as ballistocardiography (BCG) and radar technology, to monitor sleep without requiring the user to wear any devices [16]. For example, bed sensors can detect subtle movements and respiratory patterns, providing detailed insights into sleep architecture [17]. Ambient devices, which use environmental sensors to monitor factors like room temperature and light levels, further contribute to a comprehensive understanding of sleep quality [18,19]. Recently, many kinds of sleep monitoring system have been developed to track various vital signs during sleeping [20,21]. Zhu et al. developed a sleep sensor using a piezoelectricity (PZT) sensor [22,23] to monitor heart rate (HR) and respiratory rate (RR), but the ease of use still needs to be improved. Widasari et al. developed an automatic and non-intrusive method of evaluation of sleep quality for patients with obtrusive sleep apnea using only an easy to conduct and record ECG signal [24]. Kalintha et al. propose SleepAge, a method that assesses sleep quality by analyzing nocturnal sounds recorded in a home environment, using machine learning to estimate a person’s “sleep age” as an indicator of sleep health [25]. Nakajima et al. used video recordings to detect respiratory movements and movement of the body position to aid in the diagnosis of sleep disturbances or to assist in the evaluation of sleep quality [26]. Liao et al. proposed a video-based sleep monitoring system that uses texture-based background modeling for real bedroom environments [27]. However, video recording raises privacy concerns that limit its broad applicability. Another challenge in using video images for sleep assessment is the large data capacity required. Meanwhile, the proliferation of smartphones and high-speed internet has enabled alternative approaches. For instance, some methods [28] leverage smartphone-embedded accelerometers to detect physiological activities caused by heartbeat, respiration, and body motion, thereby estimating HR, RR, and sleep quality without intrusive monitoring. However, such methods are not very suitable for the elderly because it is cumbersome and difficult to use [29,30]. In addition, sheet-type and under-mattress non-wearable devices have gained increasing attention for unobtrusive sleep monitoring. For example, Beddit uses BCG to estimate heart rate, respiration, and sleep parameters without requiring body contact [31], while Nemuri SCAN, an under-mattress pressure sensor, detects sleep, wakefulness, and out-of-bed states with high temporal resolution [32]. Owing to their non-contact and user-friendly nature, these devices are particularly suitable for elderly individuals, offering promising potential for long-term home-based sleep assessment [31,32].
In this work, we proposed a novel method for assessing sleep quality using characteristics and patterns of sleep obtained from an unobtrusive sleep monitoring system. The purpose of this study was to design and evaluate an objective sleep quality index using an unobtrusive sleep monitoring system as an aid to the conventional subjective Pittsburgh sleep quality index to facilitate a comprehensive and subjective assessment of long-term sleep quality. This method analyzes data on heart rate, respiratory rate, body movement (BW), and leaving-bed activities recorded during sleep, and evaluates sleep quality using a predefined scale. Eleven elderly participants were recruited to collect nocturnal sleep data and to assess the consistency and validity of the proposed method. The standard PSQI questionnaire was administered to the participants as a reference measure. Experimental results demonstrate that the sleep quality scores obtained using the proposed method exhibit high consistency with the reference PSQI scores. This preliminary study demonstrates the promise of the proposed method for automated sleep assessment and user health management.

2. Materials and Methods

2.1. System Design

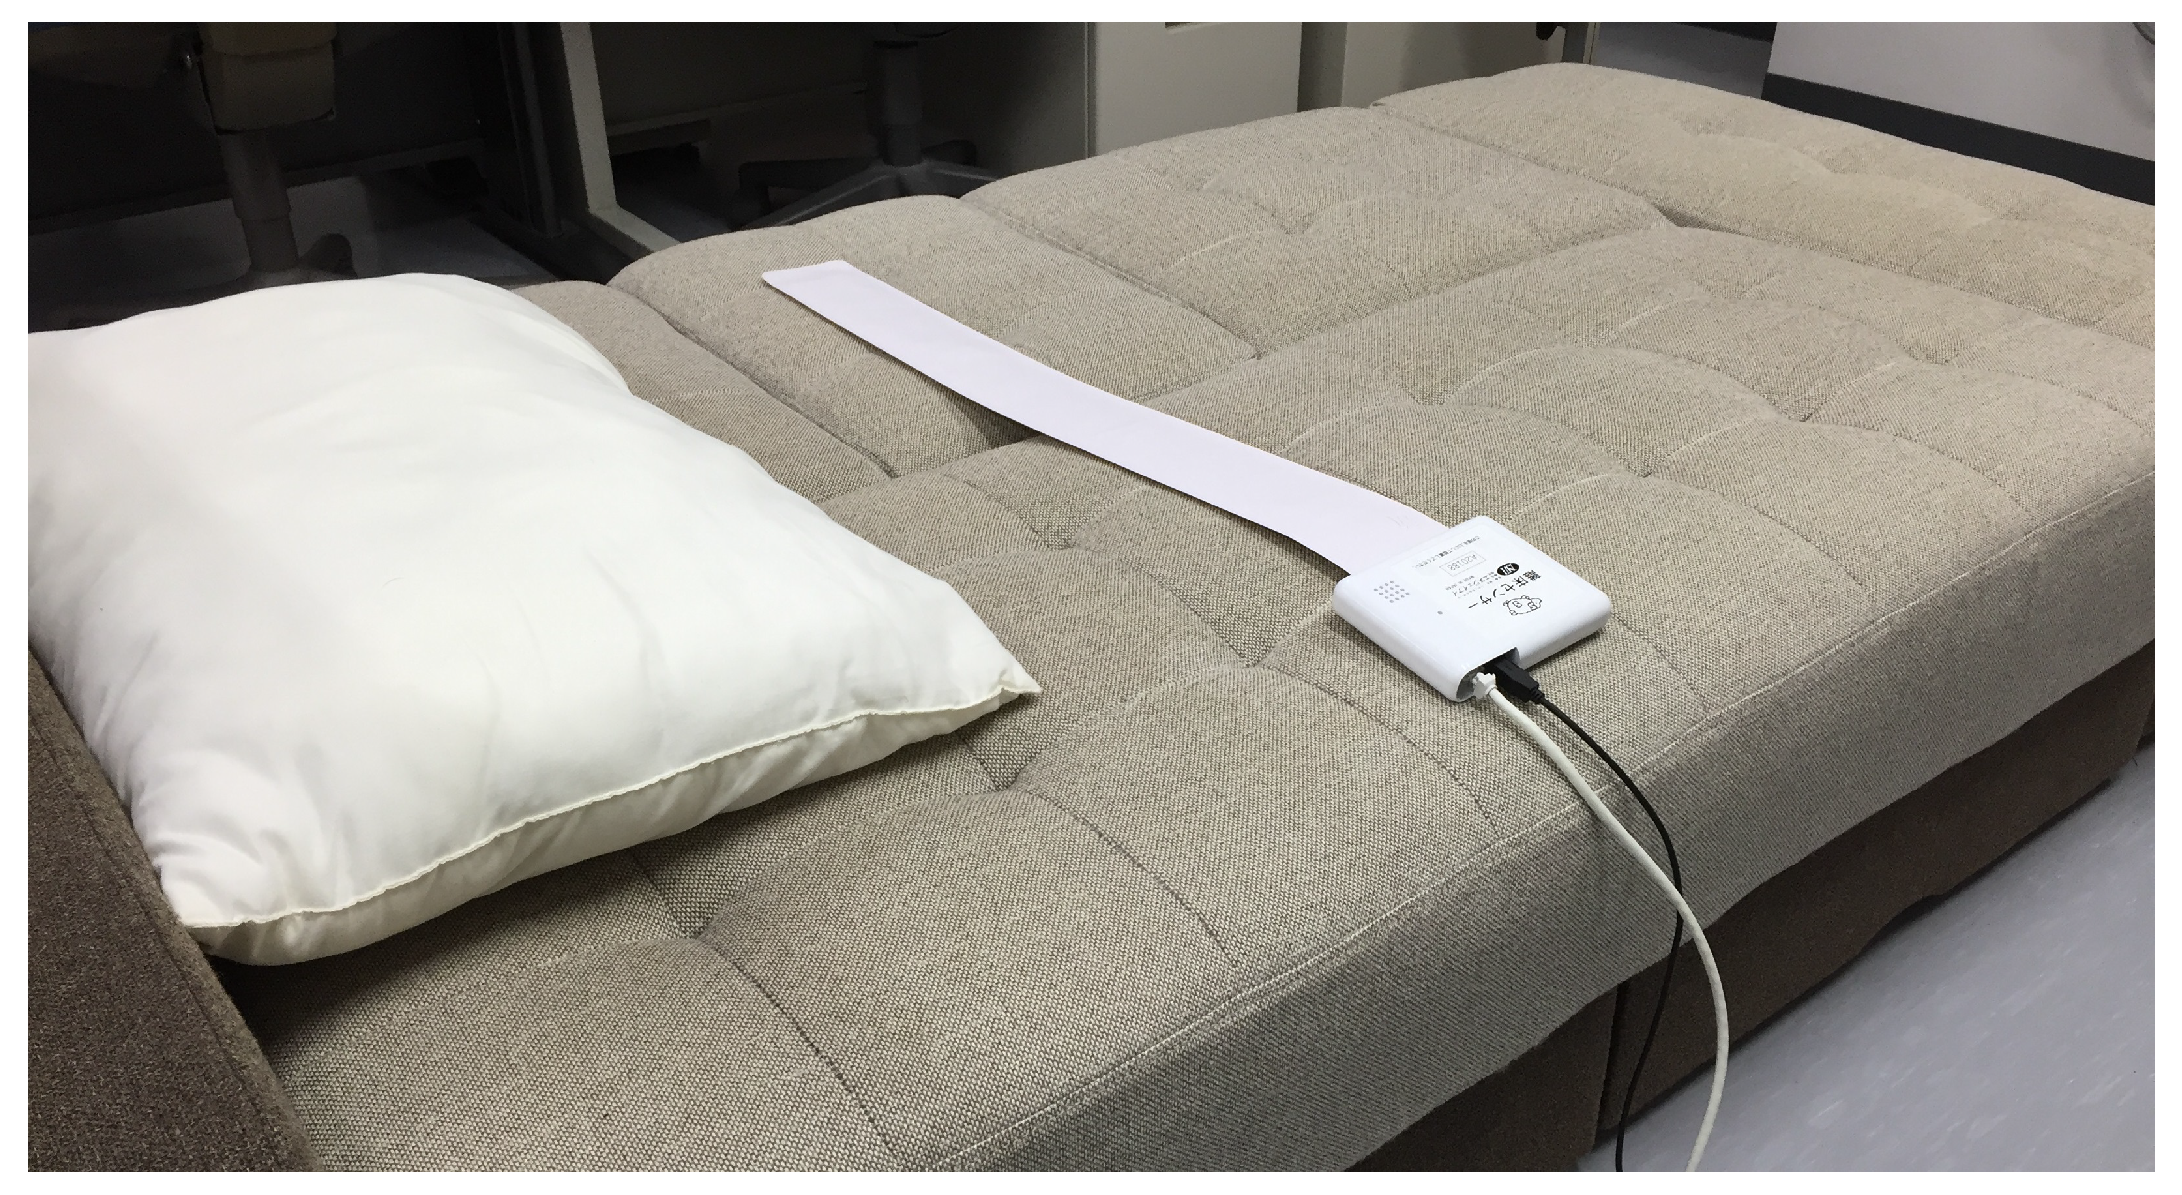
An unobtrusive sleep monitoring system was developed to record sleep-related physiological signals using a non-contact sleep sensor (Safety Sheep Sensor α , NJI Co., Ltd., Koriyama, Japan) [33]. A schematic diagram of the system is shown in Figure 1. The monitoring device consists primarily of twelve piezoelectric sensors and a control circuit equipped with LAN communication capability. The piezoelectric sensors were assembled into a matrix and housed within a soft, durable plastic case measuring 800 mm × 150 mm × 17 mm. When placed beneath the mattress, the sensor monitors HR, RR, and BW by detecting voltage fluctuations from the piezoelectric elements. It also determines whether the user is on or off the bed based on these signals. According to [34], the sensor achieves a high measurement accuracy, reported as 96.9 ± 0.1% for HR and 90.5 ± 0.7% for RR.
The unobtrusive sleep monitoring system consists of hardware that collects vital sign signals during sleep and a software client that processes the collected data in real time, which is deployed on a remote AWS (Amazon Web Services (AWS) is a cloud platform that provides online services for computing, storage, and databases.) server using Node-RED (Verison 0.13) (Node-RED is a tool for connecting and controlling devices using a simple flow-based interface.) (See Figure 1). The obtained results is composed of four kinds of data, such as heart rate, respiration rate, body movement, state whether lying on the bed or leaving. Data is stored into PostgresSQL database. In the every morning, the four kinds of data is further processed to generate six kinds of indices that are used to score the sleep in terms of the pre-defined scale and for assessing sleep quality.

2.2. Scale Design of Sleep Quality Index

The proposed automatic sleep quality index (ASQI) was derived from two sources: a review of previous sleep quality assessment methods and data analysis with the data collected from the sleep monitoring system. The index includes six components and each component is set 0 to 3 in terms of corresponding pre-defined scale. The total score for all components ranges from 0 to 18. A total score of greater than “5” is defined as poor sleep quality. In fact, the three evaluation criteria presented in Table 1—sleep latency, sleep duration, and sleep efficiency—are derived from PSQI. We adopted the original scoring standards of these three PSQI components in this study. Regarding sleep start time, previous research has shown that a late bedtime is associated with poor sleep and adverse health outcomes, and that irregular sleep timing also leads to unfavorable effects [35,36]. Although most of these reviews did not specify precise hourly thresholds for example, defining 19:00–21:00 as “good” and >24:00 as “poor”, considering that the present participants were older adults with a mean age of 77 years, and based on the actual distribution of their bedtimes, we established the evaluation criteria shown in Table 1. As for nighttime leaving of bed, previous studies have demonstrated that frequent nighttime bed-leaving in older adults-particularly those with dementia or cognitive impairment-is associated with sleep deprivation, increased risk of falls, and worse health outcomes [37,38], thus, such behavior has been identified as an indicator of poor sleep quality. Furthermore, studies examining body movements during sleep have reported that the number of movements is closely related to sleep depth and awakenings, sleep disturbances such as difficulty initiating sleep and frequent awakenings often result in increased turning and body movements [29,39,40]. Based on these prior findings, we summarized the criteria for evaluating sleep quality as presented in Table 1. Regarding the weighting strategy employed in the construction of the six ASQI components, we adopted the same methodology as that used in the PSQI, whereby each component is assigned equal weight.

2.3. Signal Processing and Data Analysis

The overnight sleep data of each participant were processed in batches on the server to extract multiple sleep-related parameters, including sleep start time, sleep latency, sleep duration, sleep efficiency, body movement times during sleeping, and times of leaving bed during sleep. The sleep monitoring sensor detects pressure changes through PZT sensors and outputs a flag signal to determine whether the subject is on the bed or has left it. When the subject lies quietly on the bed without noticeable body movements, the sensor continuously outputs a signal of “0”. When body movements occur, such as turning over or leg twitches, the sensor continuously outputs a signal of “1”. When the subject leaves the bed, the sensor continuously outputs a signal of “2”. Based on this flag signal, four parameters can be conveniently calculated: sleep start time, sleep duration, body movement times, and leaving times. Furthermore, the entire sleep data are segmented into 1-min epoches. According to the Actigraph method [41], the weighted body movement times for each epoch is calculated as follows,
S = 0.04 c 2 + 0.2 c 1 + c 0 + 0.2 c 1 + 0.04 c 2
where c i is the body movement times in the ith epoch relative to the current epoch. The epoch is judged as sleep or wake according to the following criteria,
result = sleep , S threshold wake , S > threshold where threshold = 5
where the threshold was set to 5 due to differences in the method for calculating body movements between this sleep sensor and the Actigraph [41]. Based on the above algorithm, the first epoch classified as sleep is identified, and the sleep start time is determined accordingly. The sleep latency is then derived by calculating the time difference between this point and the recorded sleep start time. Furthermore, the total wake time can be calculated based on the state of each epoch. Finally, sleep efficiency can be readily computed using the following equation,
sleep efficiency = sleep duration - wake time sleep duration × 100
At this stage, all six parameters can be obtained. Based on these parameters and Table 1, sleep quality of each participant for each night was scored.

2.4. Participants

Eleven local elder volunteers (7 males and 4 females; mean age: 77.0 ± 7.2 years) were recruited for this study. Because the number of participants was limited, no strict inclusion or exclusion criteria were applied, and data from all volunteers were included in the analysis. The participants were divided into two groups based on their self-reported sleep survey results (See Table 2). Group 1 consisted of “good” sleepers (8 participants: 5 males and 3 females; mean age: 80.6 ± 4.3 years), and Group 2 consisted of “poor” sleepers (3 participants: 2 males and 1 female; mean age: 67.3 ± 0.6 years). The study was conducted in accordance with the Declaration of Helsinki, and approved by the Ethics Committee of Southern TOHOKU Hospital, Fukushima, Japan.

2.5. Study Protocol

Following a detailed explanation of the investigation objective, all participants provided written informed consent before enrollment. After that, we visited each participant’s house one by one to deploy the devices for sleep data collection. The sleep monitoring sensors (see Figure 2) were set under the mattress of every participants. Home gateway for data communication were also set up to the household of each participant. Physiological data, including HR, RR, body movements, and bed-exit events, were continuously monitored during sleep. As a reference for validation, the PSQI [42] was administered three times to each participant at staggered intervals. (The three measurement dates were as follows: 12 November 2016; 23 March 2017; and 17 November 2017). In addition, to ensure prompt monitoring of the participants’ daily status, a dedicated coordinator was assigned to regularly check each participant’s sleep and water usage data through a web-based GUI (see Figure 1). Whenever abnormal data or suspected device issues arose, the coordinator would promptly contact the participant or their family members.

2.6. Statistics

The results analyzed from the proposed ASQI were compared with the reference PSQI. Test–retest reliability (consistency) was assessed with paired t tests and Pearson product-moment correlations for the proposed ASQI global score between any two adjacent months (e.g., July and August). This analysis was conducted across all participants. In addition, the intraclass correlation coefficient (ICC) was calculated to assess the reliability of the ASQI global score between consecutive months, and the results were interpreted according to the ICC classification [43]. To evaluate the validity of the proposed ASQI, we assessed its ability to discriminate between groups known to differ in sleep quality. To this end, we compared the component and global scores of “good” sleepers against those of “poor” sleepers.

3. Results

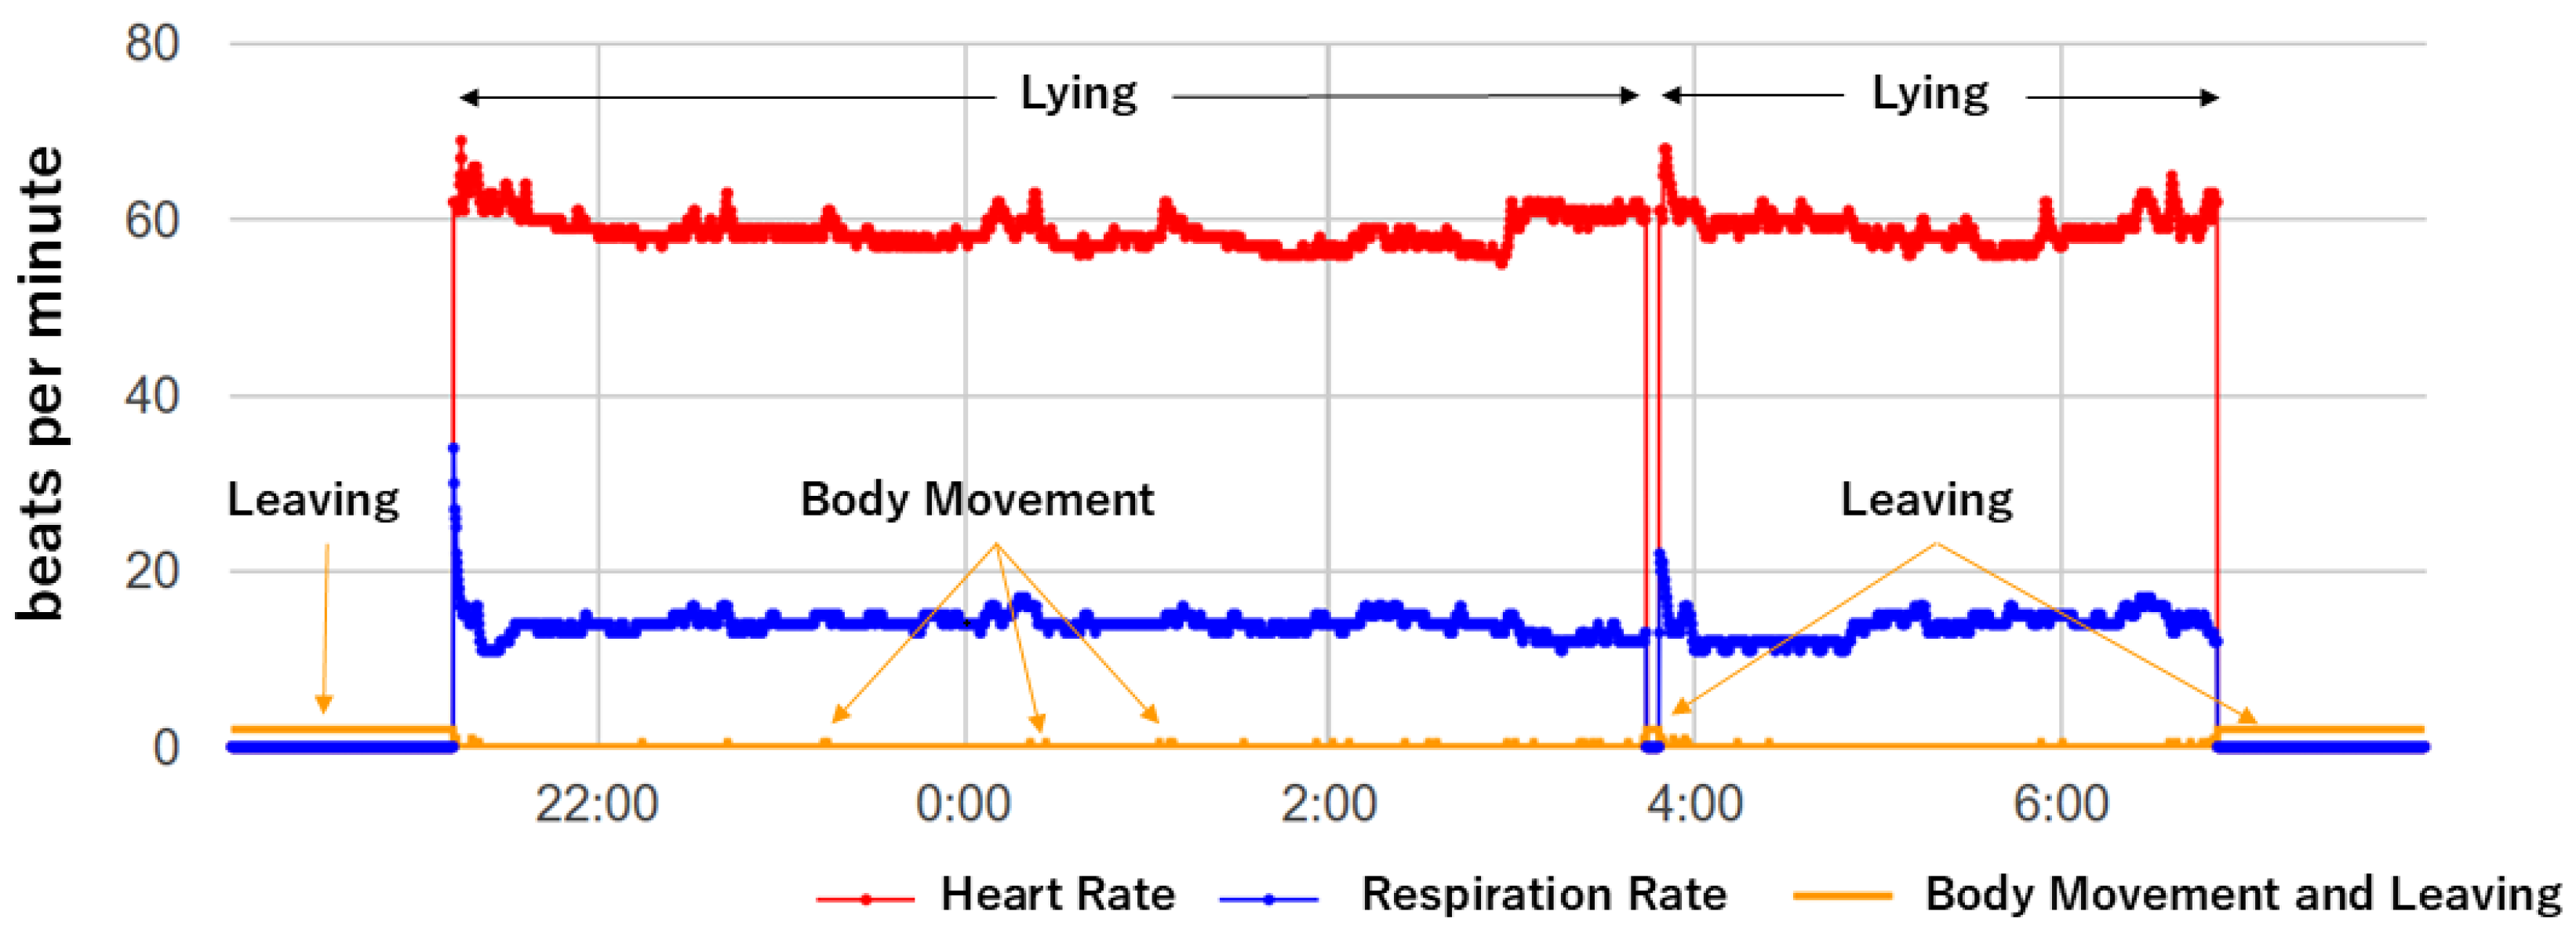
In this study, data collection was conducted over approximately 16 months, beginning in April 2016. In total, around 400 million records were accumulated on the data server. Figure 3 presents an example of an entire night’s sleep data from one participant, illustrating variations in HR, RR, and BW, as well as instances of leaving the bed, which together reflect the participant’s sleep rhythm throughout the night.

3.1. Performance Consistency (Test–Retest Reliability)

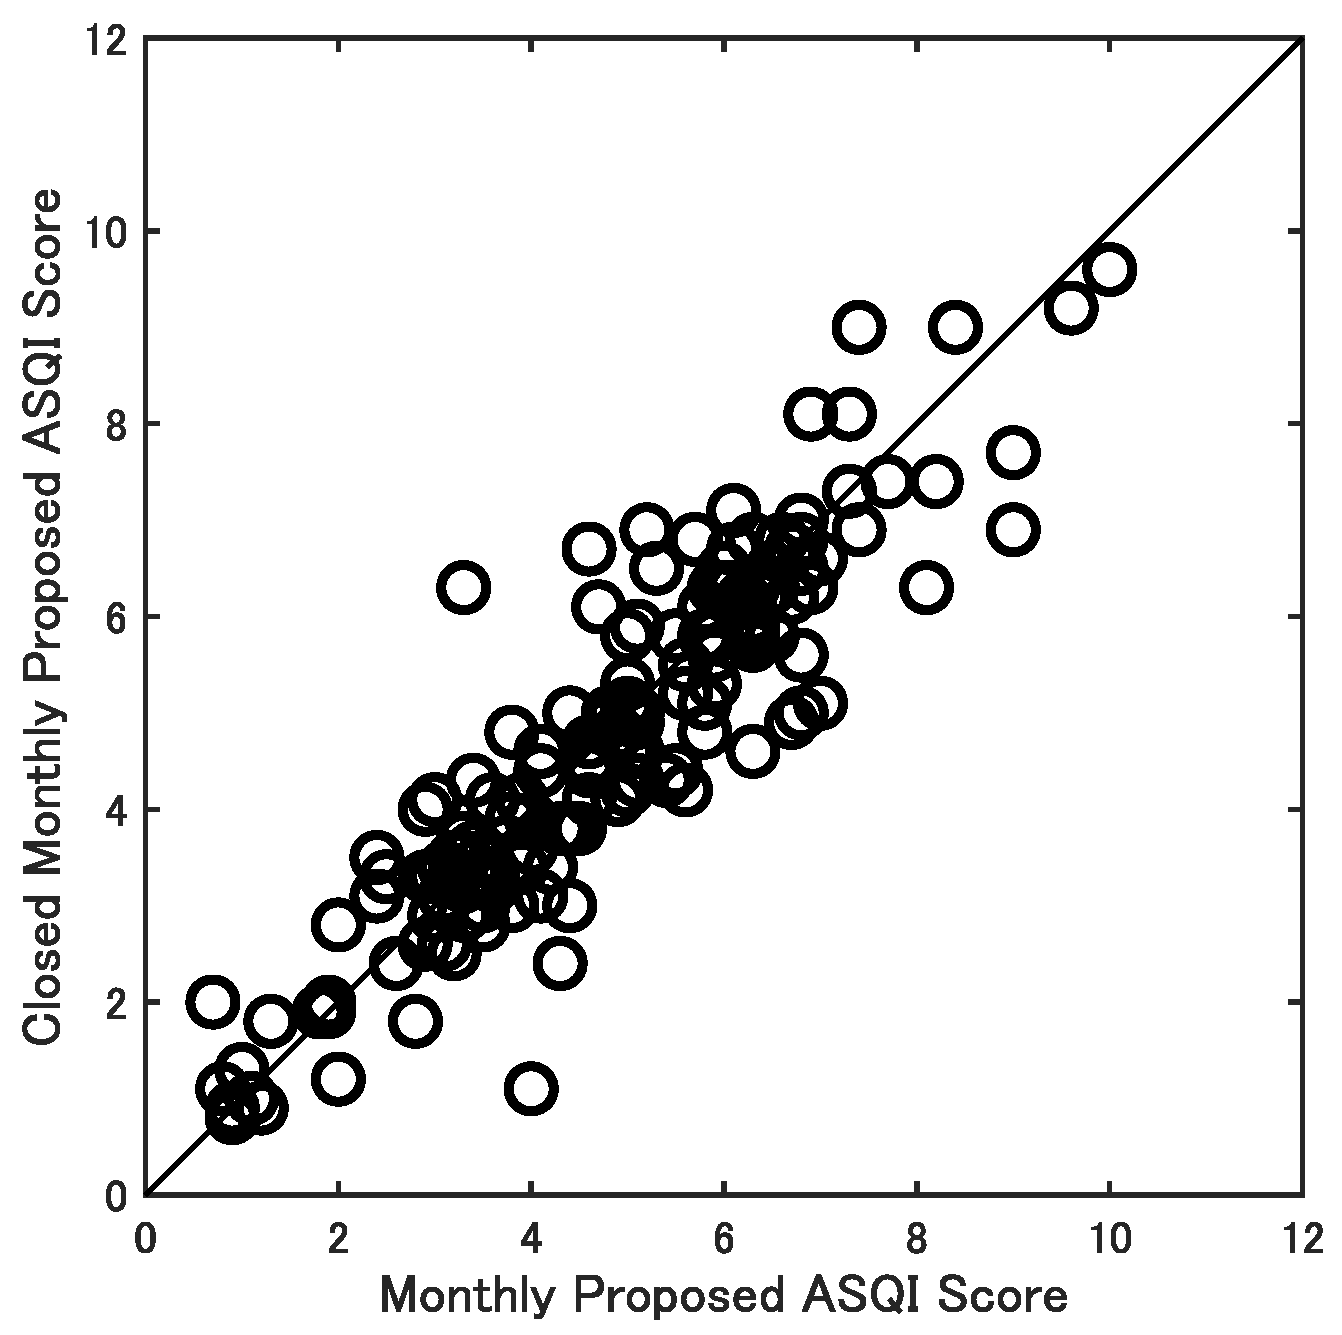
All participants completed the analysis of automatic sleep quality assessment for one year. To analysis the performance of test–retest reliability, we convert the data to 144 pairs of sleep quality assessment results by tieing data of any two adjacent months. Paired t tests for the global ASQI score showed no significant differences between any two adjacent months. Pearson product-moment correlations demonstrated the stability of the proposed ASQI global scores, as shown in Figure 4, where the solid line represents perfect estimation (y = x). The corresponding correlation coefficient between the global ASQI scores of any two adjacent months was 0.91 (p < 0.001). The ICC analysis also revealed test–retest reliability for the proposed index scores. The test–retest reliability was assessed using ICC (3,1), which showed excellent reliability (ICC = 0.95) with a 95% confidence interval ranging from 0.93 to 0.96 ( p < 0.001 ) according to the classification by Koo and Li [43].

3.2. Validity

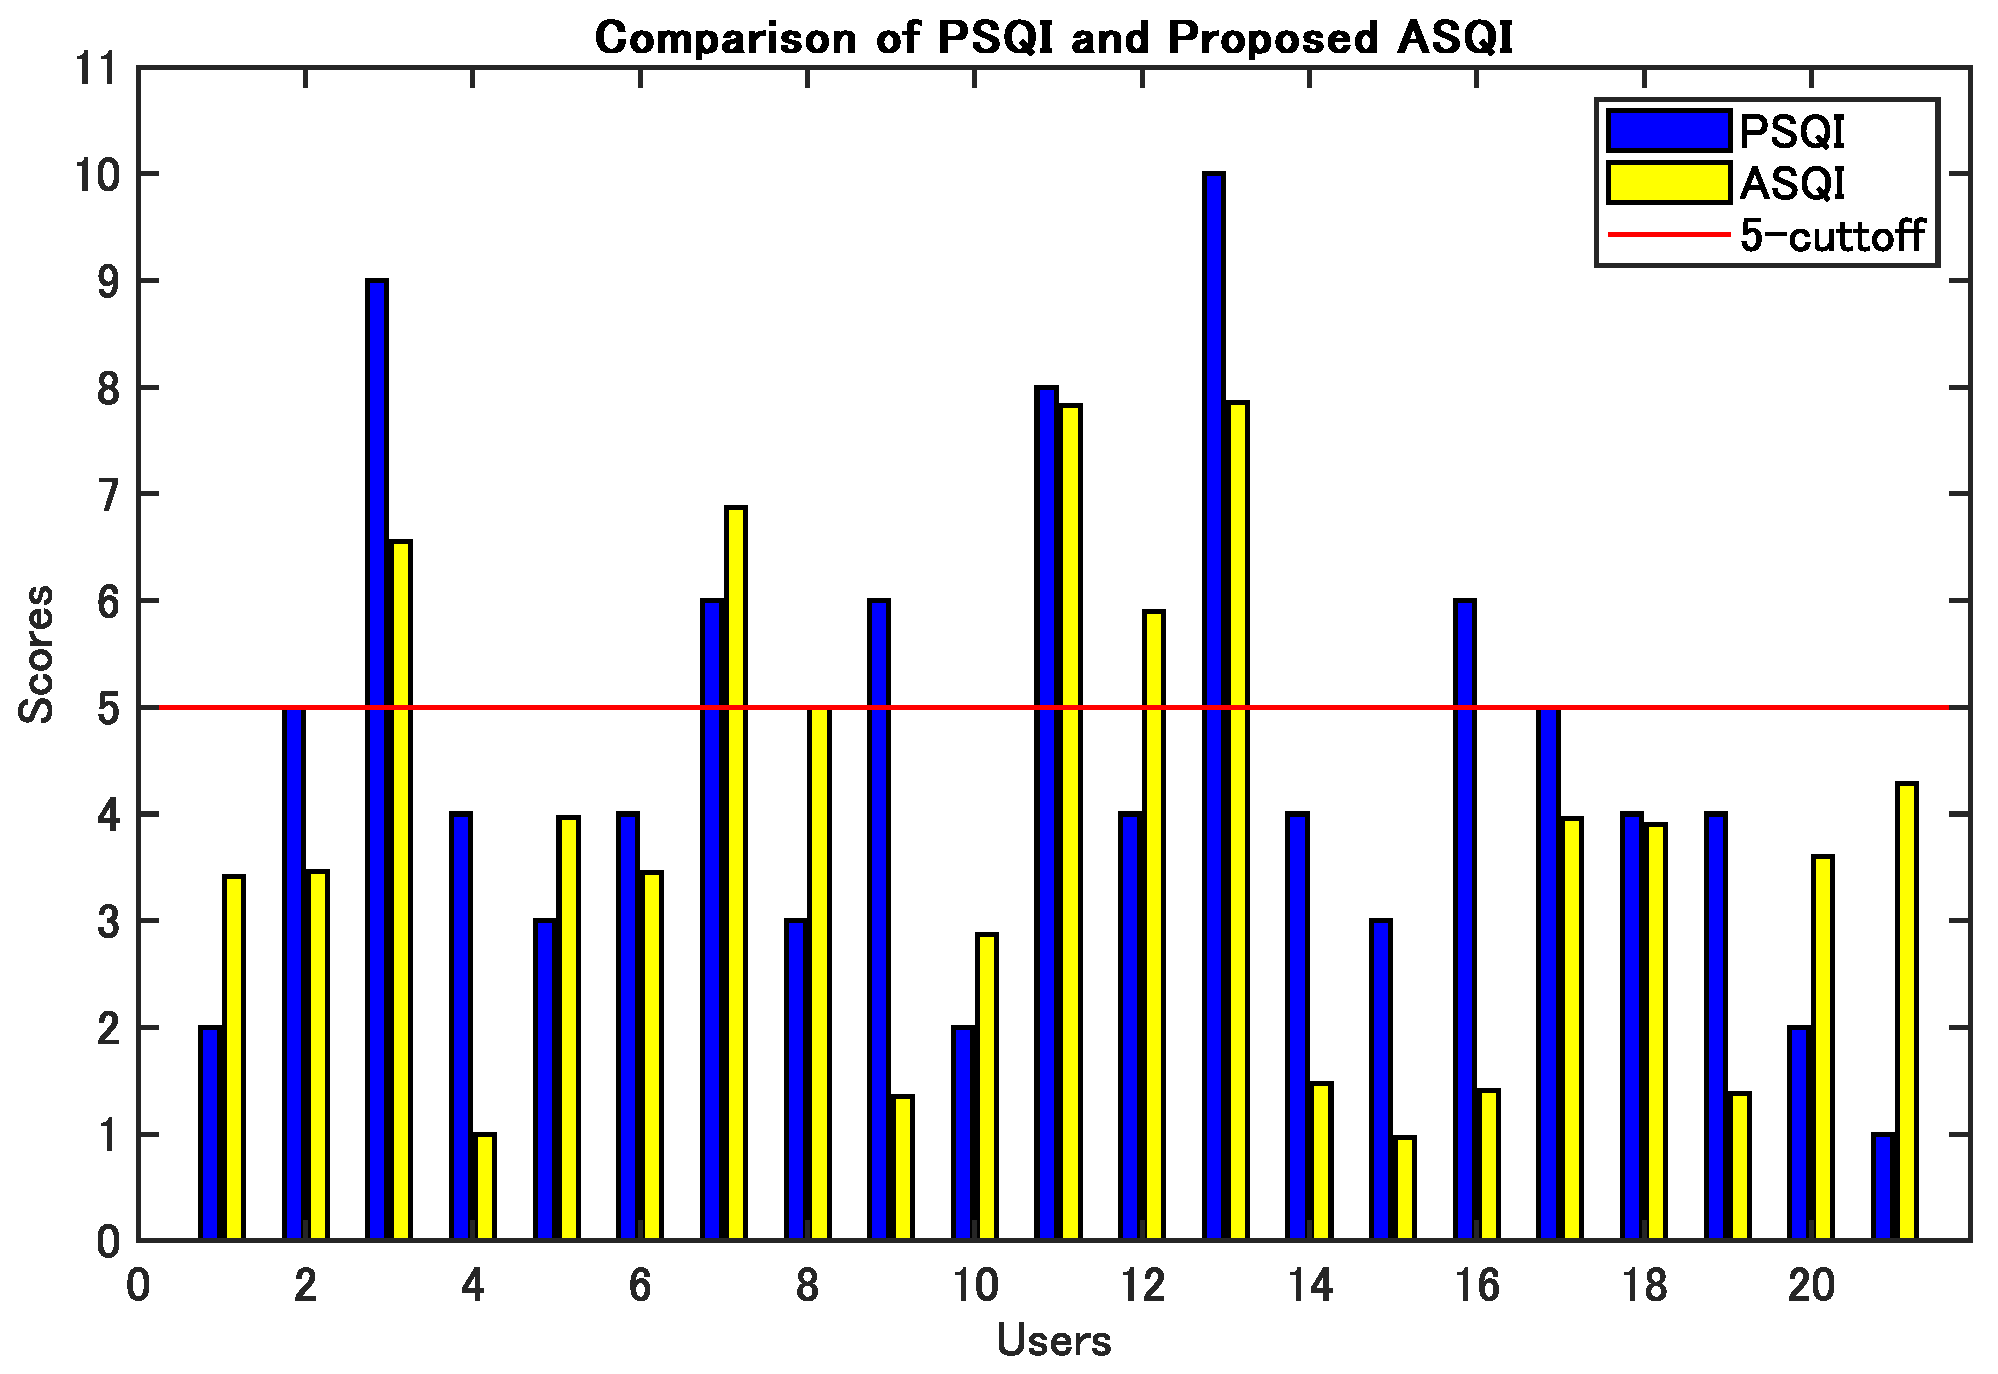
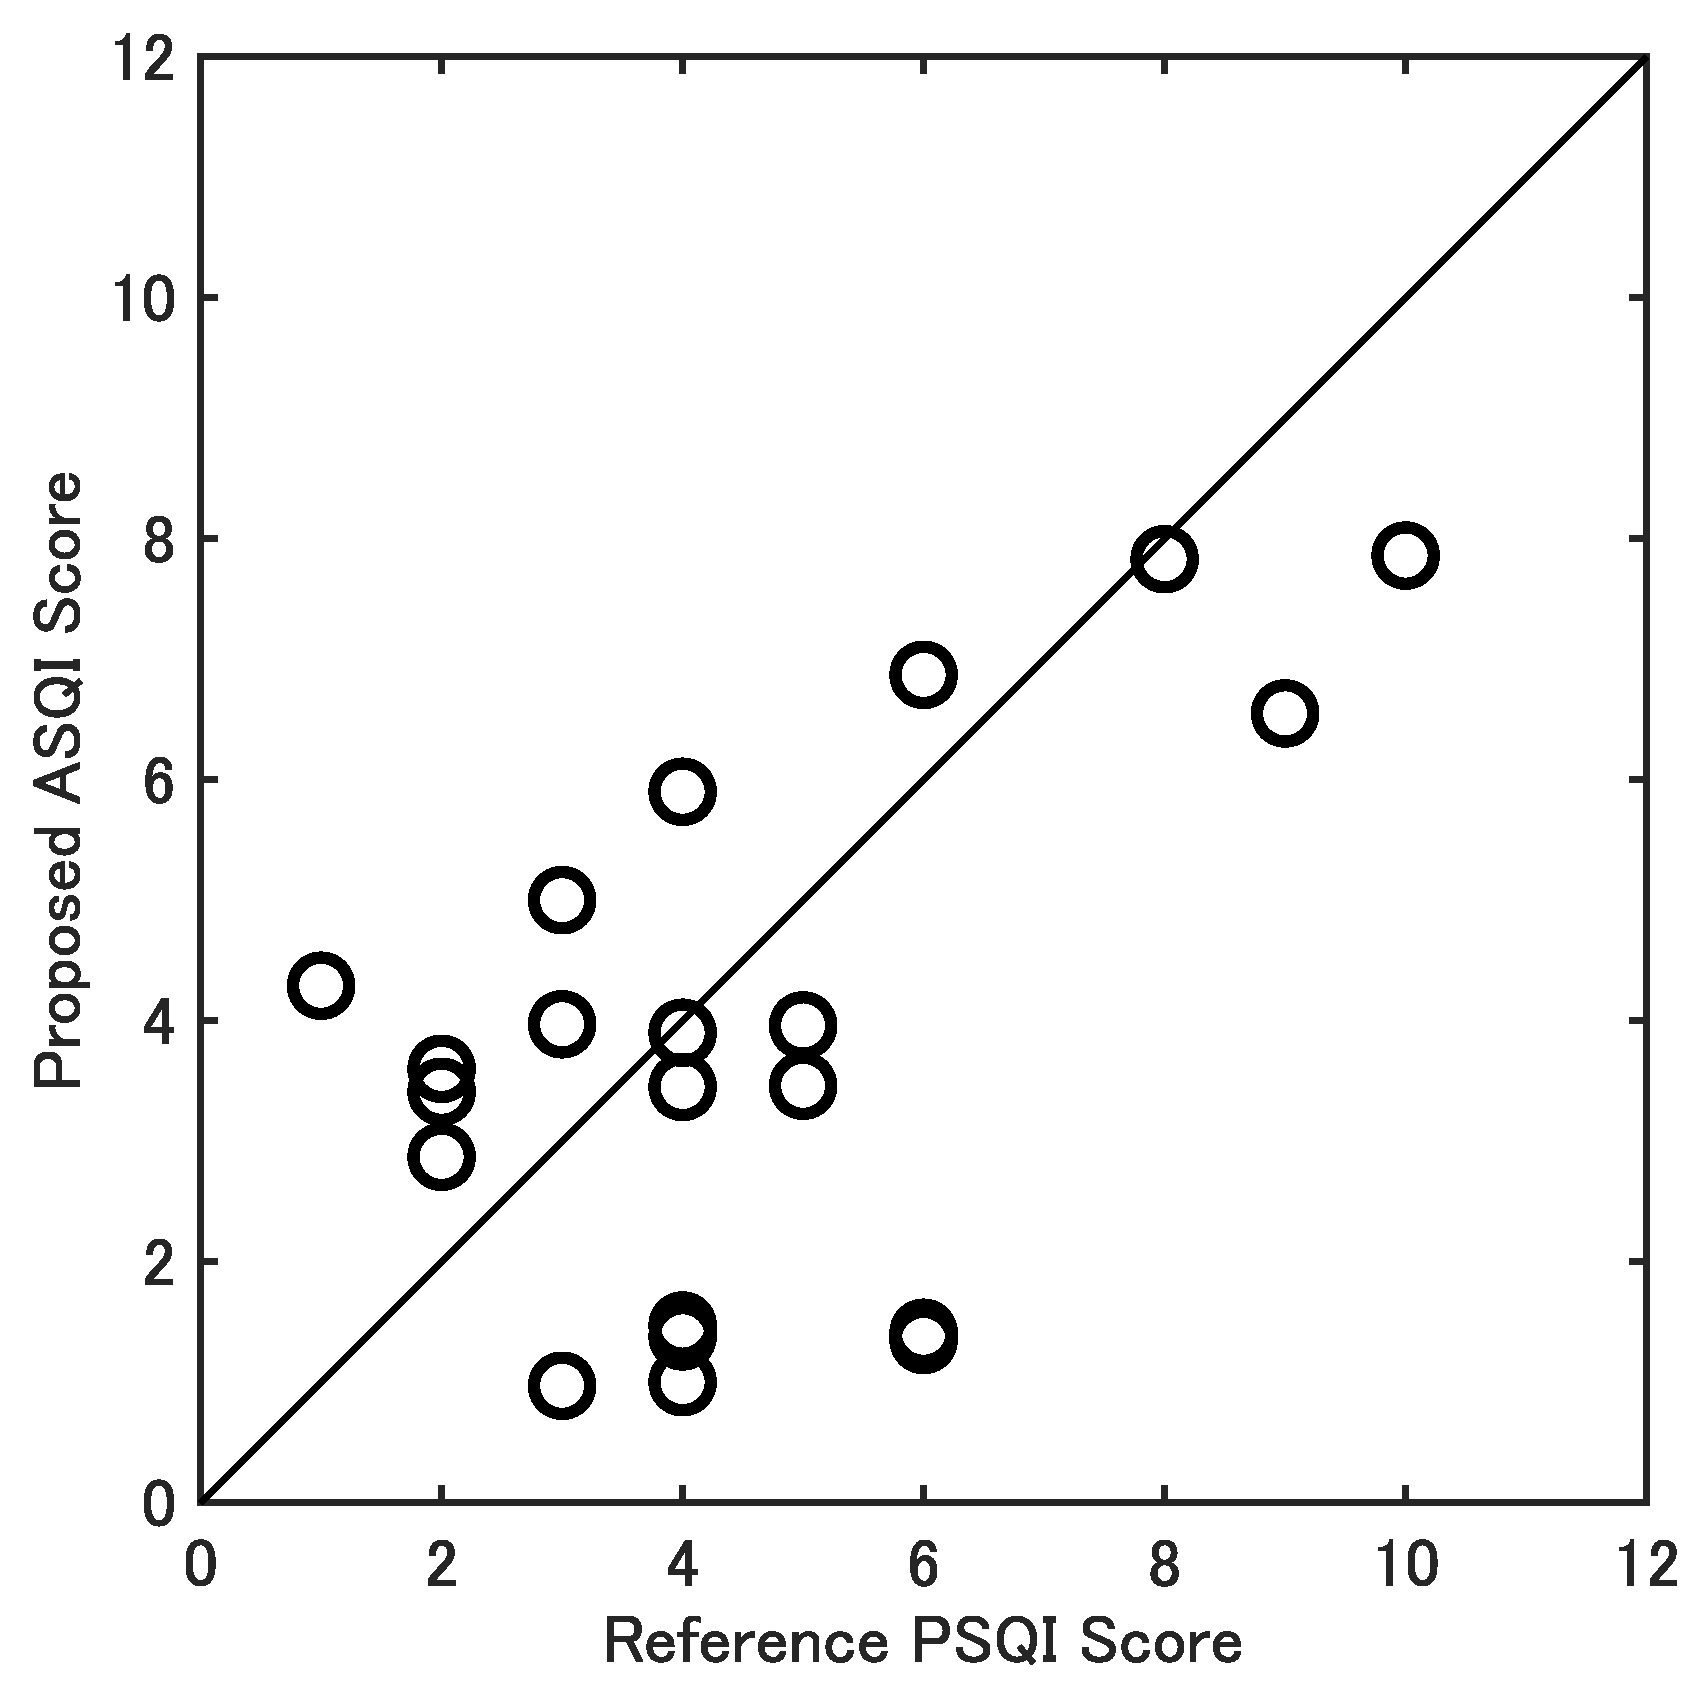
The primary analysis of validity involved a comparison of global scores between the PSQI and the ASQI. Data from three PSQI surveys yielded 21 matched pairs of results. A visual comparison of the histograms in Figure 5 shows substantial agreement between the ASQI and PSQI outcomes; the red horizontal line denotes the sleep quality threshold. This convergent validity was further supported by a significant Pearson correlation coefficient of r = 0.52 ( p < 0.05 ) for the global scores, presented in Figure 6.
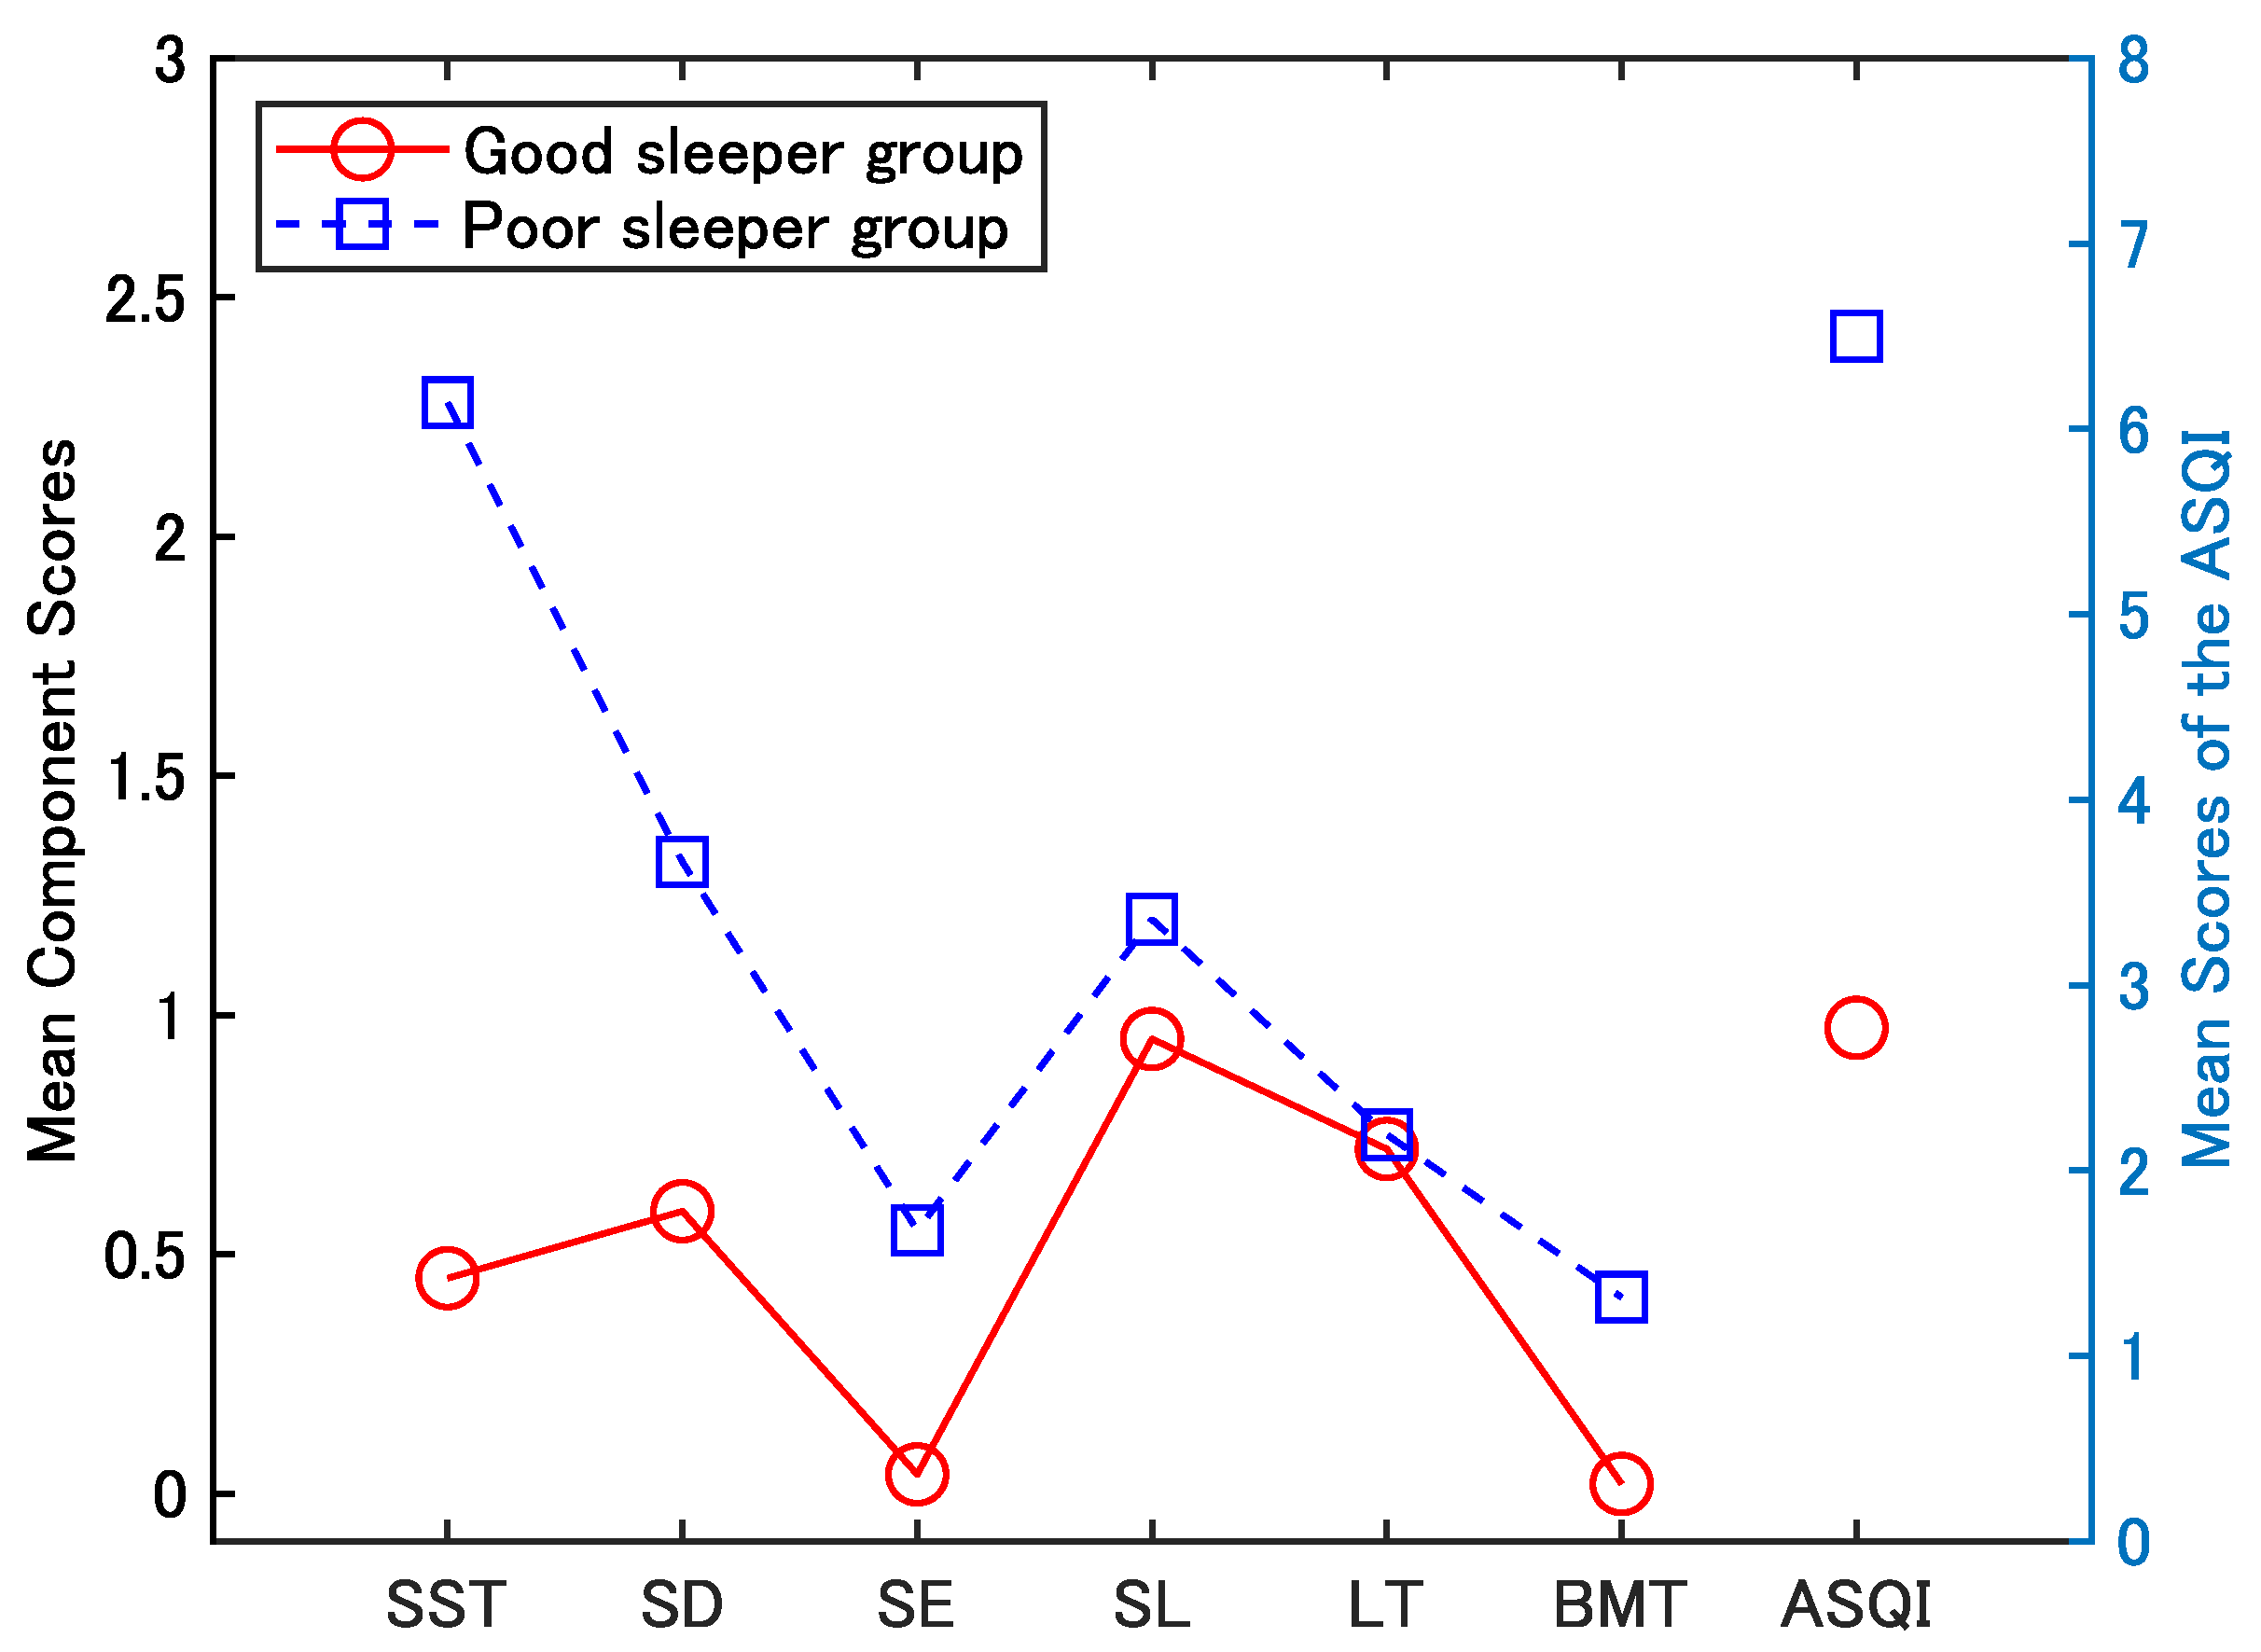
As a secondary analysis of validity, the comparison between the two contrast groups revealed distinct component and global score profiles, as shown in Figure 7. We can see in Figure 7 that the most components and global scores of ASQI differed significantly between two contrast groups except the component of leaving times. The distribution of global ASQI scores also differed significantly between the two groups (Figure 7, right side). The application of a post hoc cutoff score of 5 for ASQI yielded an overall correct classification rate of 85.7% (18/21), corresponding to a sensitivity of 66.7% and a specificity of 93.3%, respectively.
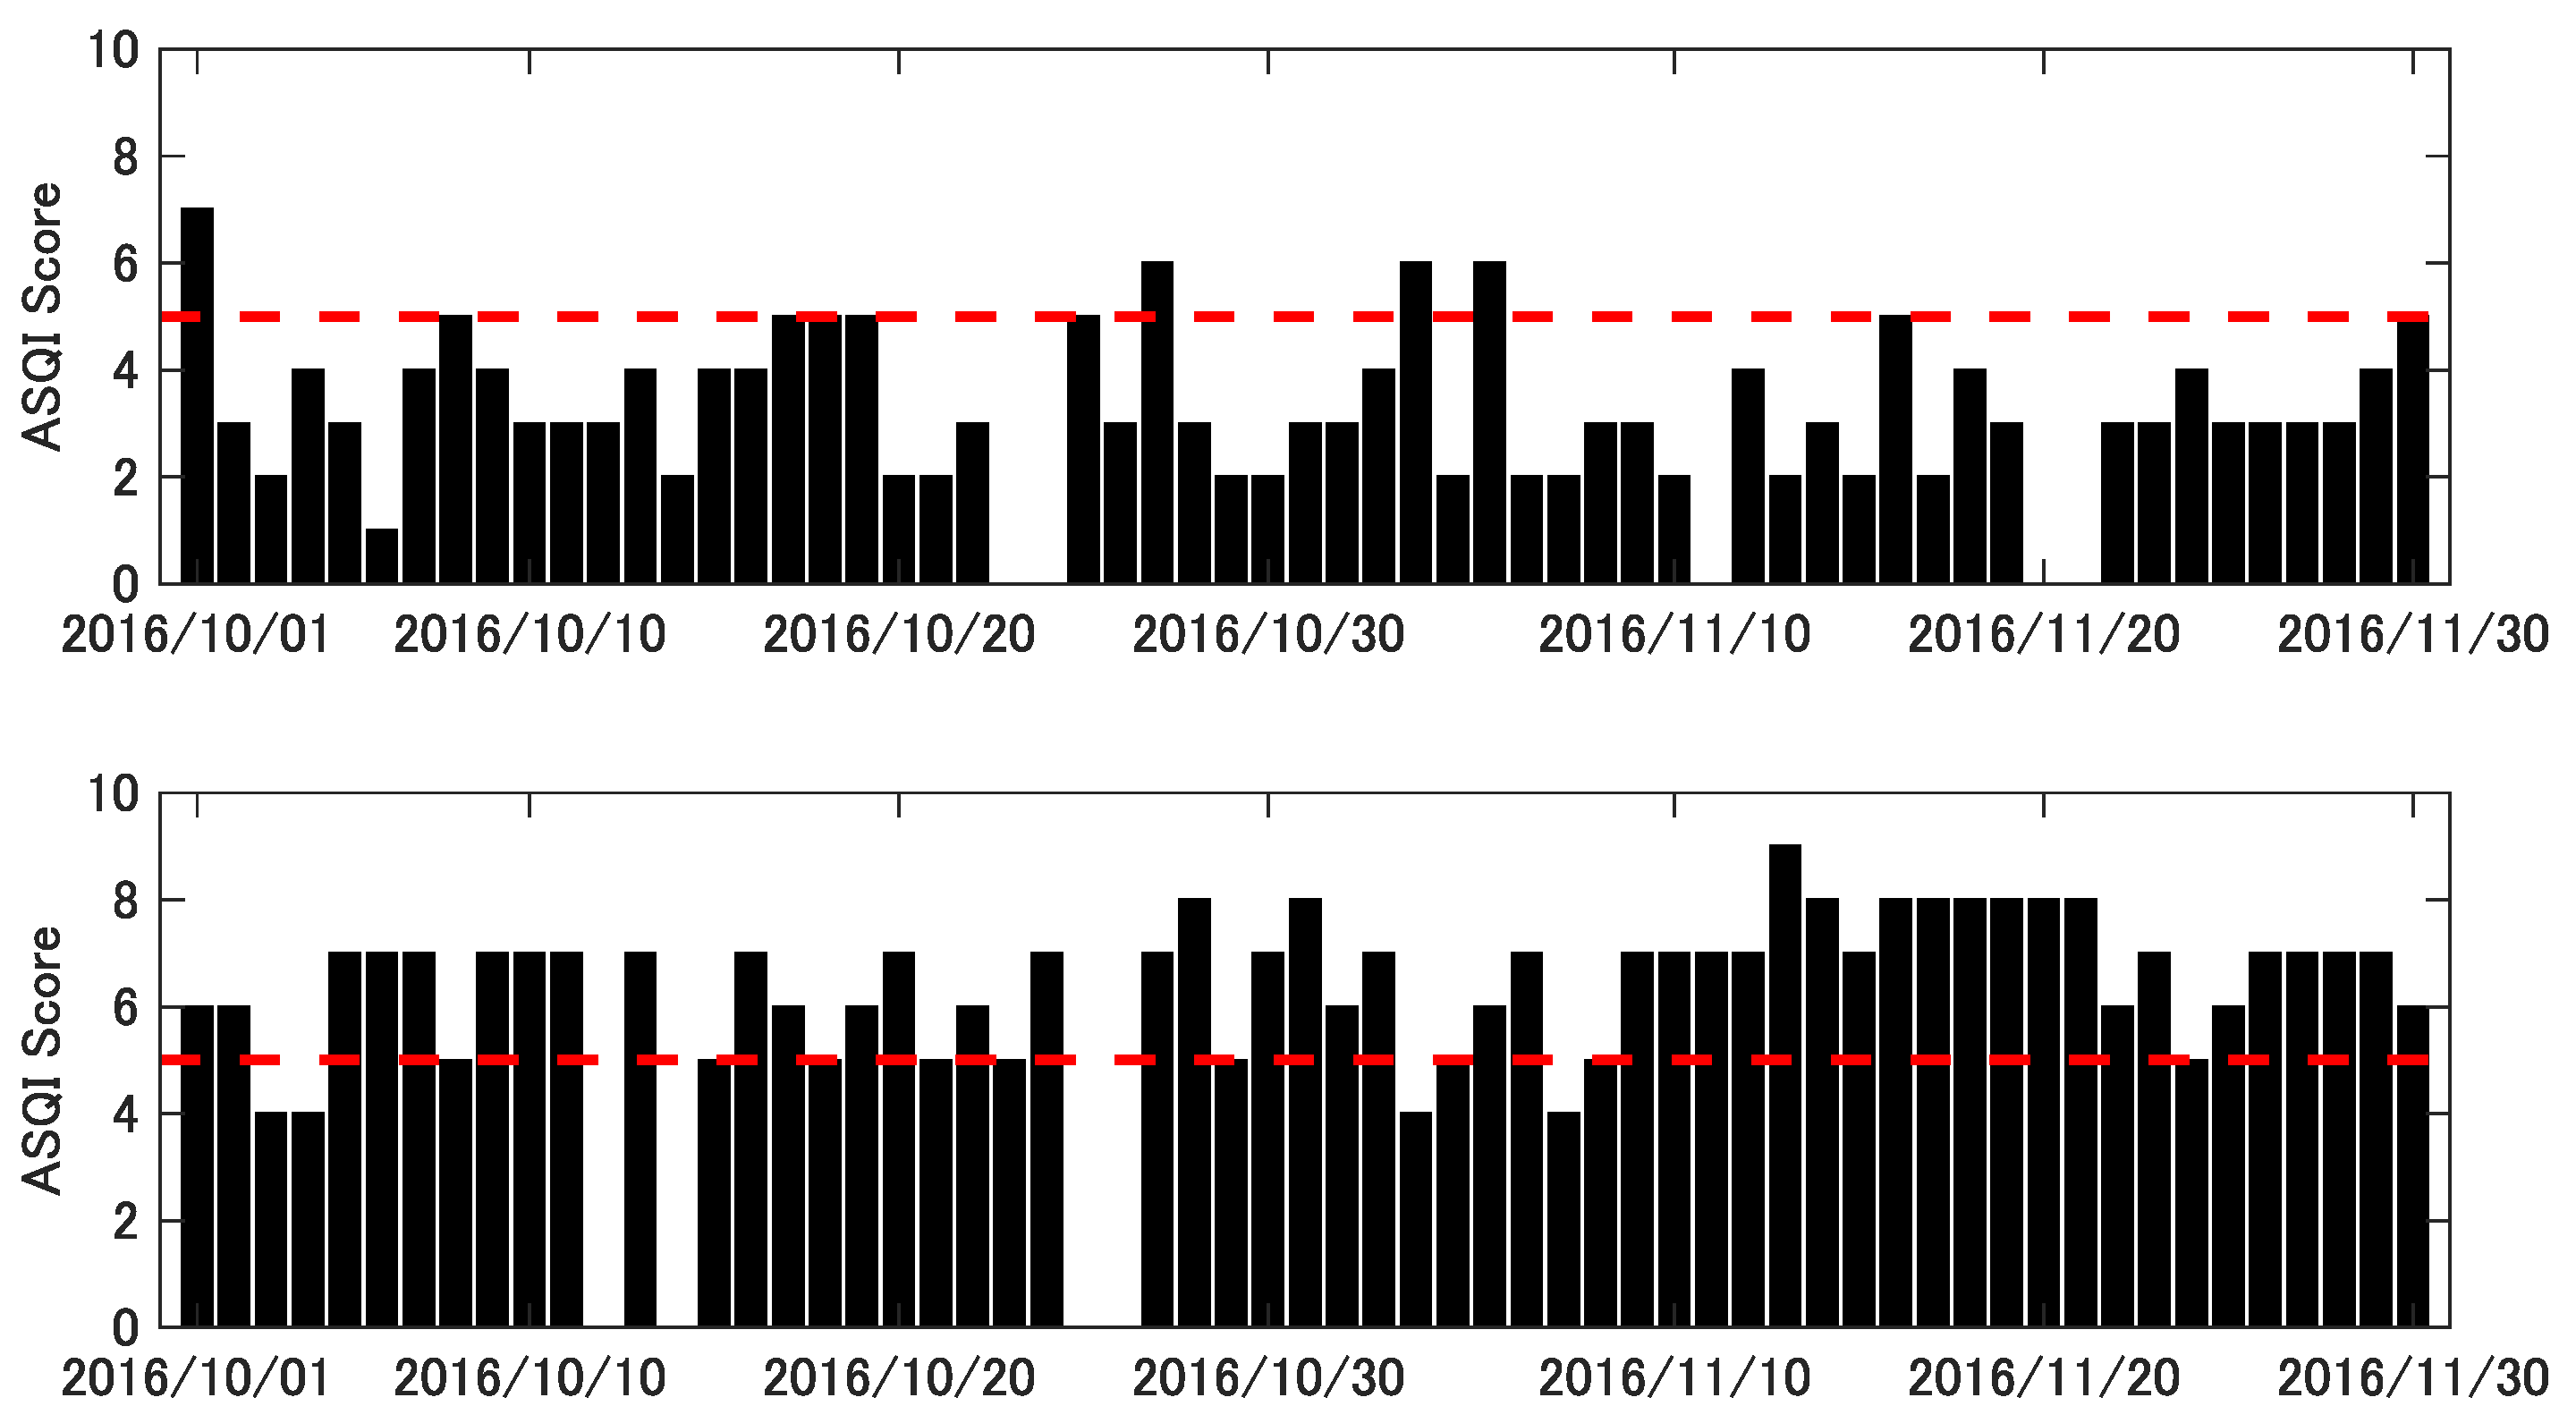
Figure 8 illustrates the two-month trends in sleep quality for two participants, as evaluated by the proposed ASQI. The upper subfigure in Figure 8 indicates a generally better sleep quality compared with that shown in the lower subfigure.

4. Discussion

The precision of the estimation of sleep quality for this method is a crucial factor. Whether estimated sleep quality is accurate depends mainly on several main factors, including measurement of clear and accurate biological signals and the effective combination of components related to sleep features. Because three components of ASQI were inherited directly from PSQI, the results of ASQI were quite close to those of PSQI.
In this study, we proposed an unobtrusive ASQI specifically designed for elderly individuals, and validated it using long-term sleep data collected over one year. The results demonstrated that ASQI shows high consistency with the well-established PSQI, with a Pearson correlation coefficient of 0.52 ( p < 0.05 ), and excellent test–retest reliability r = 0.91 ( p < 0.001 ).
Compared to traditional objective methods such as PSG and Actigraphy, the proposed system offers significant advantages in terms of cost effectiveness, ease of use, and minimal burden on users. Although PSG remains the gold standard, its intrusiveness and complexity limit its suitability for continuous long-term home monitoring. In contrast, the proposed bed sensor system is fully non-contact and suitable for elderly individuals who may have difficulty using wearable or smartphone-based systems. This makes it highly applicable for daily health management in home environments.
The ASQI index includes six components—bedtime, sleep latency, sleep duration, sleep efficiency, body movement count, and number of times leaving bed—all of which are objectively derived from physiological data. Incorporating parameters such as body movement and bed-exit events is particularly relevant to the elderly population, who often experience fragmented sleep due to nocturia and other age-related issues.
Validity analysis revealed that ASQI could effectively distinguish between good and poor sleepers, with statistically significant differences observed in all components except the “leaving times” category. The classification accuracy of ASQI was also promising, with a sensitivity of 66.7% and a specificity of 93.3%, correctly identifying 85.7% of participants based on a threshold score of 5. These findings indicate that the ASQI has potential not only for continuous sleep monitoring but also as a screening tool for sleep disturbances in the elderly.
Nevertheless, the proposed sleep quality index has certain limitations that present opportunities for further refinement in future studies. First, a key limitation of our work is the lack of a prospective sample size calculation. The cohort was constituted from elderly residents in a designated region, which fixed the number of participants. Therefore, while our analyses revealed statistically significant findings for the primary outcome, the precision of our estimates for secondary outcomes may be limited. We acknowledge that this affects the generalizability of our conclusions. Nonetheless, our findings provide a foundational platform for future research that employs a hypothesis-driven design with pre-specified power. To rigorously evaluate the validity of the proposed method, future studies should enroll larger and more diverse cohorts from wider populations. Moreover, while PSQI was used as a reference, it is a subjective measure, and some discrepancies between subjective and objective data are inevitable [12]. Future studies should involve larger, more diverse populations, and possibly include PSG as a clinical benchmark. Third, the proposed sleep quality index did not incorporate heart rate or respiration rate, even though these parameters can be measured by the sensor used in this study. Consequently, a key direction for future work is to integrate these features, or their derivatives, into the index. Fourth, the maximum score of our index (18) is lower than that of the PSQI (21), as it currently lacks one comparative component. This structural difference can lead to discrepancies between the two scores. To address this limitation and enhance comparability, we plan to add another component, such as one including the cardiorespiratory metrics mentioned above. Fifth, the bedside sensors employed in this project successfully passed a one-year long-term field test. While the majority of sensors performed reliably, a small number of units experienced failures—such as broken wiring due to poor soldering or sensor detachment—requiring replacement during the testing period. Some participants slept on traditional tatami mats, which necessitated repositioning the sensors each night. This repeated setup and removal likely contributed to internal wear and eventual malfunction. Additionally, the sensors required wired power and LAN connections, which posed usability challenges for tatami users. Replacing wired LAN with wireless communication in future versions could improve both convenience and system robustness.
Despite these limitations, our findings highlight the potential of noncontact, sensor-based sleep monitoring systems for elderly care. The proposed ASQI provides a practical and scalable solution for long-term sleep quality assessment, with implications for personalized health monitoring, early detection of sleep-related disorders, and better overall well-being among the aging population.

5. Conclusions

In conclusion, the proposed ASQI framework offers a viable and scalable solution for continuous sleep quality assessment, representing a meaningful advancement in unobtrusive health monitoring for the aging population.

Author Contributions

Conceptualization, Z.T. and L.J.; methodology, Z.T. and Y.M.; software, Z.T.; validation, Z.T. and L.J.; data curation, L.J.; writing—original draft preparation, Z.T.; writing—review and editing, Y.M., L.J. and W.C.; visualization, L.J.; supervision, Y.M. and W.C.; project administration, Z.T. All authors have read and agreed to the published version of the manuscript.

Funding

This research received no external funding.

Institutional Review Board Statement

The study was conducted in accordance with the Declaration of Helsinki, and approved by the Ethics Committee of Southern TOHOKU Hospital, Fukushima, Japan. The approval was granted on 28 September 2015.

Informed Consent Statement

Informed consent was obtained from all participants involved in the study.

Data Availability Statement

The data presented in this study are available from the corresponding author upon reasonable request.

Acknowledgments

We thank NJI Co., Ltd. for providing the Safety Sheep Sensor α for this study and for their assistance in data collection.

Conflicts of Interest

The authors declare no conflict of interest.

Abbreviations

The following abbreviations are used in this manuscript:
ASQIAutomatic Sleep Quality Index
PSQIPittsburgh Sleep Quality Index
PSGPolysomnography
PPGPhotoplethysmography
BCGBallistocardiography
HRHeart Rate
RRRespiratory Rate
BWBody Movement
SSTSleep Start Time
SDSleep Duration
SESleep Efficiency
SLSleep Latency
LTLeaving Times
BMTBody Movement Times

References

  1. Kim, K.; Uchiyama, M.; Okawa, M.; Liu, X.; Ogihara, R. An epidemiological study of insomnia among the Japanese general population. Sleep 2000, 23, 41–47. [Google Scholar] [CrossRef]
  2. Itani, O.; Kaneita, Y.; Munezawa, T.; Mishima, K.; Jike, M.; Nakagome, S.; Tokiya, M.; Ohida, T. Nationwide epidemiological study of insomnia in Japan. Sleep Med. 2016, 25, 130–138. [Google Scholar] [CrossRef] [PubMed]
  3. Penzel, T. Sleep Quality Assessment: Challenges and Opportunities. IEEE Pulse 2016, 7, 3. [Google Scholar] [CrossRef]
  4. Fabbri, M.; Beracci, A.; Martoni, M.; Meneo, D.; Tonetti, L.; Natale, V. Measuring Subjective Sleep Quality: A Review. Int. J. Environ. Res. Public Health 2021, 18, 1082. [Google Scholar] [CrossRef]
  5. Chen, W.H.; Chen, C.T.; Cheng, K.H.; Tsao, Y.C.; Lin, Y.H.; Chen, J.Y. Associations Between Sleep Quality and Self-Reported Health Status in Middle-Aged and Older Adults: A Community-Based, Cross-Sectional Study in Northern Taiwan. Healthcare 2025, 13, 1272. [Google Scholar] [CrossRef]
  6. Buysse, D.J.; Reynolds, C.F.; Monk, T.H.; Berman, S.R.; Kupfer, D.J. The Pittsburgh sleep quality index: A new instrument for psychiatric practice and research. Psychiatry Res. 1989, 28, 193–213. [Google Scholar] [CrossRef] [PubMed]
  7. Hinz, A.; Glaesmer, H.; Brähler, E.; Löffler, M.; Engel, C.; Enzenbach, C.; Hegerl, U.; Sander, C. Sleep quality in the general population: Psychometric properties of the Pittsburgh Sleep Quality Index, derived from a German community sample of 9284 people. Sleep Med. 2017, 30, 57–63. [Google Scholar] [CrossRef]
  8. Berry, R.B.; Brooks, R.; Gamaldo, C.E.; Harding, S.M.; Marcus, C.; Vaughn, B.V. The AASM Manual for the Scoring of Sleep and Associated Events. Rules, Terminology and Technical Specifications; American Academy of Sleep Medicine: Darien, IL, USA, 2012; Volume 176, p. 7. [Google Scholar]
  9. Kaplan, K.A.; Hirshman, J.; Hernandez, B.; Stefanick, M.L.; Hoffman, A.R.; Redline, S.; Ancoli-Israel, S.; Stone, K.; Friedman, L.; Zeitzer, J.M.; et al. When a gold standard isn’t so golden: Lack of prediction of subjective sleep quality from sleep polysomnography. Biol. Psychol. 2017, 123, 37–46. [Google Scholar] [CrossRef]
  10. Chen, Y.; Zhou, E.; Wang, Y.; Wu, Y.; Xu, G.; Chen, L. The past, present, and future of sleep quality assessment and monitoring. Brain Res. 2023, 1810, 148333. [Google Scholar] [CrossRef] [PubMed]
  11. Girschik, J.; Fritschi, L.; Heyworth, J.; Waters, F. Validation of self-reported sleep against actigraphy. J. Epidemiol. 2012, 22, 462–468. [Google Scholar] [CrossRef]
  12. Masaki, M.; Tsumoto, S.; Tani, A.; Tominaga, M.; Seol, J.; Chiba, S.; Miyanishi, K.; Nishida, K.; Kawana, F.; Amemiya, T.; et al. Discrepancies between subjective and objective sleep assessments revealed by in-home electroencephalography during real-world sleep. Proc. Natl. Acad. Sci. USA 2025, 122, e2412895121. [Google Scholar] [CrossRef] [PubMed]
  13. Lechat, B.; Hirotsu, C.; Appleton, S.; Younes, M.; Adams, R.J.; Vakulin, A.; Hansen, K.; Zajamsek, B.; Wittert, G.; Catcheside, P.; et al. A novel EEG marker predicts perceived sleepiness and poor sleep quality. Sleep 2022, 45, zsac051. [Google Scholar] [CrossRef]
  14. Li, Y.; Li, J.; Yan, C.; Dong, K.; Kang, Z.; Zhang, H.; Liu, C. Sleep Quality Evaluation Based on Single-Lead Wearable Cardiac Cycle Acquisition Device. Sensors 2023, 23, 328. [Google Scholar] [CrossRef] [PubMed]
  15. Ibáñez, V.; Silva, J.; Cauli, O. A survey on sleep questionnaires and diaries. Sleep Med. 2018, 42, 90–96. [Google Scholar] [CrossRef]
  16. Tamura, T.; Huang, M. Unobtrusive Bed Monitor State of the Art. Sensors 2025, 25, 1879. [Google Scholar] [CrossRef]
  17. Yamakawa, M.; Kang, H.S.; Wang, H.; Konno, R. Sleep quality assessment of adults in care settings using non-wearable sleep trackers: Scoping review. Int. J. Nurs. Pract. 2024, 30, e13240. [Google Scholar] [CrossRef] [PubMed]
  18. Baniassadi, A.; Manor, B.; Yu, W.; Travison, T.; Lipsitz, L. Nighttime ambient temperature and sleep in community-dwelling older adults. Sci. Total Environ. 2023, 899, 165623. [Google Scholar] [CrossRef]
  19. Dashkevych, O.; Portnov, B.A. Using Low-Cost Technology Devices for Monitoring Sleep and Environmental Factors Affecting It: A Systematic Review of the Literature. Appl. Sci. 2025, 15, 1188. [Google Scholar] [CrossRef]
  20. Jiang, L.; Tang, Z.; Liu, Z.; Chen, W.; Kitamura, K.-i.; Nemoto, T. Automatic sleep monitoring system for home healthcare. In Proceedings of the 2012 IEEE-EMBS International Conference on Biomedical and Health Informatics, Hong Kong, China, 5–7 January 2012; pp. 894–897. [Google Scholar]
  21. Cay, G.; Ravichandran, V.; Sadhu, S.; Zisk, A.; Salisbury, A.; Solanki, D.; Mankodiya, K. Recent Advancement in Sleep Technologies: A Literature Review on Clinical Standards, Sensors, Apps, and AI Methods. IEEE Access 2022, 10, 104737–104756. [Google Scholar] [CrossRef]
  22. Zhu, X.; Chen, W.; Nemoto, T.; Kanemitsu, Y.; Kitamura, K.i.; Yamakoshi, K.i.; Wei, D. Real-time monitoring of respiration rhythm and pulse rate during sleep. IEEE Trans. Biomed. Eng. 2006, 53, 2553–2563. [Google Scholar] [CrossRef]
  23. Zhu, X.; Chen, W.; Tang, Z.; Nemoto, T.; Wei, D. Automatic home care system for monitoring HR/RR during sleep. In Proceedings of the 2008 30th Annual International Conference of the IEEE Engineering in Medicine and Biology Society, Vancouver, BC, Canada, 21–24 August 2008; pp. 522–525. [Google Scholar]
  24. Widasari, E.R.; Tanno, K.; Tamura, H. Automatic sleep quality assessment for obstructive sleep apnea patients based on HRV spectrum analysis. In Proceedings of the 2019 IEEE International Conference on Systems, Man and Cybernetics (SMC), Bari, Italy, 6–9 October 2019; pp. 1187–1192. [Google Scholar]
  25. Kalintha, W.; Kato, T.; Fukui, K. SleepAge: Sleep Quality Assessment from Nocturnal Sounds in Home Environment. Procedia Comput. Sci. 2020, 176, 898–907. [Google Scholar] [CrossRef]
  26. Nakajima, K.; Matsumoto, Y.; Tamura, T. Development of real-time image sequence analysis for evaluating posture change and respiratory rate of a subject in bed. Physiol. Meas. 2001, 22, N21. [Google Scholar] [CrossRef]
  27. Liao, W.H.; Kuo, J.H. Sleep monitoring system in real bedroom environment using texture-based background modeling approaches. J. Ambient. Intell. Humaniz. Comput. 2013, 4, 57–66. [Google Scholar] [CrossRef]
  28. Chen, Z.; Lin, M.; Chen, F.; Lane, N.D.; Cardone, G.; Wang, R.; Li, T.; Chen, Y.; Choudhury, T.; Campbell, A.T. Unobtrusive sleep monitoring using smartphones. In Proceedings of the 2013 7th International Conference on Pervasive Computing Technologies for Healthcare (PervasiveHealth), Venice, Italy, 5–8 May 2013; pp. 145–152. [Google Scholar]
  29. Ghazi, S.N.; Behrens, A.; Berner, J.; Sanmartin Berglund, J.; Anderberg, P. Objective sleep monitoring at home in older adults: A scoping review. J. Sleep Res. 2025, 34, e14436. [Google Scholar] [CrossRef]
  30. Lam, A.; Simonetti, S.; D’Rozario, A.; Ireland, D.; Bradford, D.; Fripp, J.; Naismith, S.L. Perceptions of the Use of Mobile Apps to Assess Sleep-Dependent Memory in Older Adults With Subjective and Objective Cognitive Impairment: Focus Group Approach. JMIR Aging 2025, 8, e68147. [Google Scholar] [CrossRef]
  31. Tuominen, J.; Peltola, K.; Saaresranta, T.; Valli, K. Sleep parameter assessment accuracy of a consumer home sleep monitoring ballistocardiograph beddit sleep tracker: A validation study. J. Clin. Sleep Med. 2019, 15, 483–487. [Google Scholar] [CrossRef] [PubMed]
  32. Nagatomo, K.; Masuyama, T.; Iizuka, Y.; Makino, J.; Shiotsuka, J.; Sanui, M. Validity of an under-mattress sensor for objective sleep measurement in critically ill patients: A prospective observational study. J. Intensive Care 2020, 8, 16. [Google Scholar] [CrossRef]
  33. Ikuta, K.; Aishima, M.; Noguchi-Watanabe, M.; Fukui, S. Feasibility of Monitoring Heart and Respiratory Rates Using Nonwearable Devices and Consistency of the Measured Parameters: Pilot Feasibility Study. JMIR Hum. Factors 2024, 11, e56547. [Google Scholar] [CrossRef]
  34. Tang, Z.; Jiang, L.; Sakatani, K. Development of Sleep Quality Assessment Method for Elderly People Based on Unobtrusive Sleep Monitoring System. In Proceedings of the Life Engineering Symposium 2018 (LE 2018), Aizu, Japan, 10–12 September 2018; pp. 1–4. [Google Scholar]
  35. Chaput, J.P.; Dutil, C.; Featherstone, R.; Ross, R.; Giangregorio, L.; Saunders, T.J.; Janssen, I.; Poitras, V.J.; Kho, M.E.; Ross-White, A.; et al. Sleep timing, sleep consistency, and health in adults: A systematic review. Appl. Physiol. Nutr. Metab. 2020, 45, S232–S247. [Google Scholar] [CrossRef]
  36. Sletten, T.L.; Weaver, M.D.; Foster, R.G.; Gozal, D.; Klerman, E.B.; Rajaratnam, S.M.; Roenneberg, T.; Takahashi, J.S.; Turek, F.W.; Vitiello, M.V.; et al. The importance of sleep regularity: A consensus statement of the National Sleep Foundation sleep timing and variability panel. Sleep Health 2023, 9, 801–820. [Google Scholar] [CrossRef] [PubMed]
  37. Higami, Y.; Yamakawa, M.; Shigenobu, K.; Kamide, K.; Makimoto, K. High frequency of getting out of bed in patients with Alzheimer’s disease monitored by non-wearable actigraphy. Geriatr. Gerontol. Int. 2019, 19, 130–134. [Google Scholar] [CrossRef]
  38. Walsh, L.; Moloney, E.; McLoone, S. Identification of nocturnal movements during sleep using the non-contact under mattress bed sensor. In Proceedings of the 2011 Annual International Conference of the IEEE Engineering in Medicine and Biology Society, Boston, MA, USA, 30 August–3 September 2011; pp. 1660–1663. [Google Scholar]
  39. Huysmans, D.; Borzée, P.; Testelmans, D.; Buyse, B.; Willemen, T.; Van Huffel, S.; Varon, C. Evaluation of a commercial ballistocardiography sensor for sleep apnea screening and sleep monitoring. Sensors 2019, 19, 2133. [Google Scholar] [CrossRef]
  40. Saleh, D.; Bertisch, S.M.; Reid, M.; Lim, A.; Purcell, S.; Redline, S. Actigraphy-derived sleep fragmentation index: Convergent validity and associations with clinical outcomes. J. Clin. Sleep Med. 2025, 21, 11754. [Google Scholar] [CrossRef]
  41. Peng, Y.T.; Lin, C.Y.; Sun, M.T.; Landis, C.A. Multimodality sensor system for long-term sleep quality monitoring. IEEE Trans. Biomed. Circuits Syst. 2008, 1, 217–227. [Google Scholar] [CrossRef] [PubMed]
  42. Doi, Y.; Minowa, M.; Uchiyama, M.; Okawa, M.; Kim, K.; Shibui, K.; Kamei, Y. Psychometric assessment of subjective sleep quality using the Japanese version of the Pittsburgh Sleep Quality Index (PSQI-J) in psychiatric disordered and control subjects. Psychiatry Res. 2000, 97, 165–172. [Google Scholar] [CrossRef] [PubMed]
  43. Koo, T.K.; Li, M.Y. A guideline of selecting and reporting intraclass correlation coefficients for reliability research. J. Chiropr. Med. 2016, 15, 155–163. [Google Scholar] [CrossRef] [PubMed]
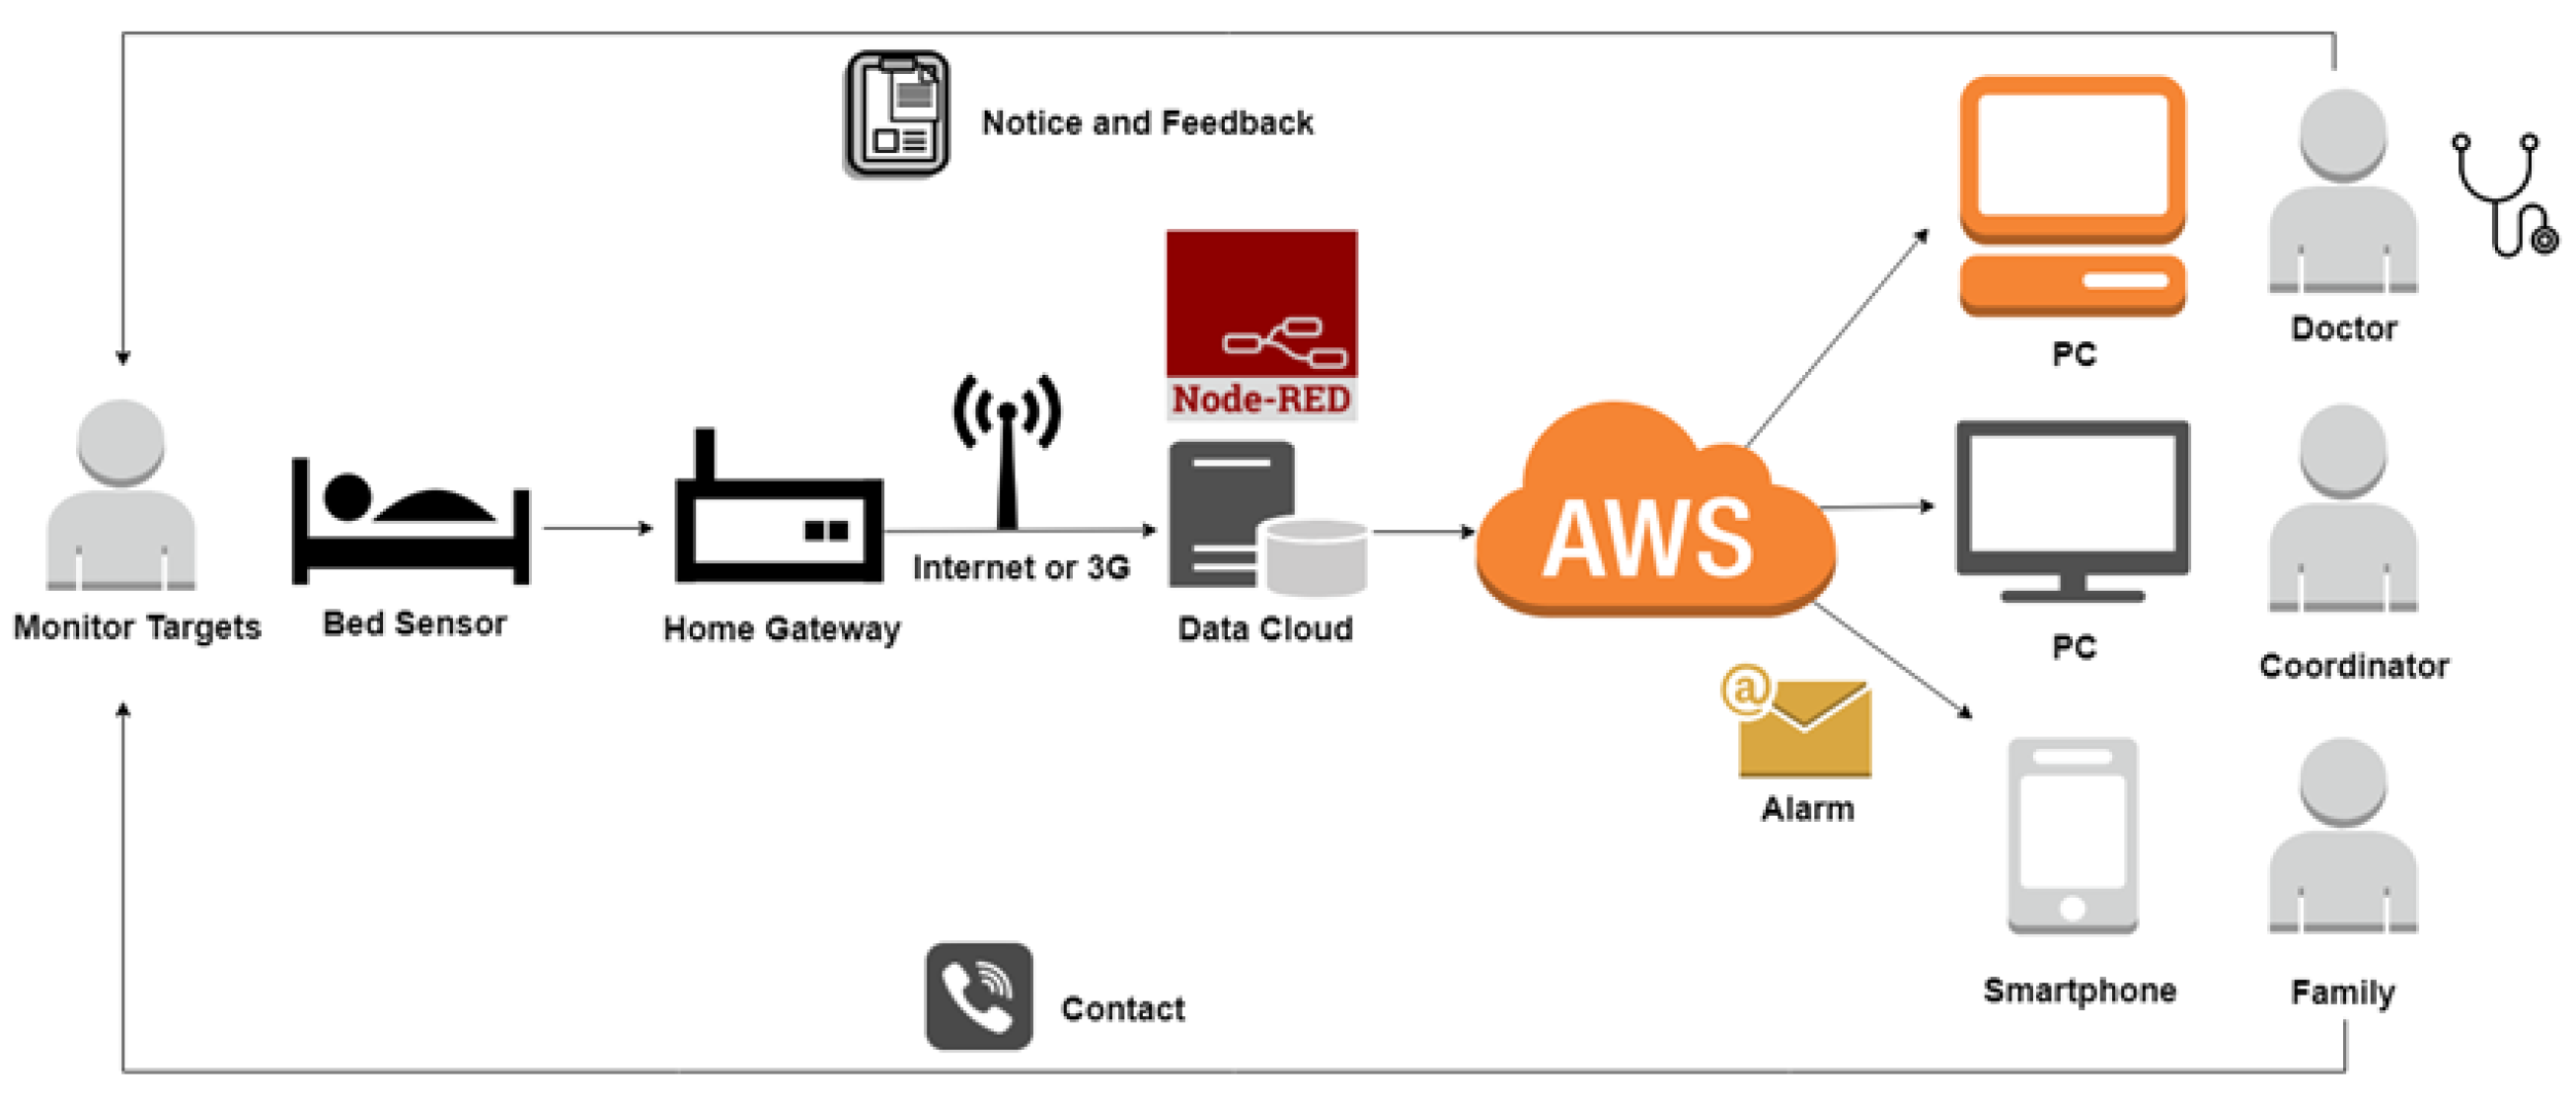
Figure 1. The schematic diagram of the unconstrained sleep health monitoring system on which the proposed automatic sleep quality index relies (reproduced from [34], with permission).
Electronics 14 04531 g001
Figure 2. The sleep monitoring sensor used in this proposed unobtrusive sleep monitoring system.
Electronics 14 04531 g002
Figure 3. Representative sleep data obtained from one participant are shown, including variations in HR, RR, and BW. The red, blue, and orange lines represent HR, RR, and the states of lying on the bed or leaving the bed, respectively. The state, which includes body movement and leaving, is dimensionless. In this case, 0 represents lying, 1 represents body movement, and 2 represents leaving. (adapted from [34]).
Electronics 14 04531 g003
Figure 4. The pearson product-moment correlations between the monthly ASQI Score and the next month ASQI score are 0.91 ( p < 0.001 ) (reproduced from [34], with permission).
Electronics 14 04531 g004
Figure 5. Comparison of the analysis results of the reference PSQI and the proposed ASQI from 11 participants (totaling 21 data entries) (reproduced from [34], with permission).
Electronics 14 04531 g005
Figure 6. Correlation comparison between the reference PSQI and the proposed ASQI for 21 paired data ( r = 0.52 ,   p < 0.05 ) (reproduced from [34], with permission).
Electronics 14 04531 g006
Figure 7. Proposed Automatic Sleep Quality Index (ASQI): Mean Component Scores and Total Score. In this figure, SST, SD, SE, SL, LT, and BMT denote Sleep Start Time, Sleep Duration, Sleep Efficiency, Sleep Latency, Leaving Times, and Body Movement Times, respectively.
Electronics 14 04531 g007
Figure 8. Daily trend of the proposed ASQI of a “good” sleeper and a “poor” sleeper for two months. The red dotted lines denote threshold (5) judging sleep quality to be good or poor.
Electronics 14 04531 g008
Table 1. Assessment criteria of components judging sleep quality (reproduced from [34], with permission).
Assessment Criteria
Levels Good Fair Poor Very Poor
Sleep start time19:00–21:0021:00–22:3022:30–24:00>24:00
Sleep latency (minutes)≤1516–3031–60>60
Sleep duration (hours)>76–75–6<5
Sleep efficiency (%)>85%75–84%65–74%<65%
Body movement times<10001000–30003001–6000>6000
Leaving times≤123–4≥5
Table 2. A summary of participant characteristics.
Select FactorNumberSexAge (Year)
Good sleeper group8M: 5; F: 380.6 ± 4.3
Poor sleeper group3M: 2; F: 167.3 ± 0.6
Total11M: 7; F: 477.0 ± 7.2
Disclaimer/Publisher’s Note: The statements, opinions and data contained in all publications are solely those of the individual author(s) and contributor(s) and not of MDPI and/or the editor(s). MDPI and/or the editor(s) disclaim responsibility for any injury to people or property resulting from any ideas, methods, instructions or products referred to in the content.