Abstract
This study presents a model-driven approach to the design, calibration, and application of frequency-output pressure sensors integrated within an intelligent system for real-time monitoring of rowing performance. The proposed system captures biomechanical parameters of the “boat–rower” complex across 50 parallel channels with a temporal resolution of 8–12 ms. At the core of the sensing architecture are parametric pressure transducers incorporating strain-gauge primary elements and microelectronic auto-generator circuits featuring negative differential resistance (NDR). These oscillating circuits convert mechanical stress into high-frequency output signals in the 1749.9–1751.9 MHz range, with pressure sensitivities from 0.365 kHz/kPa to 1.370 kHz/kPa. The sensor models are derived using physical energy conversion principles, enabling the formulation of analytical expressions for transformation and sensitivity functions. These models simplify sensitivity tuning and allow clear interpretation of how structural and electronic parameters influence output frequency. The system architecture eliminates the need for analog-to-digital converters and signal amplifiers, reducing cost and power consumption, while enabling wireless ultra high frequency (UHF) transmission of sensor data. Integrated algorithms analyze the influence of biomechanical variables on athlete performance, enabling real-time diagnostics. The proposed model-based methodology offers a scalable and accurate solution for intelligent sports instrumentation and beyond.
1. Introduction
1.1. Background
The popularization of rowing, the possibility of good earnings, commercialization, increasing media attention to rowing, the development of training methods, and many other factors have led to the emergence of strong crews in many countries that until recently could not reach the C final. The wide variety of boat and oar manufacturers has eliminated the limiting factor of equipment quality. The increase in the number of strong and technical athletes, together with the lack of differences in equipment, has led to increased competition at international competitions. The consequence of increased competition was a reduction in the gap between the outsiders and the race leaders (both in the final and qualifying races), respectively, which led to an increase in the speed of overcoming the distance [1,2,3,4,5].
The long-term training planning of successful rowing athletes is based on the principles of perspective, phased training, results programming, and an individual approach to training for each athlete. Successful performance in international competitions is mainly due to the effectiveness of the training process, which depends to a large extent on an individual approach to the selection of work modes. When training highly skilled athletes, the individualization of work modes is of particular importance. Multifactorial training involves the division of the load by the main direction and the distribution of multidirectional cycles, which is due to the individual residual training effects of each athlete [6,7,8,9,10,11,12,13].
Therefore, one of the most promising areas is the development of a radio-measuring system designed to improve the athlete’s movements during the stroke and the entire distance in general in order to bring them to automaticity and further control them at the subconscious level.
Capacitive, piezoresistive, magnetoelastic, inductive, piezoelectric, and acoustoelectric sensors are used to measure pressure. Capacitive sensors have high accuracy and sensitivity and thermal stability, but their disadvantages are that they are not suitable for high pressures and are also expensive. Inductive sensors are characterized by temperature instability and high sensitivity to shock and vibration. Piezoelectric sensors have low output signals, low accuracy and sensitivity, and insufficient stability. Piezoresistive pressure sensors have low output signals and are sensitive to temperature changes, but they have high strength, low hysteresis, and a wide temperature range [14,15,16].
As can be seen from the analysis of the literature [14,15,16,17,18], one of the main disadvantages of existing pressure sensors is the low output signal, except for inductive pressure sensors, whose manufacture is incompatible with integrated microelectronic technology. This leads to significant measurement errors due to information losses in the channel between the sensor output and the input of the amplifier and converting equipment, which causes their low accuracy and sensitivity and low noise immunity and speed. It is possible to eliminate the above shortcomings on the basis of parametric self-oscillating sensors operating in the pressure–frequency conversion mode, which makes it possible to significantly improve their metrological performance [19,20,21]. The advantages and disadvantages of parametric oscillator sensors, taking into account their limits of applicability, are shown in Table 1.

Table 1.
Advantages and drawbacks of parametric self-oscillating sensors with boundaries of applicability.
Despite these advantages, sensor devices also have certain disadvantages that affect their practical application. These include sensitivity to external noise and interference, limited power resources, especially in portable or autonomous systems, and limited sensing capabilities [22,23]. In addition, sensors are often characterized by low computing and storage resources, making it difficult to process and store large amounts of data. All this can reduce the reliability and accuracy of the measurements and create difficulties in analyzing and comparing the data [22,23]. Thus, in addition to the advantages of sensor technologies, their limitations must also be taken into account, especially under difficult operating conditions.
1.2. Research Gap
Although frequency output pressure sensors have been explored in various engineering and industrial applications, their use in high-speed multichannel sports instrumentation, particularly for the real-time monitoring of rowing performance, remains underdeveloped. Existing studies on rowing biomechanics often employ analog output sensors combined with analog to digital converters (ADC) and amplifiers, which increase the cost, latency, and system complexity. Moreover, sensitivity calibration in such systems is usually empirical and lacking robust analytical models that explicitly relate structural and electronic parameters to output characteristics.
In the domain of frequency-output sensing, research has focused primarily on general-purpose transducers without addressing the integration of strain gauge primary elements into active self-oscillating circuits with negative differential resistance (NDR). The absence of such integration limits opportunities for compact low-power designs and real-time wireless data transmission. In addition, there is a lack of model-based methodologies that simultaneously address the sensor design, transformation function derivation, and sensitivity optimization in the context of intelligent sports systems.
This gap underscores the need for a unified physically grounded design approach that not only predicts the sensor performance but also simplifies the hardware architecture for scalable, high-resolution, and low-latency biomechanical monitoring.
1.3. Problem Statement
Recent trends in rowing show a significant increase in competition at both the international and national levels. According to BioRow, the average speed of the winners of the World Championships from 1992 to 2018 increased by about 0.4% annually, and at the Paris 2024 Olympic Games, the victory was decided by increases within tenths of a percent of relative speed [24,25]. Even the difference in technique can account for up to 2% of the result deviation (~7–8 s at a distance of 2000 m), which is critical at the level of the final races [26]. At the same time, national rowing competitions, the results of which are systematically published on the rowing.su platform, demonstrate increased competition at the regional level: the participation of a large number of athletes in different age groups confirms the narrowing of time gaps between participants [27]. It is important to note that academic rowing (water discipline) and rowing indoors (competition on ergometers) are different sports, but both areas reflect the same tendency to minimize the difference in results. This makes the development of real-time monitoring systems especially relevant, as even the slightest deviation in technique or power can determine the final placement of an athlete.
Accurate and rapid monitoring of biomechanical parameters in rowing is crucial to optimize technique and increase the efficiency of force transfer to boat motion. Key indicators include force curves, stroke and finish angles, length and power of the pulling stroke, as well as speed and acceleration of the boat, handles, and seat [28]. It is also important to analyze the coordination of leg, trunk, and arm movements, which determines the consistency of the stroke [28]. Assessment of these parameters allows for the timely detection of technical errors and adjustment of the training process.
Accurate and high-speed monitoring of biomechanical parameters in rowing is critical for evaluating athlete performance and optimizing training processes. Conventional pressure sensing solutions in sports instrumentation often rely on analog output signals, which require analog-to-digital conversion and amplification before processing. This increases the system cost, complexity, and power consumption while introducing latency and potential signal degradation.
Furthermore, the sensitivity of such systems to structural and environmental variations is often not adequately modeled in the design stage, limiting the accuracy and scalability of the calibration. Existing designs rarely integrate model-based methodologies for predicting and optimizing the sensitivity of frequency output pressure sensors, especially in multichannel real-time monitoring environments, such as intelligent rowing systems.
1.4. Objective
The primary objective of this research is to develop a model-based design and a sensitivity optimization methodology for pressure sensors with frequency output intended for integration into an intelligent rowing monitoring system. Specifically, the work aims to
- Establish analytical models of parametric pressure transducers that incorporate primary strain gauge elements and microelectronic self-oscillating circuits with negative differential resistance.
- Derive transformation and sensitivity functions based on physical energy conversion principles to enable straightforward sensitivity tuning and performance prediction.
- Implement and validate a multichannel (50-channel) real-time monitoring system capable of acquiring biomechanical data from the “boat–rower” complex at a temporal resolution of 8–12 ms.
- Minimize hardware complexity and cost by eliminating traditional ADCs and amplifiers while enabling wireless UHF data transmission for real-time analysis.
1.5. Main Contribution
This study advances the state of intelligent sports instrumentation by introducing the following.
- A unified model-driven framework for the design and calibration of frequency-output pressure sensors, allowing precise prediction of sensitivity and the influence of structural/electronic parameters;
- Novel integration of strain-gauge primary transducers as active elements within NDR-based auto-generator circuits, reducing the component count and enhancing the signal stability;
- Derivation of parametric transformation functions that explicitly relate mechanical pressure changes to equivalent capacitance and negative differential resistance variations in the oscillating system, enabling accurate frequency-domain performance optimization;
- A fully implemented 50-channel real-time monitoring system for rowing, with demonstrated sensor sensitivity ranging from 0.365 kHz/kPa to 1.370 kHz/kPa over a 0–2050 kPa pressure range and output frequencies between 1749.9 MHz and 1751.9 MHz;
- System-level benefits, including elimination of ADCs/amplifiers, reduced cost and power consumption, and seamless wireless data transmission, making the approach scalable for broader applications in sports analytics and industrial sensing.
1.6. Novelty Statement
The novelty of this work lies in the integration of primary strain gauge transducers directly as active elements within microelectronic self-oscillating circuits featuring negative differential resistance, enabling the development of a compact pressure sensor with a low output that does not require analog-to-digital converters or signal amplifiers. Unlike conventional designs, the proposed sensors are modeled from the ground up using the energy conversion method, allowing the analytical derivation of transformation and sensitivity functions that explicitly link changes in mechanical pressure with oscillator parameters and output frequency.
This approach enables
- High-speed multi-channel (50-channel) real-time monitoring of rowing biomechanics with a temporal resolution of 8–12 ms.
- Scalable sensitivity optimization through direct parametric adjustment informed by analytical models, rather than purely empirical calibration.
- Seamless wireless UHF data transmission without bias, reducing the cost, size, and power consumption while maintaining measurement accuracy in the 1749.9–1751.9 MHz range.
To our knowledge, this is the first reported application of such model-based frequency output pressure sensors in intelligent rowing systems and one of the few in sports instrumentation to completely eliminate ADC while maintaining subkHz/kPa sensitivity resolution.
2. Materials and Methods
A self-oscillating pressure transducer with a frequency output signal for computer and information measurement systems and networks is based on a microelectronic transistor structure with negative differential resistance, in which a strain-sensitive element is a strain resistor. Figure 1 shows the electrical diagram of a microelectronic pressure transducer.
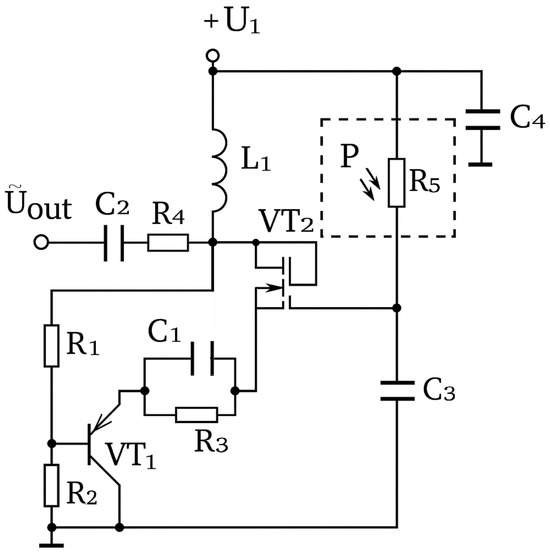
Figure 1.
Electrical diagram of a self-oscillating pressure transducer based on a bipolar and field-effect transistor structure.
It is an integrated microelectronic circuit consisting of bipolar and field-effect transistors VT1 and VT2 with different types of conductivity, leading to the appearance of negative differential resistance at the collector–emitter of the transistors, which significantly reduces the hardware costs in computer and information and measurement systems (Figure 1). The self-oscillating system has three dynamic variables, two of which are voltages on the equivalent capacitances of the transistor structure with negative differential resistance (respectively, on the drain electrodes of the field-effect transistor VT2 and the collector of the bipolar transistor VT1), and the third is the inductance current L1. The dynamic processes occurring in the self-oscillator are determined by the reactive properties of the bipolar field-effect transistor structure with negative differential resistance and are similar in nature to quasi-sinusoidal processes, as in a generator based on an inductive triac circuit. To change the dynamics of oscillations and expand the working volume of the phase space, a circuit R5C3 was added to the inductive branch of the basic generator circuit based on a bipolar field-effect transistor structure with negative differential resistance. A C1R3 circuit has been introduced to thermally stabilize the generator [29]. The ratings of the radioelectronic components were selected based on the following considerations: (1) to ensure the maximum length of the falling section of the static VAC; (2) to ensure a wide change in the equivalent capacitance of the transistor structure and, accordingly, the range of frequency change under the influence of pressure.
The strain-sensitive resistor R5 of the Interlink Electronics FSR-400 type is included in the positive feedback loop. There is total resistance in the collector drain electrodes VT1 and VT2, the active component of which has a negative value, and the reactive component has a capacitive character. Connecting the inductor L1 to the collector VT1 and to the upper terminal of the capacitance C4 creates an oscillating counter, the energy losses of which are compensated by the energy of the negative differential resistance. The capacitance C4 prevents the passage of alternating high-frequency current through the DC voltage source U1, which supplies the device circuit. The resonant frequency of the oscillating circuit depends on the pressure on the strain-sensitive resistor R5, since its current changes, which leads to a change in the equivalent capacitance and negative differential resistance in the oscillating system of the device’s oscillator. The generated voltage is removed from the drain of the transistor VT2 (the main output of the oscillator). In this case, the selection of the initial generation frequency without pressure is controlled by changing the voltage of the power supplies V1 and V2. When connecting the load resistance, it is necessary to take into account the active and reactive resistance introduced by it to the oscillating circuit of the generator. In this case, the generator operates in idle mode on the main output, which allows it to be widely used in measurement control and automation devices circuits. A mathematical model was developed to analyze the characteristics of the generated frequency as a function of pressure, and further calculations were performed in MATLAB R2018a (MathWorks, Natick, MA, USA).
In the course of analyzing the optimal design of the self-oscillating pressure transducer, it was concluded that it is advisable to use the frequency method of information conversion, which will increase the output power of the self-oscillating and expand the frequency range of the generated signal. In principle, oscillator transistor structures with negative differential resistance are a transistor analog of a negatron, whose waveform has a downward section corresponding to a negative differential resistance, which is provided by internal feedback and serves to compensate for energy losses on the active resistances of the circuit. The complex resistance of such a structure is capacitive, and its value depends on the voltage applied to its input. When such a structure is connected to an inductor, a resonant oscillating circuit is formed.
Figure 2 shows a diagram of a self-oscillating pressure transducer based on a bipolar-field-effect transistor structure with the introduction of a control voltage source for developing a mathematical model of this oscillator.
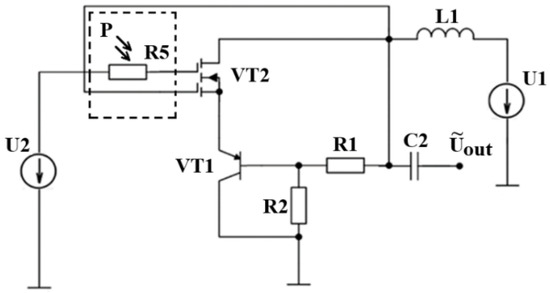
Figure 2.
Electrical diagram of a self-oscillator pressure transmitter with two sources of constant voltage: supply voltage and control voltage.
Finding the optimal operating point of the power supply of such a circuit is carried out using two sources of constant voltage: the supply voltage and the control voltage (Figure 2).
The equivalent capacitance is part of the total capacitance of a transistor structure with a negative differential resistance arising at the electrodes of the drain of a double-gate MOSFET—collector of a bipolar transistor, which, together with the inductance L1, form a resonant oscillating circuit, which, in view of the above, has a resonant oscillation frequency dependent on the control voltage. To create a mathematical model of the self-oscillating pressure transducer, Figure 3 shows a nonlinear equivalent circuit.
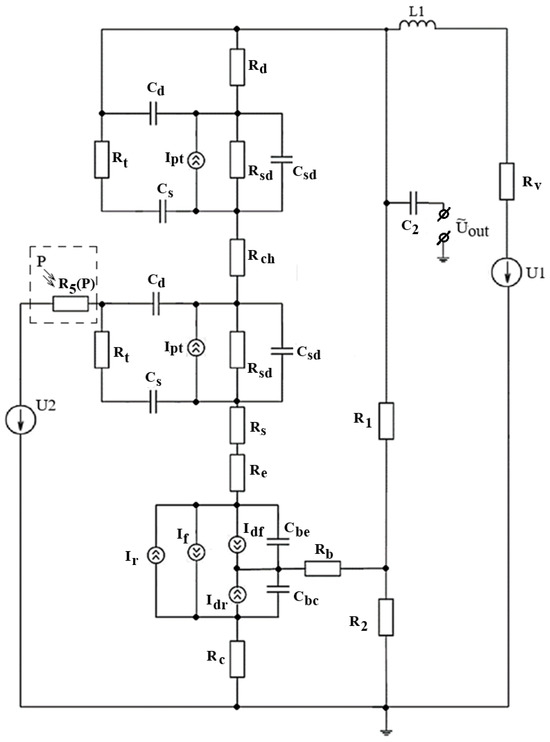
Figure 3.
Nonlinear equivalent circuit of a self-oscillating pressure transducer based on a bipolar field-effect transistor structure.
The elements of the equivalent circuit are described as follows: L1—inductance; —internal inductance resistance; , , and —load resistances of drain–drain and base-collector transistors; —resistance of the strain-sensitive resistor; , , and —channel, drain, and leakage resistances of a double-gate MOSFET; , , and —emitter, collector, and base resistances of a bipolar transistor; and —capacitances of the emitter and collector junctions of a bipolar transistor; and —gate-drain and gate-emitter capacitances; —capacitance of the MOSFET channel; and —forward and reverse currents of a bipolar transistor; and —currents of the internal base-collector and base-emitter junctions; —channel current of a double-gate MOSFET; —power supply voltage source; —control voltage source.
To build a mathematical model of a self-oscillating pressure transducer based on a bipolar-field-effect transistor structure, we apply the state variable method, which allows us to determine the values of voltages and currents of circuit elements at each moment of time and changes in pressure on a pressure-sensitive strain gauge. Therefore, using the state variable method, we present a transformed equivalent circuit (Figure 4), in which all capacitances are represented as independent voltage sources, and inductance is a current source. To consider the properties of the proposed circuit and create its mathematical model, we created a transformed equivalent DC circuit shown in Figure 4. The following simplification was made in the equivalent circuit: , where QB is the coefficient of the imperfection of the junction of the bipolar transistor [30].
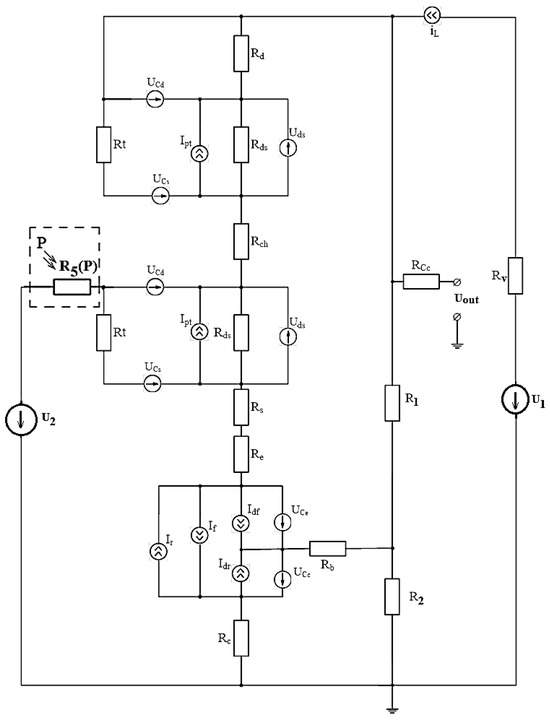
Figure 4.
Transformed nonlinear equivalent circuit of a self-oscillating pressure transducer.
Having chosen the directions of the circuit bypass and designated the corresponding currents, we write down a system of equations according to Kirchhoff’s laws (its variant, the method of circuit currents). The resulting system of equations will be used to analyze the circuit using the state variable method.
Assuming the corresponding values of the voltages across the capacitors and the current through the inductor, we solve the system of Equation (1) with respect to the following values: , , , , , , by making the following substitutions:
where
Since the voltages and currents of the circuit of an oscillator pressure transducer based on a bipolar-field-effect transistor structure vary over time, the capacitance current and inductance voltage are described by the expressions: , . If we take into account that each instantaneous value of voltage and current in the equivalent circuit is a function of time, then we can write the left-hand sides of the equations in the form of first-order differential equations, and system (2) can be rewritten as follows:
Given that the system of Equation (3) contains terms that describe nonlinear elements (current sources), the system is nonlinear. Nonlinear circuit elements describe the currents of nonlinear internal sources of circuit elements. The forward and reverse junction currents of a bipolar transistor are described by equations:
The currents of the internal junctions of the base-emitter and base-collector bipolar transistors are described by equations:
where and are the maximum current transfer coefficients in the common emitter switching scheme.
The channel current of a double-gate MOSFET is represented as a nonlinear piecewise approximation:
where NF and NR are the MOSFET imperfection coefficients in the forward and inverse modes of operation; BF and BR—maximum current transfer coefficient; —threshold voltage; —slope of the double-gate MOSFET characteristic, where Sc is the specific slope of the characteristic; —ratio of channel width to its length; —voltage at the internal gate-drain point; —voltage at the internal drain-drain point.
Any capacitance of a bipolar transistor has diffusion and barrier components in the linear mode of operation. The capacitance of the collector junction is described by the equation:
where
where is the temperature potential of the p-n junction.
The capacitance of the emitter junction is described by the following expressions:
where
where , , , and are the differential and barrier capacitances of the emitter and collector junctions of the bipolar transistor; and —the time of charge transfer through the base region in the inverted and normal operating modes; and —contact potential difference of the emitter and collector junctions of a bipolar transistor; and —capacitance of the emitter and collector junctions of a bipolar transistor; and —smoothness coefficients of the emitter and collector junctions of a bipolar transistor.
The dynamic model of the self-oscillating pressure transducer (system of Equation (3)) allows us to determine the value of the output signal frequency depending on the control voltage, power supply, and pressure action, as well as the parameters of the main elements of the self-oscillator at any given time. Using the MATLAB (MathWorks, Natick, MA, USA) software package, a computer circuit study of the parameters and characteristics of the generated electrical oscillations was performed.
The conversion function is described by the expression
where is the dynamic differential negative impedance of the generator; is the equivalent capacitance of the transducer; L1 is the inductance of the oscillating circuit.
The sensitivity of the pressure transducer is determined on the basis of expression (11) and is described by the following formula:
Approximate Conversion Function
where y is the specified parameter (pressure); x is the generation frequency; a, b, c, d, e, and f are the coefficients.
The experimental studies were carried out using an Arinst SSA TG-LC spectrum analyzer (Arinst, Saint Petersburg, Russia).
The frequency range of autogenerated parametric pressure devices based on transistor microelectronic structures with negative differential resistance with primary strain-sensitive elements such as strain gauge and strain gauge is selected in the Long Term Evolution (LTE) Band 3 (DCS-1800) uplink: 1710–1785 MHz. The standard uses the 1800 MHz frequency band, which coincides with the range of Global System for Mobile Communications (GSM) networks. When creating a 4G network on the basis of an already built 2G infrastructure, operators usually retain the original network and allocate part of the band for the new 4G network. LTE Band 3 is found in both urban and rural areas [31]. This type of communication operates in Frequency Division Duplex (FDD) mode with frequency separation of the downlink and uplink. The Internet of Things (IoT) will redefine the way people interact with each other and with the objects around them, with the goal of creating a global network that connects everyone and everything. The IoT is expected to enable the use of mass machine-to-machine communication (mMTC), by which devices transmit and receive small amounts of data, to improve industrial and measurement processes [32]. Low power radio communication (LPWA) technologies have emerged as a solution to developing mMTC that meets the requirements of low power consumption, low data rate, scalability, and long range. The use of Narrowband Internet of Things (NB-IoT), as a completely new cellular technology, will allow a step forward in the realization of 5G-based IoT, and NB-IoT will be compatible with the 4G LTE system and with the 2G GSM [31,32,33]. This advantage, coupled with a higher spectrum utilization efficiency, puts the technology in a privileged position for the implementation of LPWA networks [32].
The radiomeasuring information system (RIS) for monitoring the parameters of an athlete rower in academic rowing is designed to analyze and determine the main characteristics of the “boat–rower” system in real time. Figure 5, Figure 6, Figure 7 and Figure 8 show the structural blocks of the RIS system.
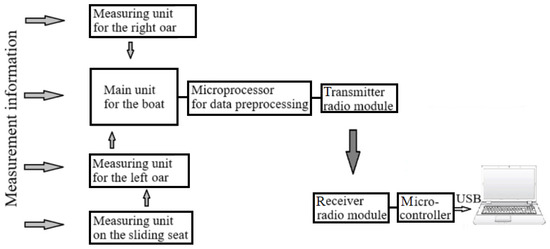
Figure 5.
Block diagram of the VLSI for monitoring the parameters of an athlete-rower in rowing.
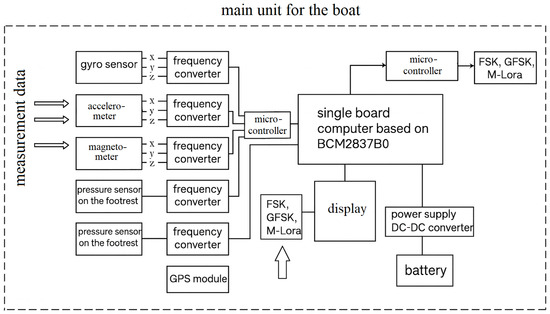
Figure 6.
Block diagram of the main unit of the VLSI.
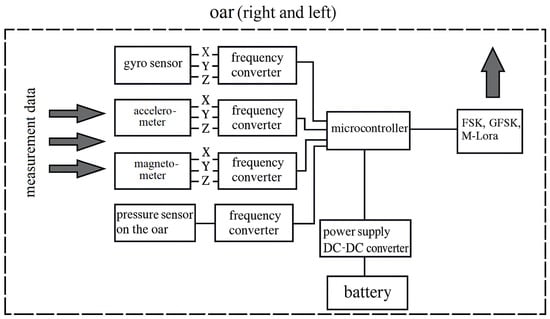
Figure 7.
Block diagram of the oar block of the RVIS.
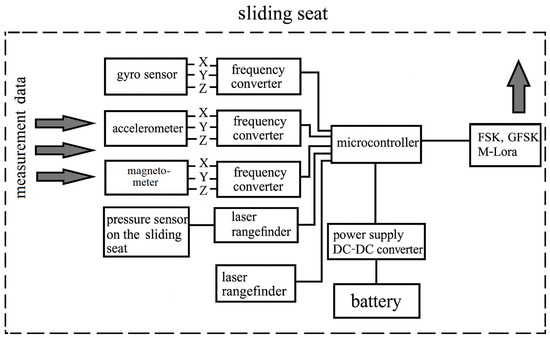
Figure 8.
Block diagram of the RVIS sliding seat unit.
Measurements are made every 8–12 ms in parallel on 50 channels. The developed system consists of measuring units on the right and left oars, a measuring unit on the sliding seat, and the main measuring unit with a transmitter on the boat. All units are connected via a radio channel, and the main unit, which collects and processes the measured information, is connected to a personal computer located on the shore with a more powerful transmitter in duplex mode.
3. Results
The dynamic model of the self-generating pressure transducer (system of Equation (3)) allows determining the value of the output signal frequency depending on the control voltage, power supply, and pressure action, as well as the parameters of the main elements of the self-generator at any time. Using the MATLAB (MathWorks, Natick, MA, USA) software package, a computer circuit design study of the parameters and characteristics of the generated electrical oscillations was performed. Figure 9 shows the simulated output signal of the self-generating pressure transducer, and Figure 10 shows the simulated output signal of the self-oscillating pressure transducer under pressure 18 kg/cm2.
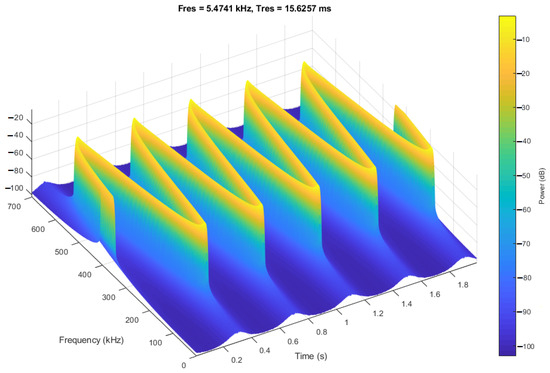
Figure 9.
Simulated output signal of an autogenic pressure transducer.
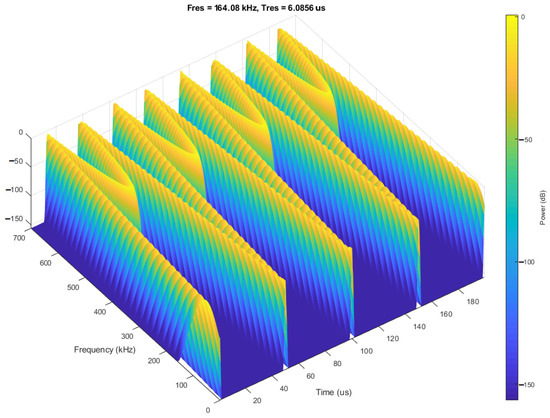
Figure 10.
Simulated output signal of an autogenous pressure transducer under pressure (18 kg/cm2).
The conversion function graph is shown in Figure 11, and the sensitivity graph is shown in Figure 12. As can be seen from Figure 12, the sensitivity of the transducer varies from 42.5 Hz/g/cm2 to 78.0 Hz/g/cm2 in the range of 0 to 26 kg/cm2.
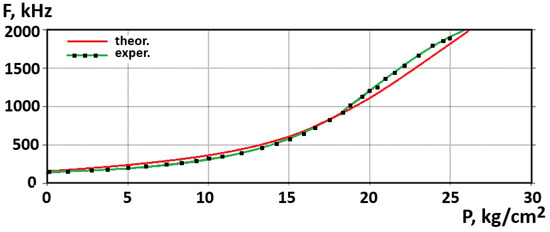
Figure 11.
Theoretical and experimental dependences of generation frequency on pressure changes.
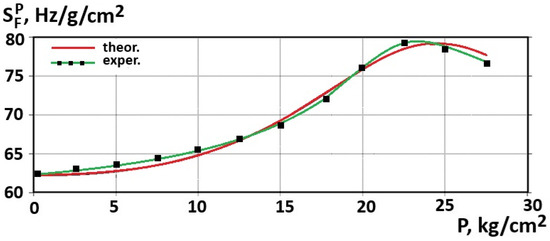
Figure 12.
Dependence of transducer sensitivity on pressure changes.
As can be seen in the graph in Figure 11, the highest sensitivity of the device lies in the range of 15 kg/cm2 to 25 kg/cm2 and is 62.5–79.5 Hz/g/cm2. The discrepancy between the theoretical and experimental studies is ±0.5%.
In Figure 13, the approximated transformation function is shown.
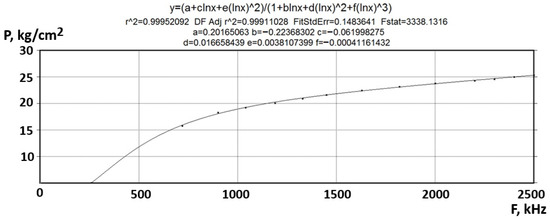
Figure 13.
Approximate transformation function.
In Figure 13, the experimental dependence of pressure P (kg·cm−2) on excitation frequency F (kHz) for the sensor is shown, together with a rational–logarithmic fit . The response is monotonic and sublinear: P increases rapidly to MHz and then gradually approaches a quasi-saturation above MHz. The fitted parameters are , , , , , and . The quality of fit metrics indicate an excellent agreement with the data (, adjusted , standard fit error , ).
Figure 14 shows the signal spectrum of a self-oscillating parametric pressure device based on a transistor microelectronic structure in the DCS-1800 uplink band; the transmission frequency is 1750.0 MHz.
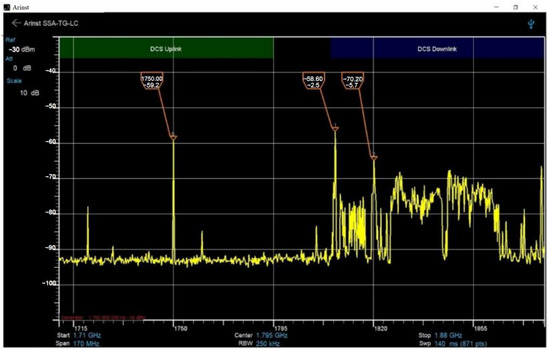
Figure 14.
Signal spectrum of a self-oscillated parametric pressure device based on a transistor microelectronic structure.
Figure 15 and Figure 16 present photos of the device. Figure 16 shows a view of the system with the data display, and Figure 17 shows the interface of the data processing program. The developed system provides data packet transmission at the level of 60–70 FPS. The data received from each sensor are displayed in digital form and in the form of graphs.

Figure 15.
Exterior view of the RIS.
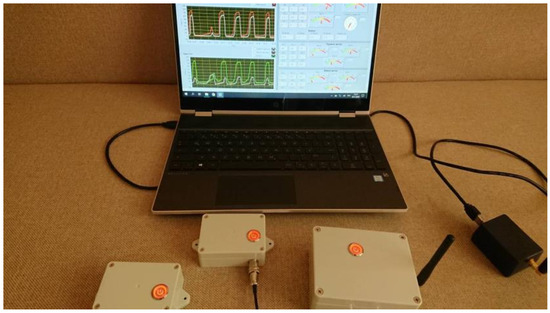
Figure 16.
System view with data display on a personal computer.
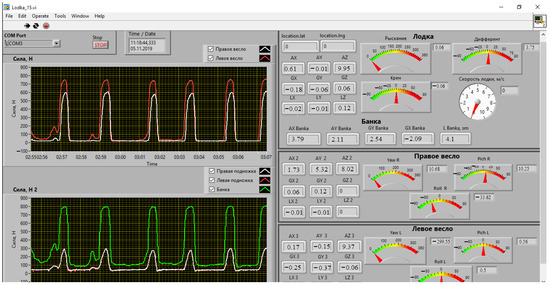
Figure 17.
Interface of the data processing and visualization program. Non-English terms correspond to: Cила = Force; Лoдка = Boat; Банка = Bench; Правoе веслo = Right oar; Левoе веслo = Left oar; Правая пoднoжка = Right footrest; Левая пoднoжка = Left footrest; Рыскание/Крен/Дифферент = Yaw/Roll/Pitch; Cкoрoсть лoдки, м/с = Boat speed, m/s.
The general data of the RVIS monitoring the parameters of an athlete-rower in rowing are as follows:
- Weight of the entire system mounted on the boat—0.75 kg;
- Water resistance—IP65 protection standard;
- Working hours—up to 24 h;
- Operation in the temperature range—−10°C … + 60°C;
- Installation without compromising the integrity of the rowing equipment;
- High-speed telemetry data transmission in real time to the PC—data packet transmission at the level of 60–70 FPS;
- Transmission range without an additional amplifier—up to 2500 m (with an additional amplifier—up to 15 km);
- Real-time data recording to a PC in a .txt file, which ensures minimal file size and maximum possibility of further data processing;
- Data packet recording resolution up to 100 Hz;
- Visualization of large amounts of data in real time.
In Figure 17, the LabVIEW-based acquisition/visualization interface used for on-water rowing experiments is presented. The left panel shows two synchronized time series of force F (N) versus time: the upper plot displays the forces of the right/left shoulder (color coded traces), and the lower plot shows the forces of the bench/footrests. Periodic stroke cycles with peaks approaching ~800 N and near-zero recovery phases are evident. The right panel provides real-time telemetry and controls the following: serial port status and time/date, channel selectors, and instrument clusters for the boat, bench, and each oar. For each module, raw IMU channels (AX, AY, AZ accelerations, and GX, GY, GZ angular rates) are displayed alongside gauge indicators of yaw/roll/pitch; a dial reports the boat speed in m/s. Together, the interface enables the synchronous monitoring of propulsive forces and 6-DOF kinematics for the boat, bench, and both oars during rowing trials. The quantitative parameters and calculated characteristics obtained from these measurements are summarized in Table 2.

Table 2.
Parameters and characteristics of the biomechanical system “boat–rower” measured and calculated by the RVIS.
4. Discussion
The high speed of the course imposes special requirements on the rowing power supply mechanisms. Maximum efficiency was found to be achieved when the power supply mechanism reaches steady state (uniform fuel consumption for uniformly high power output), that is, speed fluctuations of no more than 2%. Thus, a successful performance in international competitions involves reaching a “cruising” speed, maintaining it throughout the race, and maximizing mobilization in the finish zone [8,9,10,11].
The tactic of evenly covering the distance requires a high level of development of the aerobic and glycolytic mechanisms of energy supply. However, these mechanisms cannot develop synchronously, only sequentially [8,9,10,11,12,13].
It is reliable that all components of sportsmanship (power and capacity of energy processes, level of strength abilities, speed of movements and locomotion, technical skills, special endurance and performance) are highly developed in top-class athletes. To create a developmental training environment for such athletes, high-intensity specific influences are necessary on each of the components of their special training. At the same time, adaptive reactions of the organism can prevent the high efficiency of such loads. In case of exceeding the physiological bar of its capabilities, the body levels the special character of loads that belong to high intensity. In this case, one should not expect a high training effect; the training will have the character of general physical training, with low efficiency and large unbalanced energy expenditures [2,4,11]. In order to eliminate these contradictions or minimize them, the following methodological foundations for organizing the training process were formulated when developing the block system [1,2,4]:
- -
- advanced use of special physical training loads in relation to other areas of training;
- -
- concentration of special physical training loads at the beginning of a large adaptation cycle as a condition that ensures the creation of a functional and energy basis for the intensification of subsequent loads;
- -
- time separation of training loads of different predominant orientation and their inclusion in training in accordance with the objective logic of the development of the process of long-term adaptation;
- -
- utilization of the long-term delayed training effect of concentrated loads of special physical training.
Due to the increased level of the body’s functional state, favorable conditions are created for the performance of subsequent high-intensity loads.
A radio-measuring information system for monitoring the parameters of an academic rowing athlete has been developed, which is designed to improve the athlete’s movements during the stroke and, in general, the entire distance in order to bring them to automaticity and further control them at the subconscious level. One of the promising scientific directions in the development of radio-measuring microelectronic transducers proposed in this work is the use of the dependence of the reactive properties and negative differential resistance of semiconductor devices on the influence of external physical quantities and the creation of a new class of microelectronic frequency transducers for pressure, angular position, and acceleration on this basis. In devices of this type, the above external influences are converted into a frequency signal, which allows increased accuracy, sensitivity, speed, and stability.
Measurements were made at intervals of 8–12 ms (≈80–120 measurements/s) and averaged over 1-second windows (n 100), ensuring a statistically reliable estimate of the mean and standard error. Switching to a shorter interval (e.g., 5 ms → 200 measurements/s) would theoretically reduce the standard error of the mean by approximately (1.41 times) under the condition of independent samples, but the actual benefit depends on the sensor bandwidth and correlation between samples. In addition, shorter time intervals require more power consumption and microcontroller and storage load and may introduce more high-frequency interference. Therefore, the chosen interval of 8–12 ms is a compromise between the temporal resolution, statistical reliability, and the practical limitations of the equipment. The question of the feasibility of switching to shorter time intervals (e.g., 5 ms) requires additional tests to determine the sensor bandwidth and assess the overall system performance.
The authors found that the discrepancy between the theoretical and experimental results was no more than ±0.5%. The experimental measurements were performed at a frequency of 80–120 samples/s, with a sample of more than 103 values for each point, followed by averaging. The total reduced error, which takes into account the instrumental error, reproducibility, and error of the reference measuring instrument, did not exceed ±0.5% of the upper limit of the range. The average experimental values obtained are consistent with the results of numerical modeling within this error.
To evaluate the quality and compare various physical quantity transducers, we will use the concept of efficiency, which means the suitability of a device to perform a task. When conducting such an analysis, it is necessary to have a measure that is suitable for this purpose, i.e., the efficiency and quality criteria. Efficiency and quality criteria characterize certain aspects of the operation of physical quantity transducers. A device that is optimal for one of the individual criteria may not be optimal for the other. Therefore, when designing and optimizing physical quantity transducers, one strives not for the extremum of any single characteristic but for the overall optimality of the device, the measure of which is the generalized efficiency criterion. The basis for the formation of generalized criteria are individual criteria. They can be divided into three groups: metrological, informational, and economic. Individual metrological criteria coincide with the main normalized metrological characteristics of measuring devices, which are determined by state standards, and allow evaluating certain properties of measuring devices that affect the measurement results.
When evaluating self-oscillating transducers of physical quantities, it is necessary to start with the selection of a performance evaluation criterion. In this case, it is necessary to choose a criterion that would allow the synthesis of optimal devices taking into account the most important performance indicators. These indicators include
- Indicators of constructive perfection;
- Indicators of technical characteristics;
- Indicators of device complexity;
- Indicators of reliability and durability;
- Indicators of manufacturability.
Calculations of the complex technical level indicator are performed using dimensionless relative indicators. The normalization of the indicators , that is, the calculations of their relative values , are performed using the indicators of the base product . The “ideal” device is used as the base device, which contains a set of the highest achievements in all indicators analyzed for the studied group of devices without exception. Calculations of normalized indicators for devices are performed by the following expressions:
where the index i = 1…6 is the column number of the type of strain gauge (Table 3).

Table 3.
Pressure transducers.
For homogeneous devices, the complex index is determined based on the expression
where n is the number of informative indicators, and j= 1…11 is the line number of Table 3 of the technical data from the pressure transmitter.
For heterogeneous devices, the complex index is determined based on the expression
The calculation of the normalized indicators of the devices is carried out according to the expression , according to which the growth of the normalized indicator corresponds to the growth of the quality of the device. In this case, the smaller the absolute value of the complex indicator , the higher the level of the j-number of the device.
5. Conclusions
The principle of the operation, design, and block diagram of a radio-measuring information system for monitoring the parameters of an athlete-rower in academic rowing, which is designed to analyze and determine the main characteristics of the “boat–rower” system in real time, have been developed. Measurements are made every 8–12 milliseconds in parallel on 50 channels. Based on multivariate analysis, data processing determines the significance of the influence of each factor on the athlete’s physical fitness.
Parametric pressure devices are proposed for self-oscillators based on transistor microelectronic structures with negative differential resistance with a primary strain gauge element based on strain gauge, and the primary strain gauge transducers are active elements of self-oscillating circuits, which simplifies the design of pressure devices.
Based on the consideration of physical processes in primary strain gauges and self-oscillators based on the energy conversion method, mathematical models of pressure devices are developed, on the basis of which parametric dependencies of the conversion and sensitivity functions are obtained. The main contribution to the variables of the transformation function is shown to be the change in pressure. This causes a change in the equivalent capacitance and negative differential resistance of the oscillating system of the sensor oscillators, which in turn changes the output frequency of the devices.
The parametric dependences obtained from the transformation functions of pressure devices show the possibility of calculating the main characteristics of sensors more easily and clearly show the influence of each parameter of the primary transducers and the parameters of the oscillators on the output frequency of devices in comparison with the calculations of transformation functions from equivalent device circuits based on Kirchhoff equations.
Pressure sensors with frequency output do not require analog-to-digital converters and amplifiers for further processing of information signals, which reduces the cost of information and measuring equipment, and it is possible to transmit information over a distance when the devices operate at ultrahigh frequencies.
The use of frequency as an output signal provides a number of advantages: high noise immunity, nonzero drift problem, and the ability to transmit a signal over long distances without losing accuracy. For microcontrollers, frequency is a convenient digital parameter that can be measured by counters and timers without additional conversions. Thus, the implementation of pressure–frequency sensors is optimal for modern measurement systems.
6. Patents
The following Ukrainian patents are associated with the work reported in this paper [34,35].
Author Contributions
Conceptualization, I.O., O.O. and S.B.; methodology, I.O., O.O. and A.S.; software, S.B. and M.B.; validation, I.O., O.O. and A.S.; formal analysis, I.O. and O.O.; investigation, I.O.; resources, O.O.; data curation, S.B. and M.B.; writing—original draft preparation, I.O., O.O. and S.B.; writing—review and editing, I.O., O.O. and A.S.; visualization, S.B.; supervision, O.O.; project administration, M.B.; funding acquisition, A.S. All authors have read and agreed to the published version of the manuscript.
Funding
This research received no external funding.
Data Availability Statement
The original contributions presented in this study are included in the article. Further inquiries can be directed to the corresponding author.
Acknowledgments
The authors are grateful to all colleagues and institutions that contributed to the research and made it possible to publish its results.
Conflicts of Interest
The authors declare no conflicts of interest.
Abbreviations
The following abbreviations are used in this manuscript:
| NDR | Negative Differential Resistance |
| RIS | Radio-measuring Information System |
| IoT | Internet of Things |
| GSM | Global System for Mobile Communications |
References
- Platonov, V.N.; Danko, G.V. Theory of adaptation and reserves for improving the training system for athletes. Nauka Olimp. Sport. 2007, 1, 3–16. [Google Scholar]
- D’iachenko, A.I. Modern concept of improving special endurance of high-class athletes in rowing. Nauka Olimp. Sport. 2007, 1, 54–61. [Google Scholar]
- Platonov, V.N. Sistema Podgotovki Sportsmenov v Olimpiiskom Sporte [System of Training Athletes in Olympic Sports]; Olympic Literature: Kyiv, Ukraine, 2004. [Google Scholar]
- Mishchenko, V.; D’iachenko, A.; Tomiak, T. Individual characteristics of anaerobic capacity as a component of special endurance of athletes. Nauka Olimp. Sport. 2003, 1, 57–62. [Google Scholar]
- Shantarovich, V.V.; Kallaur, E.G.; Medvedev, P.Y. Theoretical and Practical Aspects of Improving the Strength Training of Kayak and Canoe Rowers; Mozyr State Pedagogical University Named After I. P. Shamyakin: Mozyr, Belarus, 2018; pp. 1–111. [Google Scholar]
- Castañeda-Babarro, A.; León-Guereño, P.; Viribay, A.; Gutiérrez-Santamaría, B.; López, I.; Mielgo-Ayuso, J. The influence of anthropometric variables on the performance of elite traditional rowers. Sports 2024, 12, 185. [Google Scholar] [CrossRef]
- Gavala-González, J.; Porras-García, M.E.; Fernández-García, J.C.; Real-Pérez, M. Effects of specific training using a rowing ergometer on sport performance in adolescents. Appl. Sci. 2024, 14, 3180. [Google Scholar] [CrossRef]
- Ding, Z.; Li, C.-P.; Lin, H.-H.; Hung, S.-T.; Tseng, C.-H.; Hsu, C.-H. Exploring the flow experience and re-experience intention of students participating in water sports from the perspective of regional tourism and leisure environment suitability. Sustainability 2023, 15, 14614. [Google Scholar] [CrossRef]
- Chen, C.-C.; Lin, C.-S.; Chen, Y.-T.; Chen, W.-H.; Chen, C.-H.; Chen, I.-C. Intelligent performance evaluation in rowing sport using a graph-matching network. J. Imaging 2023, 9, 181. [Google Scholar] [CrossRef] [PubMed]
- Mpimis, T.; Gikas, V.; Gourgoulis, V. A rigorous and integrated on-water monitoring system for performance and technique improvement in rowing. Sensors 2023, 23, 6150. [Google Scholar] [CrossRef]
- Agius, T.P.; Cerasola, D.; Gauci, M.; Sciriha, A.; Sillato, D.; Formosa, C.; Gatt, A.; Xerri de Caro, J.; Needham, R.; Chockalingam, N.; et al. The Kinematics of Fixed-Seat Rowing: A Structured Synthesis. Bioengineering 2023, 10, 774. [Google Scholar] [CrossRef]
- Puce, L.; Biz, C.; Trompetto, C.; Marinelli, L.; Currà, A.; Cavaggioni, L.; Formica, M.; Vecchi, V.; Cerchiaro, M.C.; Trabelsi, K.; et al. A Scoping Review with Bibliometric Analysis of Para-Rowing: State of the Art and Future Directions. Healthcare 2023, 11, 849. [Google Scholar] [CrossRef]
- Penichet-Tomás, A.; Jimenez-Olmedo, J.M.; Pueo, B.; Olaya-Cuartero, J. Physiological and Mechanical Responses to a Graded Exercise Test in Traditional Rowing. Int. J. Environ. Res. Public Health 2023, 20, 3664. [Google Scholar] [CrossRef]
- Guo, Y.; Li, B.; Zhang, Q.; He, X.T.; Sun, J.Y. A Further Theoretical Study of Capacitive Pressure Sensors Based on Thin Film Elastic Deflection and Parallel Plate Capacitor: Refined Closed-Form Solution and Numerical Calibration. Sensors 2022, 22, 2848. [Google Scholar] [CrossRef]
- Tai, G.; Wei, D.; Su, M.; Li, P.; Xie, L.; Yang, J. Force-Sensitive Interface Engineering in Flexible Pressure Sensors: A Review. Sensors 2022, 22, 2652. [Google Scholar] [CrossRef] [PubMed]
- Czakó, Z.; Surdea-Blaga, T.; Sebestyén, G.; Hangan, A.; Dumitraşcu, D.L.; David, L.; Chiarioni, G.; Savarino, E.; Popa, S.L. Integrated Relaxation Pressure Classification and Probe Positioning Failure Detection in High-Resolution Esophageal Manometry Using Machine Learning. Sensors 2022, 22, 253. [Google Scholar] [CrossRef] [PubMed]
- Jang, J.; Jun, Y.S.; Seo, H.; Kim, M.; Park, J.U. Motion Detection Using Tactile Sensors Based on Pressure-Sensitive Transistor Arrays. Sensors 2020, 20, 3624. [Google Scholar] [CrossRef]
- Deng, F.; He, Y.; Li, B.; Zuo, L.; Wu, X.; Fu, Z. A CMOS Pressure Sensor Tag Chip for Passive Wireless Applications. Sensors 2015, 15, 6872–6884. [Google Scholar] [CrossRef]
- Osadchuk, I.A.; Osadchuk, A.V.; Osadchuk, V.S.; Semenov, A.O. Nanoelectronic Pressure Transducer with a Frequency Output Based on a Resonance Tunnel Diode. In Proceedings of the 2020 IEEE 15th International Conference on Advanced Trends in Radioelectronics, Telecommunications and Computer Engineering (TCSET), Lviv-Slavske, Ukraine, 25–29 February 2020; pp. 452–457. [Google Scholar] [CrossRef]
- Osadchuk, O.V.; Osadchuk, V.S.; Osadchuk, I.A. Mathematical Model of a Frequency Pressure Transducer Based on a Resonant Tunneling Diode. Phys. Chem. Solid State 2022, 23, 277–284. [Google Scholar] [CrossRef]
- Osadchuk, O.V.; Osadchuk, I.O.; Suleimenov, B.; Zyska, T.; Arman, A.; Tleshova, A.; Grądz, Ż. Frequency Pressure Transducer with a Sensitivity of Mem Capacitor on the Basis of Transistor Structure with Negative Resistance. Proc. SPIE 2017, 10445, 1044559. [Google Scholar] [CrossRef]
- Kenyeres, M.; Kenyeres, J.; Hassankhani Dolatabadi, S. Distributed Consensus Gossip-Based Data Fusion for Suppressing Incorrect Sensor Readings in Wireless Sensor Networks. J. Low Power Electron. Appl. 2025, 15, 6. [Google Scholar] [CrossRef]
- Bulowski, W.; Knura, R.; Socha, R.P.; Basiura, M.; Skibińska, K.; Wojnicki, M. Thin Film Semiconductor Metal Oxide Oxygen Sensors: Limitations, Challenges, and Future Progress. Electronics 2024, 13, 3409. [Google Scholar] [CrossRef]
- Kleshnev, V. Analysis of the Results of the 2018 World Rowing Championships. BioRow. 2018. Available online: https://old.biorow.com/index.php?news_id=38&route=information/news/news (accessed on 5 October 2025).
- Kleshnev, V. Paris 2024 Olympic Games—Analysis of Rowing Results. BioRow. 2024. Available online: https://old.biorow.com/index.php?news_id=118&route=information/news/news (accessed on 5 October 2025).
- Kleshnev, V. Rowing Science: Case Study on Technique Efficiency. row2k.com. 2023. Available online: https://www.row2k.com/features/6563/rowing-science-case-study-on-technique-efficiency/ (accessed on 5 October 2025).
- Rowing.su. Results of the St. Petersburg Indoor Rowing Championships (2020). 2020. Available online: https://www.rowing.su/result2020.html (accessed on 5 October 2025).
- Kleshnev, V. BioRow. 2025. Available online: https://biorow.com/ (accessed on 5 October 2025).
- Neamen, D.A. Semiconductor Physics and Devices: Basic Principles, 3rd ed.; McGraw–Hill: New York, NY, USA, 2003. [Google Scholar]
- Sun, Y.; Thompson, S.; Nishida, T. Strain Effect in Semiconductors: Theory and Device Applications; Springer: New York, NY, USA, 2010. [Google Scholar] [CrossRef]
- Dorave, J.; Sadiwala, R. Uplink and Downlink Variation in Drone Technology for Cloud, Edge, Fog and Smart Dust Integrated IoT Architecture: Demonstrated Over WSNs. J. Phys. Conf. Ser. 2021, 2089, 012023. [Google Scholar] [CrossRef]
- Korowajczuk, L. LTE, WiMAX and WLAN Network Design, Optimization and Performance Analysis; John Wiley & Sons: Chichester, UK, 2011. [Google Scholar]
- Di Benedetto, M.-G.; Serra i Lidón, P. Analysis of the NB-IoT Technology Towards Massive Machine Type Communication. Bachelor Thesis, Università degli Studi di Roma “La Sapienza”, Rome, Italy, 2018. [Google Scholar]
- Osadchuk, O.V.; Osadchuk, V.S.; Krylyk, L.V.; Osadchuk, Y.O. Microelectronic Device for Pressure Measurement with Frequency Output. Ukrainian Utility Model. UA 155932 U, 17 April 2024. Available online: https://patents.google.com/patent/UA155932U (accessed on 11 August 2025).
- Osadchuk, V.S.; Osadchuk, O.V.; Krylyk, L.V.; Osadchuk, Y.O.; Chervak, O.P. Self-Oscillating Pressure Transducer. Ukrainian Patent UA 124907 C2, 8 December 2021. Available online: https://patents.google.com/patent/UA124907C2 (accessed on 11 August 2025).
Disclaimer/Publisher’s Note: The statements, opinions and data contained in all publications are solely those of the individual author(s) and contributor(s) and not of MDPI and/or the editor(s). MDPI and/or the editor(s) disclaim responsibility for any injury to people or property resulting from any ideas, methods, instructions or products referred to in the content. |
© 2025 by the authors. Licensee MDPI, Basel, Switzerland. This article is an open access article distributed under the terms and conditions of the Creative Commons Attribution (CC BY) license (https://creativecommons.org/licenses/by/4.0/).