1. Introduction
Moisture in walls is one of the main reasons for damage in floor and wall coverings. It manifests itself in different ways, depending on the causes of its origin. If the underlying causes are not identified and removed, it is not possible to permanently repair the damage to the covering or find a solution that would prevent its repeated occurrence. There can be several causes of moisture and they can be interconnected: excessive moisture, moisture in the screed, walls, or building structures that are not sufficiently dried, and moisture from the underlying layer—it appears primarily in screeds or building structures that are located on the ground floor or in direct contact with the terrain and are not protected by adequate vapor protection. Also, water penetration from the outside occurs due to damage to water pipes, design, or construction errors on terraces, attics, or external walls. Moisture caused by condensation as a phenomenon is little discussed, because the causes of its occurrence often cannot be accurately determined. Sometimes, it depends on the internal and external climatic conditions, or on the design or construction conditions and on the properties of the materials used [
1,
2]. The temperatures at which water vapor changes to condensate can also be shown graphically with respect to different values of relative humidity and air temperature using the Mollier diagram. The Mollier diagram [
1] shows curves that, at the same relative humidity, show different amounts of water vapor in the air (grams of water vapor per kilogram of air) with respect to temperature. The curve at 100% relative humidity represents the saturation curve.
Condensation can be a problem even in new buildings. While traditional methods to avoid condensation (such as insulation and ventilation) are usually used, new research [
2,
3,
4,
5,
6,
7,
8,
9] offers insight on the limitations of such approaches in conditions of variable indoor and outdoor microclimates.
One such study found that condensation occurs most frequently in the balcony area of a typical residential unit [
2]. Traditional mitigating methods, such as increasing the thickness of the insulation and regulating the ventilation, were simulated. As a solution, an IoT system was implemented that controls the opening of doors and ventilation of balconies in real time. The results showed that this approach reduces the duration of condensation [
2]. In another paper, a hygrothermal chamber was developed to test the resistance of building materials to water vapor diffusion. The system automatically controlled heating, cooling, humidification, and dehumidification, with precise control of temperature and humidity [
3]. A Japanese study focused on house floor spaces showed that condensation and evaporation are highly dependent on ventilation conditions [
4]. These studies highlight the importance of a dynamic approach to managing moisture in buildings. Also, the thermal conductivity of building materials is an important factor in the occurrence of condensation. Materials with low thermal conductivity keep internal surfaces warm, reducing the risk of condensation, while high conductivity, such as that of concrete and steel, increases the likelihood of cold spots, especially thermal bridges at the joints of structural elements that induce condensation.
The moisture can also penetrate the walls affecting the thermal transmittance (U-value) of a wall as it is inherently sensitive to its moisture content, since water infiltration increases the effective thermal conductivity of the constituent materials. When a wall absorbs moisture—whether through capillary rise, vapor diffusion, or leakage—the added liquid water enhances heat flow pathways, yielding a higher measured U-value than under dry conditions. Thus, deviations between in situ U-value measurements and values predicted from dry-material properties may serve as indirect indicators of elevated moisture levels within the wall assembly distributions. While an anomalously high U-value suggests the presence of moisture, it does not unambiguously identify its quantity or distribution; therefore, complementary diagnostic methods (e.g., moisture meters, infrared thermography, or dielectric mapping) are required to localize and quantify moisture accumulation. So, a U-value measurement system together with infrared thermography can be a valuable tool to indicate a location of moisture in walls.
The energy efficiency of a building envelope can be expressed in
U-values and theoretically calculated with known material properties and boundary conditions, but in practice, these data are often unavailable or have changed due to material aging. Therefore, there is a growing need for a simple and accurate measurement of
U-values in the field. In recent years, several studies have been conducted to develop affordable methods for measuring thermal transmittance. One approach is to use a thermometric method with simple heat flux sensors [
5,
6,
7,
8,
9], while another approach is to use temperature-only sensors [
10,
11]. Temperature-only sensors THM (Thermal Heat Method) and ASTR (Asymmetrical Steady-State Thermal Resistance Method) have proven to be effective, especially in stable conditions and with significant temperature differences between the interior and exterior [
12,
13,
14]. A comprehensive review comparing theoretical and measured
U-values for different wall types (concrete, brick, wood, straw bale) has recently been provided, providing the biases and environmental influences on measurement accuracy [
15], as well as recent advances in thermal conductivity measurement methods, including new sensor designs, calibration strategies, and uncertainty reduction techniques [
16].
Compared to previous research [
17,
18], in which a thermal conductivity measurement system was developed using two methods: TBM (Temperature-based model) and HFM (Heat flux model), in this work, a mobile system for measuring thermal conductivity indicating underlying moisture content in walls and condensation is designed using the temperature, humidity and pressure sensors as well as the infrared temperature sensor. By carefully selecting and calibrating the thermistors used in the measurements, the uncertainty of measurement was significantly reduced. The dew point determined through this method was compared with values derived from the Mollier diagram. Additionally, thermal conductivity obtained via the TBM and HFM methods [
18] were analyzed and compared. The experimental results were also evaluated against theoretically calculated values to assess consistency and accuracy.
2. Development and Analysis of a Mobile Measurement System
The mobile module that was proposed and developed can be used in a wide range of applications, whether for measuring humidity, air pressure, condensation point, or heat flow and conductivity of walls. The system can also collect data autonomously and independently of PC or laptop for a longer period and can be simply attached to the wall. To calculate thermal transmittance, the system measures exterior, interior, and wall temperatures while to detect condensation and calculate dew point, it also measures pressure and humidity.
2.1. Mobile Measuring Assembly
The heart of the system is myRIO-1900 microcontroller (National Instruments, Austin, TX, USA), designed for developing real engineering solutions. It is equipped with a few interfaces; 10 analog inputs and 6 analog outputs, 40 digital I/O lines, Wi-Fi connectivity, built-in three-axis accelerometer, Xilinx FPGA and dual-core ARM Cortex-A9 processor, and several serial communication protocols [
11].
In our application, a hard disk cable was used to connect the myRIO controller with a sensor box. To measure temperature, pressure, and humidity, a BME280 sensor (Bosch Sensortec, Reutlingen, Germany) is used [
19]. Its temperature range is −40 °C to 85 °C, with an accuracy of ±1.0 °C over a temperature range of 0 to 65 °C. Above or below this range, the error increases to ±1.5 °C. The sensor also provides full-range relative humidity measurements from 0 to 100%, with a typical accuracy of ±3% over a temperature range of 0 to 60 °C. Outside this range, accuracy decreases, especially at extreme temperatures. The sensor is connected to myRIO through I2C communication. As myRIO does not have a real-time clock, DS3231 (Analog Devices, Wilmington, MA, USA) [
20] is used as a high-precision real-time clock (RTC) module enabling time stamping of the measurement data. The MLX90614 (Melexis NV, Ypres, Belgium) [
21] is a precision infrared (IR) thermometer designed for non-contact temperature measurement, ideal for applications where physical contact with the object is undesirable or impossible. MLX90614 supports two digital output interfaces: 10-bit PWM output and SMBus (System Management Bus), which was eventually chosen as a communication protocol for connection to myRIO. The sensor can measure temperature in the range from −20 °C to 120 °C, with an output resolution of 0.14 °C. A plastic box with a hole in the bottom in dimensions suitable for the MLX90614 sensor was designed. On the side of the box, an interface for the myRIO controller interface [
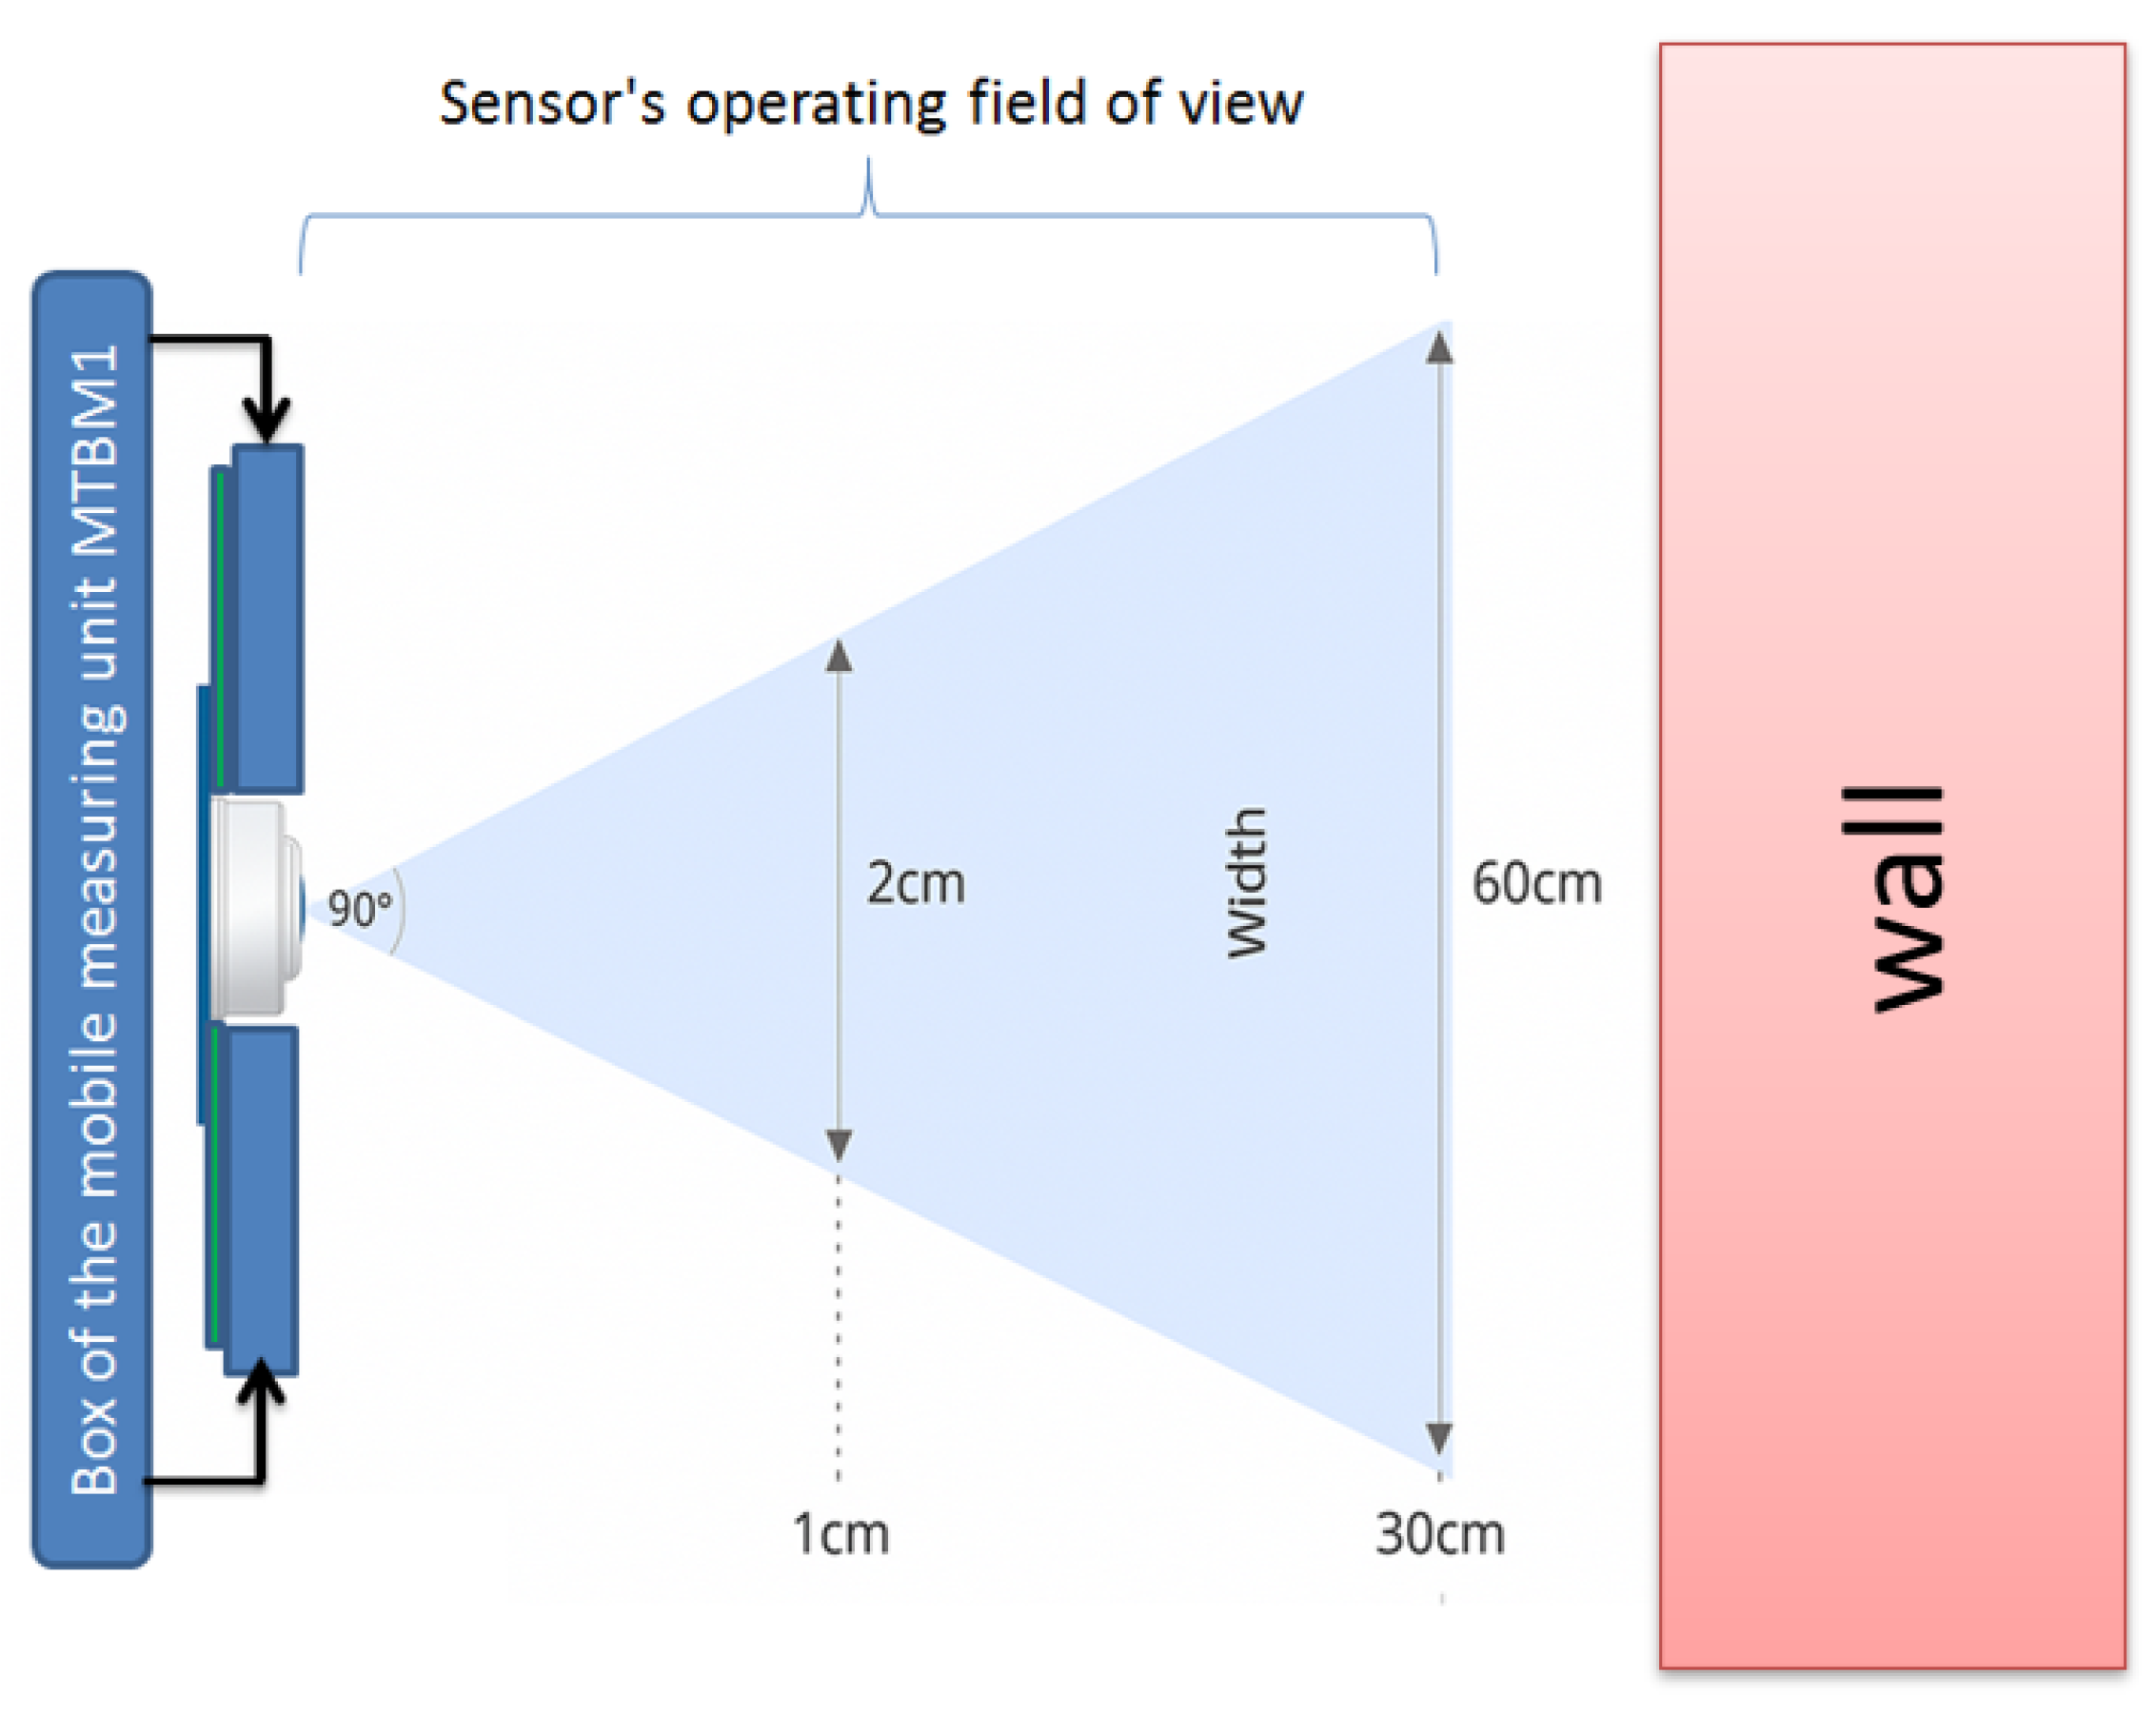
22] is placed. Therefore, the plastic box contains all the sensors, real-time clock, and interface to the myRIO platform. Care was taken by placing the MLX90614 sensor so that it measures wall temperature 3–5 cm away from the wall, so the box was adequately attached to the wall. The MLX90614 sensor measures the average temperature of a wall or surface at 45 degrees (
Figure 1). The cable has a limit of approximately 100 cm for the I2C communication to work properly, so the system was designed with that in mind. The position of the MLX90614 sensor in relation to the wall is shown in
Figure 1.
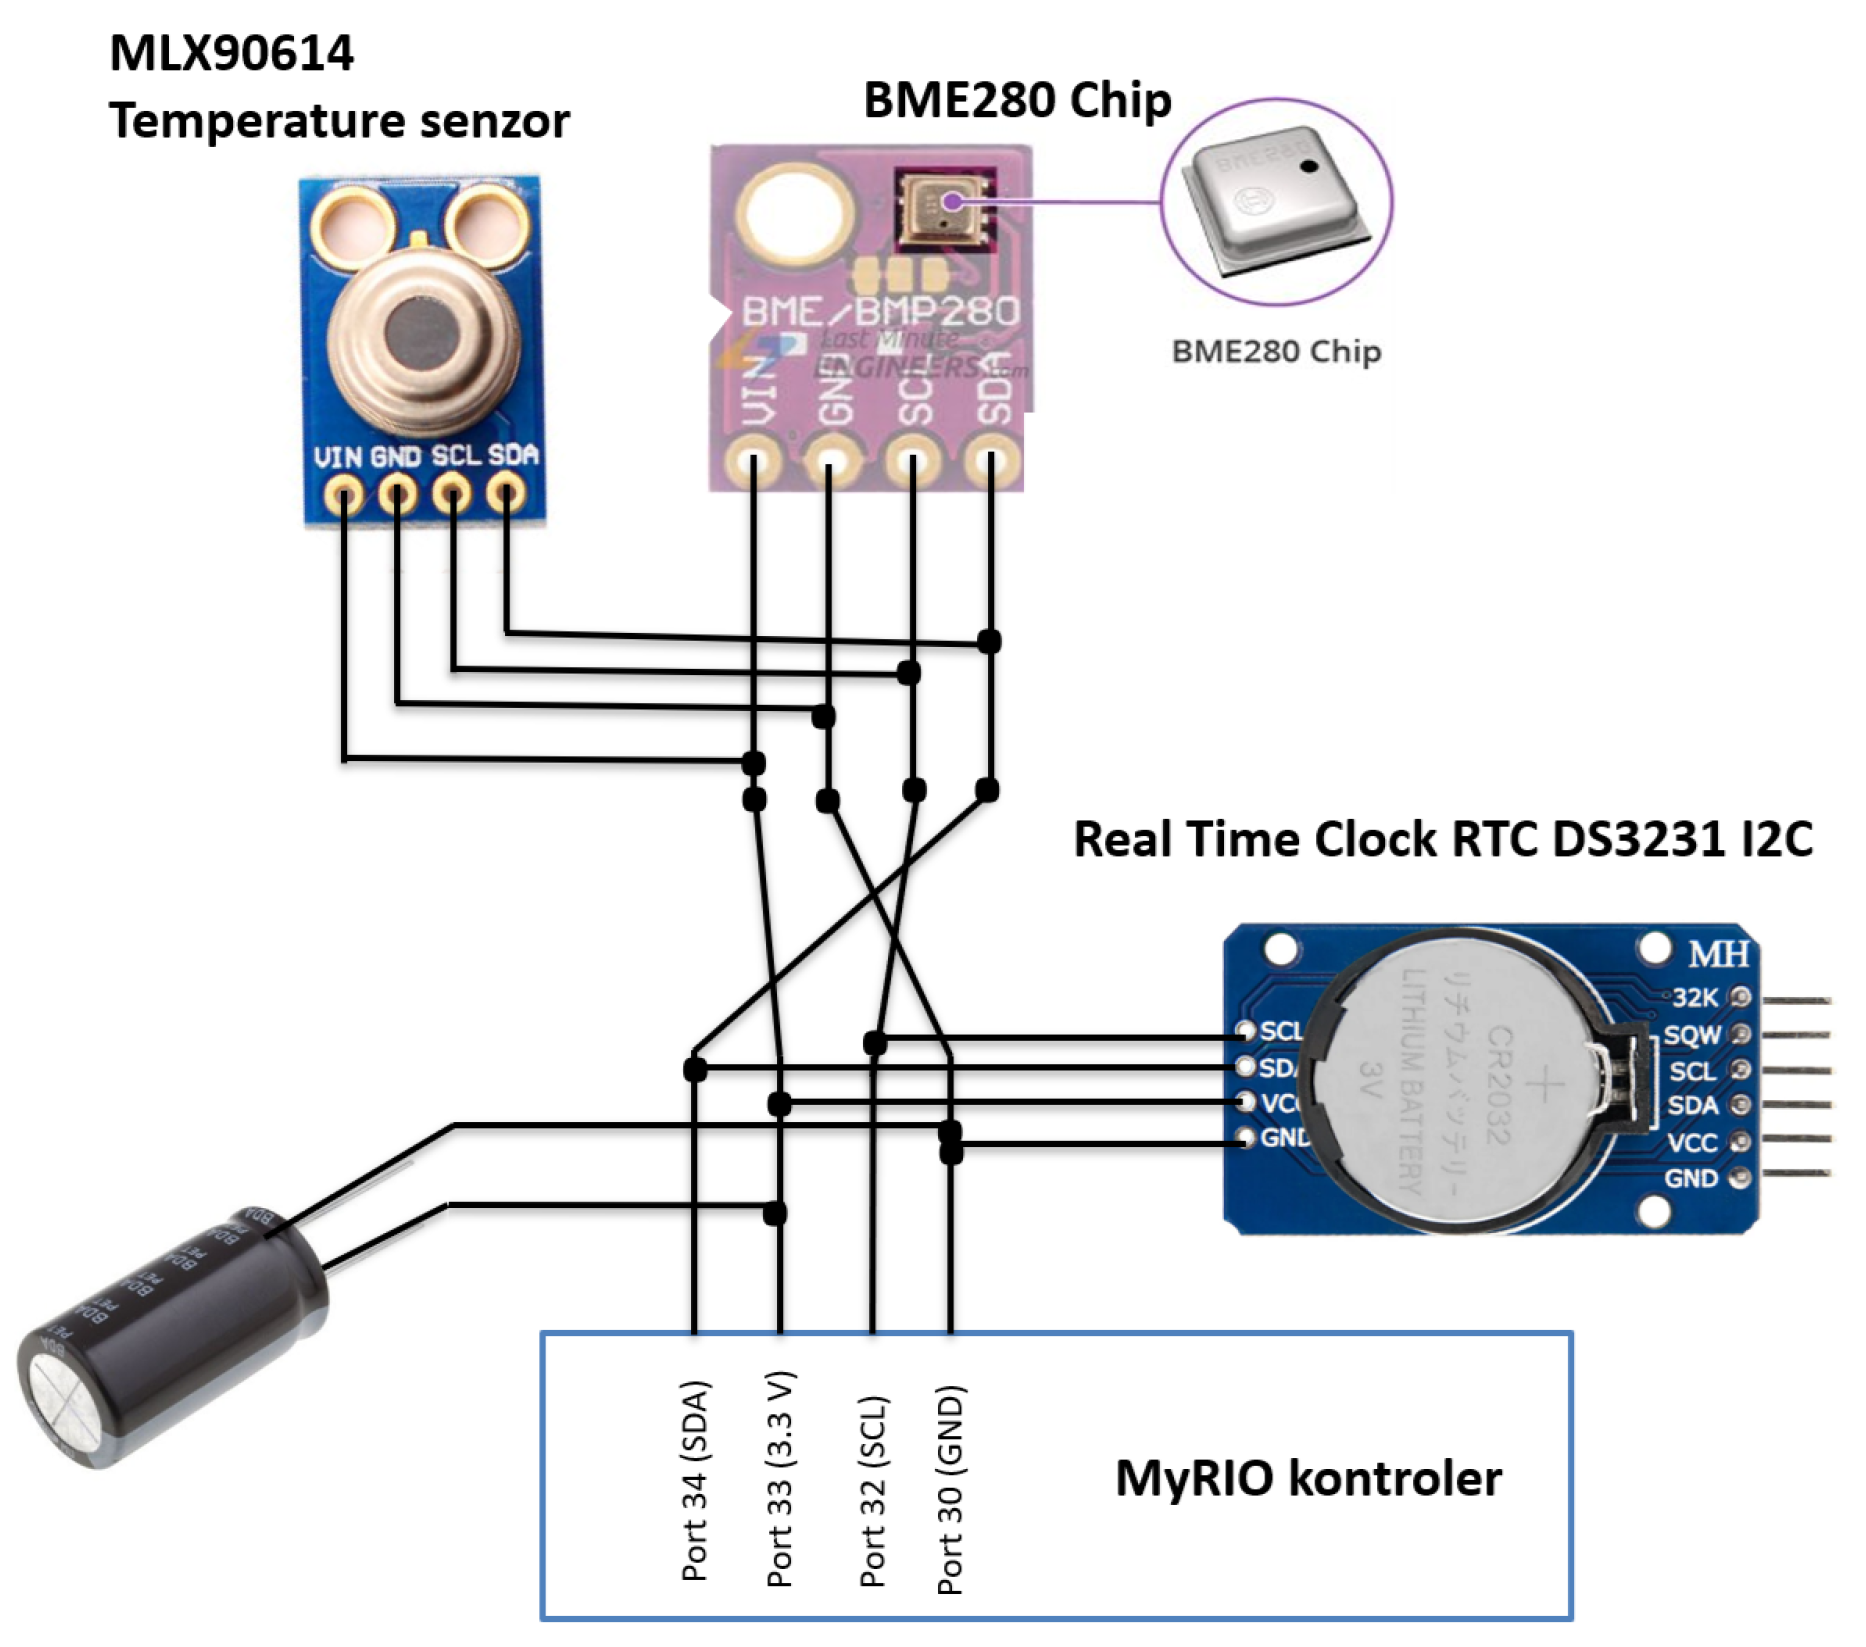
The electrical diagram of the mobile part of the MTBM1 measuring system, showing the method of connecting system elements and sensors, is shown in
Figure 2.
To ensure optimal thermal contact, the MTBM1 module was mounted on the wall surface and additionally secured with adhesive tape. This precaution prevented the influence of ambient air on sensor contact, ensuring accurate measurements. All the sensors have a built-in digital conversion and send digital data via an I2C serial connection. The system allows data acquisition and flexible selection of the measurement period directly from the control panel, allowing real-time control of the measurement process.
According to ISO 9869-1 (Thermal Insulation—Building Elements, ISO: Geneva, Switzerland, 2014) [
6], the duration of
U-value measurements using the TBM and HFM methods ranges from a minimum of three days to more than seven days [
23], depending on whether the R-value deviation remains within 5% of the value recorded on the previous day or within a defined time frame. In some cases, measurements were extended beyond two weeks to achieve satisfactory accuracy. The results obtained from these measurements [
18] were compared with those obtained with the mobile module MBTM1. The guidelines set by the ISO standard were carefully followed, and the results are in line with their requirements. Since the MTBM1 module is in the test phase, the measurements were limited to one day and compared to the results with standard measurements using the TBM and HFM methods on the same wall, which are described in detail in our previous article [
18].
The outside temperature has been read from a sensor placed on the outside of the building. An alternative approach was also used, and the relevant data has been acquired using two meteorological services. In this case, the outside temperatures were taken from the hydrometeorological weather stations of the State Hydrometeorological Institute of Croatia (DHMZ) using the closest available location of their sensors to the measurement site. The purpose of collecting outdoor temperature data related to the two outdoor temperature data sources is to calculate the U-value of the wall based on the TBM method and dew point outside. Data collection was carried out in XML format and according to the availability of the two services mentioned.
The
U-value measurements are determined in accordance with ISO 6946:2017 (Building components and building elements, Edition 3, 2017) [
24], which outlines the calculation method for the thermal resistance and thermal transmittance of building components and elements. This standard excludes doors, windows, glazed units, curtain walling, components involving heat transfer to the ground, and elements designed to allow air permeation.
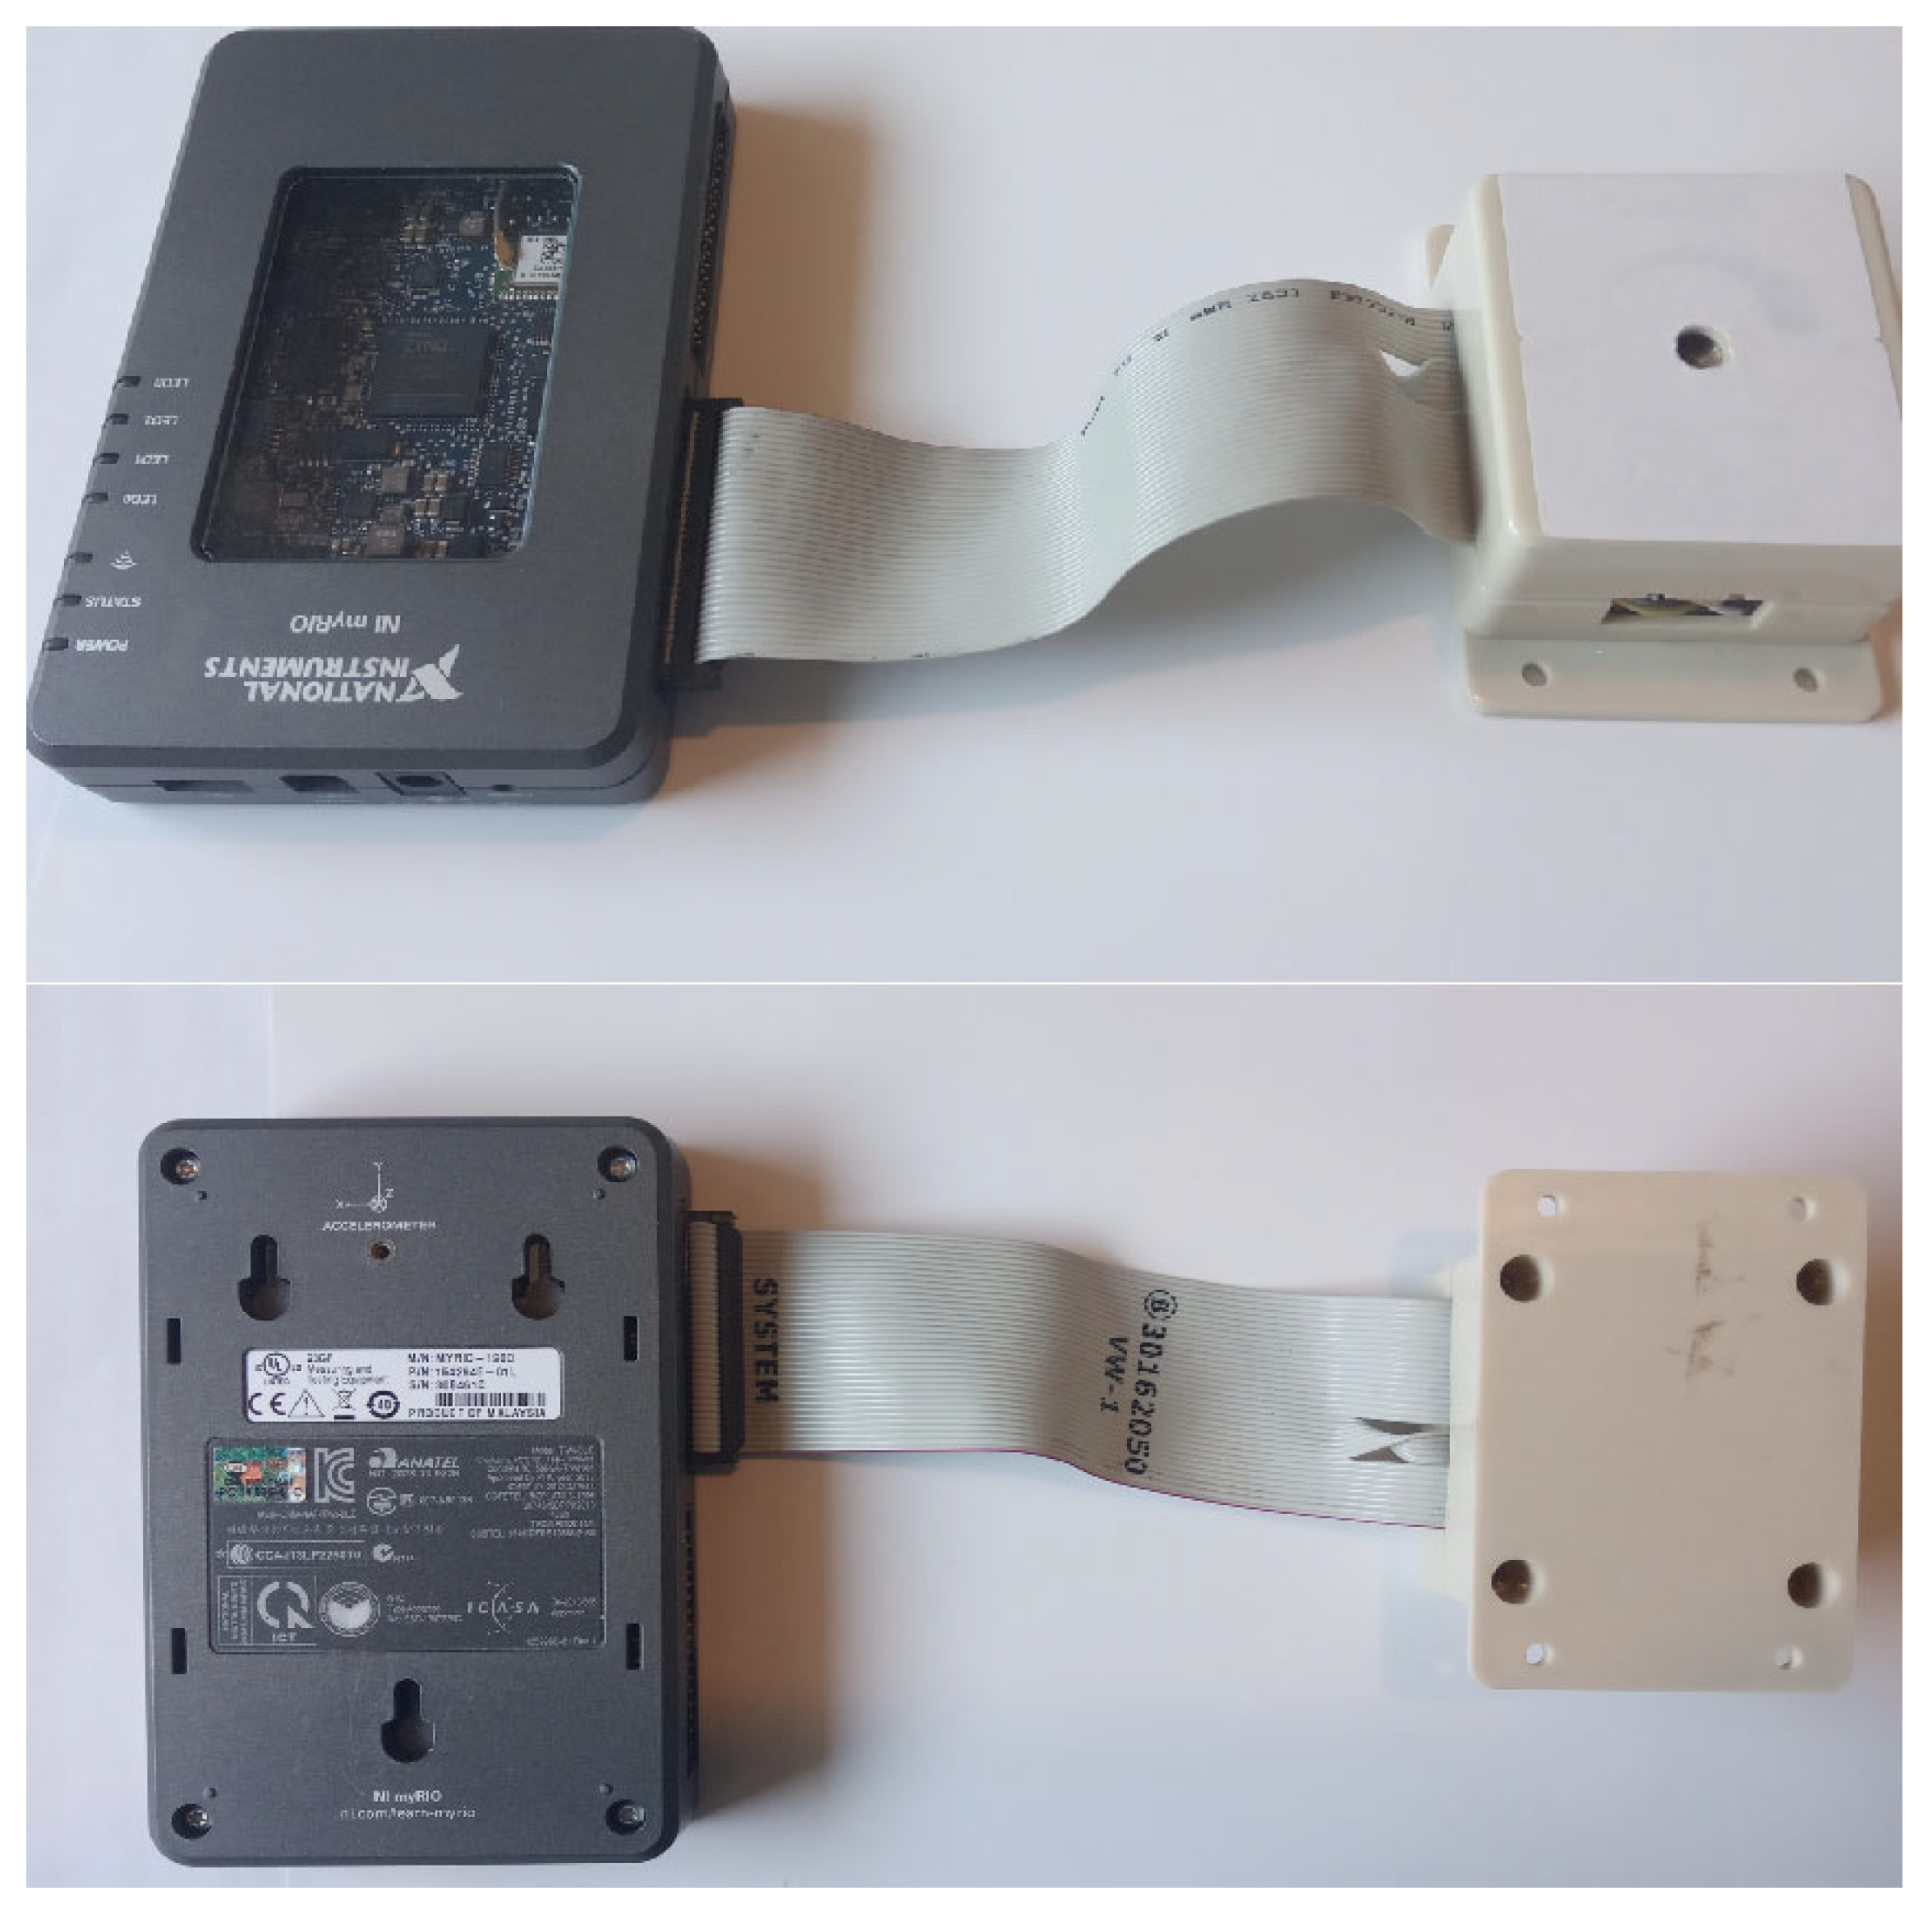
Figure 3 shows the MTBM1 mobile circuit and the myRIO controller [
25] with the corresponding connection cable.
The measurement system shown in
Figure 3 consists of two physically separate modules: the myRIO data acquisition unit (left) and the sensor unit (right). The decision to separate the components into two housings is based on functional and measurement accuracy considerations. Combining electronics (which generate heat) with the temperature-sensitive sensor module could lead to significant thermal interference. To ensure accurate measurements of the thermal conductivity of the wall surface, it is essential to isolate the sensor unit from any heat sources, including the microcontroller or signal conditioning circuitry. Separate sensor placement reduces parasitic heat flow and thermal bridges, preserving the integrity of the thermal gradient measured across the wall.
Due to mechanical flexibility and adaptation to the wall, the sensor module must be placed in direct contact with the wall surface under test. Compact and lightweight housing facilitates stable attachment and minimizes contact resistance. Integrating all components into a single housing increases volume and weight, complicated alignment, and possibly introduces mechanical instability or air gaps that reduce measurement accuracy. A ribbon cable is used to connect the two units and was chosen for its flexibility and minimal thermal conductivity. Since the cable does not heat up or form part of the measurement area, its thermal impact is negligible. Furthermore, its flat profile allows for easy routing without disturbing the sensor interface with the wall. The exposed cable is short, its length is in accordance with the manufacturer’s instructions, thus avoiding any measurable impact on the results.
The modular design simplifies testing, replacement and calibration of the sensor unit without affecting the acquisition hardware. This flexibility is particularly useful during field measurements where environmental conditions may require rapid diagnostics and reconfiguration.
2.2. Description of the Data Processing System (Elements, Measurement Scheme, Program, Measurement Data)
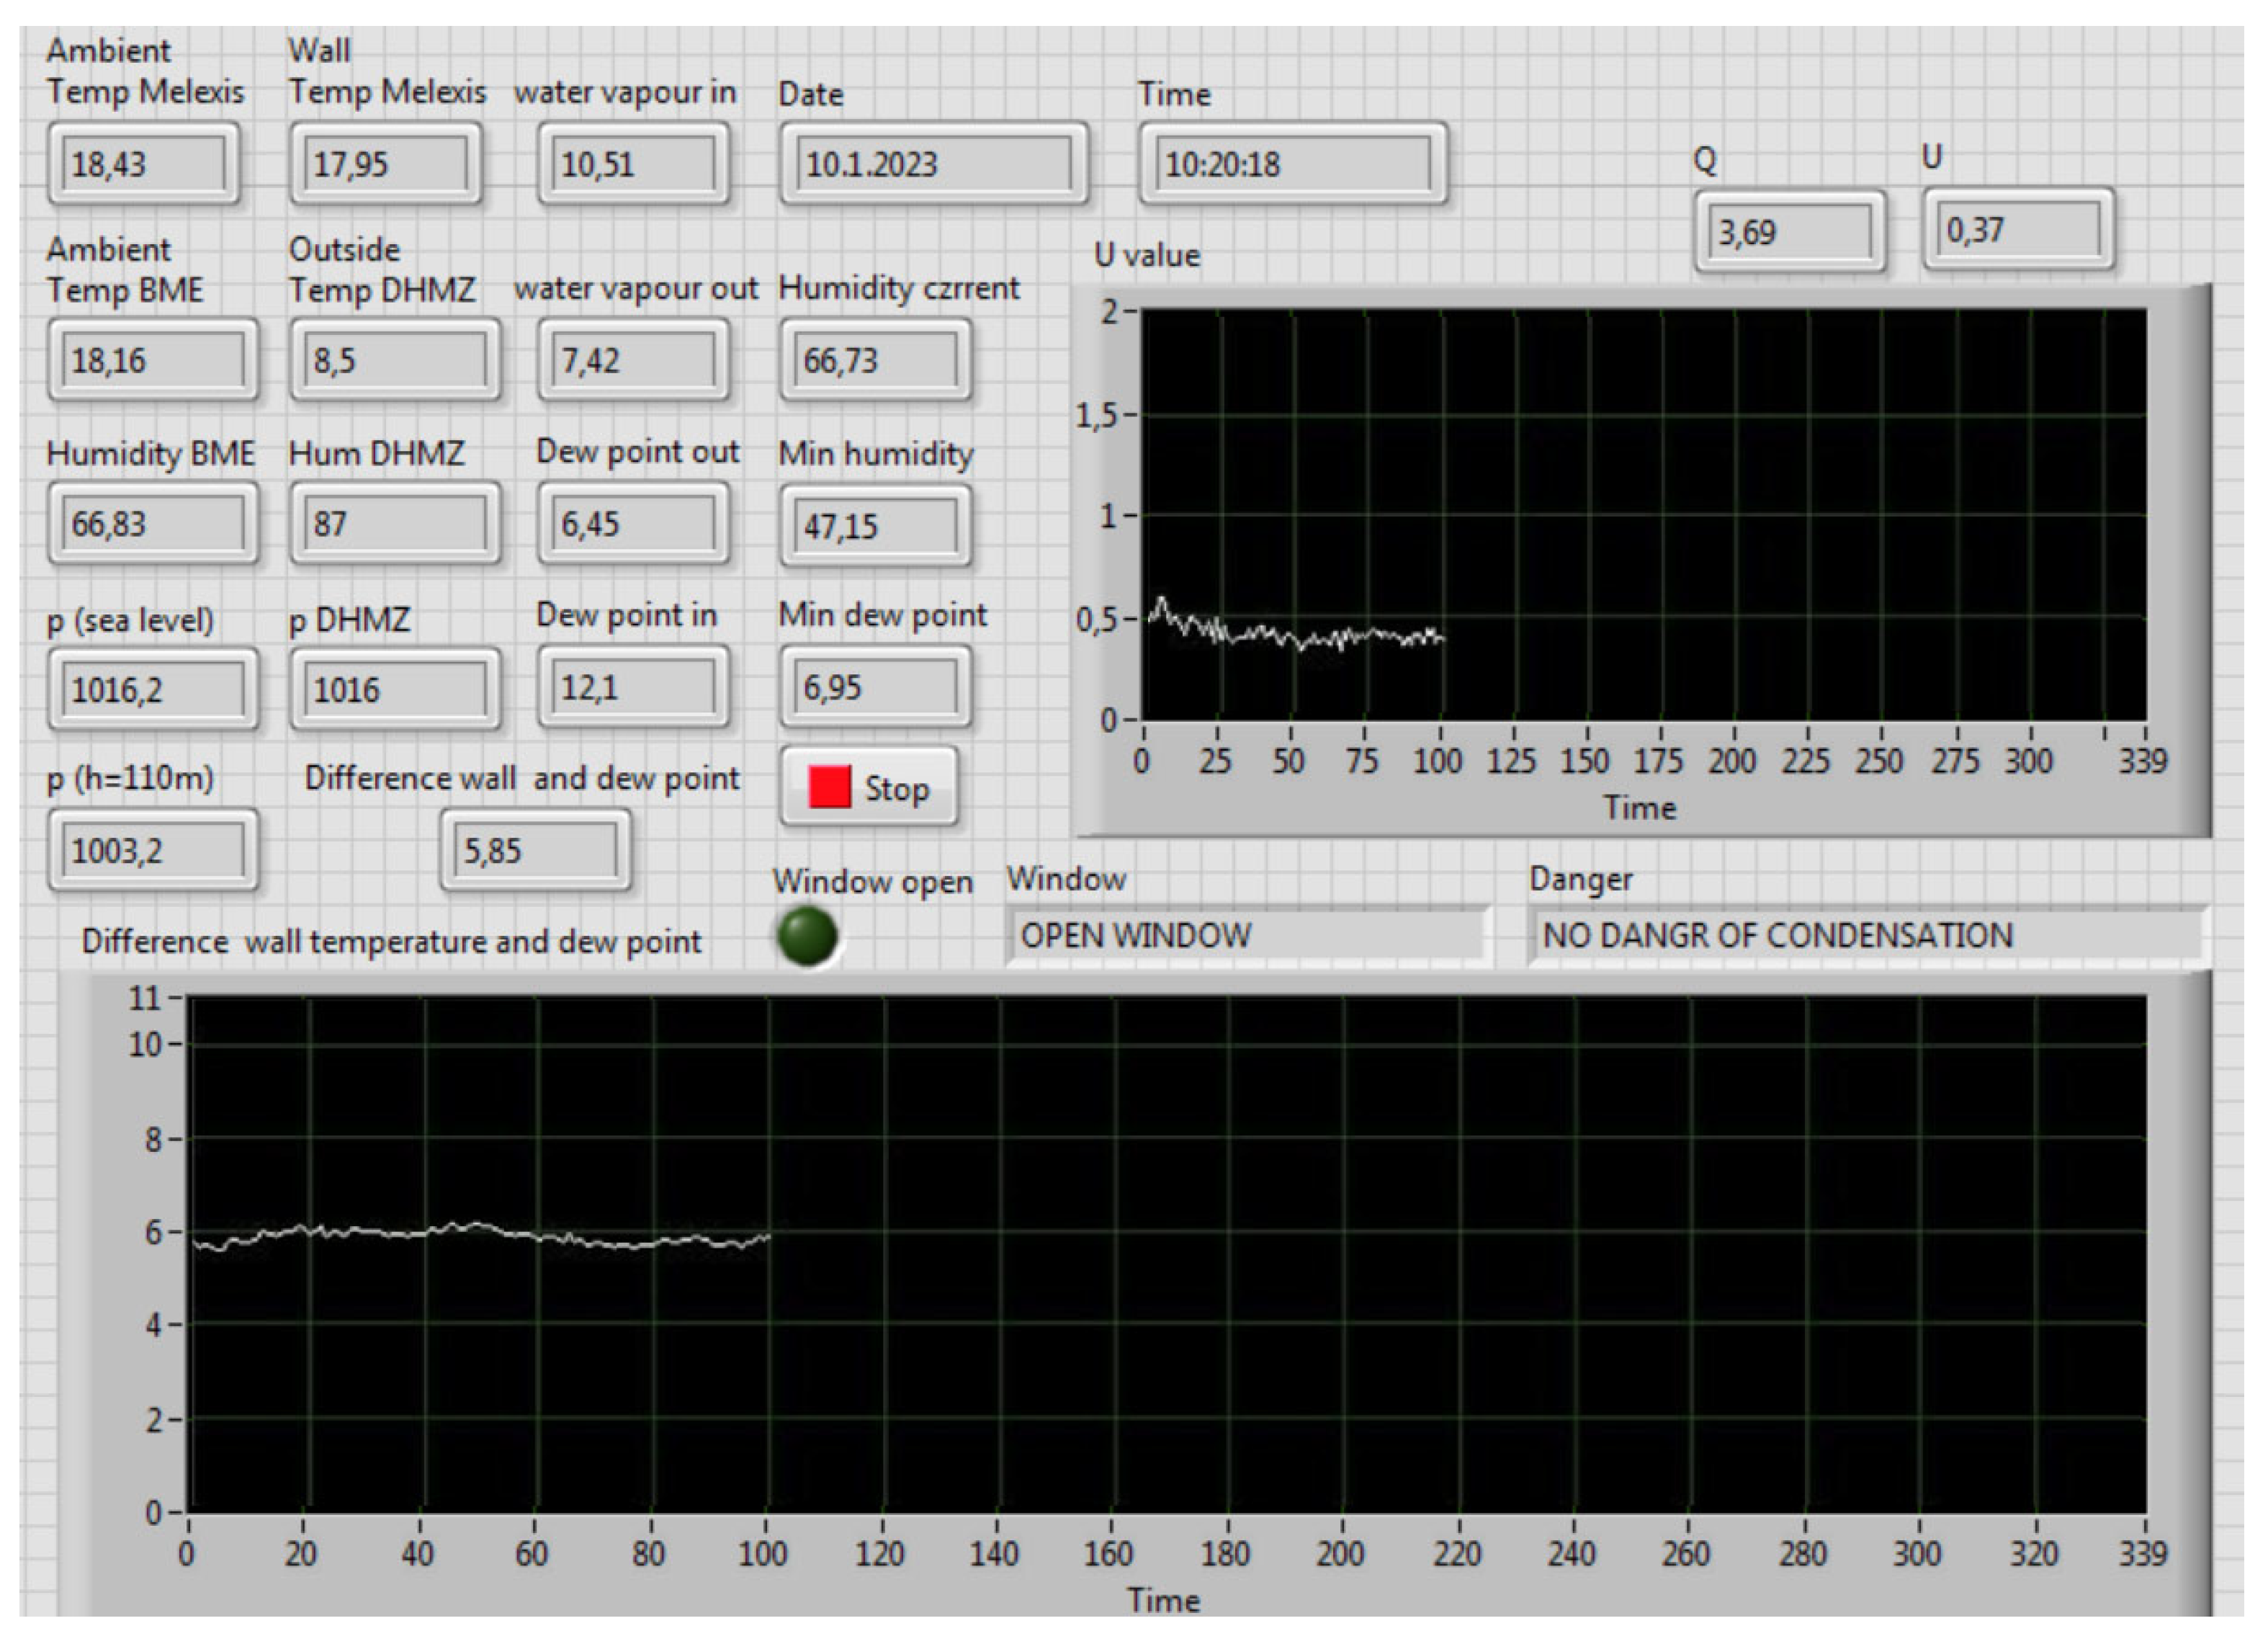
The front panel of the measurement system can be seen in
Figure 4 which displays in real time all the measured and calculated values important to determine the danger of condensation and moisture via
U-value measurement.
The most important value for assessing condensation is the dew point. Dew point is the temperature at which the air becomes completely saturated with moisture (100% relative humidity), causing water vapor to condense into liquid water. It is the point at which the air can no longer hold moisture and condensation begins. Understanding the dew point is crucial in the design and construction of buildings, especially for walls, because if the temperature inside a wall drops below the dew point, moisture from the air can condense inside the wall structure. This can lead to mold growth, wood rot, insulation damage, and reduced thermal efficiency.
Properly installing insulation and vapor barriers helps keep the dew point outside the wall structure or in a safe location (e.g., inside the insulation where condensation will not cause damage). In addition to increasing energy efficiency, avoiding moisture buildup extends the life of building materials and helps maintain healthy indoor air quality.
The data is collected through the MTBM1 module, which can be collected independently or can be connected to a computer or laptop, through which the values of pressure, air humidity, temperature, and the approach of condensation Dew points can be observed in real time. Observation and data management is performed through the system interface in the LabView application. The data can be read from the system interface, which is shown in
Table 1.
The system interface is shown in
Figure 4. The interface is adapted to users, and along with data on temperatures, pressure, and relative humidity, it provides current estimates of the
U-value or the heat flow
Q. The interface has also signaled in the form of a flashing light in the event of danger from condensation. The difference between the wall temperature and the dew point temperature can be monitored on a diagram in real time, and at any time it can be seen how close this difference is to zero, or the moment when the wall temperature has reached the dew point temperature. In further development, the system can be automated, or at a certain temperature point, which is close to the dew point, a certain air conditioner turns on or opens or closes the ventilation in the room.
2.3. Explanation of the Calculated Values Based on Measurement
Measurements were made on the laboratory wall over time at FER in Zagreb and compared with the results of measurements using the HFM and TBM methods in accordance with the ISO 6946:2017. The mobile MTBM1 system was placed on the inner wall and connected to the data processing system.
2.3.1. Mathematical Calculation of Dew Point
To calculate the dew point from the current temperature, the following equation for dew point and water saturation deficit is used. ISO 13788 (Annex E) [
27,
28] gives the recommended empirical formulae for the saturation vapor pressure of water as a function of temperature. The relationship between temperature and water vapor partial pressure for a situation where the temperature is greater than zero is expressed as
where
psat is the saturated vapor pressure in pascals, a
θ is the temperature expressed in °C, and the equation for relative humidity is
where
ea is the actual vapor pressure or vapor pressure at the dew point temperature (in hectopascals), and es is the saturated vapor pressure or vapor pressure at the air temperature.
The dew point temperature (
Tdew) is calculated according to the following formula:
where
where T
air—current air temperature (in °C), Rh—relative humidity (in %), and T
dew—dew point temperature (in °C).
The vapor saturation deficit is calculated as (Vapor Pressure Deficit—VPD):
2.3.2. Pressure, Relative Humidity, and Temperature Measurements with MTBM1
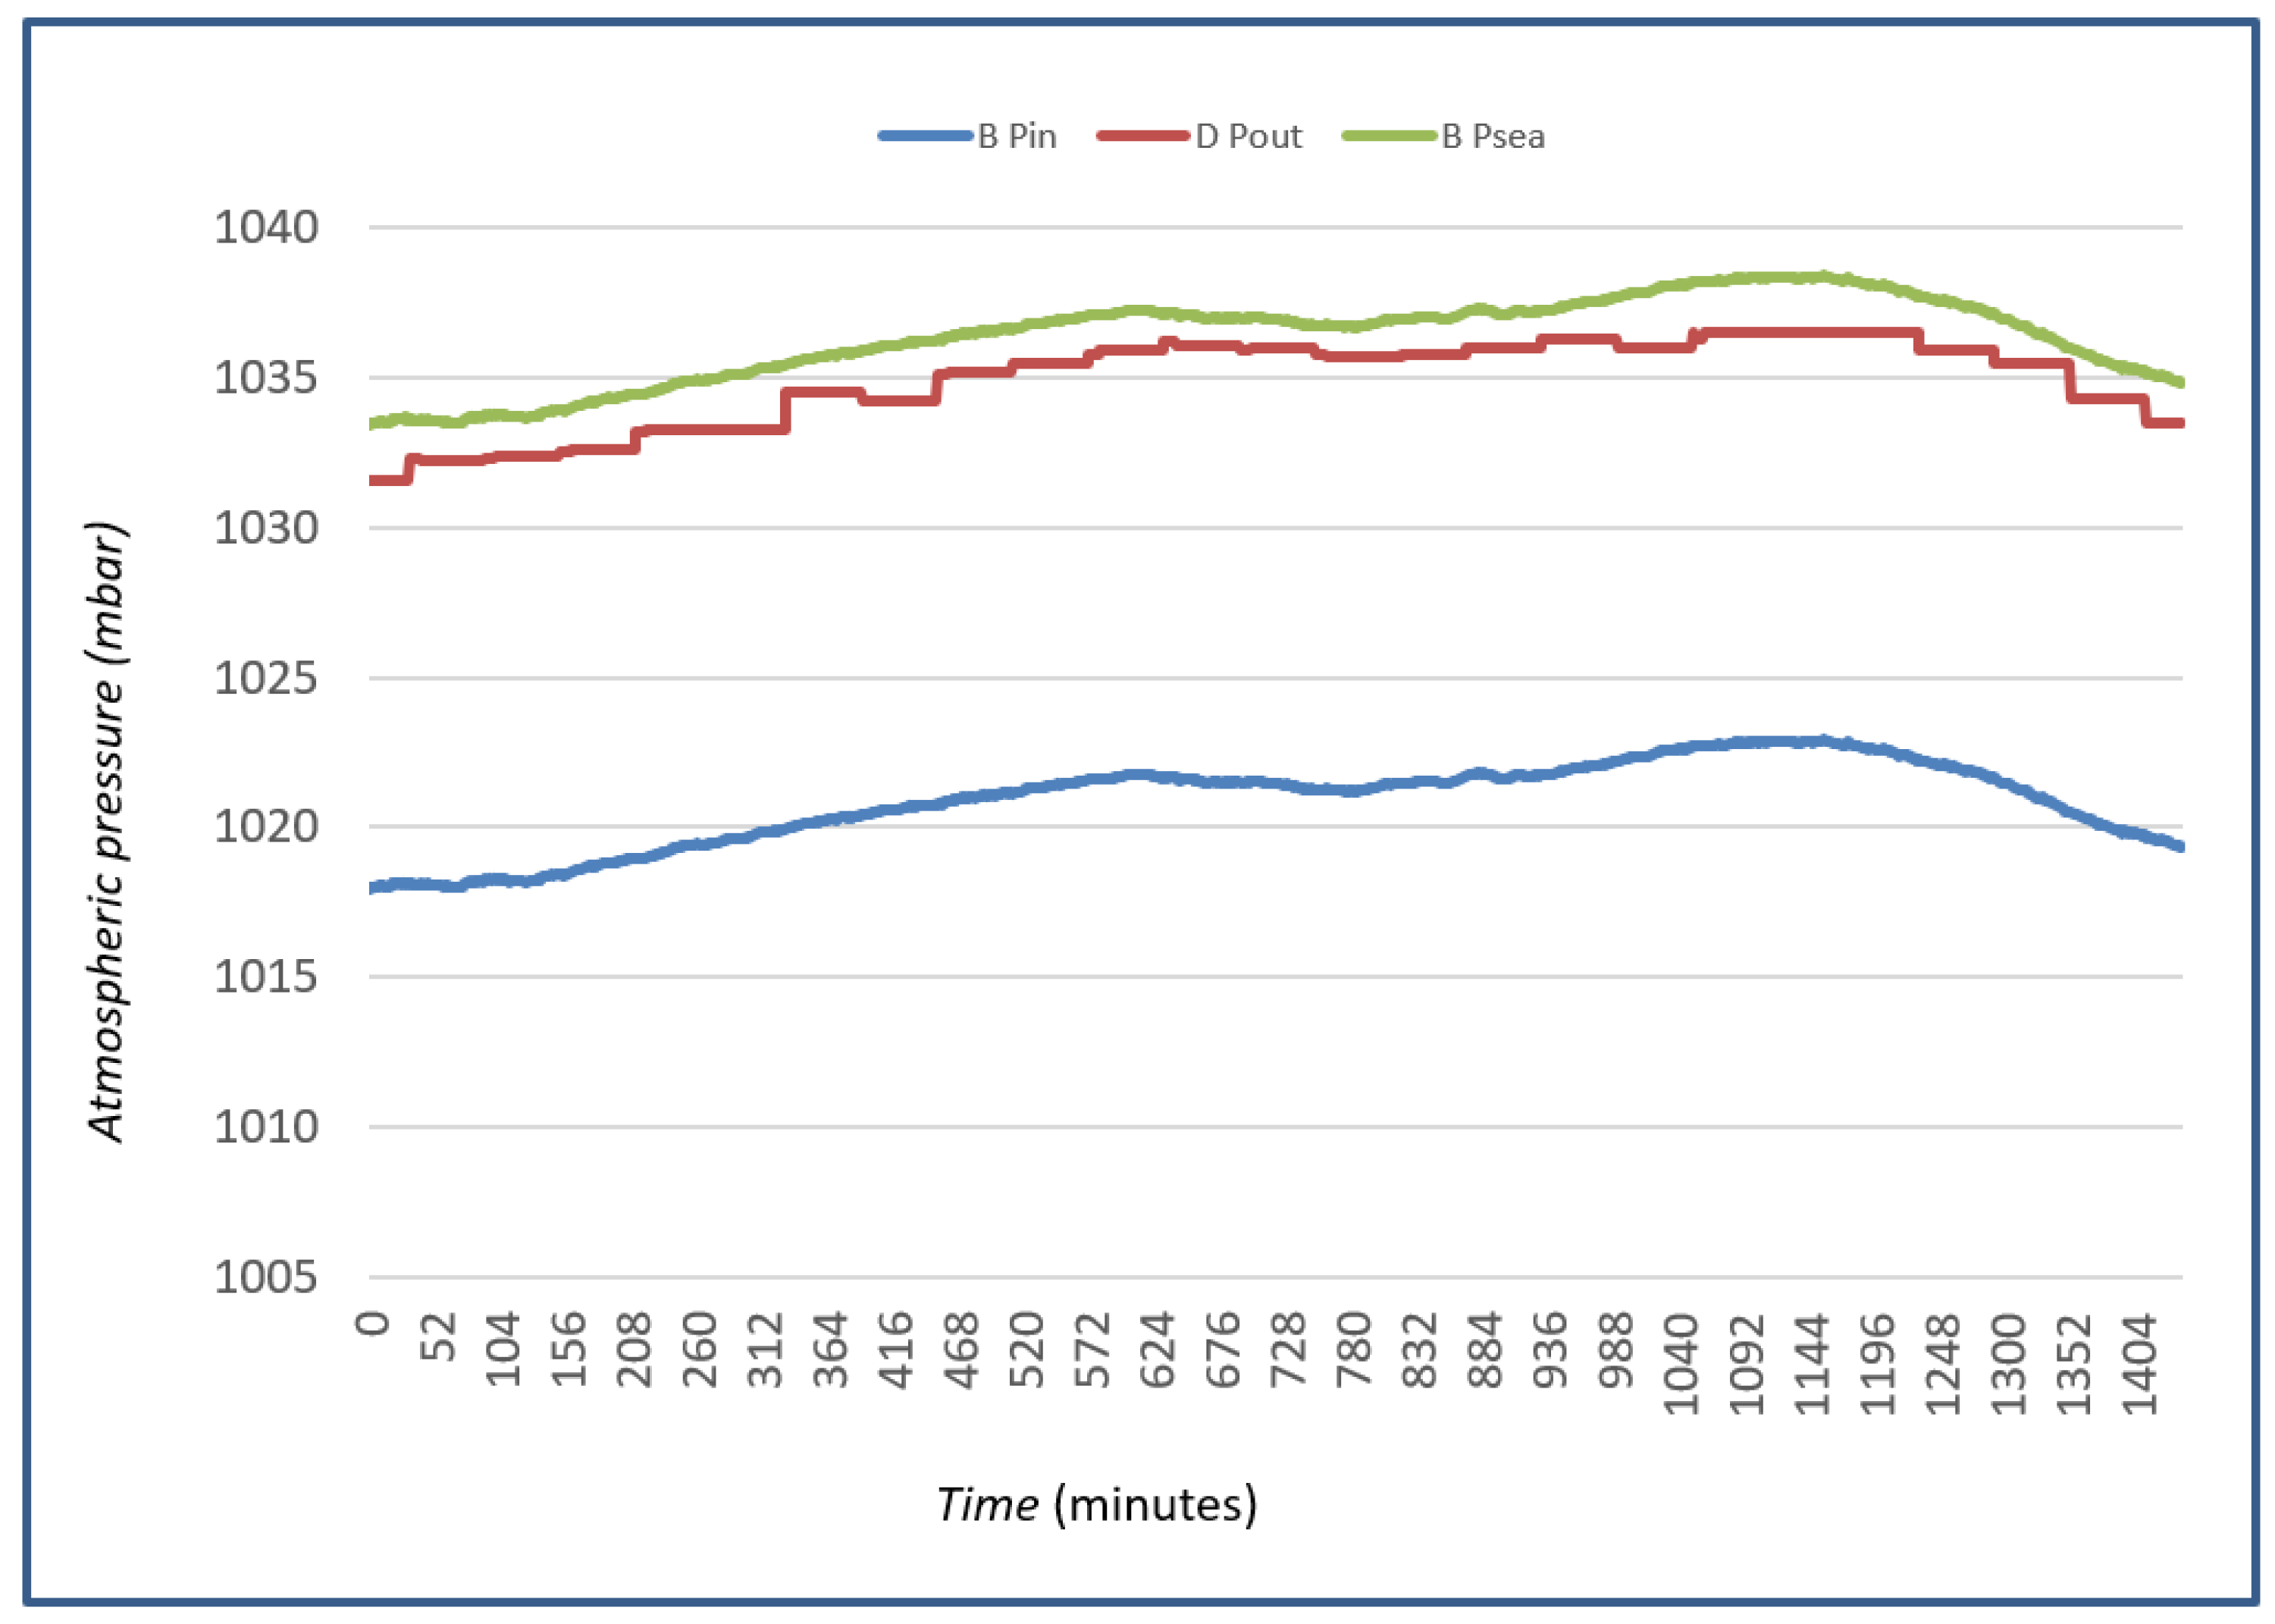
Figure 5 shows a comparison of the pressures measured by the MTBM1 module with those obtained from hydrological meteorological services (DHMZ) to determine the best method for obtaining the required measurement data.
BPin is the pressure measured by the BME280,
BPsea is this pressure converted to sea level, and
DPout is the pressure taken from the DHMZ XML service. The panel in
Figure 4 shows the symbol
p (sea level), which represents the pressure at sea level. Based on the measured pressure values of
BPin measured by the BME sensor,
BPsea was calculated using the following barometric formula which can be used to adjust pressure to sea level:
where
P0 is the pressure at sea level (in hPa or mbar),
P is the measured pressure at altitude
,
is the altitude above sea level (in meters),
T is the temperature at altitude in Kelvin,
L is the temperature gradient (approximately 0.0065 K/m),
g is gravitational acceleration (9.8 m/s
2),
M is the molar mass of Earth’s air (0.0289644 kg/mol), and
R is the universal gas constant (8.31447 J/(mol·K)).
2.3.3. Measurement of Heat Flux Q and Thermal Conductivity U-Values
The values of heat flux
Q and thermal conductivity
U, important to evaluate possible change in wall moisture, were calculated based on the measured data using the TBM method. The sensors in the MTBM1 precisely measure the temperature on the wall surface as well as the temperature in the laboratory room where the measurement is being made. The formula for
Q is
Twall and
Tin are directly measured using the MTBM1 sensor, whereas
Rsi is estimated based on standard reference values for building materials, typically taken as 0.13 m
2K/W [
15]. Since
Rsi is not measured but assumed, it may deviate considerably from real-world conditions, potentially impacting the accuracy of the results. The direction of heat flow and surface temperatures affects the
Rsi value. Since the system measures surface temperatures,
Rsi could be calculated using them, not just simplified values.
The heat flux,
Q, is then included in the
U-value calculation, which also includes data from additional DHMZ sensors measuring Tout.
3. Results
To calculate the altitude of the measurement point, the initial altitude of the ground floor of FER was taken, which is 122 m. Since the measurement was made on the third floor, and the height of one floor is approximately 3.3 m, it follows that the altitude of the third floor is approximately 129 m.
Figure 5 shows that the
BPin values (blue) are consistently lower than the other lines, which is expected given that this is unadjusted internal pressure and does not refer to sea level.
BPsea (green) closely follows the trends of
DPout (red), indicating an effective correction for altitude. All external pressure values gradually increase throughout the day, reaching a peak around the 1000th minute, and then gradually decrease towards the end of the measurement window.
The following
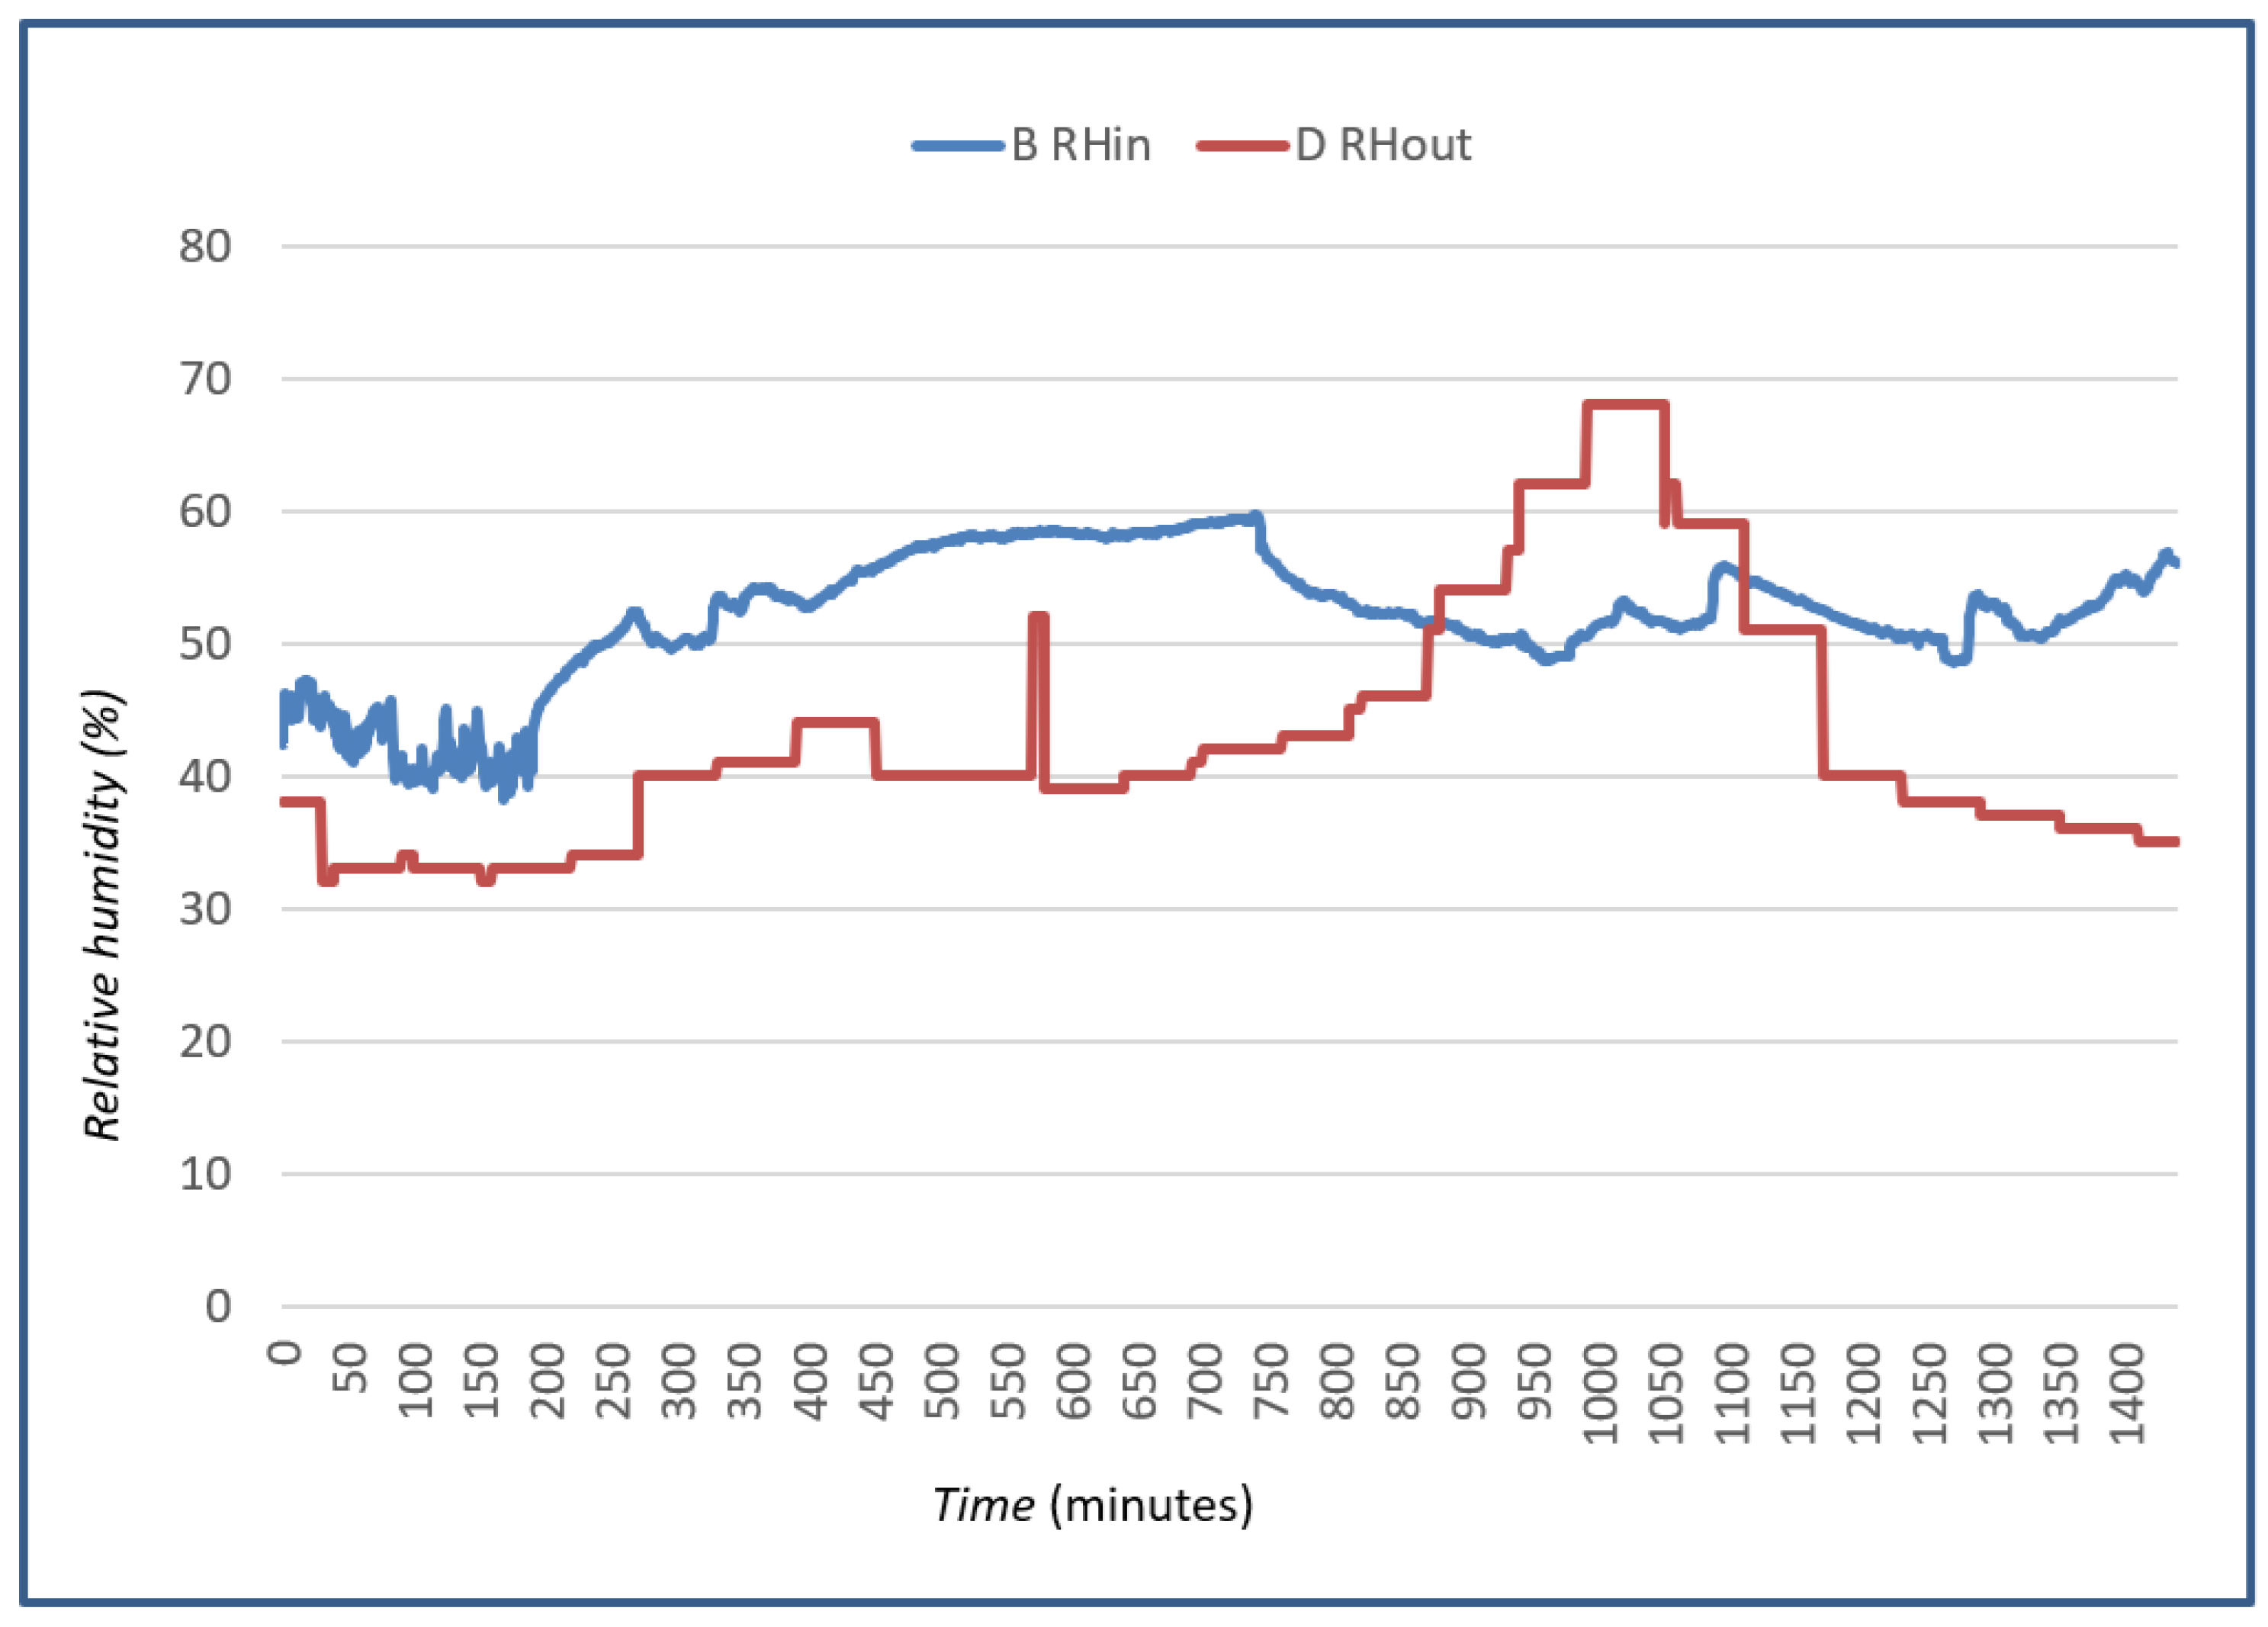
Figure 6 shows the relative humidity of the air. As in the previous figure, the measured humidity in the indoor space is compared with the relative humidity measured at the meteorological stations of individual services. The figure shows a time series plot of relative humidity (%) against time (min) for one day. The blue line (
BRHin) represents indoor relative humidity measured by the BME280 sensor, while the red line (
DRHout) represents outdoor relative humidity data taken from the DHMZ service. Indoor humidity fluctuates between 45 and 60%, showing gradual increases and decreases over time, while outdoor humidity remains lower overall, with step-like changes and a distinct peak around 1000–1100 min. The comparison highlights the differences between indoor and outdoor humidity dynamics over the measured period. Relatively stable indoor humidity indicates good environmental control, but periods of rising humidity can be relevant for dew point and condensation estimates.
While the indoor environment remains relatively stable, fluctuations in outdoor humidity from DHMZ highlight the potential impact of outdoor weather conditions on indoor air quality and moisture control. This comparison supports a broader analysis related to condensation risk, thermal comfort, and building envelope performance. Also, anomalies or deviations in the data occur due to the distance of the meteorological stations that perform measurements for the DHMZ service.
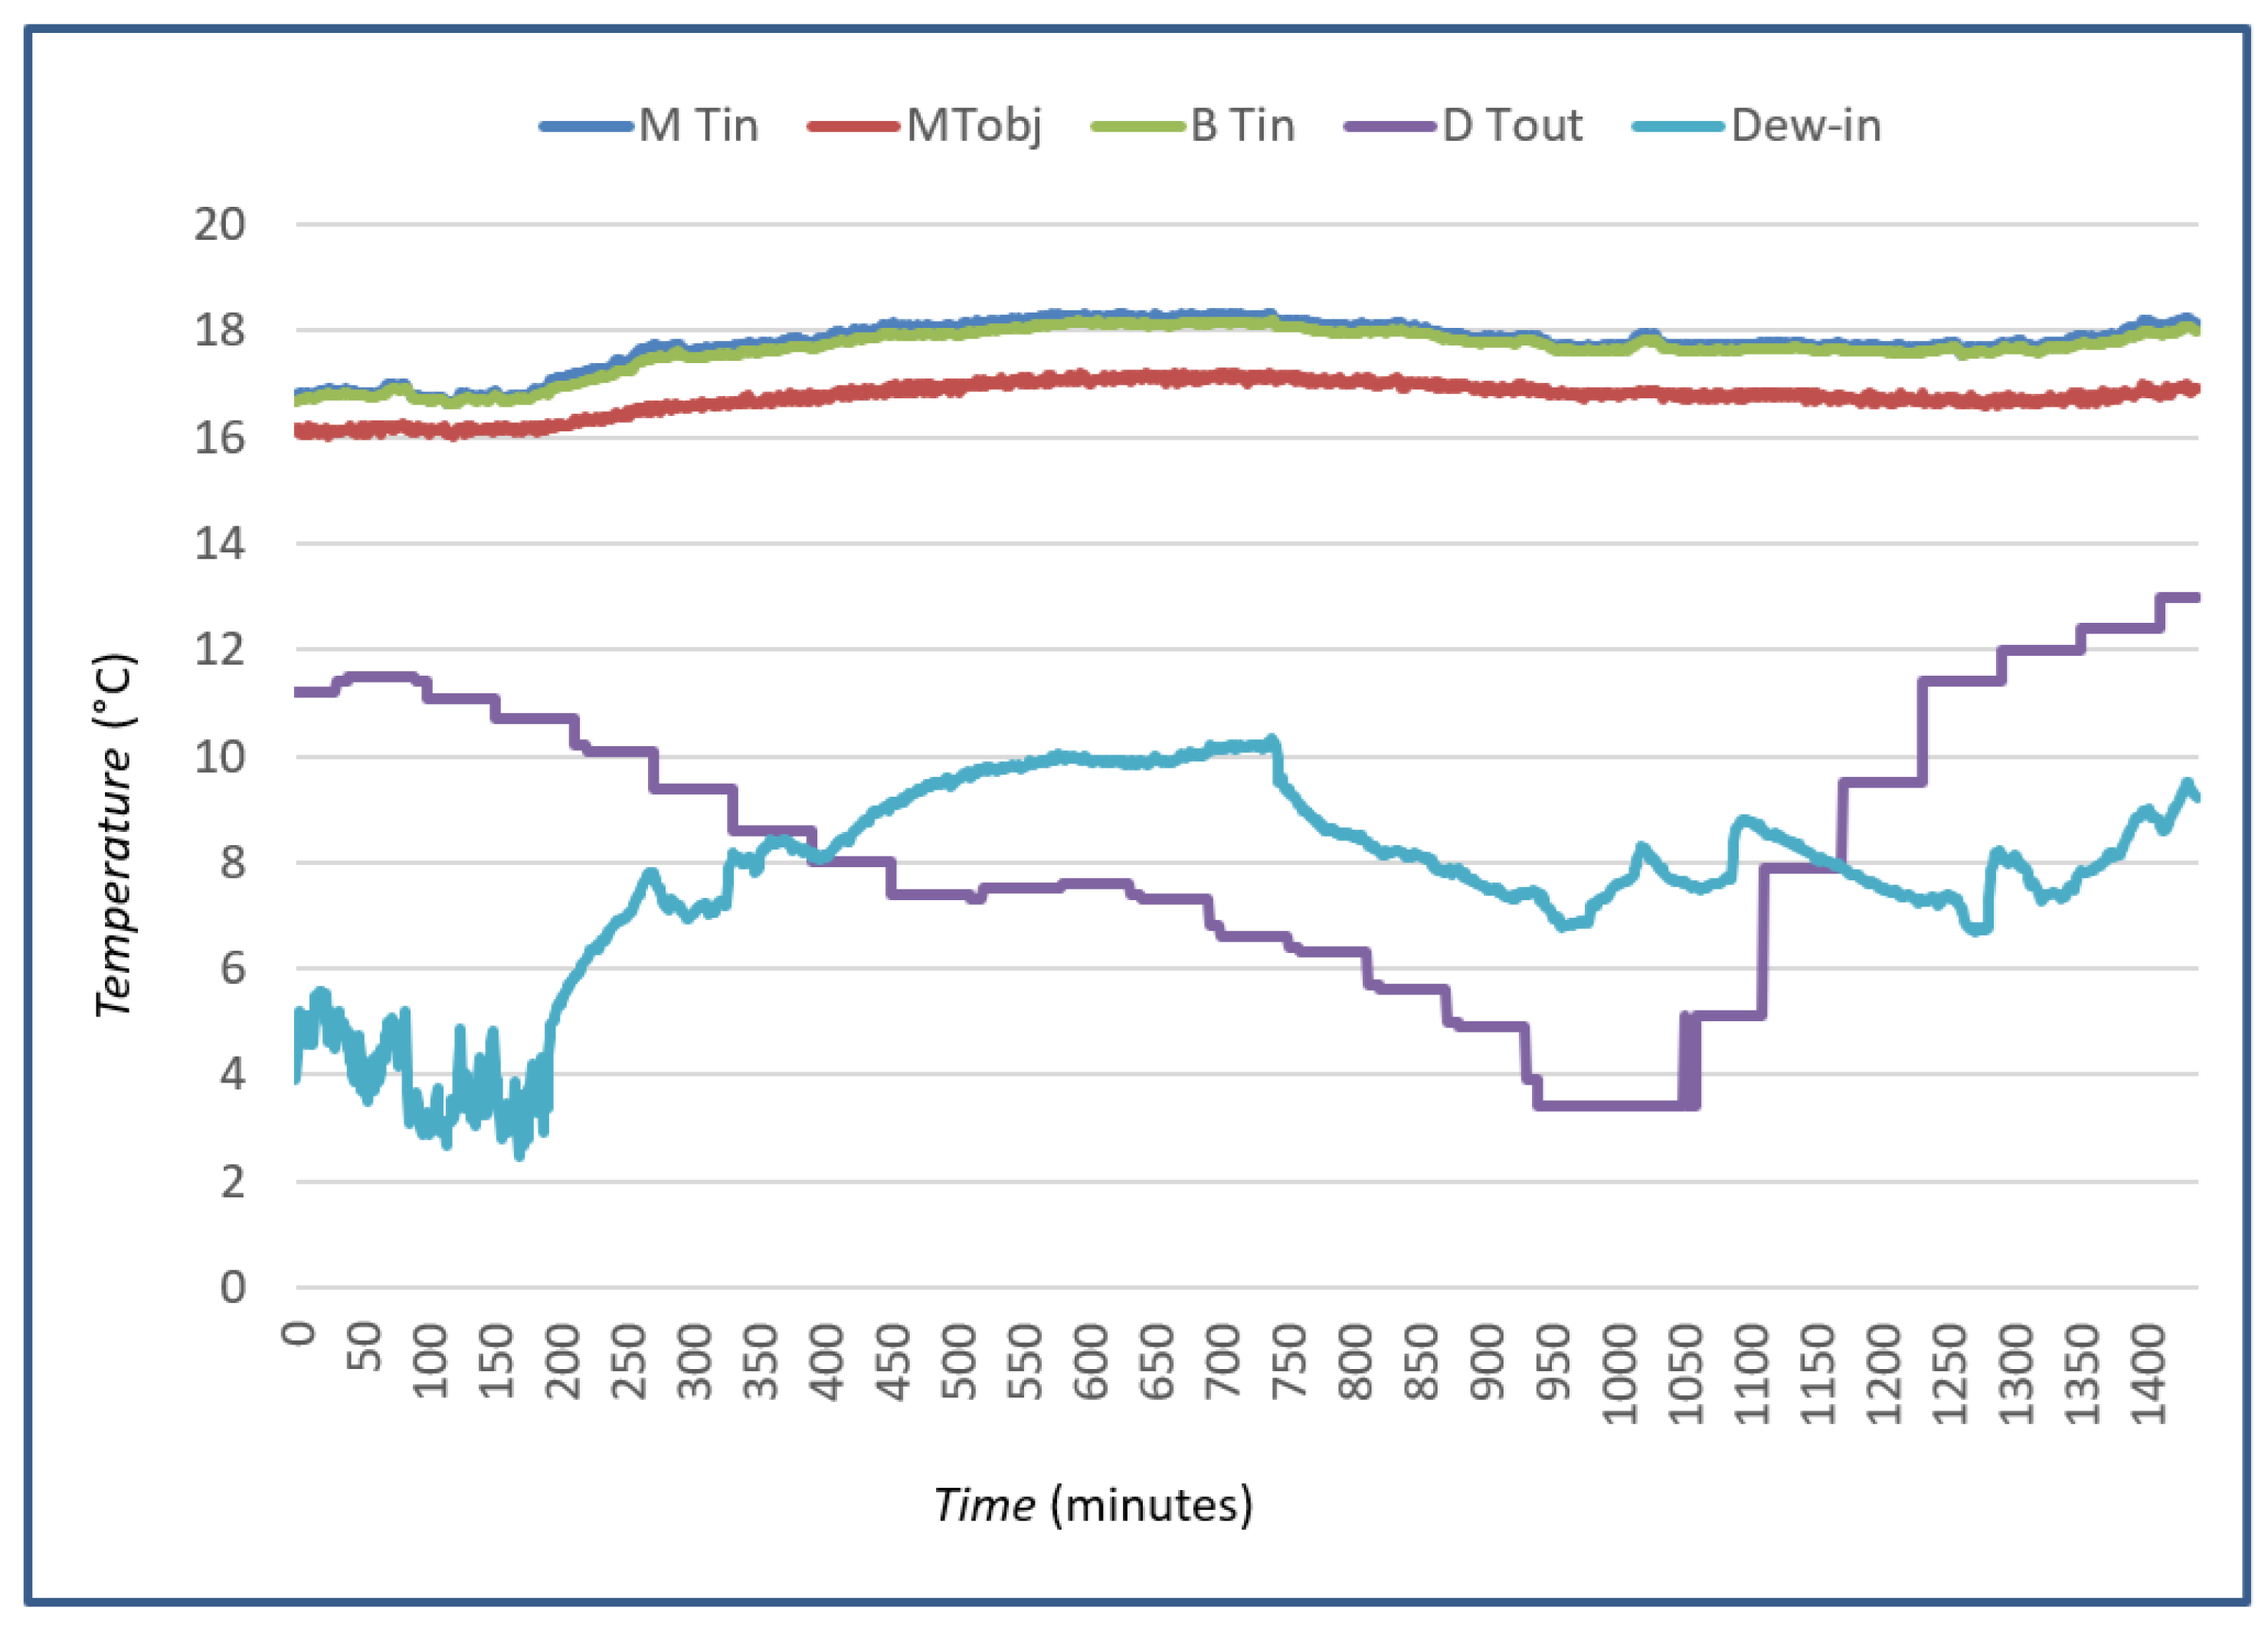
Figure 7 shows the measured temperatures. The temperatures were measured by two sensors in the MTBM1 module as follows:
MTin (blue) and
MTobj (red) are the temperatures measured by the MLX90614 and refer to the temperatures in the laboratory and the temperature on the wall surface.
BTin (green) is the temperature measured by the BME280.
DTout (purple) is the temperature taken from the DHMZ, considered as outdoor temperature.
The figure presents temperature variations over time (minutes) measured by different sensors. The indoor air temperatures BTin, as well as the wall surface temperature MTobj, remain relatively stable between 16 and 18 °C throughout the measurement period. The outdoor temperature DTout obtained from DHMZ shows more fluctuations, ranging between 4 and 12 °C, with distinct drops and rises.
The dew point temperature indoors (Dew-in) follows a variable pattern, generally ranging from 3 to 10 °C, and shows closer correspondence with outdoor conditions. The dew point starts at around 5 °C, drops slightly, and then fluctuates throughout the day. It tracks below the indoor temperatures, as expected, since the dew point depends on the relative humidity. The dew point remains well below the wall and laboratory temperature, indicating that there is no immediate risk of condensation.
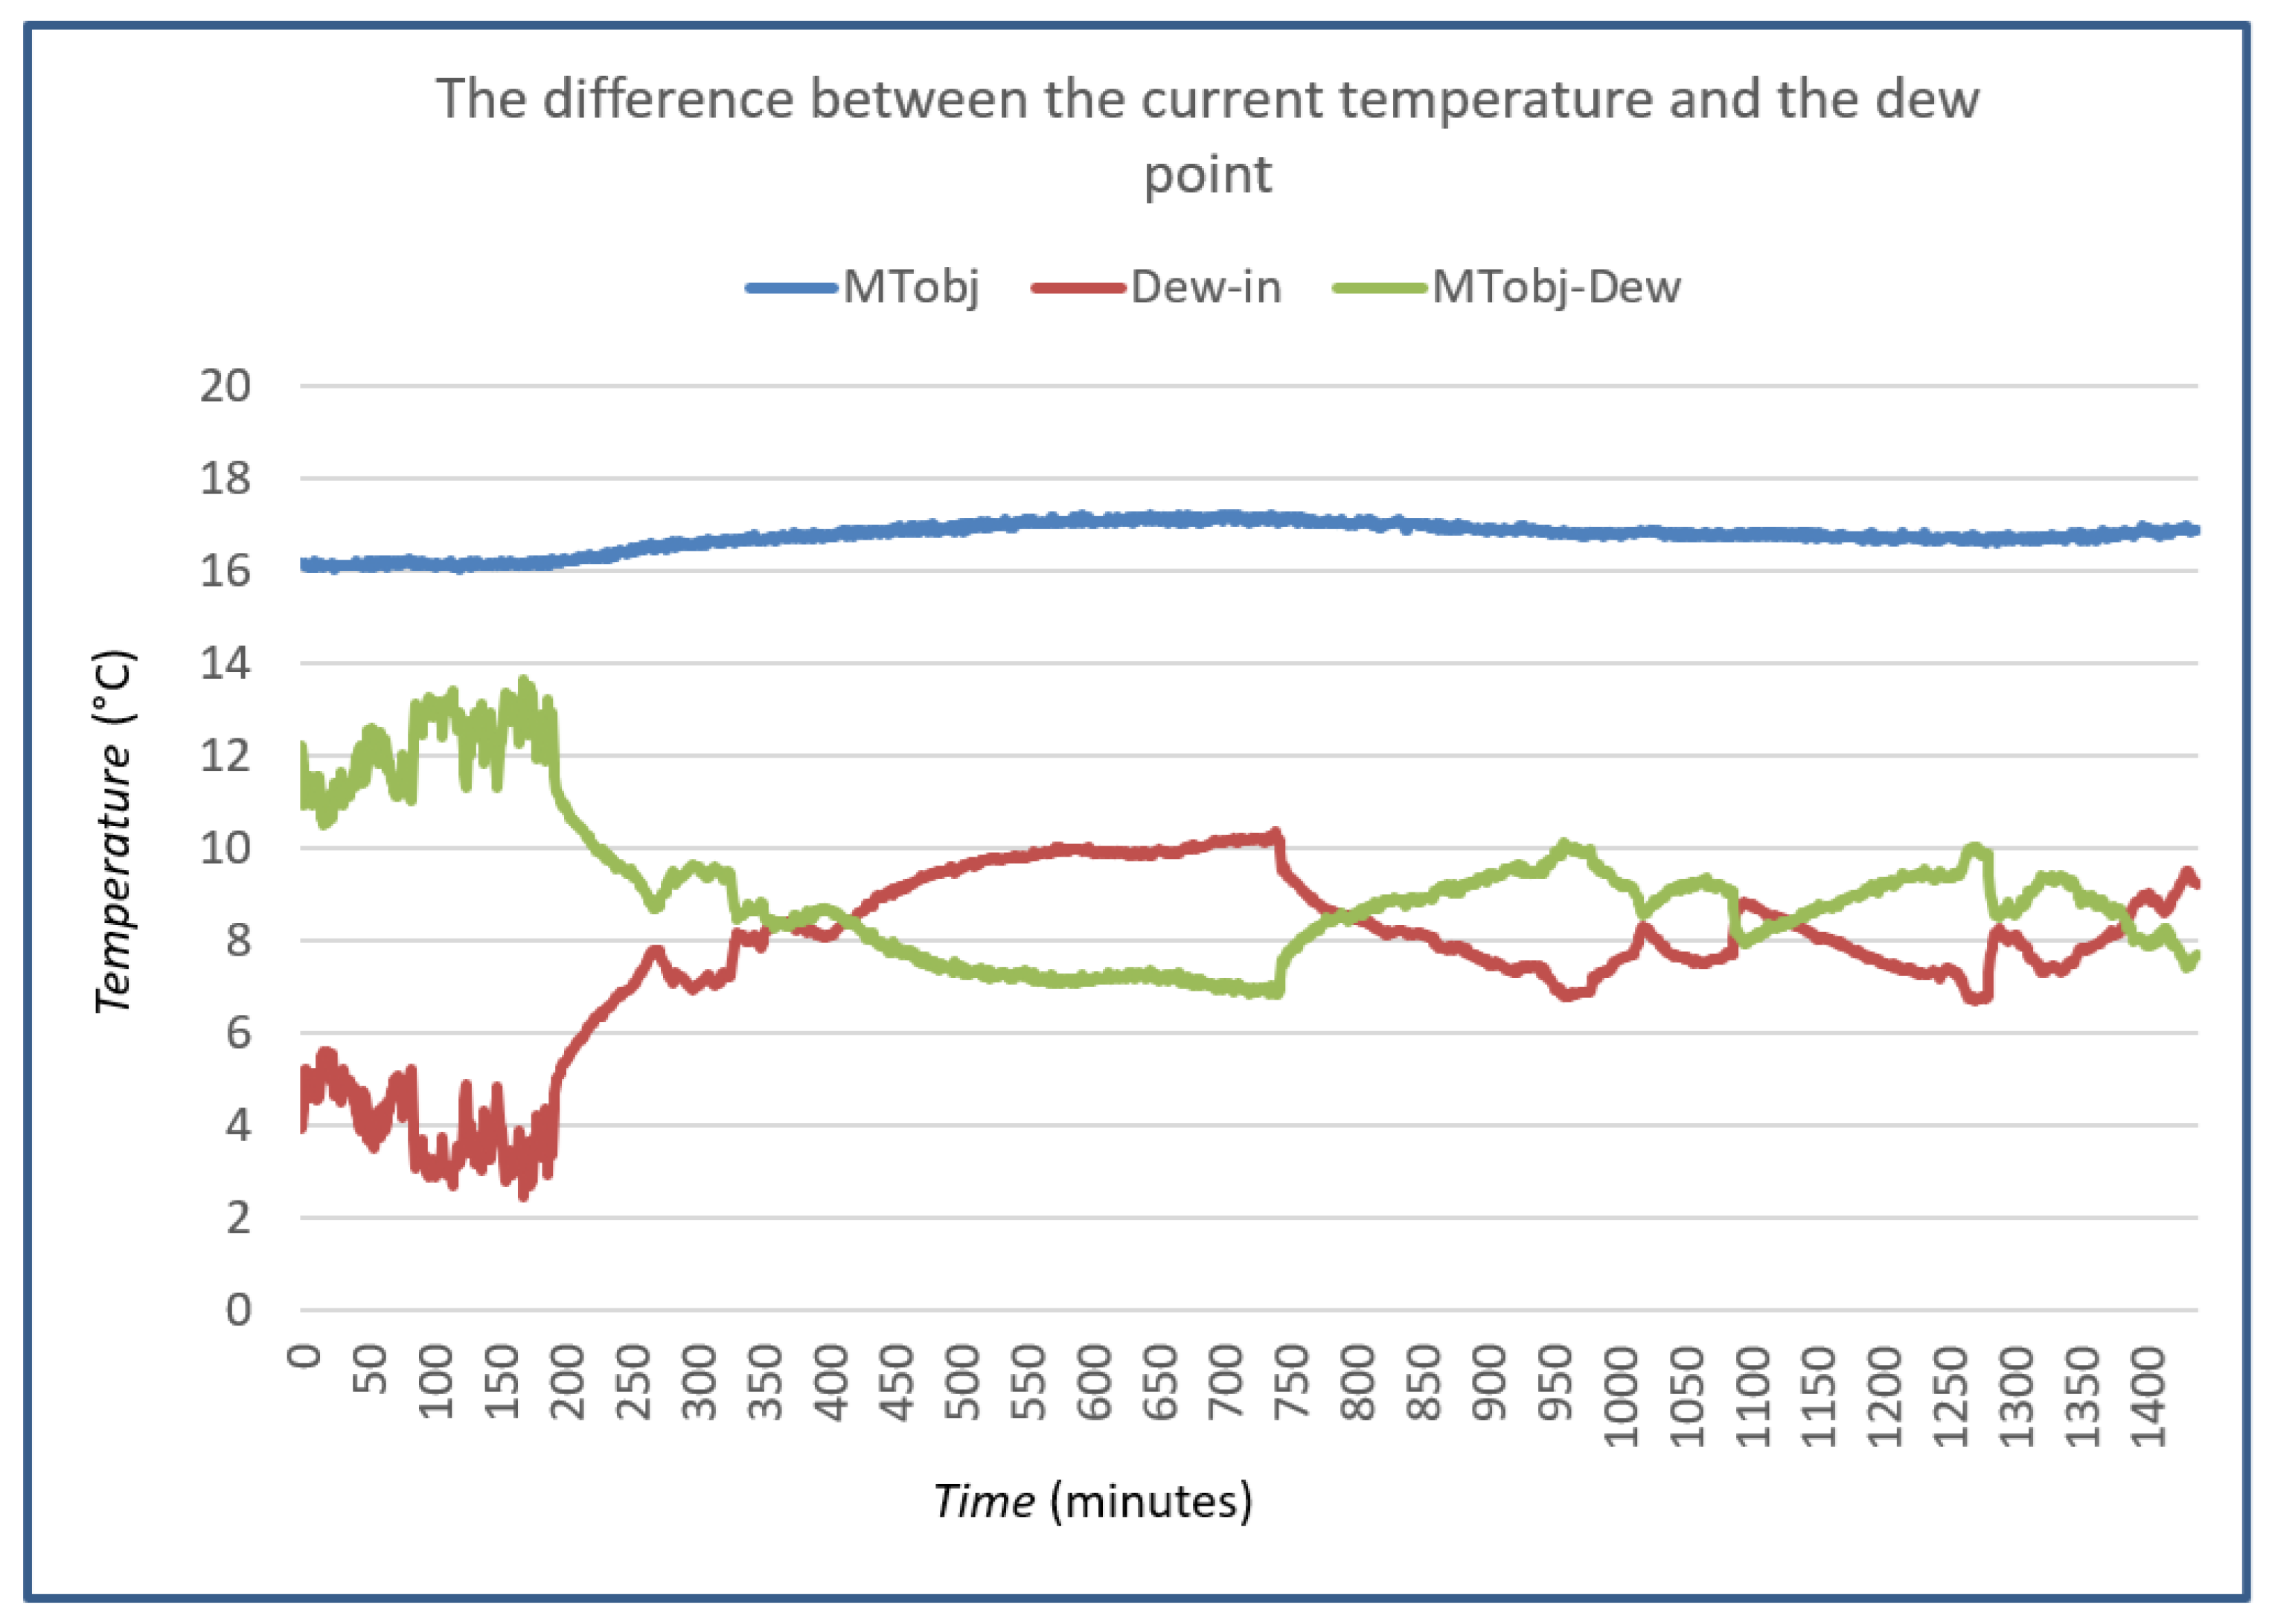
Figure 8 shows the relationship between the dew point, the current temperature on the wall, and the difference between their temperatures.
The relationship between the dew point, the current wall temperature, and the difference in their temperatures was measured over a full day (24 h), i.e., the time on the diagram starts at 00 h and 00 min.
Figure 8 shows that the greatest risk of condensation occurs in the period from 500 to 700 min, i.e., between 8:30 and 11:30, when this difference is smallest. Temperature oscillations are most often caused by the actions of people in the room, making coffee, people staying, entering and exiting, opening and closing windows…
The wall surface temperature MTobj (blue) remains relatively stable between 16 °C and 17.5 °C throughout the period, indicating a consistent indoor thermal condition. The dew point (red) starts at around 5 °C, rises slowly to 9–10 °C, and then fluctuates within this range. The dew point reflects the indoor humidity level, increasing as the humidity increases. The temperature difference (MTobj–Dew, green) represents how close the dew point is to wall surface temperature. This visualization supports real-time condensation monitoring in indoor environments, essential for preventing mold, structural damage, or thermal inefficiencies.
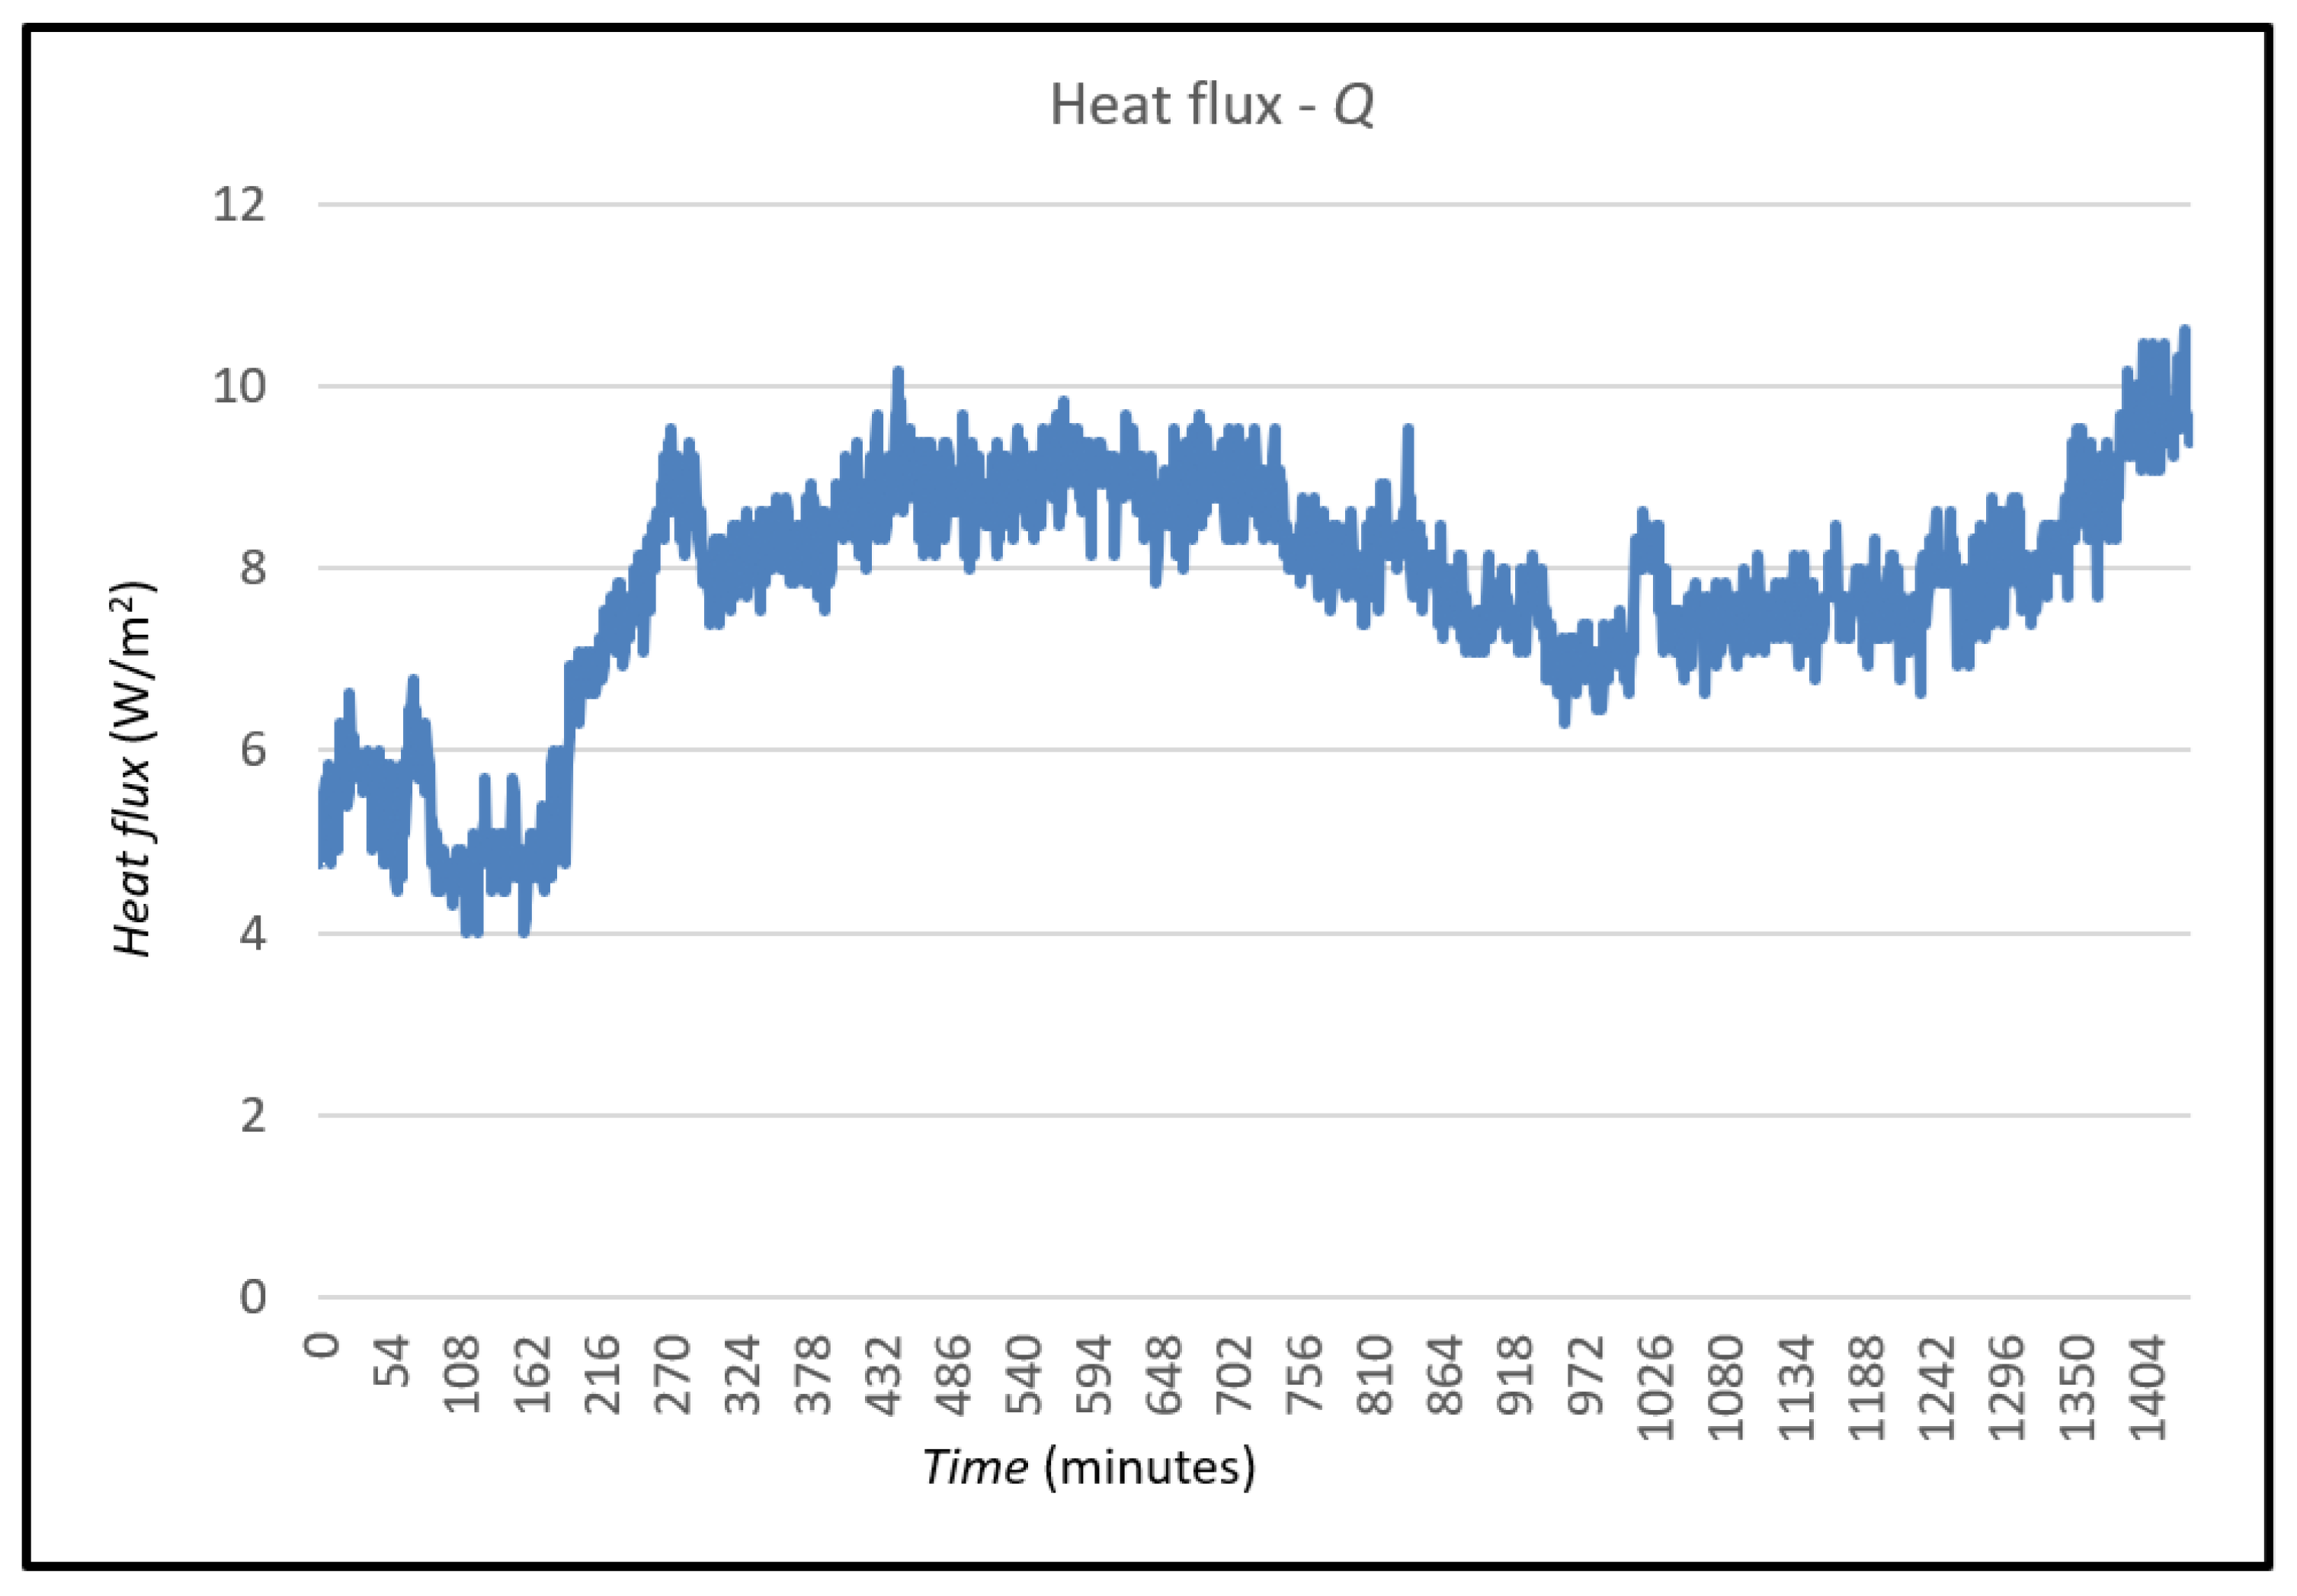
The heat flux values calculated based on MTBM1 data are shown in
Figure 9.
The heat flux starts between 5 and 7 W/m2, showing moderate fluctuations. This corresponds to the early morning when thermal gradients are lower. In the middle period (300–800 min), a noticeable increase in the heat flux is observed, reaching a peak around 10 W/m2, indicating a higher heat exchange, probably due to increasing differences in indoor and outdoor temperatures or increased solar radiation (e.g., daylight hours). In the late period (800–1400 min), the heat flux slightly decreases and stabilizes around 7–8 W/m2, with some minor oscillations. Towards the end it starts to increase again, reaching values above 10 W/m2, possibly indicating a renewed external influence (e.g., evening sun).
Based on the measured heat flow data with the MTBM1 module, the thermal conductivity—U-value—was calculated.
To evaluate the TBM method from the MTBM1 module, it was evaluated using the HFM and another TBM method from previous research.
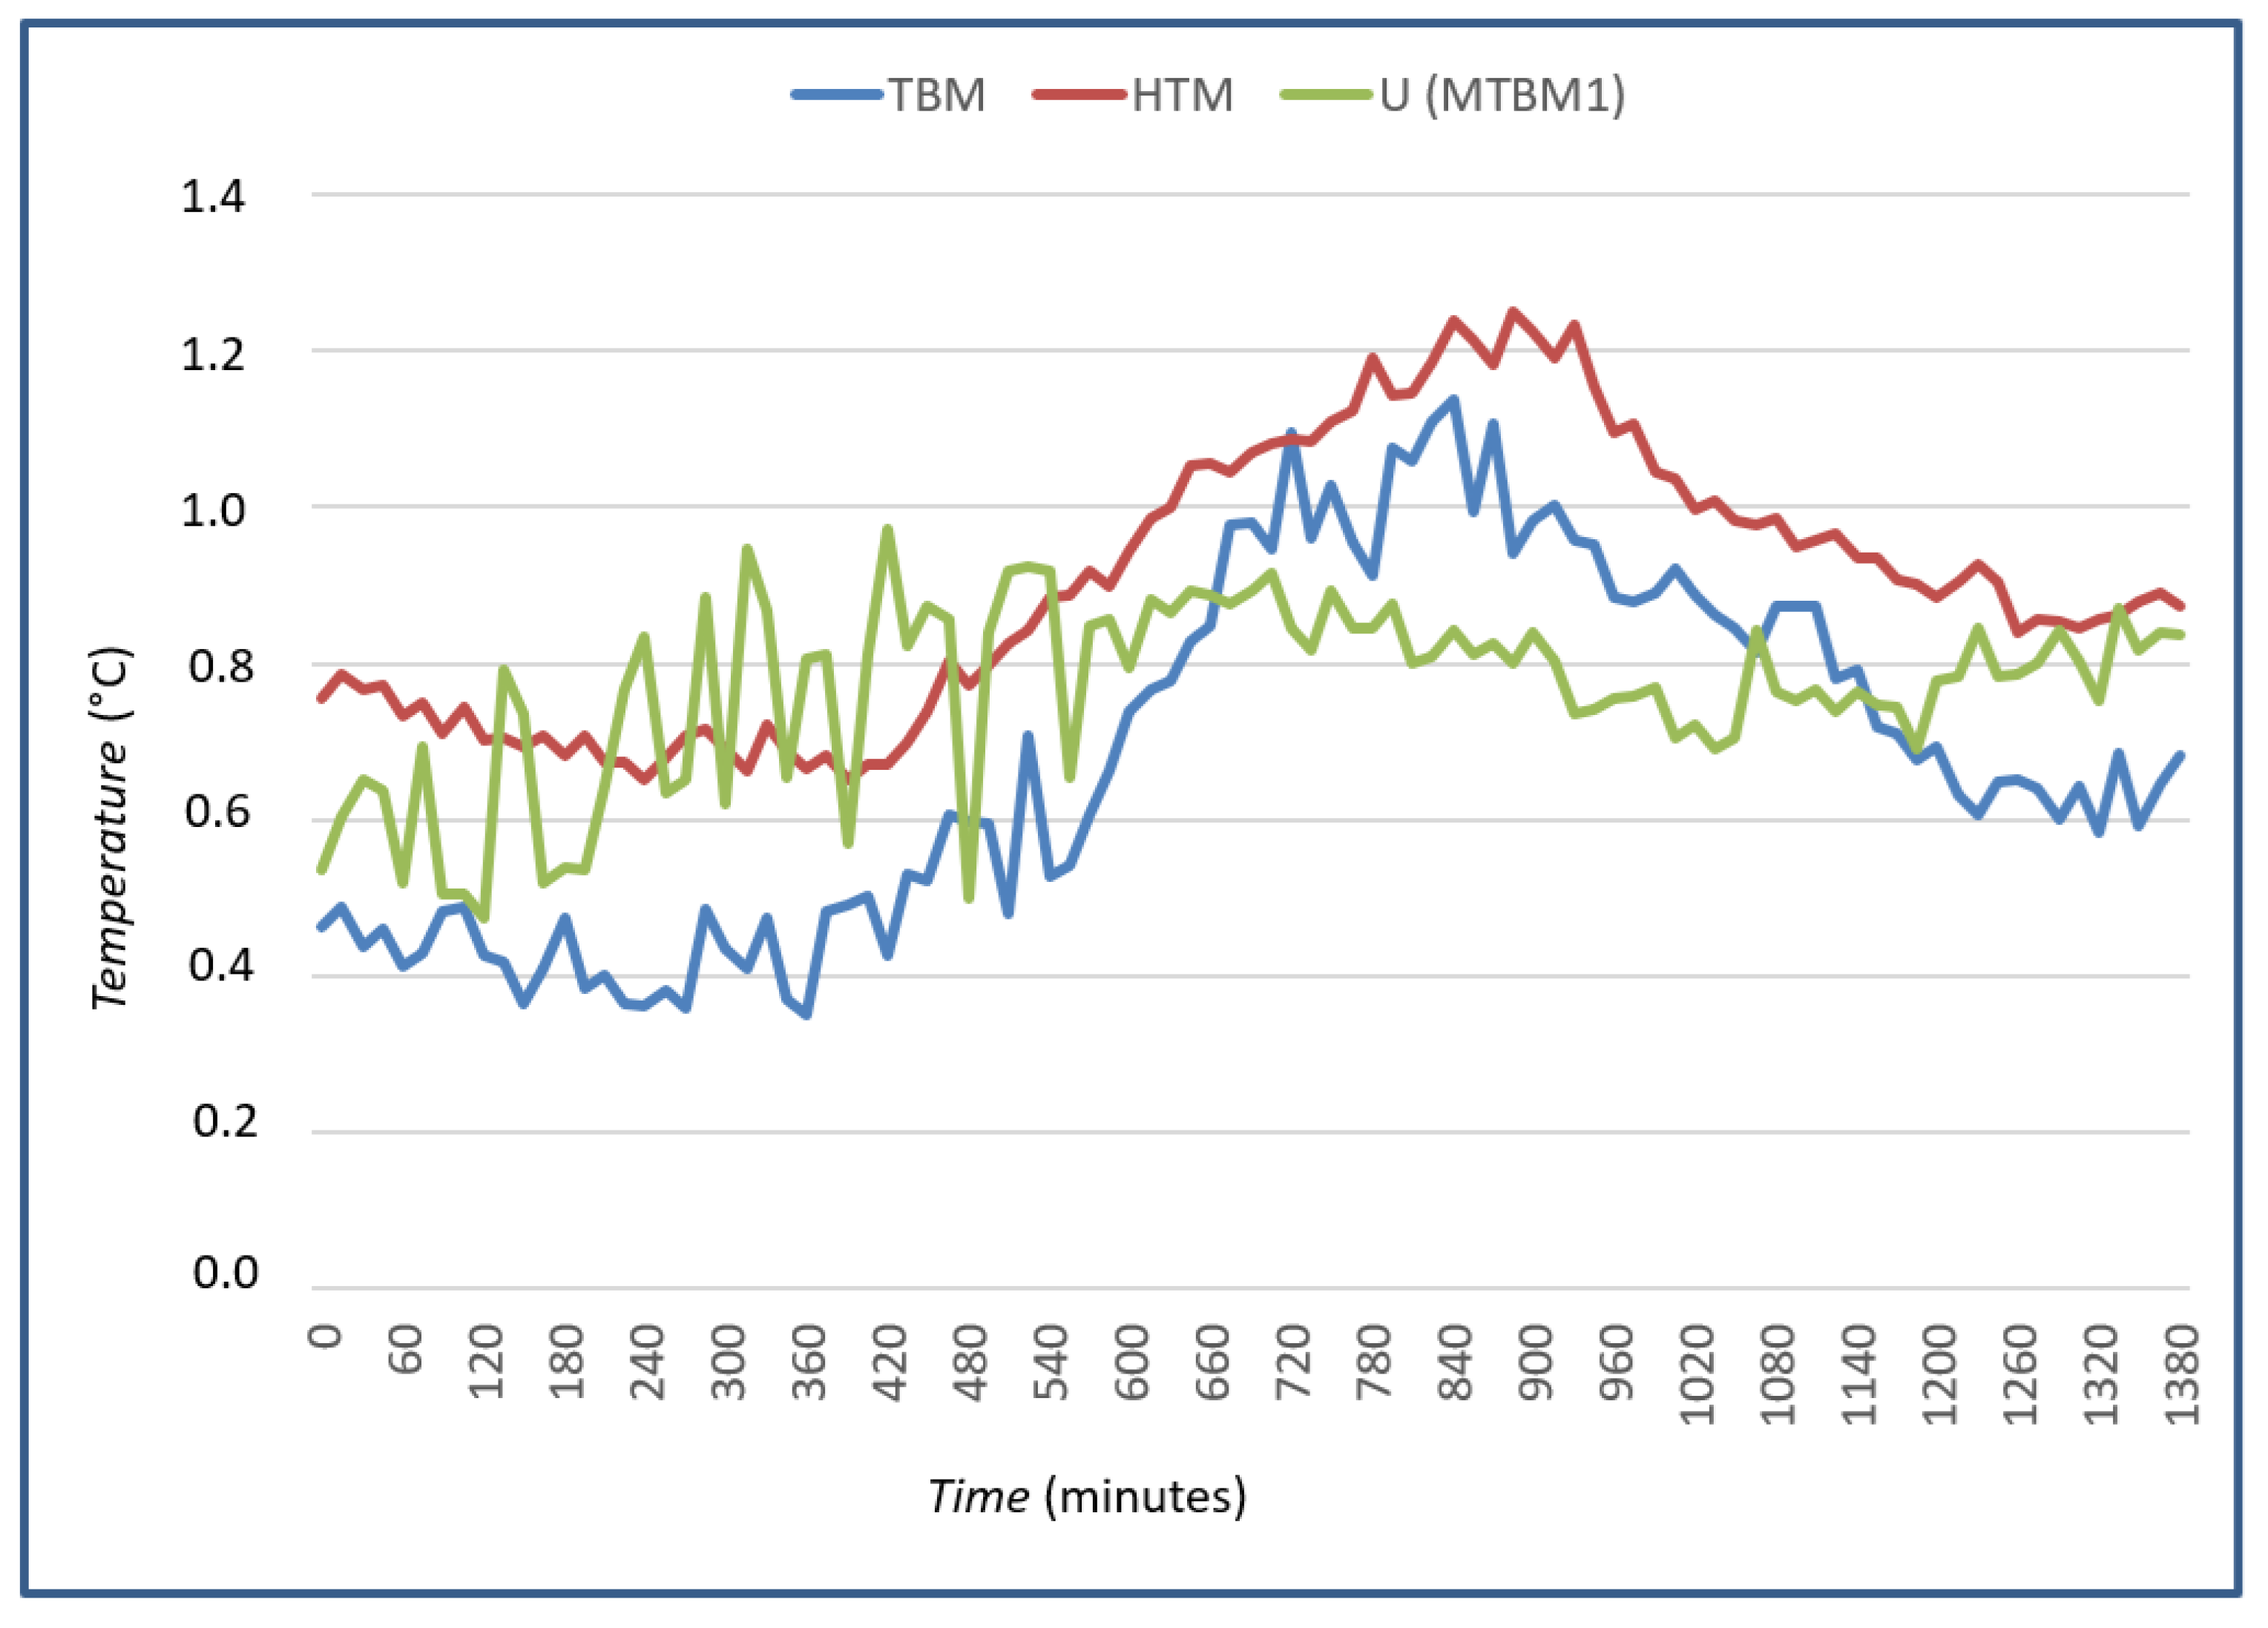
Figure 10 shows the
U-value data measured by two different methods, HFM and TBM, in accordance with the ISO 6946:2017. The
U-value measurement was performed at the same location as with the mobile module. The Huxeflux heat flux plate HFP01, (Hukseflux Sensors, Delft, The Netherlands) [
29] and thermistor NTC EC95F103V were used. The measurement system and measurement process are described in our previous paper [
18]. Measurements were made on the same wall, at the same time, and under the same conditions.
The data indicates that the average U-value over a 24-h measurement period is 0.69 W/m2K using the TBM method, and 0.94 W/m2K using the HFM.
For the same wall, a theoretical U-value has been estimated based on standard thermal resistance values of its components: 0.04 m2K/W for the external air layer, 0.75 m2K/W for the combined external and internal plaster layers (2 cm), 0.77 m2K/W for the brick layer (28 cm), 0.035 m2K/W for the thermal insulation (5 cm), and 0.13 m2K/W for the internal air layer. Considering the thicknesses of these layers, the total thermal resistance is calculated to be 2.013 m2K/W, resulting in a theoretical U-value of 0.497 W/m2K.
From the measurements with the mobile module, the mean U-value is 0.79 W/m2K. From the above, it was concluded that the measured mean value of the mobile module is 12 percent higher than the mean U-value measured with the TBM method, and 15 percent lower than the mean U-value measured with the HFM.
The causes of uncertainty with the indoor surface temperature sensor (BME280) are potential influence from wall heat gradients or air currents. Mounting directly on the surface may introduce thermal inertia delays. Typical accuracy for the BME280 temperature channel is ±0.5 °C.
The outdoor temperature, which is measured from a DHMZ station, usually has an accuracy of ±0.2 to ±0.5 °C, but the main problem is representativeness, not just the accuracy of the instrument. The question is whether the spatial mismatch between the sensor location and the DHMZ station (which is not the case here) introduces systematic uncertainty depending on weather conditions and distance.
If the measured thermal resistance of the wall [
18] is 2.013 m
2K/W and the temperature difference is 9 °C, the combined uncertainty in temperature difference can be calculated as ≈ 0.5385 °C and relative uncertainty ≈ 0.0598 = 5.98%.
4. Conclusions
This paper presents the development and validation of a mobile measurement module designed for the precise determination of thermal properties of building elements, with a special focus on the measurement of pressure, temperature, and humidity to evaluate the danger of condensation on the walls as well as the possible moisture inside the walls. The system enables the calculation of relevant thermodynamic parameters such as the exact dew point temperature, heat flux, and U-value, which is demonstrated in this case on the external wall of the FER laboratory.
The system is mobile, modular, and precise, which enables simple application without the need for PC or laptop. The components have been carefully selected regarding high precision, availability, and value ease of application, relying on the latest technologies in the field of thermal properties measurement. The control system chosen supports multi-channel measurements, high sampling frequency, and flexible control of the duration and dynamics of measurement campaigns.
The results obtained using the MTBM1 module were compared with those from the reference TBM and HFM methods, as well as with theoretical values calculated in accordance with the ISO 6946:2017 standard. The MTBM1 module eliminates the need for expensive heat flow sensors and specialized equipment, ensuring high cost-effectiveness without compromising measurement quality.
The developed mobile system represents an efficient, accurate and economical tool for in situ characterization of thermal properties of building structures and has significant potential for application in scientific research, energy audits, and energy efficiency monitoring of buildings for condensation and moisture as well as thermal transmittance measurements. It also serves as a prototype for early condensation warning systems that can be applied to residential as well as industrial buildings.
Nevertheless, certain limitations of the current experimental setup should be noted. The initial validation was performed on a single wall type under specific environmental conditions, which may not capture the full range of variability found in real-world applications. To further improve the general applicability of the system, future studies will involve its testing on different wall materials such as concrete, brick, and wood, and under a variety of climate conditions. This will help assess its robustness and adaptability in diverse building environments and geographic regions, ensuring broader usability and relevance for real-world applications.
