Article

A Multipurpose and Efficient Evaluation Method of Phase Characteristics in a Quiet Zone for a Defocused Feed in a Compact Antenna Test Range

1
School of Information and Communication Engineering, Communication University of China, Beijing 100024, China
2
National Key Laboratory of Scattering and Radiation, Beijing 100854, China
*
Author to whom correspondence should be addressed.
Electronics 2025, 14(22), 4389; https://doi.org/10.3390/electronics14224389
Submission received: 16 October 2025 / Revised: 4 November 2025 / Accepted: 8 November 2025 / Published: 10 November 2025
(This article belongs to the Special Issue AI-Driven IoT: Beyond Connectivity, Toward Intelligence)

Abstract

A compact antenna test range (CATR) is an important testing facility for assessing electromagnetic characteristics of various wireless devices, in which the degradation of phase performance in a quiet zone due to feed defocusing severely affects the assessment results, especially for a higher frequency and longer defocusing distance. Based on the theory of geometric optics (GO), this paper precisely derives analytical formulas of phase characteristics in a quiet zone for a defocused feed in a commonly used CATR, such as that underpinned by single paraboloid and dual parabolic cylinders. The proposed evaluation method is of high accuracy and efficiency for higher frequencies and can be used in various scenarios with excellent results. The discrepancy between the formula calculation results and software simulation results of the machining accuracy tolerance for feeds and their turntable remains below 1°, demonstrating much better performance than the state of the art. Meanwhile, the deviation of the formula calculation results from the preset position of the feed stays within 1 mm, effectively supporting the confirmation of the feed position for equivalent pitch tests.

1. Introduction

Since its inception in the 1970s [1], compact range technology has been extensively employed for measuring the radiation or scattering characteristics of multiple electromagnetic devices. Particularly with the formulation and improvement of relevant industry standards in recent years [2,3], there has been a notable surge in the demand for testing 5G millimeter-wave equipment [4,5,6,7,8,9], presenting higher requirements on the amplitude and phase performance within the quiet zone.
Feed defocusing, as the term implies, denotes a phenomenon where the phase center of the feed deviates from the focus of the reflector in a CATR. Small-scale feed defocusing exerts minimal impact on the amplitude characteristics within the quiet zone, while it degrades the phase characteristics significantly, with the extent of degradation being proportional to the operating frequency [9]. As early as 1990 [10], researchers observed that feed defocusing affected the phase characteristics in the quiet zone, while the underlying mechanism was not explored. Subsequently, other scholars confirmed the coherent relationship between the feed defocusing distance and the phase taper of the quiet zone through measured data; however, the theoretical foundation was still lacking [11]. Considering the research above, this article conducts a comprehensive investigation into the precise formulas of phase characteristics in a quiet zone for a defocused feed, which not only enhances the phase quality and test accuracy within quiet zone but also offers potential applications in specific scenarios.
Based on the spatial positional relationship between the incident ray and reflected ray relative to the reflection point in GO, this article accurately presents the precise formulas containing various parameters of single paraboloid and dual parabolic cylinders, respectively. Under certain given conditions, the desired unknown parameters can be obtained by using 1stOpt 9.0 to optimize the formulas. Through comparative analysis between the formula calculation results and software simulation results, the feasibility and efficiency of the evaluation method presented in this article are demonstrated. Depending on different input conditions, this evaluation method can be used to estimate the machining accuracy tolerances and guide the on-site installation for feeds and their turntable and to confirm the feed position for equivalent pitch tests of the target under measurement.
The paper is organized as follows: Section 1 provides a brief introduction to the application background and current research progress of the method presented in this article. Section 2 derives the precise formulas of phase characteristics in a quiet zone for a defocused feed, as detailed in the Appendix. Section 3 presents various cases for application of the evaluation method. Finally, Section 4 provides the conclusion.

2. Precise Formula Derivation of Phase Characteristics in a Quiet Zone for a Defocused Feed

2.1. Single Paraboloid

The position definition of a single paraboloid in the Cartesian coordinate system is shown in Figure 1.
As shown in Figure 1, the analytical equation of a single paraboloid can be written as
x 2 + y 2 = 4 F z .
Given that the coordinate of focus in the compact range is (0, 0, F), the phase center after defocusing is located at (x0, y0, z0), the coordinate of the reflection point of the incident ray on the paraboloid is (x1, y1, z1), and the coordinate of the point to be observed in the quiet zone is (x, y, z).
Based on the spatial positional relationship between the incident ray and reflected ray relative to reflection point in GO, formulas containing all the parameters above can be derived as Equations (A1)–(A4) in Appendix A.

2.2. Dual Parabolic Cylinders

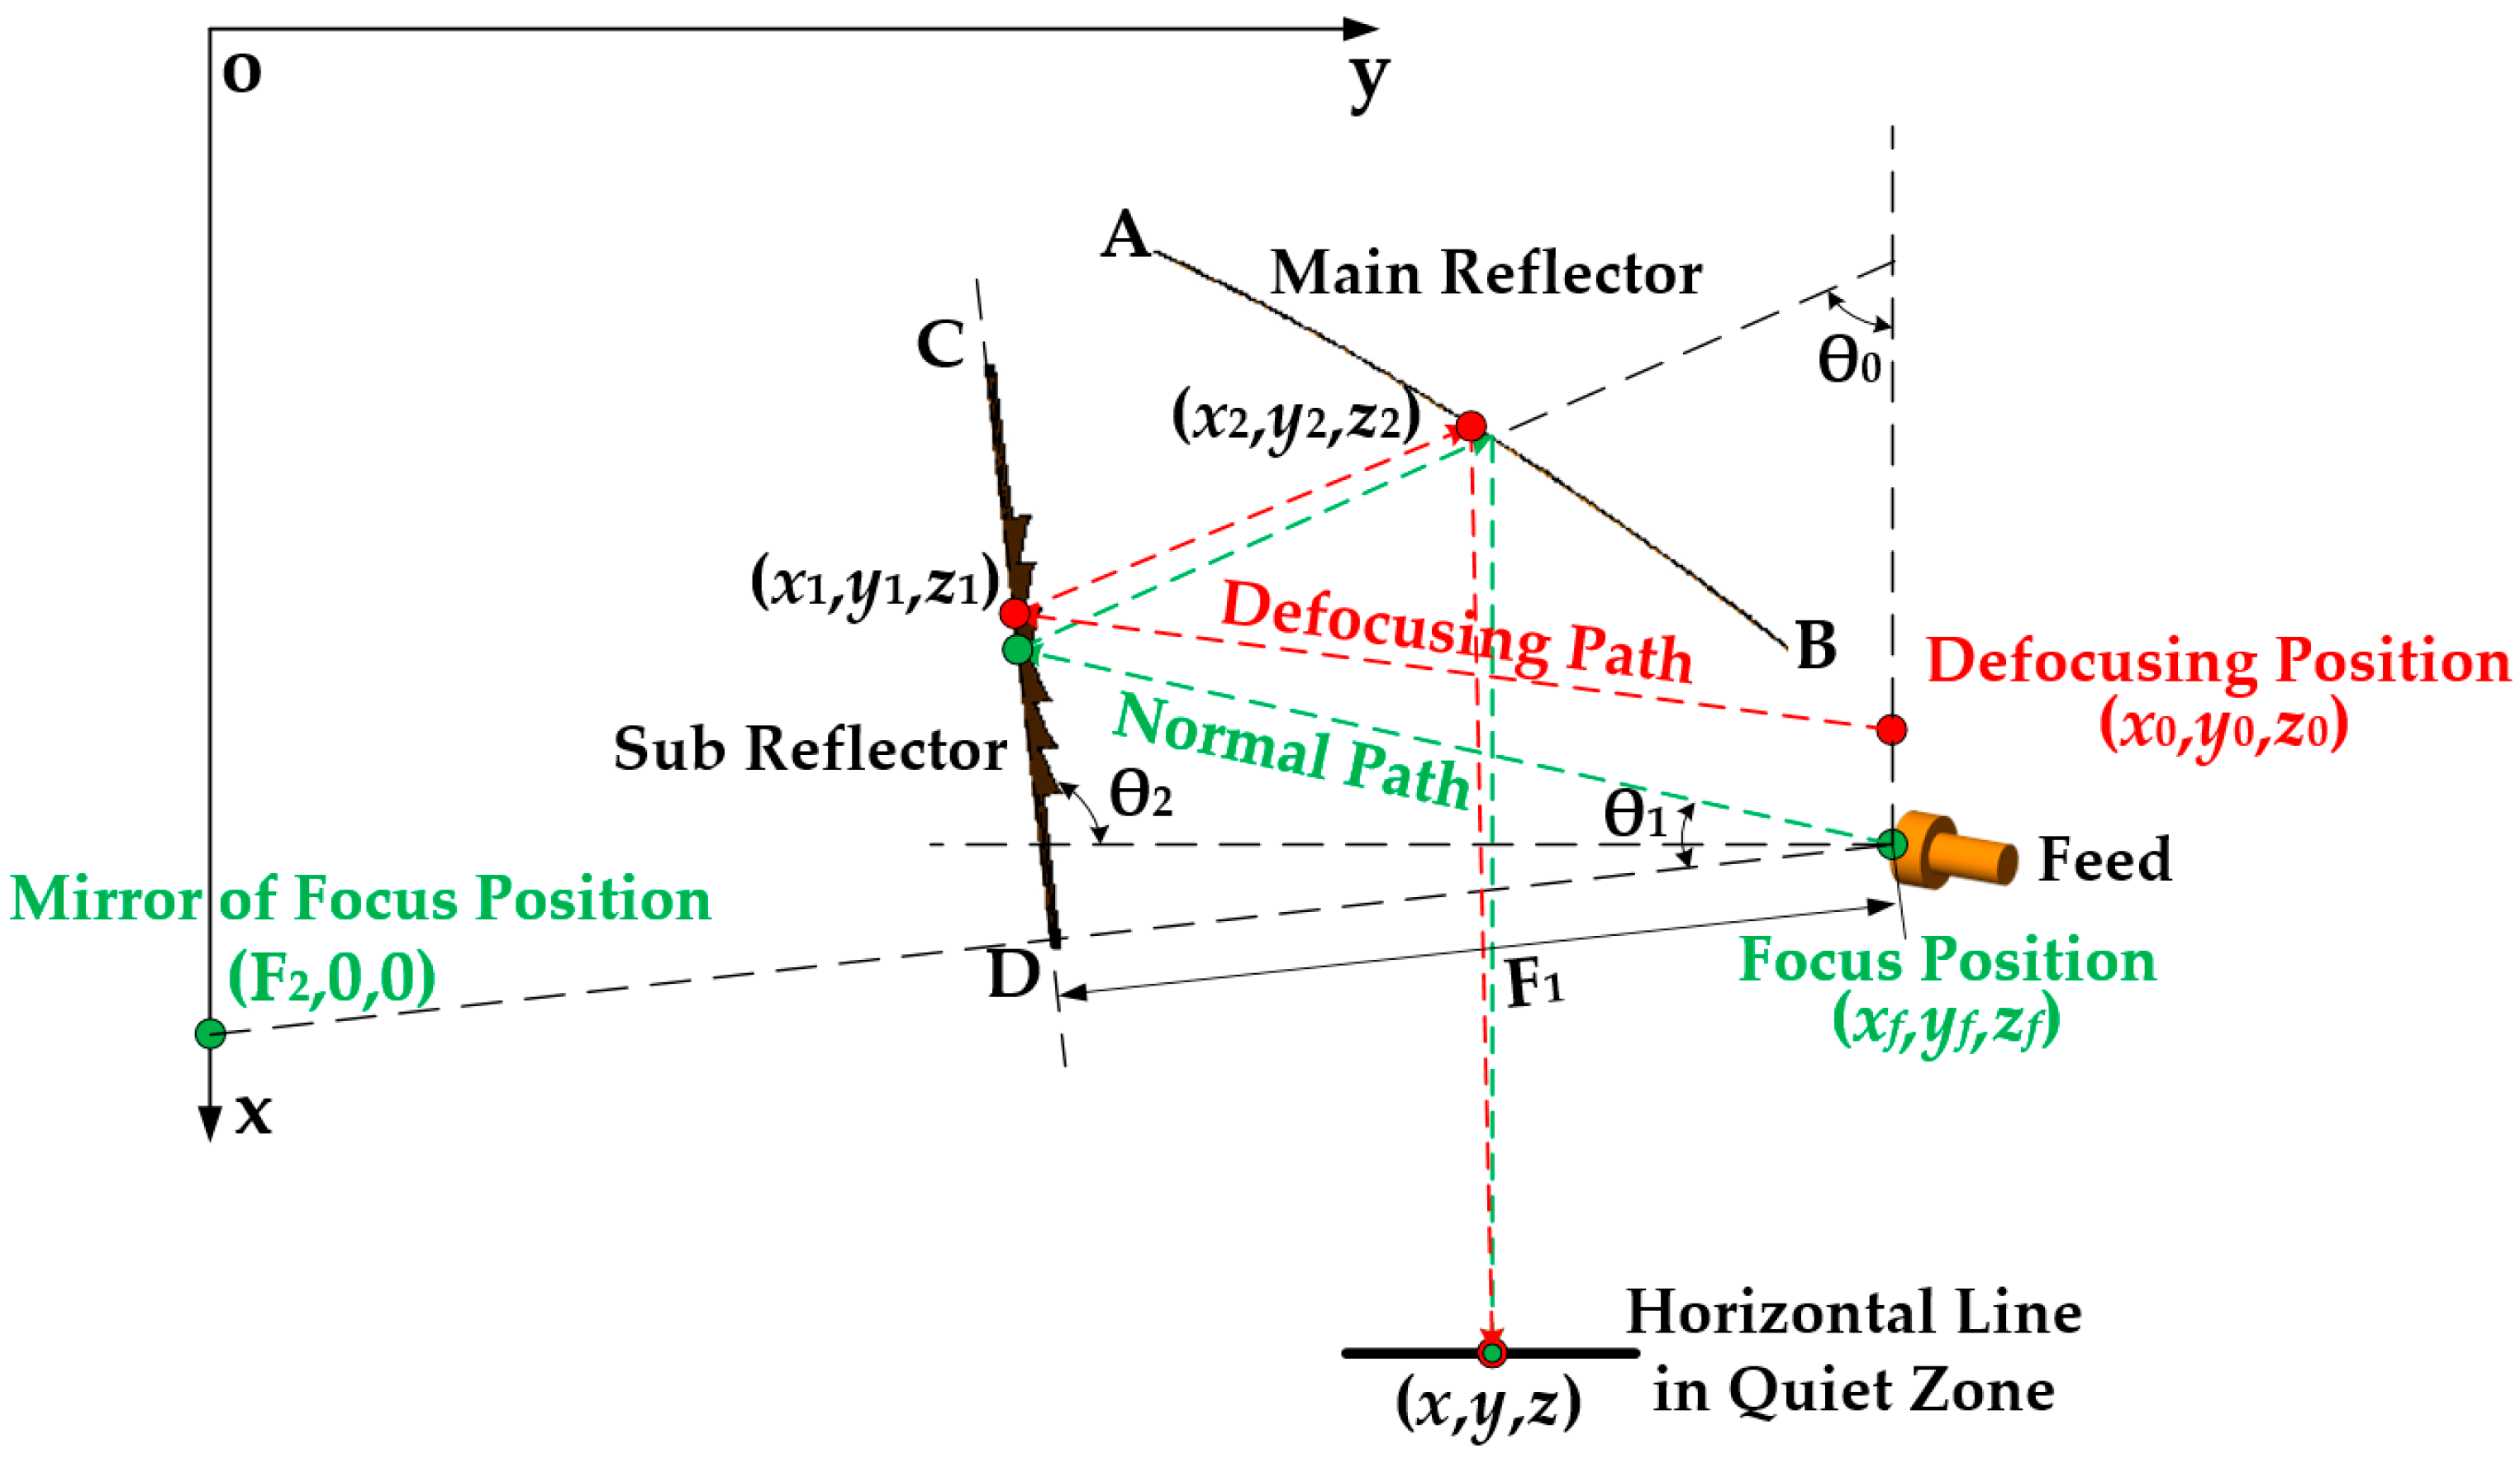
The position definition of dual parabolic cylinders in the Cartesian coordinate system is shown in Figure 2.
As shown in Figure 2, the analytical equation of the sub reflector in a dual parabolic cylinders system can be written as
z 2 = 4 F 1 c o s θ 2 x + s i n θ 2 y F 1 F 2 c o s θ 2 .
The analytical equation of the main reflector in the same dual parabolic cylinders system can be written as
y 2 = 4 F 2 x .
Given that the focal lengths of the sub reflector and main reflector are F1 and F2, respectively, the deflection angle of the main reflector is θ0, the deflection angle of the sub reflector is θ2, the offset angle of the feed is θ1, the coordinate of focus in the compact range is (xf, yf, zf) = (F2 + 2F1cos θ2, 2F1sin θ2, 0), the phase center after defocusing is located at (x0, y0, z0), the initial reflection point coordinate of the initial incident ray on the sub reflector is (x1, y1, z1), the secondary reflection point coordinate of the initial reflection ray on the main reflector is (x2, y2, z2), and the coordinate of the point to be observed in the quiet zone is (x, y, z).
Firstly, based on the spatial positional relationship between the initial incident ray and the initial reflection ray relative to the initial reflection point in GO, formulas containing all parameters except (x, y, z) can be derived as Equations (A5)–(A8) in Appendix A.
Then, based on the spatial positional relationship between the initial reflection ray and the secondary reflection ray relative to the secondary reflection point in GO, formulas containing all parameters except (x0, y0, z0) can be derived as Equations (A9)–(A12) in Appendix A.
Finally, considering that θ1 corresponds to the central ray of the reflectors, the central coordinate of the sub reflector is (F2 + F1cos θ2 − F1tan θ1 sin θ2, F1sin θ2 + F1tan θ1 cos θ2, 0), and the central coordinate of the main reflector is (F2 − 2F2/(1 + cos θ0) cos θ0, 2F2/(1 + cos θ0) sin θ0, 0). Assuming that the arc length of the main reflector is AB, and the width of the sub reflector is CD, based on the positional relationship between the endpoints of the main reflector and sub reflector, the value range of x1, y1, x2, and y2 can be derived as Equations (A13)–(A16) in Appendix A.
Based on strict formula derivation, the formulas involve no approximation of geometric optics and can be applied to any frequency, especially for higher frequencies. But when the feed defocusing distance becomes large enough or the feed position deviates significantly, the position of the reflection point will exceed the reflector area, resulting in no solution. Therefore, the formulas are applicable to small-scale feed defocusing only.
As the derivation progress involves various constants and coordinates, even slight deviations in the reflector shape or coordinate values could cause a significant change in relevant parameters for a higher frequency and longer defocusing distance, there is an urgent need for high-precision machining, a stable environment, and high-accuracy measuring equipment to obtain perfect reflector surface and accurate measurement points, thereby improving the validity of this method under real-world conditions.

3. Application of the Evaluation Method Based on Precise Formulas

To facilitate verification of the calculations, the following conventions are made for the parameters of single paraboloid and dual parabolic cylinders:
  • For a single paraboloid, the focal length is F = 8.483 m, the central coordinate of the quiet zone is (xm, ym, zm) = (0 m, 3.35 m, 11.85 m), the size of the quiet zone is 2.5 m, the horizontal range on the central section of the quiet zone is [−1.25 m, 1.25 m], and the vertical range on the central section of the quiet zone is [2.1 m, 4.6 m] [12], as shown in Figure 1;
  • For dual parabolic cylinders, the focal lengths of the sub reflector and main reflector are F1 = 5.915 m and F2 = 7.02 m, respectively. The deflection angle of the main reflector is θ0 = 65°, the deflection angle of the sub reflector is θ2 = 96.5°, the offset angle of the feed is θ1 = 18.5°, the arc length of the main reflector is AB = 5.34 m, the width of the sub reflector is CD = 3.745 m, the central coordinate of the quiet zone is (xm, ym, zm) = (9.23 m, 8.945 m, 0 m), the size of the quiet zone is 2 m, the horizontal range on the central section of the quiet zone is [7.945 m, 9.945 m], and the vertical range on the central section of the quiet zone is [−1 m, 1 m], as shown in Figure 2;
  • The relationship between the phase response of the quiet zone and the distance of ray propagation can be expressed as [9]
    φ = k 180 ° π L = 360 ° L λ .
To prevent the phase response of the quiet zone from infinitely increasing with the distance of ray propagation, the absolute phase response is employed to assess the phase characteristics of the quiet zone. The specific expression can be formulated as follows:
φ = 360 ° L λ = 360 ° L m L λ ,
where Lm denotes the propagation distance of the ray along a normal path, L signifies the propagation distance of the ray along a defocusing path, and λ indicates the wavelength corresponding to the operating frequency;
4.
Given that coordinates in the Cartesian coordinate system consist of three components: x, y, and z, the feed defocusing value can also be decomposed into three components correspondingly. Any defocusing case can be synthesized from the three individual component cases above linearly, and the vector expression for any defocusing case can be written as
D F = D F x e ^ x + D F y e ^ y + D F z e ^ z ,
where DFx, DFy, and DFz represent the x, y, and z components of the feed defocusing value, respectively, while e ^ x , e ^ y , and e ^ z represent the unit vector in the x, y, and z directions of the Cartesian coordinate system, individually;
5.
All software simulations are conducted using the commercial software FEKO 2021.2, while all formula calculations are performed using the optimization software 1stOpt 9.0.

3.1. Prediction of Machining Accuracy Tolerances for Feeds and Their Turntable

During the processing of feeds and their turntable, due to limitations in equipment, technique, costs, and so on, there are inherently small deviations in processing accuracy, which is the fundamental cause of feed defocusing. In order to reasonably constrain the processing accuracy while reducing costs and increasing efficiency, it is necessary to effectively estimate the tolerance.

3.1.1. Single Paraboloid

Assuming an operating frequency of 10 GHz and a defocusing distance of D F = 0.01 m = λ/3, the absolute phase response of the quiet zone after defocusing is calculated by solving Equations (A1)–(A4) together with (5), while the parameters to be solved are x1, y1, and z1. In this case, Equation (5) needs to be refined, which can be expressed as follows:
φ = 360 ° λ L m L = 360 ° λ [ F + z m z 0 z 1 2 + y 0 y 1 2 + x 0 x 1 2 z z 1 2 + y y 1 2 + x x 1 2 ] .
According to different calculation objects, the parameter settings can be divided into the following:
  • When calculating the horizontal line on the central section, x = [xm − 1.25 m, xm + 1.25 m], y = ym, z = zm;
  • When calculating the vertical line on the central section, x = xm, y = [ym − 1.25 m, ym + 1.25 m], z = zm;
  • When calculating the central section, x = [xm − 1.25 m, xm + 1.25 m], y = [ym − 1.25 m, ym + 1.25 m], z = zm.
According to different feed defocusing positions, the parameter settings can be divided into the following:
  • When defocusing in the single x direction, DFx = x0 = D F , DFy = y0 = 0 m, DFz = z0 − F = 0 m;
  • When defocusing in the single y direction, DFx = x0 = 0 m, DFy = y0 = D F , DFz = z0 − F = 0 m;
  • When defocusing in the single z direction, DFx = x0 = 0 m, DFy = y0 = 0 m, DFz = z0 − F = D F .
To evaluate the accuracy of the formula calculation results, comparison and analysis with the software simulation results are conducted, as shown in Figure 3, Figure 4, Figure 5 and Figure 6.

3.1.2. Dual Parabolic Cylinders

Assuming an operating frequency of 10 GHz and a defocusing distance of D F = 0.01 m = λ/3, the absolute phase response of the quiet zone after defocusing is calculated by solving Equations (A5)–(A16) together with (5), while the parameters to be solved are x1, y1, z1, x2, y2, and z2. In this case, Equation (5) needs to be refined, which can be expressed as follows:
φ = 360 ° λ L m L = 360 ° λ [ F 2 + x m z 0 z 1 2 + y 0 y 1 2 + x 0 x 1 2 z 2 z 1 2 + y 2 y 1 2 + x 2 x 1 2 z z 2 2 + y y 2 2 + x x 2 2 ] .
According to different calculation objects, the parameter settings can be divided into the following:
  • When calculating the horizontal line on the central section, x = xm, y = [ym − 1 m, ym + 1 m], z = zm;
  • When calculating the vertical line on the central section, x = xm, y = ym, z = [zm − 1 m, zm + 1 m];
  • When calculating the central section, x = xm, y = [ym − 1 m, ym + 1 m], z = [zm − 1 m, zm + 1 m].
According to different feed defocusing positions, the parameter settings can be divided into the following:
  • When defocusing in the single x direction, DFx = x0xf = D F , DFy = y0yf = 0 m, DFz = z0zf = 0 m;
  • When defocusing in the single y direction, DFx = x0xf = 0 m, DFy = y0yf = D F , DFz = z0zf = 0 m;
  • When defocusing in the single z direction, DFx = x0xf = 0 m, DFy = y0yf = 0 m, DFz = z0zf = D F .
To evaluate the accuracy of the formula calculation results, comparison and analysis with the software simulation results are conducted, as shown in Figure 7, Figure 8, Figure 9 and Figure 10.
As is evident from Figure 3, Figure 4, Figure 5, Figure 7, Figure 8 and Figure 9, all the formula calculation results align remarkably well with the software simulation results, with deviations not exceeding 1°. When estimating the practical accuracy tolerance, the formula calculation method can be fully utilized for manual feed defocusing to determine the relationship between accuracy tolerance for feeds and their turntable and the phase response of the quiet zone. Furthermore, this formula-based calculation method does not necessitate precise modeling or consume significant computing resources, making it highly practical.
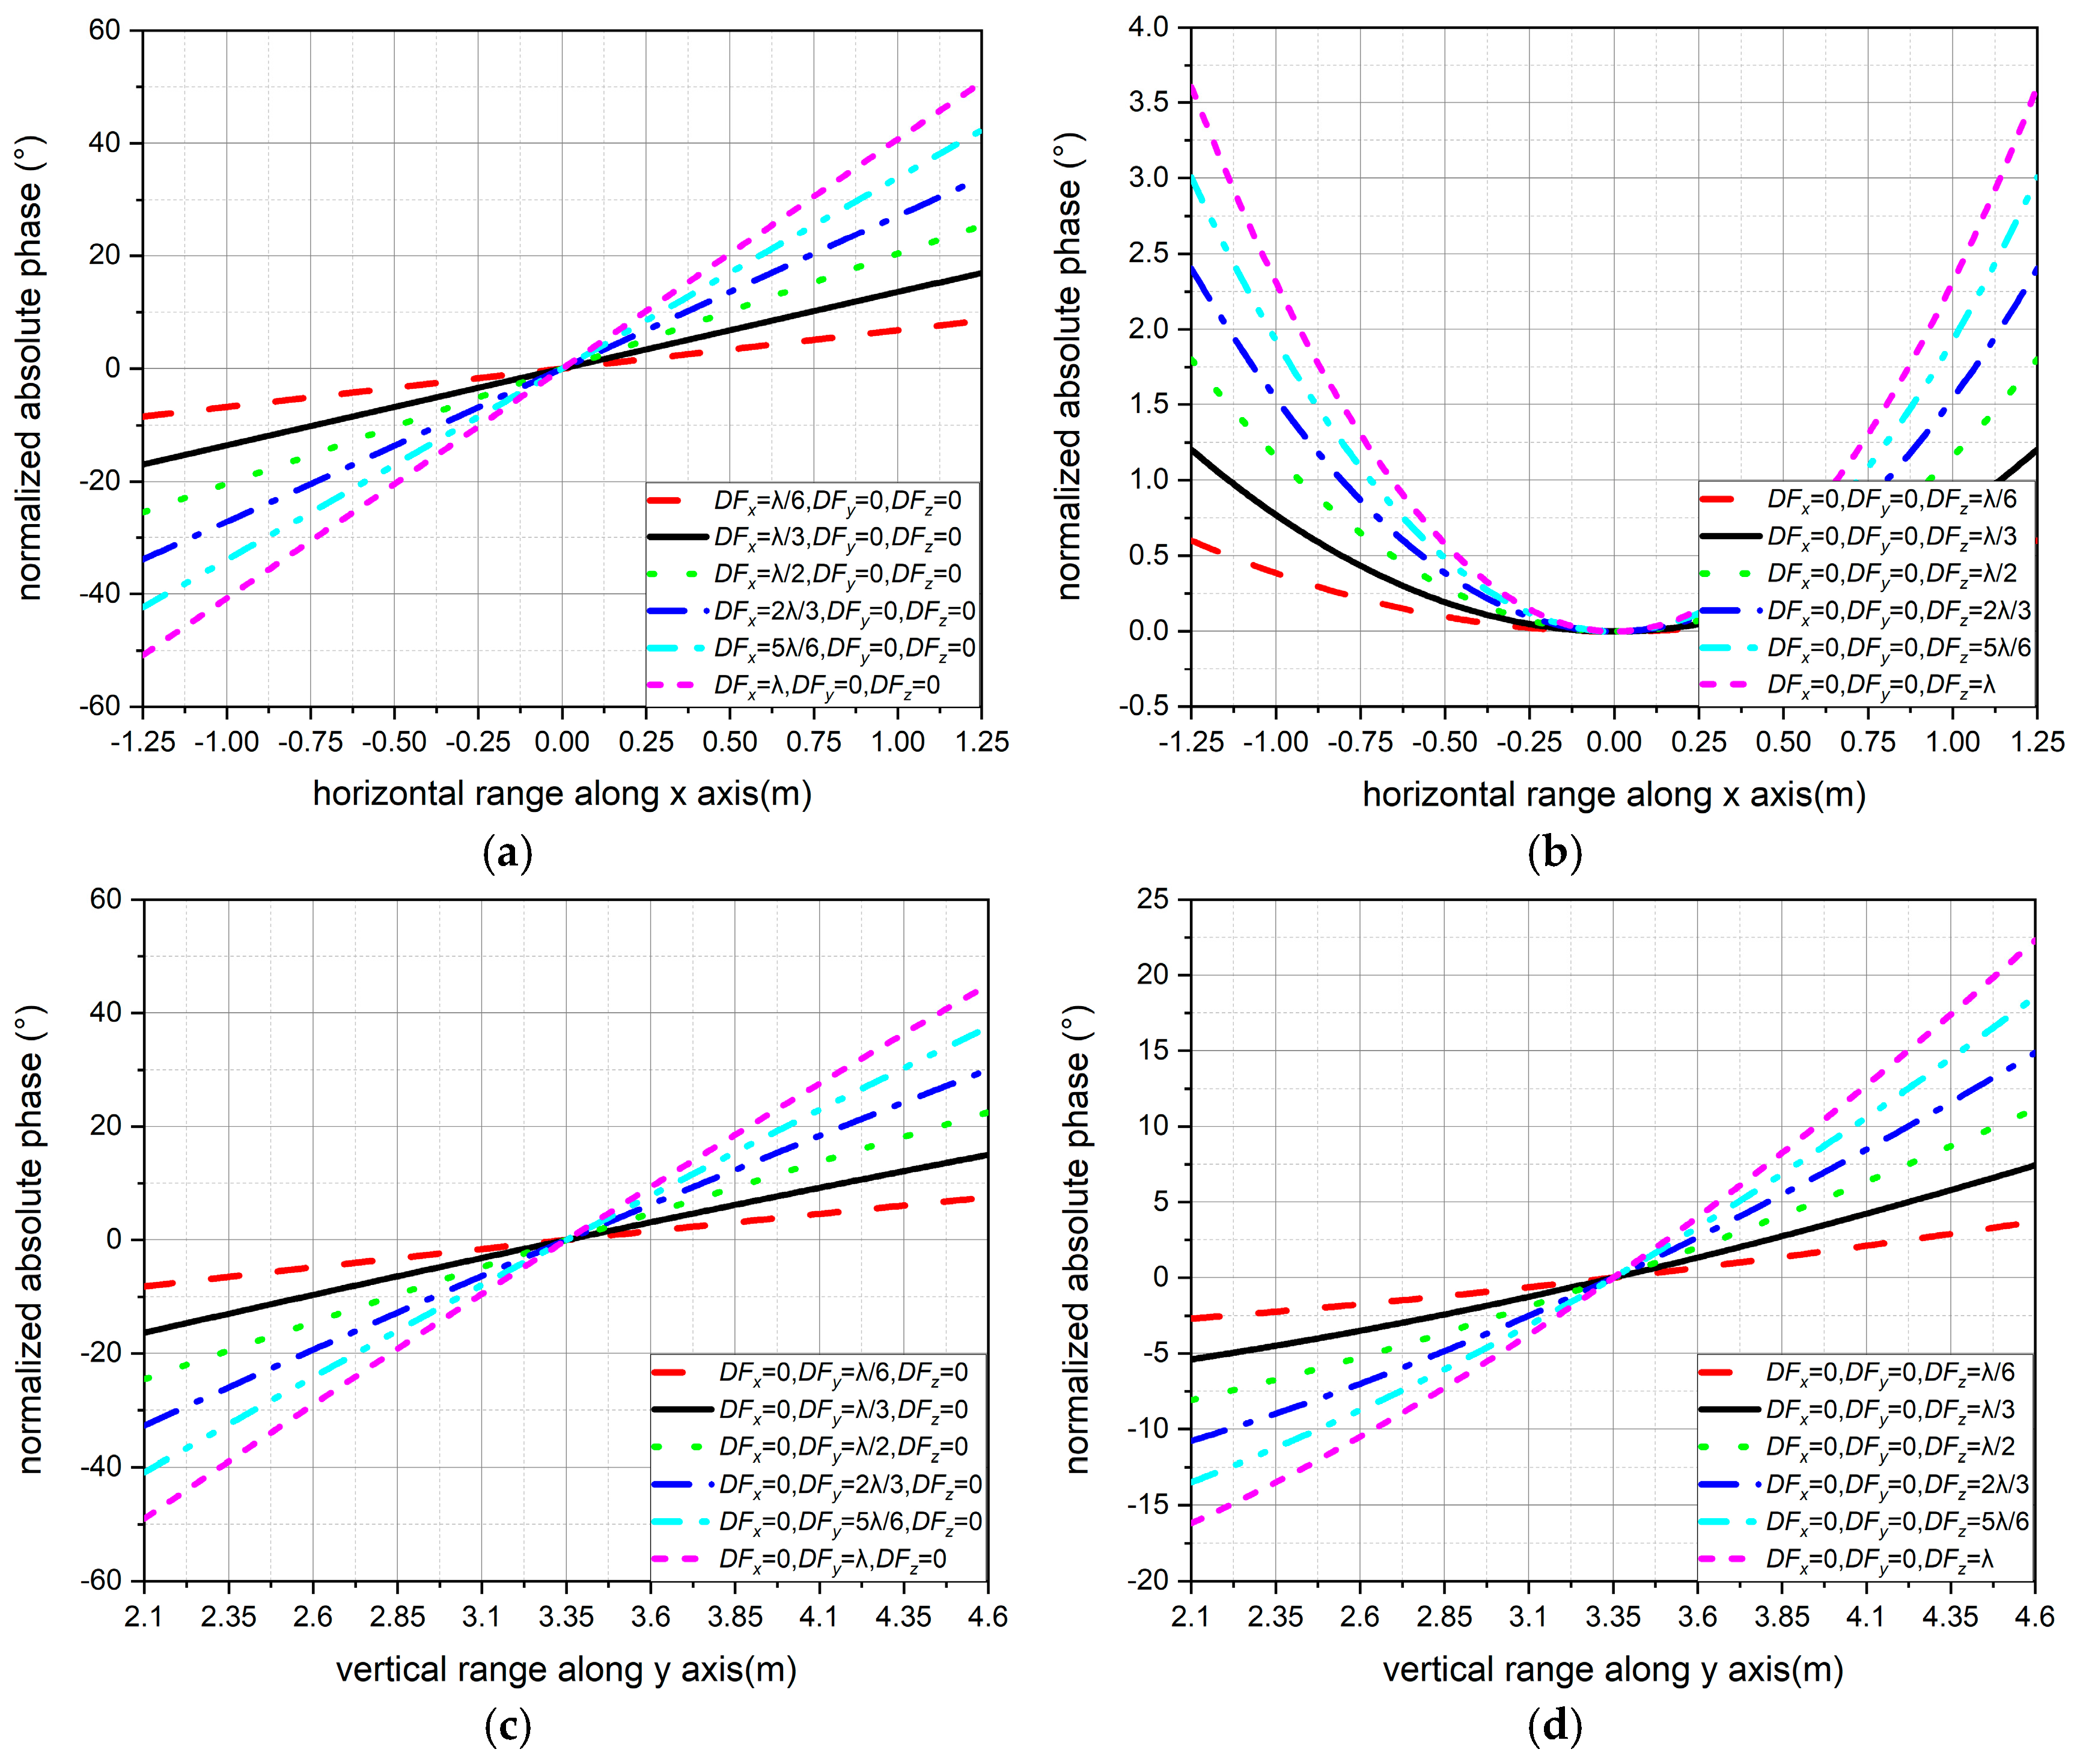
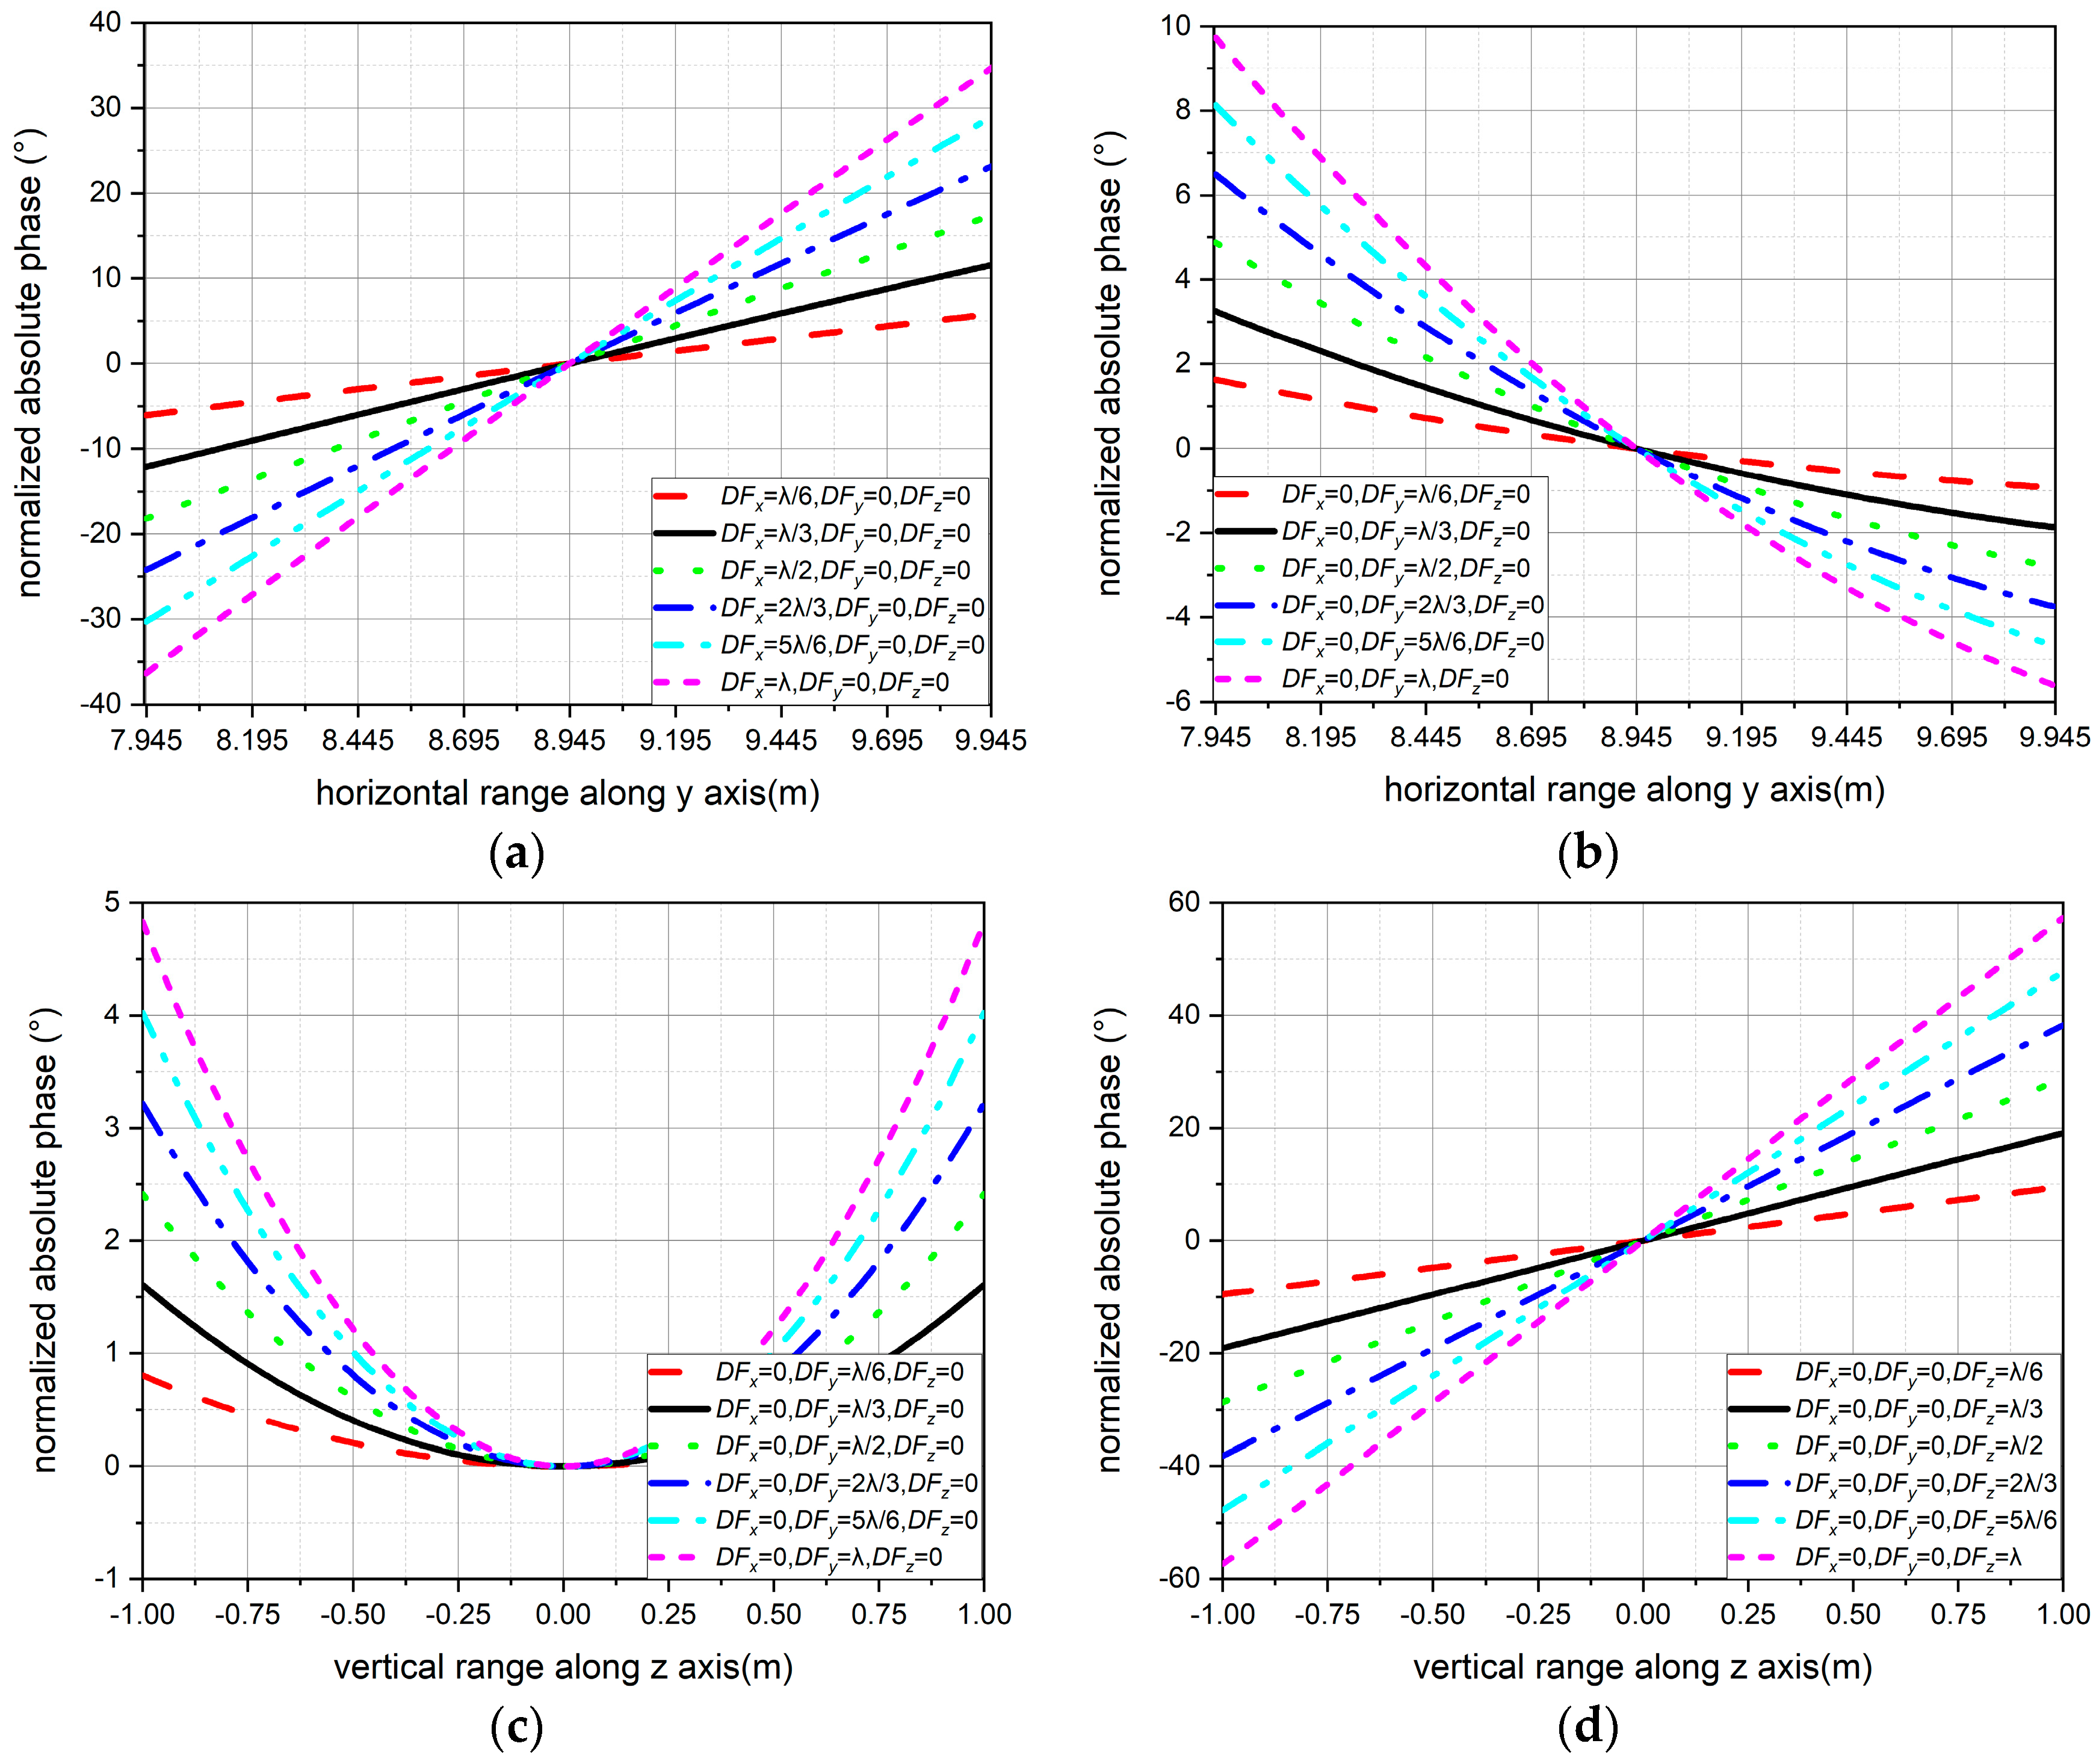
For situations where the phase changes significantly in Figure 3, Figure 4, Figure 5, Figure 7, Figure 8 and Figure 9, the normalized formula calculation results of the phase characteristics at different defocusing distances are calculated to obtain Figure 6 and Figure 10. These figures demonstrate that, when the reflector parameters are fixed, the phase characteristics of the quiet zone are solely related to the electrical length of the defocusing distance, and the phase characteristics gradually deteriorate when the electrical length increases.
Additionally, all the feed defocusing cases in this study are in the positive direction. According to additional verification calculations, other feed defocusing cases in the negative direction can be achieved by simply inverting the sign of the absolute phase response at the current corresponding position.

3.2. Guidance of On-Site Installation for Feeds and Their Turntable

After completing conventional on-site installation of the feeds and their turntable, the amplitude and phase detection in the quiet zone usually comes next. Assuming the spatial positions of the scanning frame and probes are accurate, any phase deviation in quiet zone often originates from the positional offsets of the feeds and their turntable, which are typically caused by improper installation and fastening. In such cases, the current position of the defocused feed can be deduced by analyzing the measured phase response in the quiet zone, combined with the formulas presented in this article. Then, the feeds and their turntable could be moved back into position by using high-precision positioning equipment such as a laser tracker, etc., so that the phase center of the feed coincides with the focus of the reflector again, completing the correction of phase characteristics in the quiet zone.
For a single paraboloid, there are a total of six parameters to be solved: x0, y0, z0, x1, y1, and z1, which means at least six independent equations are required. Since there are only two independent equations in Formulas (A1)–(A4), at least three sets of coordinates (x, y, z) and their corresponding phase values in quiet zone are needed here. To ensure the calculation accuracy, five points are selected in the central section: the center point, two endpoints of the horizontal line, and two endpoints of the vertical line.
To verify the accuracy of the calculation results, the phase data of those five points above are calculated in commercial software, at first, when the feed is defocused by 0.01 m in the positive direction along the x-axis at 10 GHz. Then, Equations (A1)–(A4) and (7) are combined for 10 repeated formula calculations together with that calculated phase data. The calculation results of (x0, y0, z0) are shown in Table 1, while the accurate coordinate of focus is (0, 0, 8.483 m).
For dual parabolic cylinders, there are a total of nine parameters to be solved: x0, y0, z0, x1, y1, z1, x2, y2, and z2, which means at least nine independent equations are required. Since there are only four independent equations in Formulas (A5)–(A16), at least three sets of coordinates (x, y, z) and their corresponding phase values in the quiet zone are needed here. To ensure the calculation accuracy, five points are selected in the central section: the center point, two endpoints of the horizontal line, and two endpoints of the vertical line.
To verify the accuracy of the calculation results, the phase data of those five points above are calculated in commercial software, at first, when the feed is defocused by 0.01 m in the positive direction along the x-axis at 10 GHz. Then, Equations (A5)–(A16) and (8) are combined for 10 repeated formula calculations together with the calculated phase data. The calculation results of (x0, y0, z0) are shown in Table 2, while the accurate coordinate of focus is (5.6808 m, 11.7540 m, 0).
As evident from the tables above, the accuracy of the calculation results for both single paraboloid and dual parabolic cylinders is no more than 1 mm, providing valuable guidance for the on-site installation of feeds and their turntable.

3.3. Confirmation of Feed Position for Equivalent Pitch Tests of the Target Under Measurement

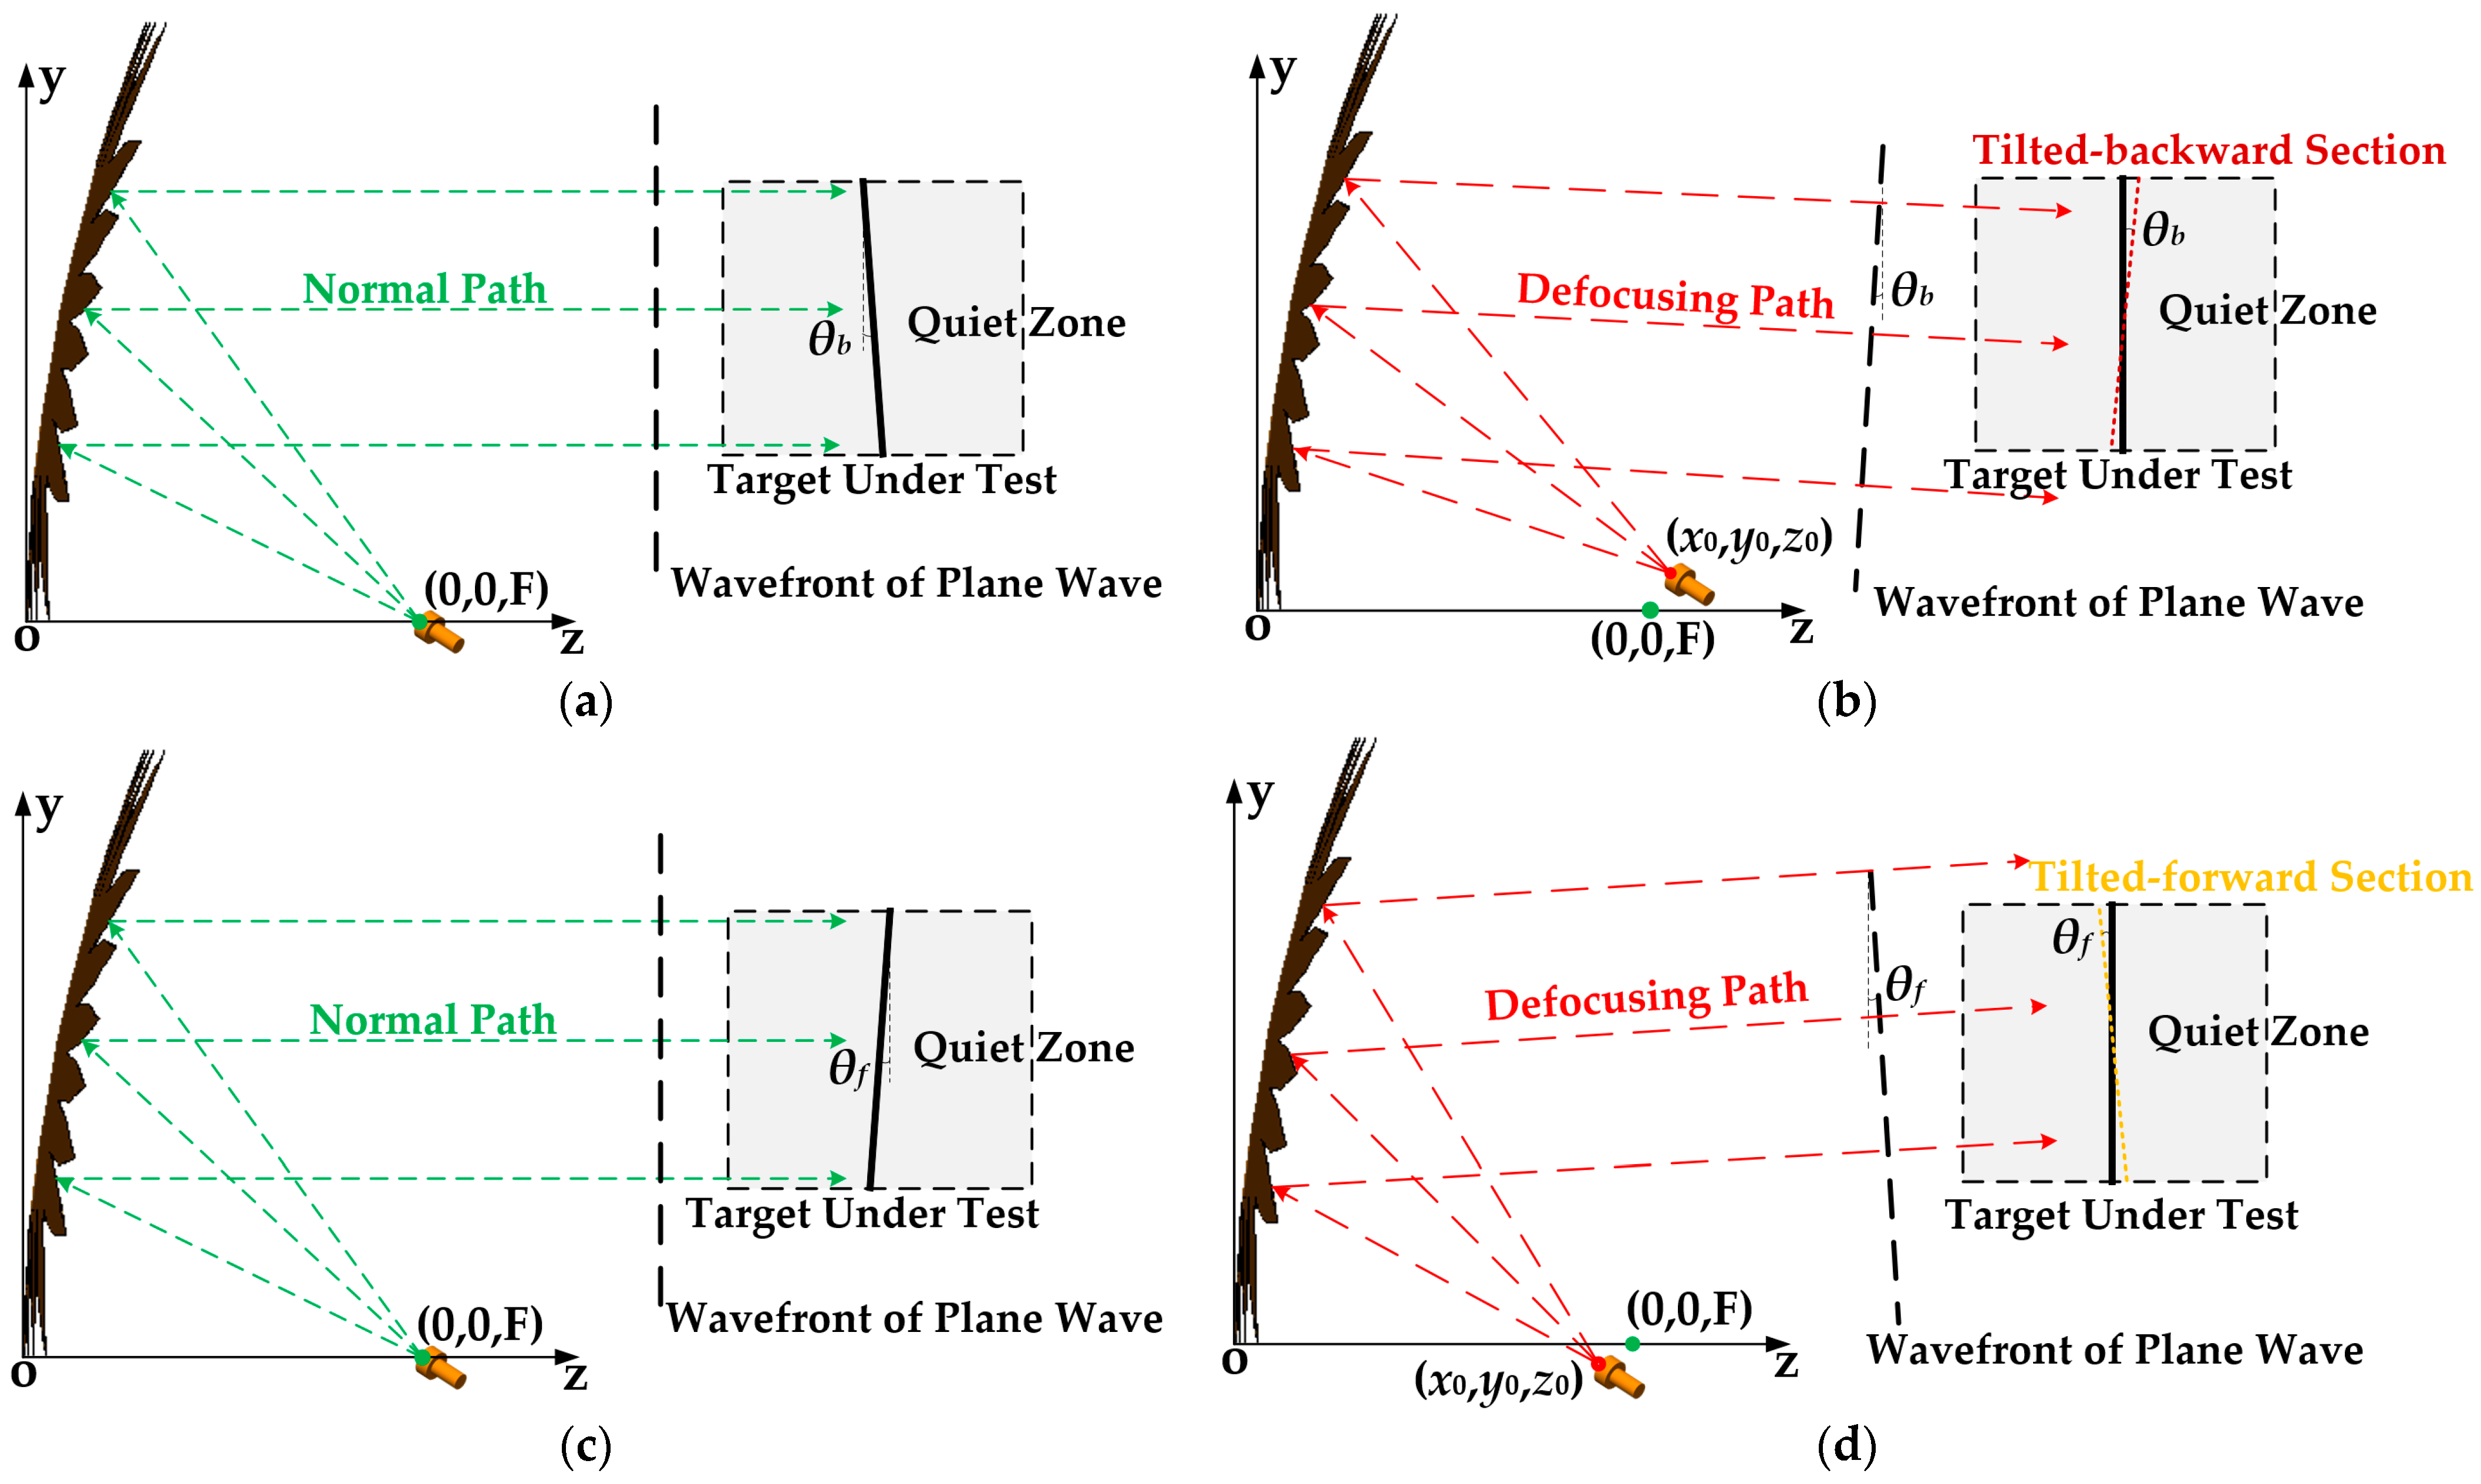
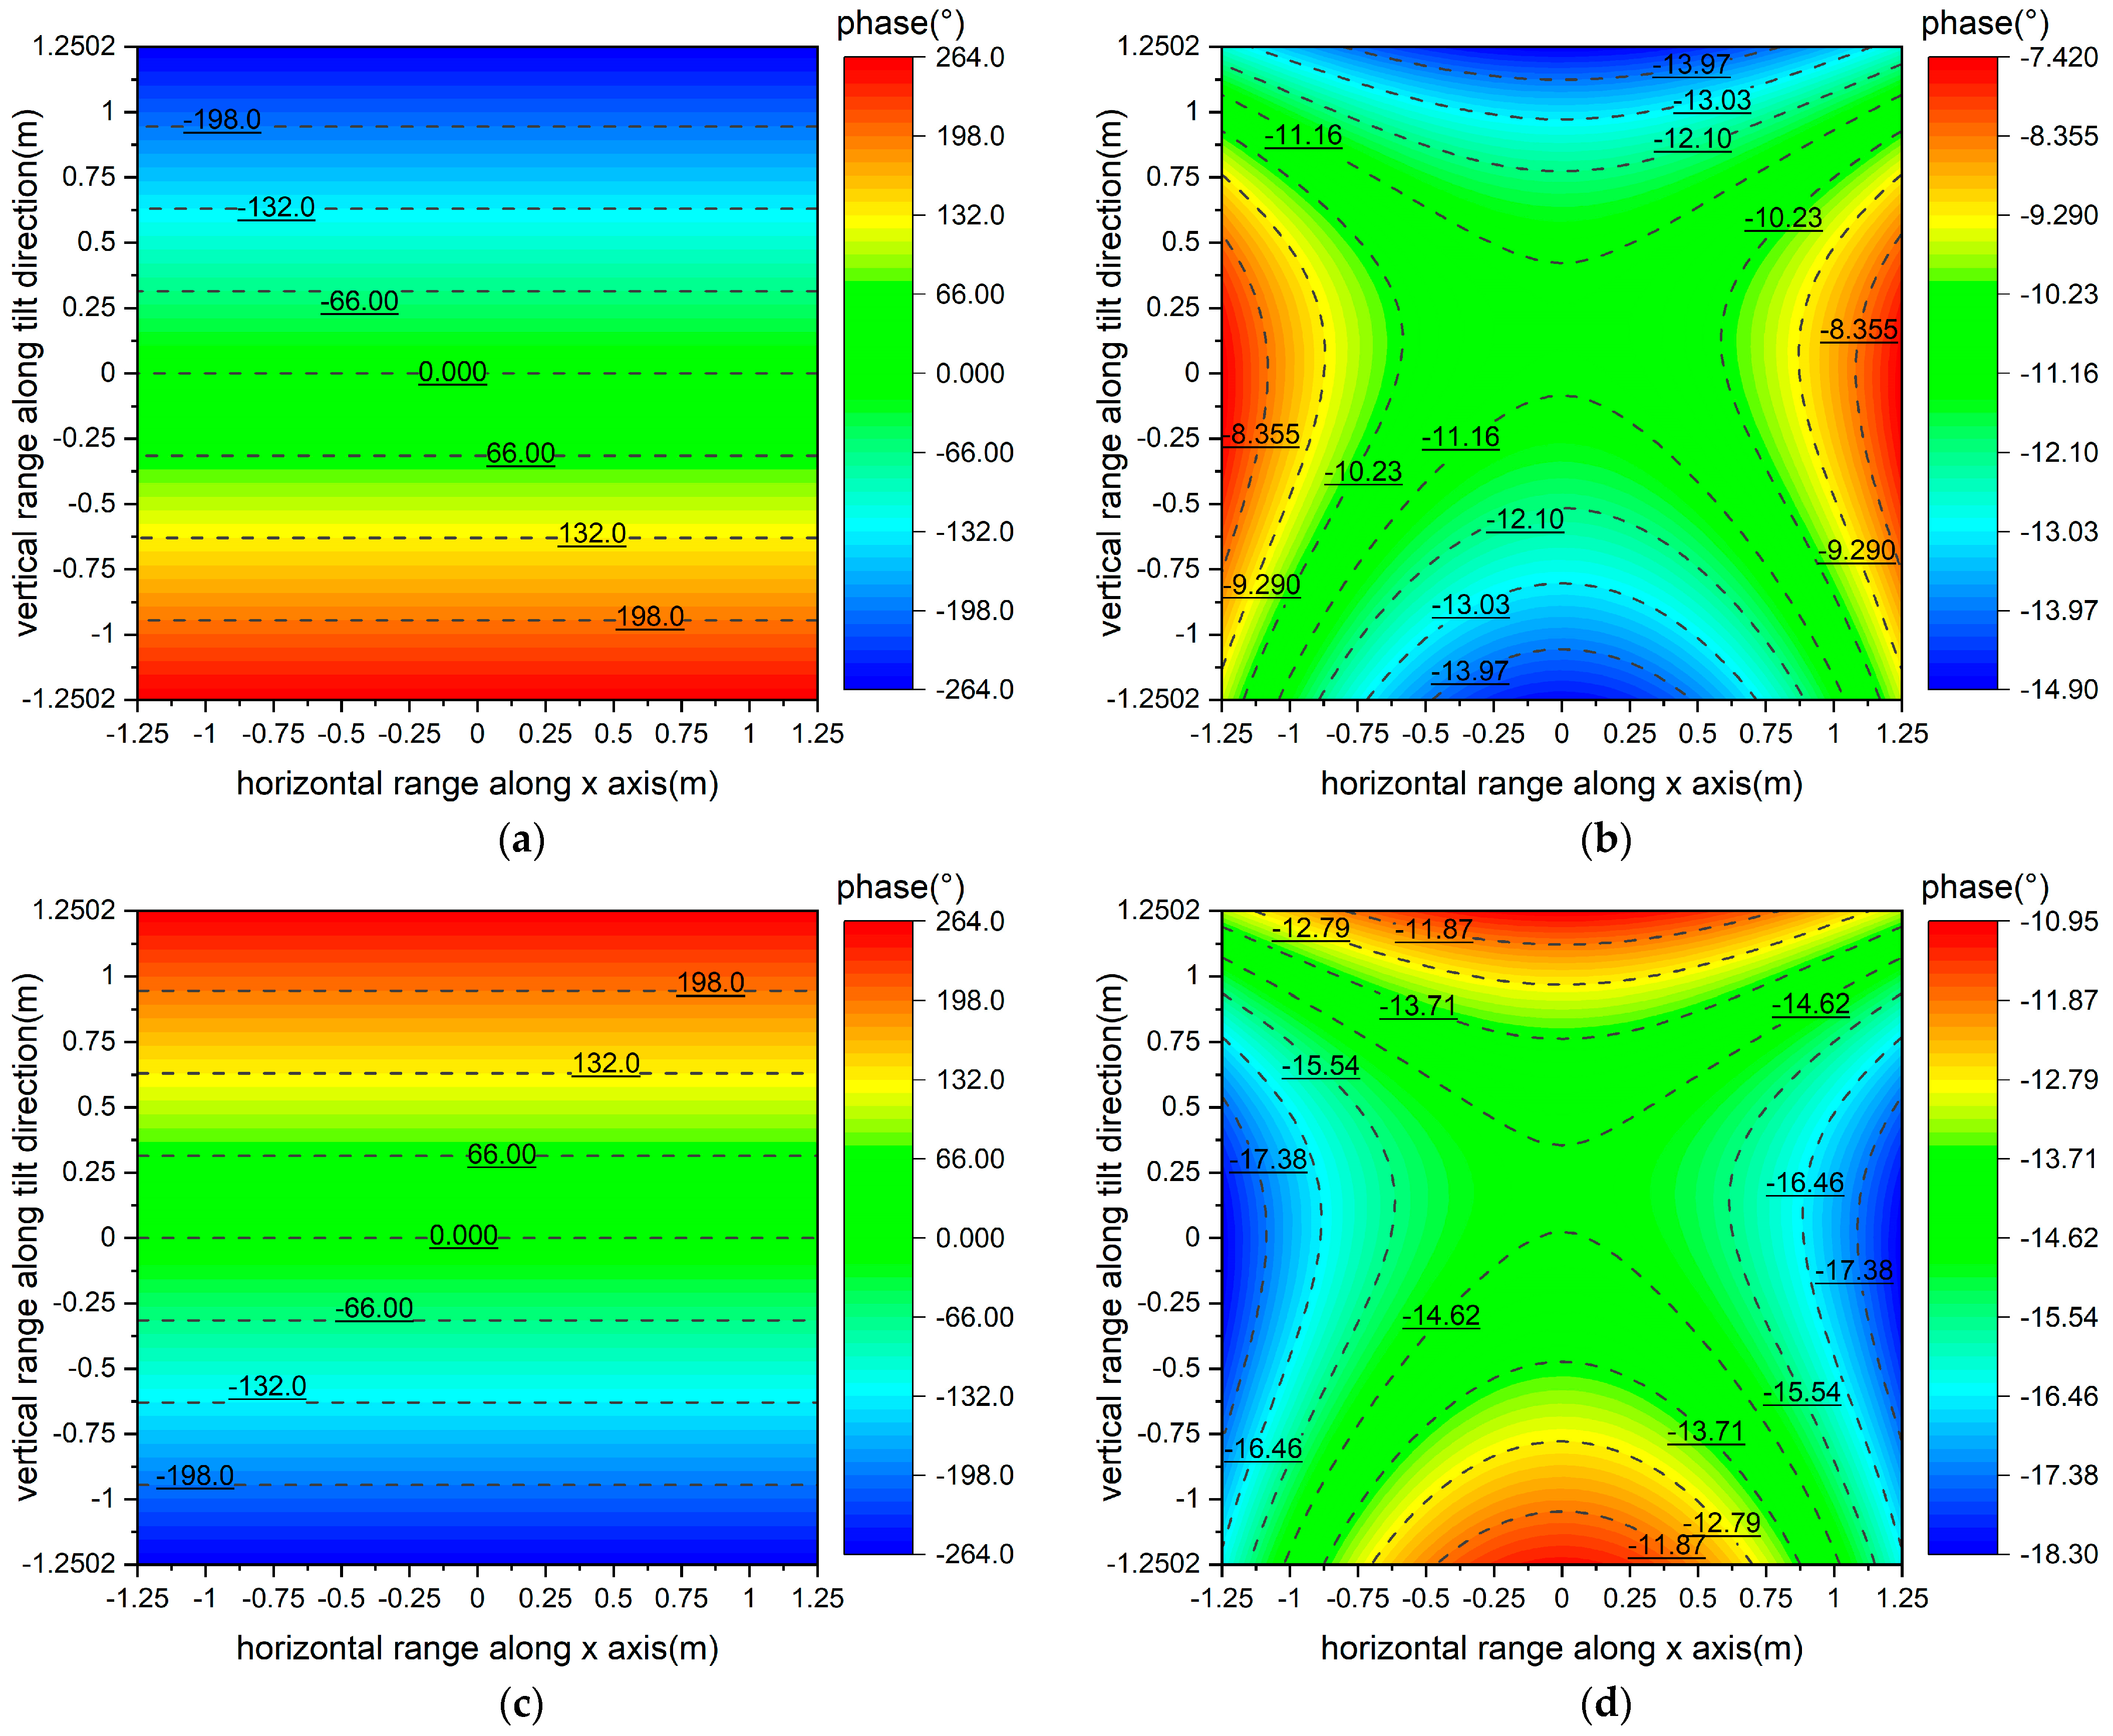
In compact range anechoic chambers lacking supporting facilities for pitch tests, equivalent tests can be achieved by feed defocusing when the pitch angle is small enough. The equiphase surface of the plane wave can be approximately deflected through feed defocusing in equivalent tests. The testing scenario for a single paraboloid is shown in Figure 11, Figure 12 and Figure 13, while the specific spatial relationship between the tilted-backward section and the tilted-forward section is detailed in Figure 1.
The application method from the previous section is still employed here to determine the feed defocusing position, with the main differences as follows:
  • The coordinates of two endpoints on the vertical line need to be determined based on the size of the quiet zone and pitch angle;
  • The phase of all points is referenced to the center point, and are all equal to each other, which means the difference is 0;
  • The calculation result is independent of the operating frequency.
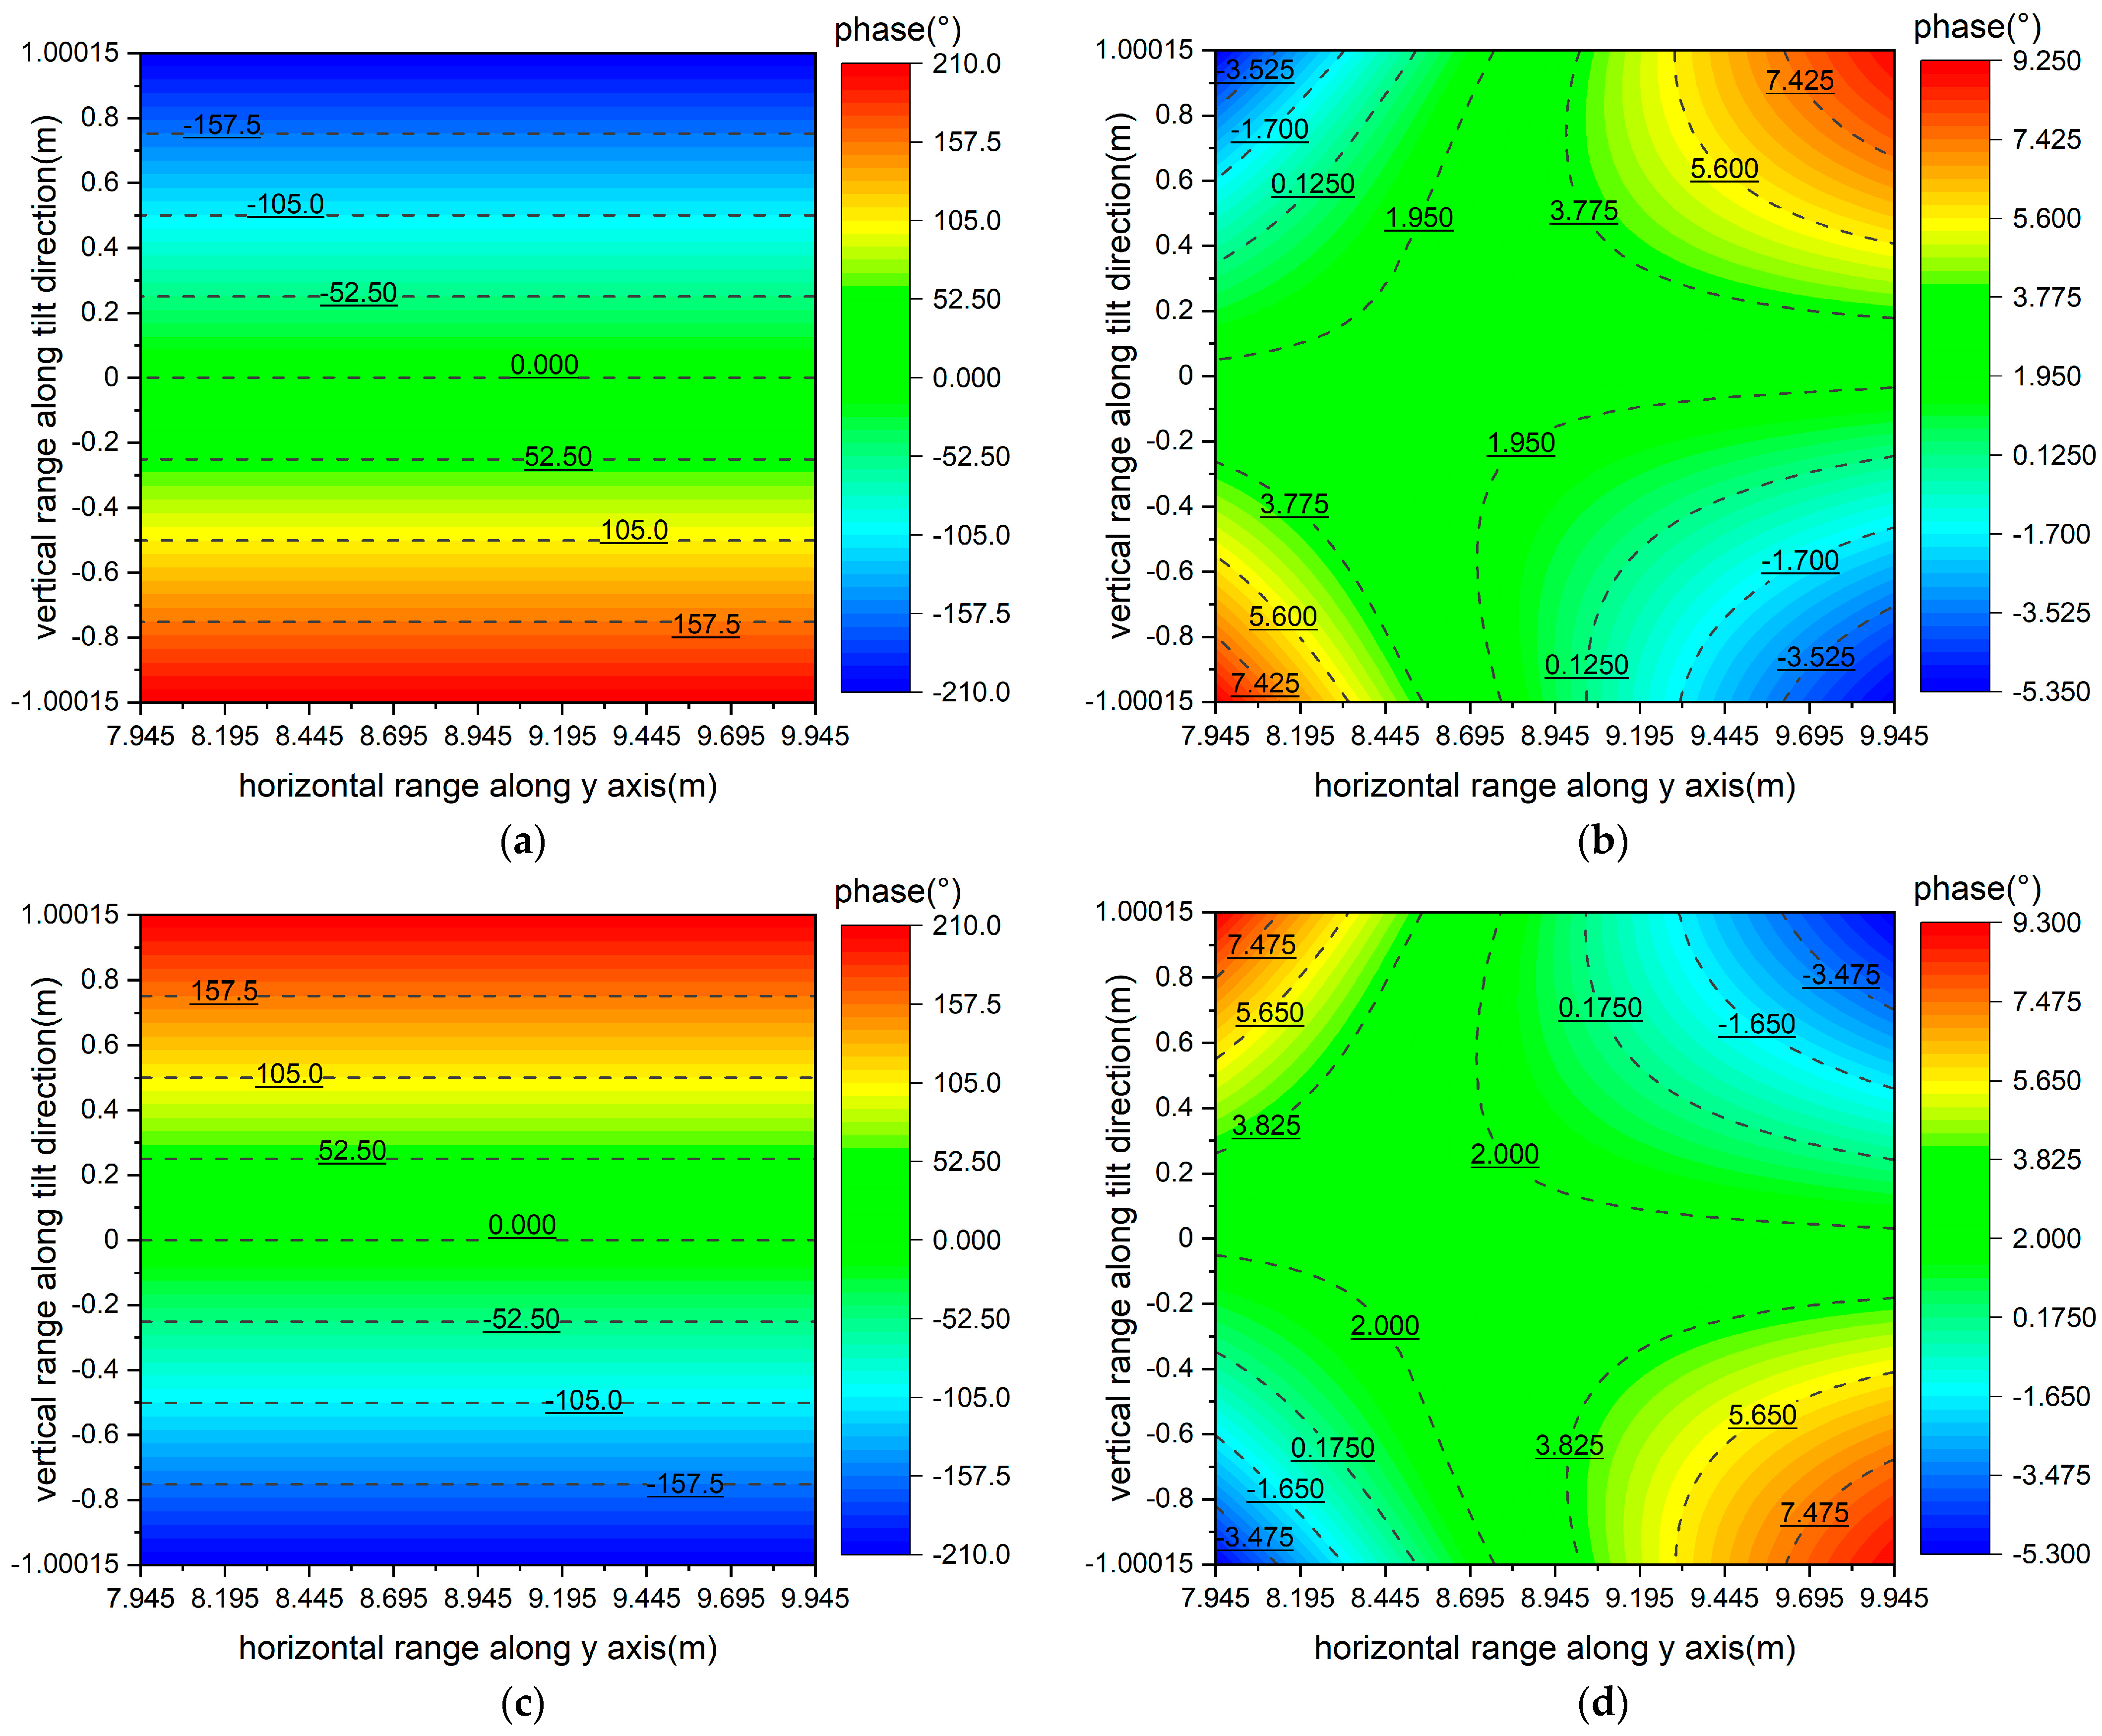
Assuming an equivalent pitch angle of θb = θf = 1°, the feed defocusing positions of single paraboloid and dual parabolic cylinders are calculated, respectively. The calculation results are as follows: the positions for the equivalent downward and upward test of a single paraboloid are located at (0, 0.1431 m, 8.5432 m) and (0, −0.1429 m, 8.4260 m), respectively, and the positions for the equivalent downward and upward test of dual parabolic cylinders are located at (5.6799 m, 11.7546 m, 0.1103 m) and (5.6799 m, 11.7546 m, −0.1103 m), respectively. The phase distributions in the tilted-backward and tilted-forward sections at 10 GHz are shown below, with the center of the quiet zone as the coordinate origin.
As can be seen from Figure 3, Figure 4, Figure 5, Figure 7, Figure 8 and Figure 9, it becomes evident that the main defocusing components of a single paraboloid primarily come from the y and z directions in equivalent pitch tests, with peak phase variations of 7.5° and 7.4° in the two tilted sections. Conversely, the main defocusing component of dual parabolic cylinders is predominantly in the z direction in equivalent pitch tests, with peak phase variations of 14.6° and 14.6°in the two tilted sections. Although the peak phase variations of all tilted sections exceed 0°, the overall phase distribution maintains a symmetrical or approximately oblique 45° balanced saddle shape, satisfying the far-field phase condition [9] and exhibiting extremely high practical utility.
Since the peak phase variations are proportional to the operating frequency in all sections, considering the constraints in practical applications, there is an upper limit to the peak phase variations related to the operating frequency. Otherwise, although the evaluation method remains valid for a larger value of equivalent pitch angle, a larger feed defocusing distance is needed at the same time, which makes higher demands on the adjustment range, positioning accuracy, and interference control of the turntable, making it suitable for a small pitch angle only.

3.4. Others

  • Theoretical foundation of multi-feed distribution. In recent years, numerous scholars have adopted a turntable layout for multi-feed distribution to enhance the efficiency of RCS testing in a compact range without a clear theoretical basis [13,14,15,16,17]. As is evident from Section 3.1, so long as multiple sets of transmitting and receiving feeds within the same frequency band are odd-symmetrically distributed on the installation surface with the focus as the origin, phase compensation of the transmitting and receiving paths can be achieved. A reduction in the feed disassembly frequency and improvement of the testing efficiency can be realized in this way.
  • Identification of key processing areas for the reflector. In practical application of the aforementioned cases, the calculation results of reflection points on the reflector are available; meanwhile, the reflection points’ area depends on the range of quiet zone. Considering the direct correlation between the high-frequency performance of the reflector and its surface accuracy, coupled with its pronounced local effects, it is imperative to prioritize the processing of the reflection points’ area during precision machining.
  • Error elimination of the scanning frame system for the quiet zone test. As is evident from Figure 12a,c and Figure 13a,c, the phase error along any straight path within the sampling plane exhibits linearity during the quiet zone test [9]. Assuming the phase center of the feed coincides with the focus, the least squares method can be employed to perform a first-order fit on the measured phase data of horizontal or vertical lines, to yield the phase difference between the two endpoints of the fitted line. Subsequently, by substituting this value into Equation (5), the overall offset distance of the scanning frame system along the z-axis or x-axis, corresponding, respectively, to single paraboloid and dual parabolic cylinders, can be calculated to eliminate the errors caused by machining or installation.

4. Conclusions

Based on the theory of geometric optics, this paper precisely derives the efficient calculation formulas of phase characteristics in a quiet zone for a defocused feed in a commonly used compact range, such as that underpinned by single paraboloid and dual parabolic cylinders. The proposed evaluation method is of high accuracy and efficiency for higher frequencies and can be used in various scenarios with excellent results. The discrepancy between the formula calculation results and software simulation results of machining accuracy tolerance for feeds and their turntable remains below 1°, demonstrating much better performance than the state of the art. Meanwhile, the deviation of the formula calculation results from the preset position of feed stays within 1 mm, effectively supporting the confirmation of the feed position for equivalent pitch tests. Furthermore, this study provides a theoretical foundation for multi-feed distribution, identification of key processing areas for the reflector, and error elimination of the scanning frame system for a quiet zone test. With the further development of 5G and even 6G technology, the method in this article be convenient for the evaluation and optimization of phase characteristics in a quiet zone.

Author Contributions

Conceptualization, Y.J. and C.M.; methodology, Y.J. and M.Q.; software, Y.J.; validation, Z.L.; formal analysis, H.Y.; investigation, Y.J. and Z.L.; resources, Y.J. and C.M.; data curation, Y.J.; writing—original draft preparation, Y.J.; writing—review and editing, M.Q. and Y.J.; visualization, Y.J.; supervision, H.Y. and M.Q.; project administration, Y.J. All authors have read and agreed to the published version of the manuscript.

Funding

This research was funded by the Beijing Natural Science Foundation, grant number L253002.

Data Availability Statement

Data are contained within the article.

Conflicts of Interest

The authors declare no conflicts of interest.

Abbreviations

The following abbreviations are used in this manuscript:
CATRCompact Antenna Test Range
GOGeometric Optics

Appendix A

The formulas containing all the parameters of a single paraboloid can be derived as follows:
y 0 2 x 1 3 y 0 2 x 1 y 1 2 + x 0 2 x 1 2 y 1 + x 0 2 y 1 3 + 1 2 x y 0 + x 0 y x 1 2 1 2 x y 0 + x 0 y y 1 2 + y y 0 x x 0 x 1 y 1 + 2 F 2 y 2 F 2 y 0 2 F y z 0 x 1 + ( 2 F 2 x + 2 F 2 x 0 + 2 F x z 0 ) y 1 + 2 F 2 x y 0 2 F 2 x 0 y = 0 .
1 8 F x 1 y 1 4 1 4 F x 1 3 y 1 2 1 8 F x 1 5 + x x 0 8 F y 1 4 + x 4 F x 1 2 y 1 2 + x + x 0 8 F x 1 4 + y 0 4 F x 1 3 y 1 + y 0 4 F x 1 y 1 3 F x 1 y 1 2 F x 1 3 + 1 2 3 F x F x 0 + x 0 z x z 0 y 1 2 + 1 2 3 F x + 3 F x 0 x 0 z x z 0 x 1 2 + 2 F y 0 y 0 z x 1 y 1 2 F x y 0 y 1 + 2 F 2 z + 2 F z z 0 2 F 2 z 0 2 F x x 0 x 1 + 2 F 2 z x 0 + 2 F 2 x z 0 = 0 .
1 8 F x 1 4 y 1 1 4 F x 1 2 y 1 3 1 8 F y 1 5 + y y 0 8 F x 1 4 + y 4 F x 1 2 y 1 2 + y + y 0 8 F y 1 4 + x 0 4 F x 1 3 y 1 + x 0 4 F x 1 y 1 3 F x 1 2 y 1 F y 1 3 + 1 2 3 F y F y 0 + y 0 z y z 0 x 1 2 + 1 2 3 F y + 3 F y 0 y 0 z y z 0 y 1 2 + 2 F x 0 x 0 z x 1 y 1 2 F y x 0 x 1 + 2 F 2 z + 2 F z z 0 2 F 2 z 0 2 F y y 0 y 1 + 2 F 2 z y 0 + 2 F 2 y z 0 = 0 .
x 1 2 + y 1 2 = 4 F z , y 1 > 0 .
Although any two Equations in (A1)–(A3) can fully represent the parameter relationship, all the equations are used in the actual calculation to ensure the accuracy of the optimization.
The formulas containing all the parameters of dual parabolic cylinders can be derived as follows:
x 1 y 2 z 1 2 x 2 y 1 z 1 2 + 4 F 1 s i n θ 2 y 0 x 1 z 1 2 4 F 1 s i n θ 2 y 0 x 2 z 1 2 4 F 1 c o s θ 2 x 0 y 1 z 1 2 + 4 F 1 c o s θ 2 x 0 y 2 z 1 2 + 8 F 1 2 c o s 2 θ 2 x 1 y 1 4 F 1 2 c o s 2 θ 2 x 1 y 2 4 F 1 2 c o s 2 θ 2 x 2 y 1 4 F 1 s i n θ 2 z 0 x 1 z 1 + 4 F 1 s i n θ 2 z 0 x 2 z 1 + 8 F 1 2 s i n θ 2 c o s θ 2 x 1 x 2 + 4 F 1 c o s θ 2 z 0 y 1 z 1 8 F 1 2 s i n θ 2 c o s θ 2 y 1 y 2 4 F 1 c o s θ 2 z 0 y 2 z 1 8 F 1 2 s i n θ 2 c o s θ 2 x 1 2 + 8 F 1 2 s i n θ 2 c o s θ 2 y 1 2 + 8 F 1 2 s i n θ 2 c o s θ 2 x 0 4 F 1 2 c o s 2 θ 2 y 0 x 1 ( 8 F 1 2 s i n θ 2 c o s θ 2 x 0 4 F 1 2 c o s 2 θ 2 y 0 ) x 2 4 F 1 2 c o s 2 θ 2 x 0 + 8 F 1 2 s i n θ 2 c o s θ 2 y 0 y 1 + 4 F 1 2 c o s 2 θ 2 x 0 + 8 F 1 2 s i n θ 2 c o s θ 2 y 0 y 2 = 0 .
2 x 1 z 1 3 x 2 z 1 3 x 1 z 1 2 z 2 + 4 F 1 c o s θ 2 x 0 z 1 3 4 F 1 c o s θ 2 x 0 z 1 2 z 2 z 0 x 1 z 1 2 4 F 1 c o s θ 2 x 1 2 z 1 4 F 1 s i n θ 2 x 1 y 1 z 1 + z 0 x 2 z 1 2 + 4 F 1 c o s θ 2 x 1 x 2 z 1 + 4 F 1 s i n θ 2 x 2 y 1 z 1 + 8 F 1 2 c o s 2 θ 2 + 4 F 1 c o s θ 2 x 0 + 4 F 1 s i n θ 2 y 0 x 1 z 1 + 4 F 1 2 c o s 2 θ 2 x 1 z 2 + 4 F 1 2 4 F 1 c o s θ 2 x 0 4 F 1 s i n θ 2 y 0 x 2 z 1 8 F 1 2 s i n θ 2 c o s θ 2 y 1 z 1 4 F 1 c o s θ 2 z 0 z 1 2 + 8 F 1 2 s i n θ 2 c o s θ 2 y 1 z 2 + 4 F 1 c o s θ 2 z 0 z 1 z 2 + 4 F 1 2 z 0 x 1 4 F 1 2 z 0 x 2 + 4 F 1 2 c o s 2 θ 2 x 0 + 8 F 1 2 s i n θ 2 c o s θ 2 y 0 z 1 4 F 1 2 c o s 2 θ 2 x 0 + 8 F 1 2 s i n θ 2 c o s θ 2 y 0 z 2 = 0 .
2 y 1 z 1 3 y 2 z 1 3 y 1 z 1 2 z 2 + 4 F 1 s i n θ 2 y 0 z 1 3 4 F 1 s i n θ 2 y 0 z 1 2 z 2 z 0 y 1 z 1 2 4 F 1 s i n θ 2 y 1 2 z 1 4 F 1 c o s θ 2 x 1 y 1 z 1 + z 0 y 2 z 1 2 + 4 F 1 c o s θ 2 x 1 y 2 z 1 + 4 F 1 s i n θ 2 y 1 y 2 z 1 + 8 F 1 2 s i n 2 θ 2 + 4 F 1 c o s θ 2 x 0 + 4 F 1 s i n θ 2 y 0 y 1 z 1 4 F 1 2 c o s 2 θ 2 y 1 z 2 + 4 F 1 2 4 F 1 c o s θ 2 x 0 4 F 1 s i n θ 2 y 0 y 2 z 1 8 F 1 2 s i n θ 2 c o s θ 2 x 1 z 1 4 F 1 s i n θ 2 z 0 z 1 2 + 8 F 1 2 s i n θ 2 c o s θ 2 x 1 z 2 + 4 F 1 s i n θ 2 z 0 z 1 z 2 + 4 F 1 2 z 0 y 1 4 F 1 2 z 0 y 2 + 8 F 1 2 s i n θ 2 c o s θ 2 x 0 4 F 1 2 c o s 2 θ 2 y 0 z 1 8 F 1 2 s i n θ 2 c o s θ 2 x 0 4 F 1 2 c o s 2 θ 2 y 0 z 2 = 0 ,
z 1 2 = 4 F 1 c o s θ 2 x 1 + s i n θ 2 y 1 F 1 F 2 c o s θ 2 .
x 2 2 y 1 x 2 2 y 2 + y 1 y 2 2 + y x 2 2 2 F 2 x 2 y 2 F 2 + x x 2 y 1 + x F 2 x 1 y 2 y x 1 x 2 y y 1 y 2 + 3 y F 2 x 2 x F 2 y 2 + x F 2 y 1 + y F 2 x 1 = 0 .
x 1 x 2 z 2 + y 1 y 2 z 2 x 2 2 z 1 2 F 2 + x x 2 z 2 F 2 x x 2 z 1 F 2 x 1 z 2 + z x 2 2 z x 1 x 2 z y 1 y 2 + 3 z F 2 x 2 x F 2 z 2 + x F 2 z 1 + z F 2 x 1 = 0 .
x 1 y 2 z 2 x 2 y 1 z 2 x 2 y 2 z 1 + x 2 y 2 z 2 F 2 y 2 z 1 y x 2 z 2 + y x 2 z 1 + F 2 y 1 z 2 + z x 2 y 1 z x 1 y 2 + z F 2 y 2 z F 2 y 1 + y F 2 z 1 y F 2 z 2 = 0 .
y 2 2 = 4 F 2 x 2 .
Although any two Equations in (A5)–(A7) or (A9)–(A11) can fully represent the parameter relationship, all the equations above are incorporated into the actual calculation to ensure the accuracy of the optimization.
The value range of x1 is
F 2 + F 1 c o s θ 2 F 1 t a n θ 1 s i n θ 2 0.5 C D s i n θ 2 x 1 F 2 + F 1 c o s θ 2 F 1 t a n θ 1 s i n θ 2 + 0.5 C D s i n θ 2 .
The value range of y1 is
F 1 s i n θ 2 + F 1 t a n θ 1 c o s θ 2 + 0.5 C D c o s θ 2 y 1 F 1 s i n θ 2 + F 1 t a n θ 1 c o s θ 2 0.5 C D c o s θ 2 .
The value range of x2 is
F 2 2 F 2 / 1 + c o s θ 0 c o s θ 0 0.5 A B c o s θ 1 + θ 2 / 2 x 2 F 2 2 F 2 / 1 + c o s θ 0 c o s θ 0 + 0.5 A B c o s θ 1 + θ 2 / 2 .
The value range of y2 is
2 F 2 / 1 + c o s θ 0 s i n θ 0 0.5 A B s i n θ 1 + θ 2 / 2 y 2 2 F 2 / 1 + c o s θ 0 s i n θ 0 + 0.5 A B s i n θ 1 + θ 2 / 2 .

References

  1. Johnson, R.C.; Ecker, H.A.; Moore, R.A. Compact Range Techniques and Measurements. IEEE Trans. Antenna Propag. 1969, 17, 569–576. [Google Scholar] [CrossRef]
  2. CTIA Certification Program, V1.0; Test Plan for Millimeter-Wave Wireless Device Over-the-Air Performance; CTIA Certification: Washington, DC, USA, 2020.
  3. 3GPP TR 38.810, NR; Study on Test Methods; 3GPP Organization: Sophia Antipolis, France, 2019.
  4. Jabbar, A.; Kazim, J.U.; Shawky, M.A.; Imran, M.A.; Abbasi, Q.; Usman, M.; Ur-Rehman, M. High Performance 5G FR-2 Millimeter-Wave Antenna Array for Point-to-Point and Point-to-Multipoint Operation: Design and OTA Measurements Using a Compact Antenna Test Range. Prog. Electromagn. Res. M 2025, 132, 73–84. [Google Scholar] [CrossRef]
  5. Park, S.H.; Kim, Y.N.; Kim, H.N.; Moon, T.S.; Park, J.H. Active Performance Verification of 28 GHz 5G Beam-forimg Antenna Module using CATR Chamber. In Proceedings of the 2024 International Symposium on Antennas and Propagation (ISAP), Incheon, Republic of Korea, 5–8 November 2024. [Google Scholar]
  6. Zhou, Y.H. Advancing 5G Calibration Methods In The Compact Antenna Test Range. Bachelor’s Thesis, Lund University, Lund, Sweden, 2024. [Google Scholar]
  7. Zhu, Y.; Yang, S.Y.; Zhang, Y.; Ma, Y.C. Measurement Uncertainty Assessment for a 5G Millimeter Wave OTA Test System. In Proceedings of the 2023 International Conference on Microwave and Millimeter Wave Technology (ICMMT), Qingdao, China, 14–17 May 2023. [Google Scholar]
  8. Zhang, Y.; Wu, X.; Zhang, X.; Ren, Y.X.; Pan, C.; Wei, G.M. Test Methodology and System for 5G Millimeter Wave Terminal RF Conformance. Wirel. Technol. Intell. Netw. Technol. Smart Serv. Appl. 2022, 11, 87–92. [Google Scholar]
  9. Qu, M.J.; Liu, G.H.; Wang, P.H.; Sun, S.Y. Removing Phase Misalignment in the Validation of a Compact Antenna Test Range for 5G mm-Wave UE OTA Testing. IEEE Trans. Electromagn. Compat. 2021, 63, 1295–1299. [Google Scholar] [CrossRef]
  10. Baggett, M.C.; Swarner, W.G. Use of Clustered Feeds in a Compact Range for RCS Measurements. In Proceedings of the 1990 Antenna Measurement Techniques Association Symposium (AMTA), Atlanta, GA, USA, 2–5 November 1990. [Google Scholar]
  11. Fordham, J.A.; Park, T. Compact Range Phase Taper Effects Due to Phase Center Shift in WideBand Quad-Ridge Feeds. In Proceedings of the 2002 Antenna Measurement Techniques Association Symposium (AMTA), San Diego, CA, USA, 6–11 October 2002. [Google Scholar]
  12. Jiang, Y.Q.; Mo, C.J.; Chen, W.Q.; Kong, D.W. Research on Serrations of Reflector Used in CATR. In Proceedings of the 2019 Photonics & Electromagnetics Research Symposium(PIERS), Xiamen, China, 17–20 December 2019. [Google Scholar]
  13. Gong, Y.J.; Li, D.S.; Wang, M.M.; Liu, Z.M. Robot-based Precise Offset-Focus Feed Control System Used in the Compact Antenna Test Range. In Proceedings of the 2018 IEEE Asia-Pacific Conference on Antennas and Propagation (APCAP), Auckland, New Zealand, 5–8 August 2018. [Google Scholar]
  14. Ning, Z.H.; Wang, Z.P.; Yu, Z.Y. Design of A Millimeter wave Multi-Feeds Compact Range. In Proceedings of the 2020 IEEE MTT-S International Wireless Symposium (IWS), Shanghai, China, 20–23 September 2020. [Google Scholar]
  15. Pan, C.; Ning, Z.H.; Wang, Z.P.; Wang, X. A Multi-feed Compact Antenna Test Range for 5G Millimeter Wave OTA Test. In Proceedings of the 2021 International Conference on Microwave and Millimeter Wave Technology (ICMMT), Nanjing, China, 23–26 May 2021. [Google Scholar]
  16. Pan, C.; Song, M.S.; Yang, X.H.; Wang, Z.P.; Ning, Z.H. Design and Application of Off-focus Multi-feed Compact Range for 5G Over-the-Air Test. In Proceedings of the 2022 International Applied Computational Electromagnetics Society Symposium (ACES-China), Xuzhou, China, 9–12 December 2022. [Google Scholar]
  17. Rocco, C.; Patrizia, L. A Novel Shape of Bowtie Antenna Arranged in a Linear Array for Energy Harvesting in MID-IR Band. In Proceedings of the 2023 12th International Conference on Renewable Energy Research and Applications (ICRERA), Oshawa, ON, Canada, 29 August–1 September 2023. [Google Scholar]
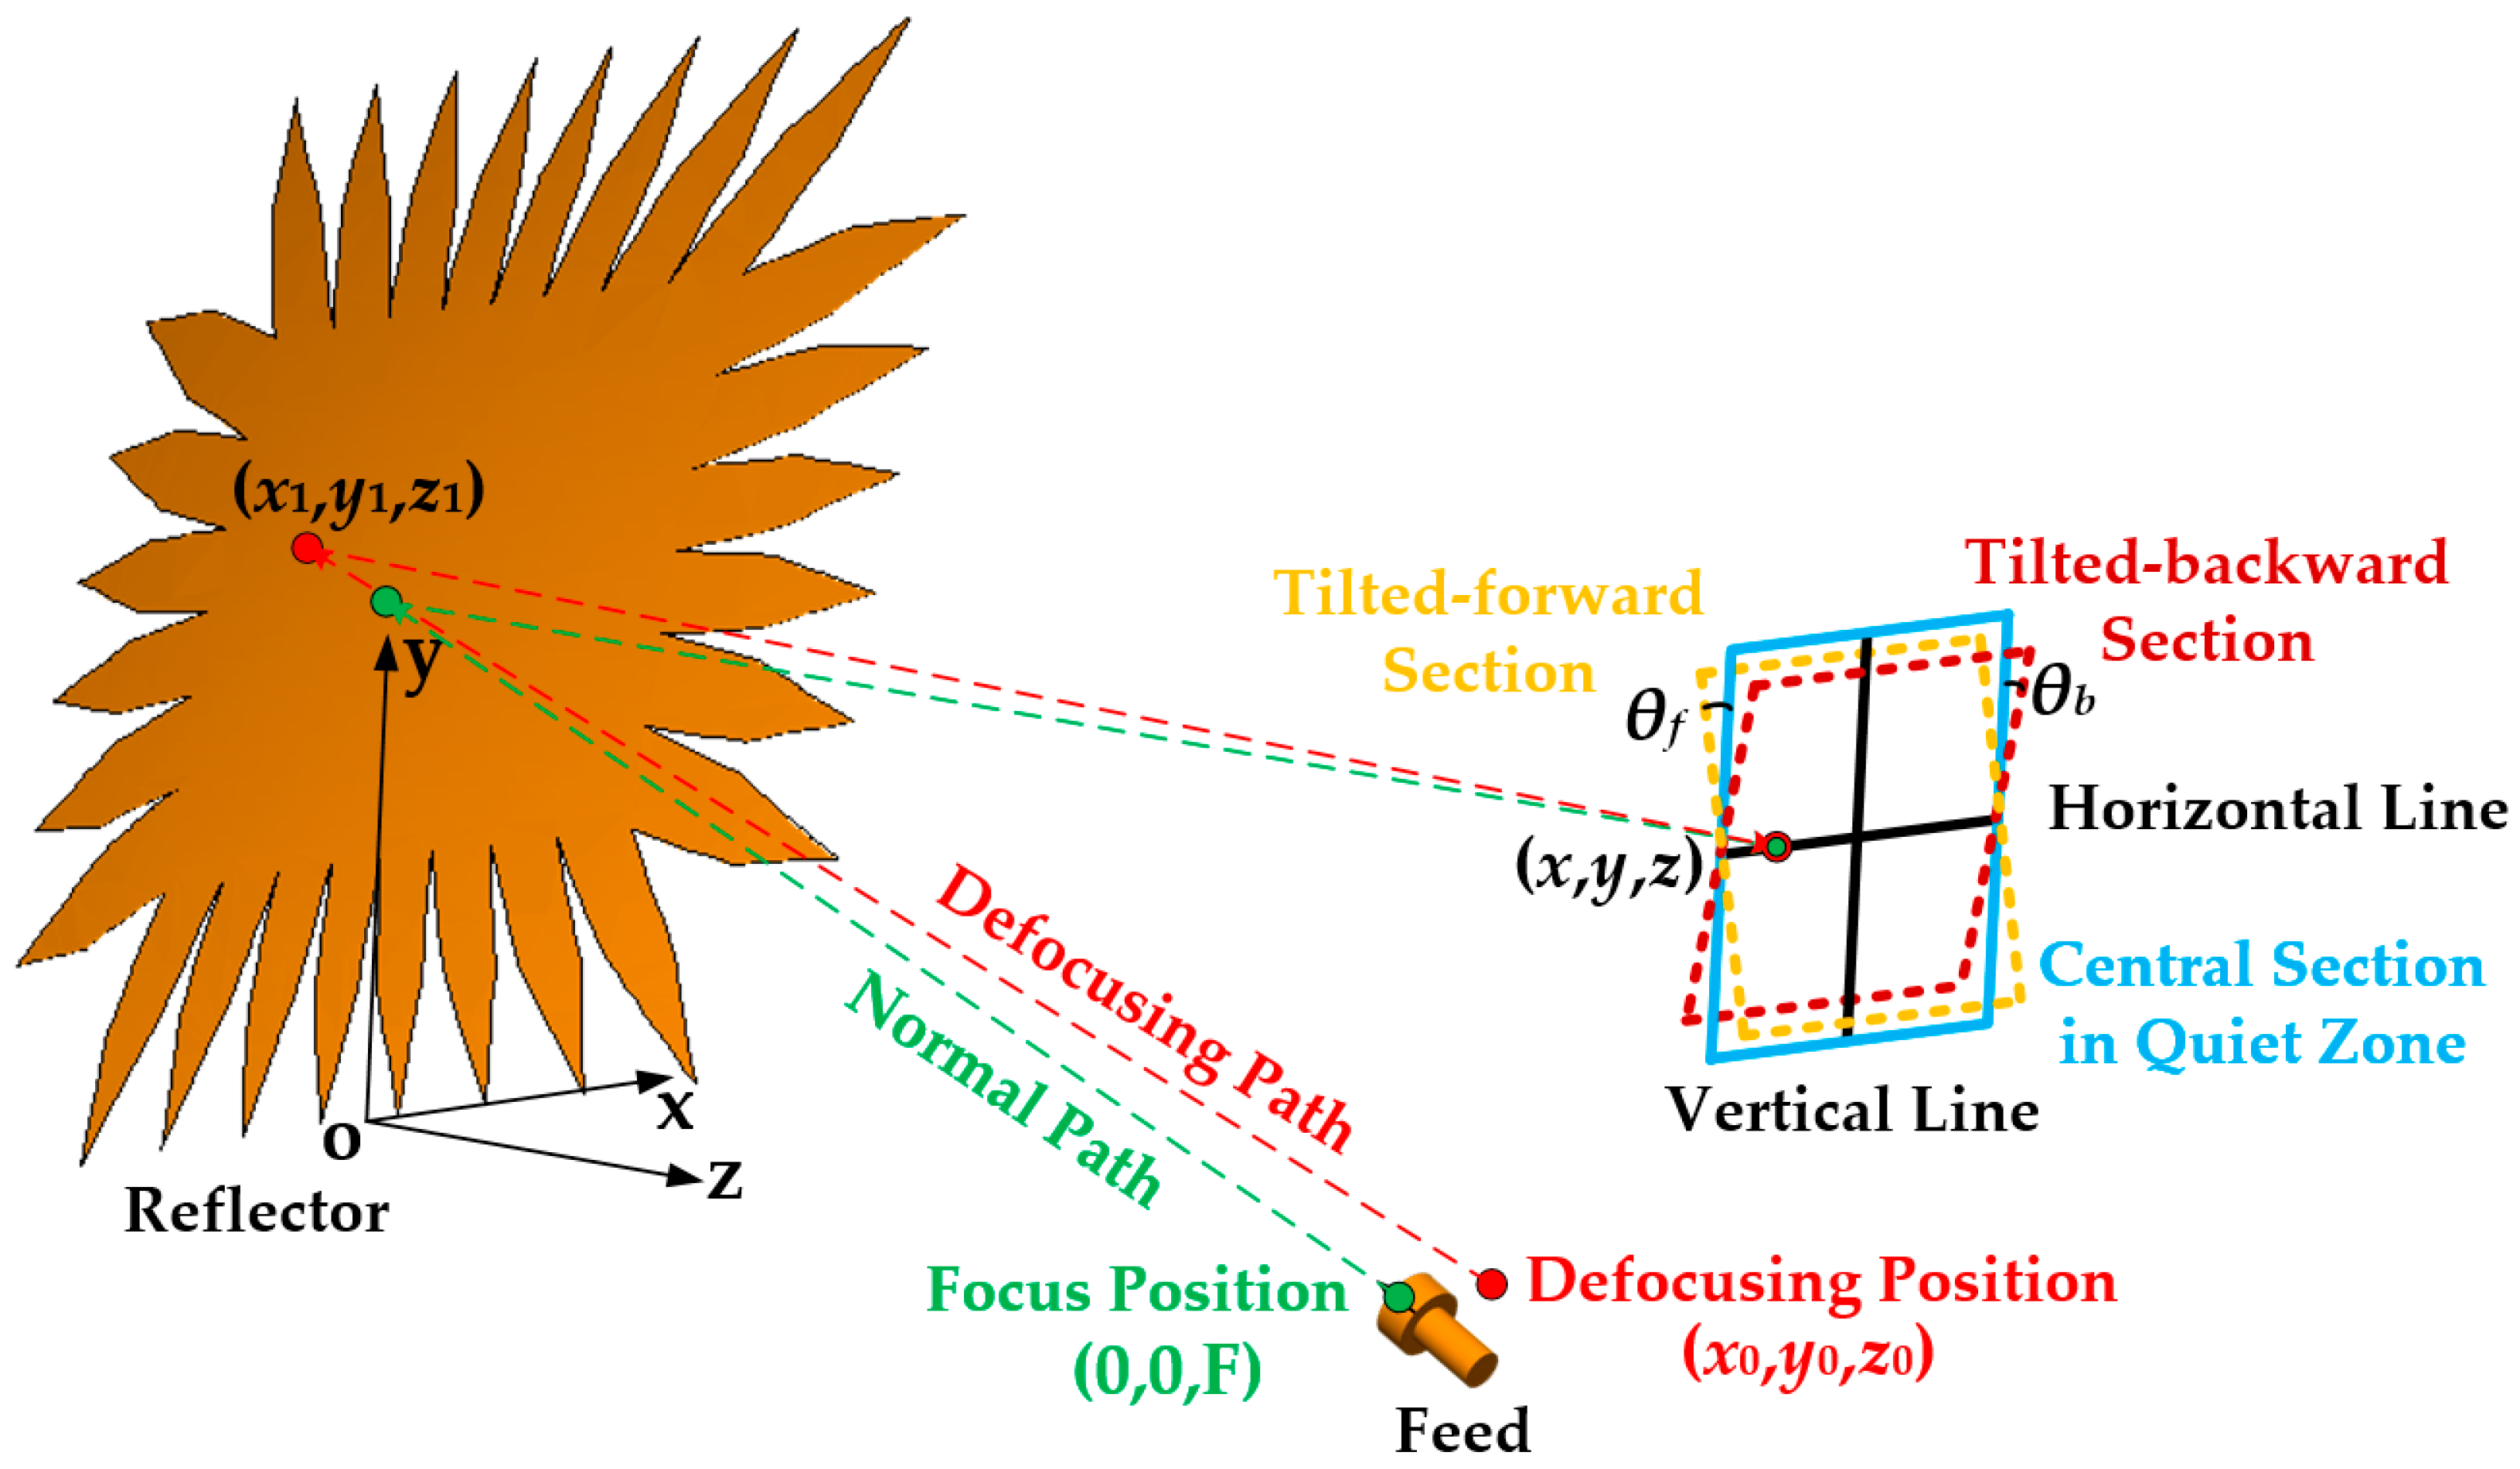
Figure 1. The feed defocusing model and related parameters of a single paraboloid.
Electronics 14 04389 g001
Figure 2. The feed defocusing model and related parameters of dual parabolic cylinders (top view).
Electronics 14 04389 g002
Figure 3. Simulation and calculation results of the absolute phase response when DFx = 0.01 m, DFy = 0 m, and DFz = 0 m. (a) Formula calculation result of the central section in the quiet zone; (b) simulation and calculation results of the horizontal line on the central section; (c) simulation and calculation results of the vertical line on the central section.
Electronics 14 04389 g003
Figure 4. Simulation and calculation results of the absolute phase response when DFx = 0 m, DFy = 0.01 m, and DFz = 0 m. (a) Formula calculation result of the central section in the quiet zone; (b) simulation and calculation results of the horizontal line on the central section; (c) simulation and calculation results of the vertical line on the central section.
Electronics 14 04389 g004
Figure 5. Simulation and calculation results of the absolute phase response when DFx = 0 m, DFy = 0 m, and DFz = 0.01 m. (a) Formula calculation result of the central section in the quiet zone; (b) simulation and calculation results of the horizontal line on the central section; (c) simulation and calculation results of the vertical line on the central section.
Electronics 14 04389 g005
Figure 6. Normalized formula calculation results of phase characteristics at different defocusing distances when defocusing in a single direction. (a) Horizontal line on the central section when defocusing in the single x direction; (b) horizontal line on the central section when defocusing in the single z direction; (c) vertical line on the central section when defocusing in the single y direction; (d) vertical line on the central section when defocusing in the single z direction.
Electronics 14 04389 g006
Figure 7. Simulation and calculation results of the absolute phase response when DFx = 0.01 m, DFy = 0 m, and DFz = 0 m. (a) Formula calculation result of the central section in the quiet zone; (b) simulation and calculation results of the horizontal line on the central section; (c) simulation and calculation results of the vertical line on the central section.
Electronics 14 04389 g007
Figure 8. Simulation and calculation results of the absolute phase response when DFx = 0 m, DFy = 0.01 m, and DFz = 0 m. (a) Formula calculation result of the central section in the quiet zone; (b) simulation and calculation results of the horizontal line on the central section; (c) simulation and calculation results of the vertical line on the central section.
Electronics 14 04389 g008
Figure 9. Simulation and calculation results of the absolute phase response when DFx = 0 m, DFy = 0 m, and DFz = 0.01 m. (a) Formula calculation result of the central section in the quiet zone; (b) simulation and calculation results of the horizontal line on the central section; (c) simulation and calculation results of the vertical line on the central section.
Electronics 14 04389 g009
Figure 10. Normalized formula calculation results of phase characteristics at different defocusing distances when defocusing in a single direction. (a) Horizontal line on the central section when defocusing in the single x direction; (b) horizontal line on the central section when defocusing in the single y direction; (c) vertical line on the central section when defocusing in the single y direction; (d) vertical line on the central section when defocusing in the single z direction.
Electronics 14 04389 g010
Figure 11. Equivalent pitch tests of the target under measurement in a single paraboloid. (a) Downward pitch test for conventional case; (b) downward pitch test for equivalent case; (c) upward pitch test for conventional case; (d) upward pitch test for equivalent case.
Electronics 14 04389 g011
Figure 12. Phase distribution of tilted sections for a single paraboloid. (a) Tilted-backward section for conventional downward pitch test; (b) tilted-backward section for equivalent downward pitch test; (c) tilted-forward section for conventional upward pitch test; (d) tilted-forward section for equivalent upward pitch test.
Electronics 14 04389 g012
Figure 13. Phase distribution of tilted sections for dual parabolic cylinders. (a) Tilted-backward section for conventional downward pitch test; (b) tilted-backward section for equivalent downward pitch test; (c) tilted-forward section for conventional upward pitch test; (d) tilted-forward section for equivalent upward pitch test.
Electronics 14 04389 g013
Table 1. Calculation results for feed defocusing positions of a single paraboloid (Unit: m).
NO. 1NO. 2NO. 3NO. 4NO. 5NO. 6NO. 7NO. 8NO. 9NO. 10
x00.01000.01000.01000.01000.01000.01000.01000.01000.01000.0100
y0−0.0001−0.0002−0.0002−0.0001−0.0007−0.00080.0001−0.0006−0.0001−0.0003
z08.48338.48378.48388.48368.48388.48358.48388.48348.48388.4832
Table 2. Calculation results for feed defocusing positions of dual parabolic cylinders (Unit: m).
NO. 1NO. 2NO. 3NO. 4NO. 5NO. 6NO. 7NO. 8NO. 9NO. 10
x05.68125.68045.67995.68035.68005.68155.68035.68065.68155.6817
y011.753511.754211.753211.754111.754811.753711.754311.753511.754411.7546
z00.00020.0004−0.00020.0008−0.00040.0005−0.0005−0.00010.0002−0.0003
Disclaimer/Publisher’s Note: The statements, opinions and data contained in all publications are solely those of the individual author(s) and contributor(s) and not of MDPI and/or the editor(s). MDPI and/or the editor(s) disclaim responsibility for any injury to people or property resulting from any ideas, methods, instructions or products referred to in the content.