Article

An Intelligent Suppression Method for Interference Pulses in Partial Discharge Detection of Transformers Based on Waveform Feature Recognition

1
State Grid Zhejiang Electric Power Co., Ltd., Quzhou Power Supply Company, Quzhou 324002, China
2
State Key Laboratory of Electrical Insulation and Power Equipment, Xi’an Jiaotong University, Xi’an 710049, China
*
Author to whom correspondence should be addressed.
Electronics 2025, 14(22), 4380; https://doi.org/10.3390/electronics14224380
Submission received: 9 October 2025 / Revised: 30 October 2025 / Accepted: 2 November 2025 / Published: 10 November 2025
(This article belongs to the Special Issue Polyphase Insulation and Discharge in High-Voltage Technology)

Abstract

High-frequency current detection of partial discharge (PD) at transformers on-site faces complex noise interference, which severely impacts the accuracy of PD detection. To address this issue, an intelligent interference suppression algorithm for PD signals based on adaptive waveform feature recognition is proposed. First, a 10 MHz high-pass filter is applied to eliminate the influence of periodic narrowband interference on the zero-crossing count of the time-series. Non-pulse noise is removed based on the instantaneous zero-crossing density of the signal. Next, the start and end times of each pulse are determined, and the corresponding waveform segments are extracted from the original signal to form a pulse array. Subsequently, waveform features of the pulses are extracted, and discrimination thresholds for the feature parameters are calculated based on univariate analysis. Finally, each pulse is adaptively identified based on its waveform features, and PD signals are screened out. The proposed algorithm was tested using PD signals superimposed with on-site noise as well as field-measured signals. The results demonstrate that the algorithm can intelligently identify PD signals and significantly reduce PD signal attenuation, exhibiting excellent suppression effects on complex noise interference in on-site PD detection at transformers.

Graphical Abstract

1. Introduction

As the core equipment of high-voltage direct current (HVDC) transmission systems, the operational status of transformers directly affects the safe and stable operation of the entire system. Partial discharge (PD) can lead to the aging and degradation of insulation materials, which is a significant cause of insulation failures in equipment and may result in severe safety incidents [1,2]. Accurately detecting PD in transformers can effectively reflect the insulation condition of the equipment, identify potential defects in a timely manner, and is of great significance for ensuring the safety of the equipment and the reliable operation of the system [3,4,5].
Pulse current wideband detection is a widely used method for on-site PD detection in transformers [6]. However, due to the complex electromagnetic environment of substation, the high-frequency current signals of PD collected on-site are often accompanied by severe noise interference, including white noise, periodic narrowband interference, and random pulse interference [7]. These noise interferences may obscure the PD signals, significantly affecting the accuracy of PD detection. Therefore, effectively removing noise interference is key to achieving accurate PD detection.
Typical noise suppression methods include FFT digital filtering, wavelet threshold denoising (WTD), empirical mode decomposition (EMD) denoising, and singular value decomposition (SVD) denoising [8,9,10,11]. In response to the noise interference in high-frequency current detection of PD, many scholars have conducted in-depth research and improved traditional methods. For example, Liu et al. proposed a method based on the minimum entropy deconvolution filtering of the FFT spectrum of discharge signals to suppress periodic narrowband interference, which directly extracts interference components using classical threshold criteria without involving the selection of energy windows [12]. Li et al. proposed a PD noise filtering method based on improved SVD theory and VMD. This method can eliminate periodic narrowband interference and white noise in different PD signals of cavity discharge, corona discharge, and those from the motors’ coil [13]. Hua et al. proposed a two-step denoising algorithm, where the preliminary denoising is achieved using the VMD-LB algorithm, followed by a secondary denoising using the PSO-WTD algorithm. The method can effectively remove the white noise and recover the PD signal more accurately [14]. These studies have achieved certain results, but during the decomposition of noisy signals, it is difficult to completely separate the discharge signal components from the noise components, and some overlap still exists. As a result, while removing noise components, these methods often cause loss of discharge signal components, leading to attenuation of the amplitude and distortion of the waveform of the PD signals after denoising, resulting in the loss of discharge information and reduced accuracy of PD detection.
To address these challenges, this paper proposes an intelligent interference suppression method for PD pulse current signals in transformers based on pulse waveform recognition. The method extracts each pulse waveform from the noisy signal and identifies them according to the waveform characteristics of PD signals. Ultimately, noise interference is eliminated while preserving the PD signals, thereby achieving effective noise suppression. Experimental results demonstrate that this method adaptively removes noise interference while effectively preserving the energy of the PD signals.

2. Adaptive Suppression Algorithm for Periodic Pulsation Interference

The denoising algorithm proposed in this paper involves two steps, which are constructing a pulse array and identifying PD pulses. First, non-pulse noise is removed based on the instantaneous zero-crossing density of the time-series to construct the pulse array. Then, by extracting the waveform features of each pulse, PD signals are identified while interference pulses are eliminated. The flowchart of the denoising algorithm is shown in Figure 1.

2.1. Construction of the Pulse Array

2.1.1. Instantaneous Zero-Crossing Density of the Time-Series

To construct a pulse array by extracting all pulse waveforms from a noisy signal, it is first necessary to determine the start and end times of each pulse. However, the presence of non-pulse noise, such as white noise and periodic narrowband interference, complicates this task, as the signal amplitudes at the pulse boundaries are not zero, making them difficult to identify. Traditional methods typically rely on setting amplitude thresholds to determine the start and end times, but any deviation in the threshold selection can lead to significant errors in pinpointing these moments. White noise generally exhibits small amplitudes and appears as rapid fluctuations around the zero axis in the time domain. In contrast, pulse waveforms have higher amplitudes and significantly longer rise times compared to white noise, resulting in fewer zero-crossings within the same time interval. Based on these distinct time-domain characteristics, the instantaneous zero-crossing density of the time series can be utilized to differentiate between pulse waveforms and non-pulse noise.
The instantaneous zero-crossing density of a time series refers to the ratio of the number of times the signal crosses the zero axis, thereby changing its sign, to the total number of data points within a short time interval. To calculate this, a fixed-size rectangular window is applied to the signal sequence x(i). The instantaneous zero-crossing density for the k-th window is computed as follows [15]:
Z k = 1 2 N i = ( k 1 ) N + 1 k N sgn x ( i ) sgn x ( i 1 )
where N is the length of the rectangular window, which represents the number of data points within the window, sgn[x] is the sign function, defined as follows:
sgn x = 1 , x 0 1 , x < 0
The size of each window is set to 50 data points. According to (1), the instantaneous zero-crossing density of the time series within each window is calculated. The instantaneous zero-crossing density of white noise is significantly higher than that of pulse waveforms. A threshold of 0.3 is selected as the criterion for the instantaneous zero-crossing density of pulse waveforms. If the value exceeds the threshold, it indicates that no pulse waveform exists within the window, and that segment of the waveform is set to zero for removal. If the value is below the threshold, the segment of the waveform is retained.
The instantaneous zero-crossing density can effectively distinguish between white noise and pulse waveforms. However, periodic narrowband interference is also present in the substation environment. The narrowband interference in the high-frequency current signals collected on-site is primarily composed of carrier communication interference, with frequencies concentrated in the range of several hundred kHz to several MHz [9]. The amplitude of periodic narrowband interference is often greater than that of white noise. When the two are superimposed, the number of zero-crossings in the resulting waveform is significantly reduced compared to white noise, as shown in Figure 2. In this case, it becomes difficult to differentiate between non-pulse noise and pulse waveforms using the instantaneous zero-crossing density.
For high-frequency current detection of PD in converter transformers, medium and shortwave broadcast communication signals are the primary sources of narrowband interference, with frequencies mainly concentrated below 10 MHz. Based on the frequency distribution characteristics of narrowband interference in high-frequency current signals, a high-pass filter with a cutoff frequency of 10 MHz can effectively suppress most periodic narrowband interference while avoiding the complete removal of PD signals, as illustrated in Figure 3. Although the pulses may experience attenuation and distortion after filtering, the 10 MHz high-pass filter does not alter the start and end times of each pulse. After filtering, non-pulse noise and pulse waveforms can still be distinguished based on the instantaneous zero-crossing density, allowing for the accurate determination of the start and end times of each pulse. Based on these start and end times, the corresponding waveforms before high-pass filtering can be extracted from the original signal. Therefore, this step does not affect the accurate extraction of the pulse waveform.

2.1.2. Extraction of Pulse Waveforms

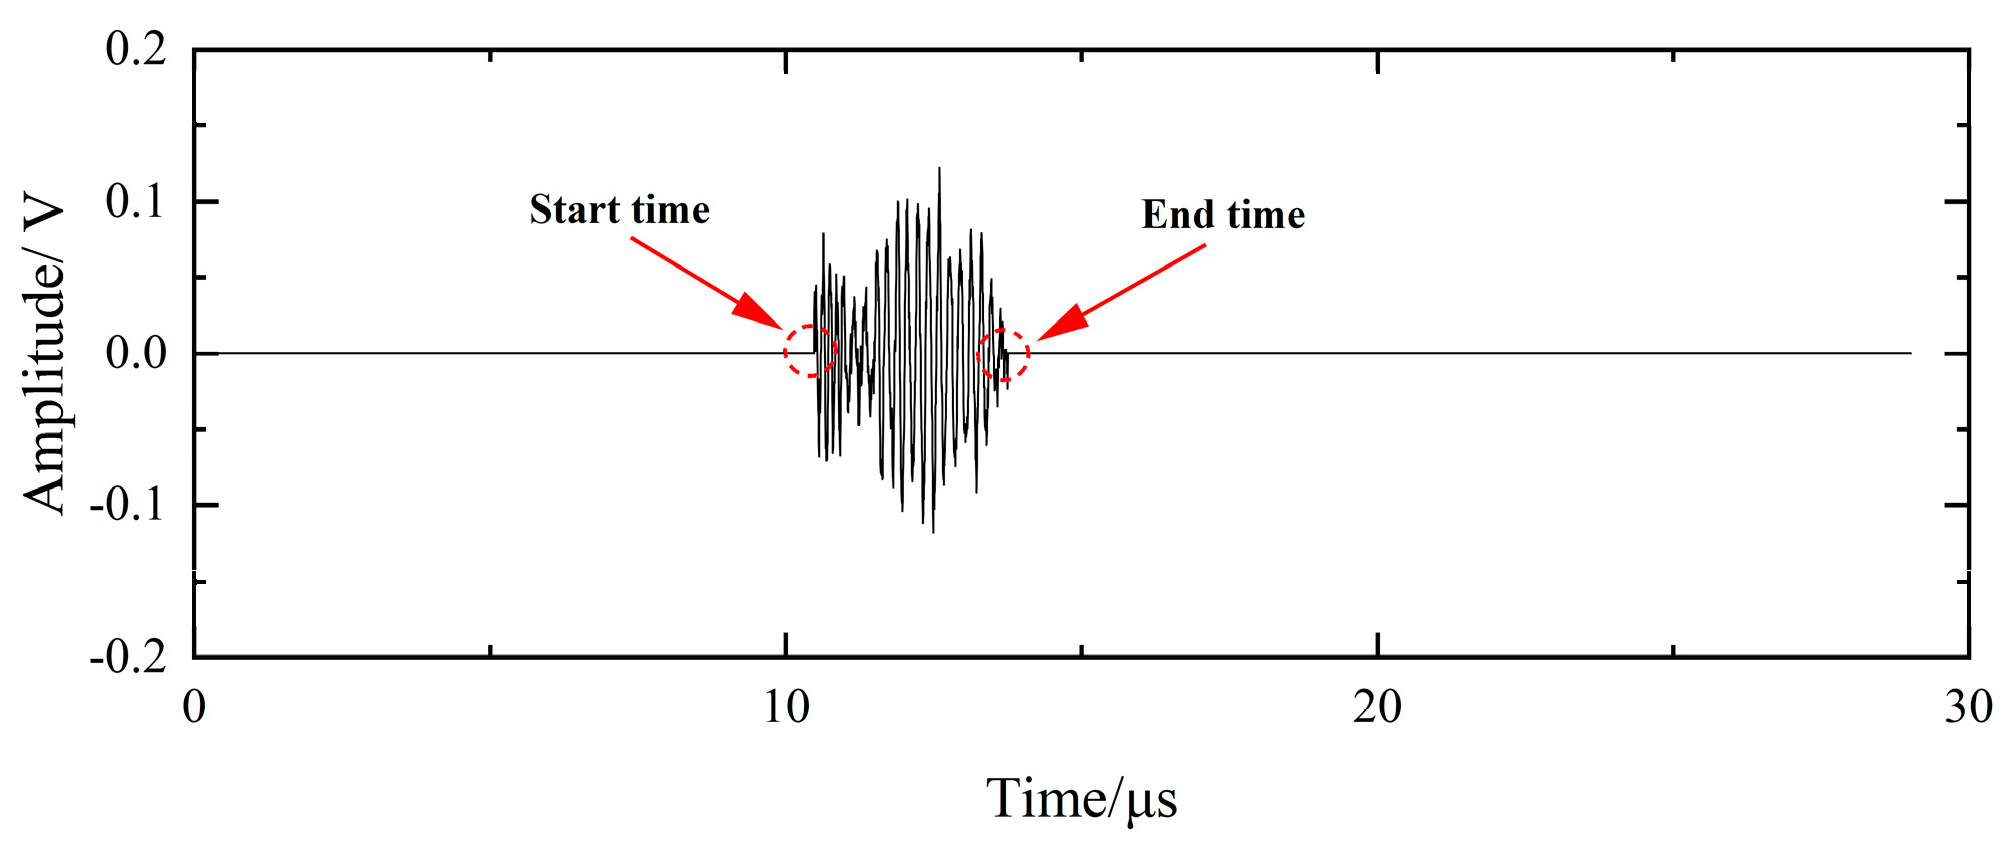
The aforementioned steps suppress the influence of periodic narrowband interference and, based on the instantaneous zero-crossing density, set the amplitude of non-pulse segments to zero, thereby eliminating noise between individual pulse waveforms, as shown in Figure 4.
At this point, the start and end times of each pulse waveform can be determined using the following formula:
x ( { i s n } ) = x ( { i s n } 1 ) = 0 x ( { i s n } + 1 ) 0 ( n = 1 , 2 , 3 , )
x ( { i e n } ) = x ( { i e n } + 1 ) = 0 x ( { i e n } 1 ) 0 ( n = 1 , 2 , 3 , )
where {isn} represents the set of data points corresponding to the start times of all pulse waveforms; {ien} represents the set of data points corresponding to the end times of all pulse waveforms.
In the previous step, while high-pass filtering removes narrowband interference, it also eliminates the low-frequency components of the pulses, causing distortion. To ensure the undistorted extraction of PD signals, the waveforms corresponding to the time intervals of each pulse waveform are extracted from the original time-series x(i), which has not been high-pass filtered, based on their start and end times. Subsequently, all pulse waveforms are arranged according to their occurrence times, ultimately structuring the pulse array p(i), as shown in Equation (5):
p ( i ) = x ( i ) , i s n i i e n 0 , i en < i < i s ( n + 1 )

2.2. Identification of PD Pulses

2.2.1. Extraction of Waveform Features

In the pulse array obtained through the aforementioned steps, besides the PD signals, there is also random pulse interference. Random pulse interference is generally caused by the operation of switching equipment, as well as discharges from the line or other nearby equipment. Their time-domain waveforms typically exhibit high symmetry between the positive and negative half-cycles, and their spectral components are relatively simple. In contrast, typical PD pulses usually show asymmetry between the positive and negative half-cycles. The waveform first exhibits a rising edge with a higher amplitude, followed by a gradual decay into low-frequency oscillations with lower amplitudes. There are significant differences in the waveforms of the two types of signals. Based on the waveform characteristics of PD pulses, identification criteria are established to adaptively recognize each pulse waveform in the pulse array. Pulse waveforms that do not meet the criteria are removed, ultimately filtering out the PD pulses.
Considering the complex and diverse waveforms of random pulse interference, relying on a single waveform feature is insufficient to effectively filter out all interferences. This paper adopts a multi-feature joint approach to enhance the accuracy of identification. The extracted waveform features not only exhibit significant distinguishability between the two types of signals but also reflect the common characteristics of different PD signals. To this end, the following features are selected for joint identification of the pulses:
(1)
Waveform Polarity Deviation Ratio (WPDR).
The waveforms of the positive and negative half-cycles of PD pulses measured on-site at the substation exhibit asymmetry, meaning there is a difference in the amplitudes of the maximum and minimum values. This characteristic is described by the WPDR:
WPDR = p ( i ) max + p ( i ) min min p ( i ) max , p ( i ) min
where p(i)max and p(i)min represent the maximum and minimum values of a single pulse waveform, respectively.
(2)
Peak Time Ratio (PTR)
The maximum value of a PD pulse typically appears in the front segment of the entire pulse waveform, often as the first or second peak of the signal, while the moment when the maximum value of random pulse interference occurs is random. This characteristic can be described using the PTR:
PTR = t max T
where tmax represents the moment when the maximum value of the pulse occurs within the entire pulse waveform, and T is the total duration of the entire pulse waveform.
(3)
Peak Interval Ratio (PIR)
The rising edge of the PD pulse waveform exhibits a high-frequency characteristic, whereas the front-end waveform of random pulse interference may manifest as low-frequency oscillations. Based on this distinction, the relationship between the occurrence times of the first three peaks in a pulse is described by the PIR.
PIR 1 = t 1 T PIR 2 = t 2 t 1 T PIR 3 = t 3 t 2 T
where t1, t2, and t3 represent the occurrence times of the first, second, and third peaks, respectively, within the entire pulse waveform.

2.2.2. Waveform Feature Identification

Using 200 collected PD pulses of different types and 200 interference pulses from various substation sites as sample data, the aforementioned waveform features were calculated. The average values of the two types of signals are shown in Table 1.
The results indicate that there are significant differences in the average values of the waveform characteristics between the two types of signals. To effectively identify PD signals based on waveform features, the univariate analysis method is adopted to calculate the discrimination thresholds for the two types of signals across each waveform feature. Univariate analysis is a global optimization method based on individual features [16]. Its core idea is to traverse all possible split points for each feature and select the split point that minimizes the Gini index as the discrimination threshold. The specific steps are as follows:
(1)
Traverse Features. For each feature fi (i = 1, 2, …, 5), traverse all possible split points t.
(2)
Calculate Gini Index. For each split point t, divide the dataset into a left subset (fit) and a right subset (fi > t), and calculate the weighted Gini index [17]:
Gini ( t ) = n L n Gini L + n R n Gini R
where nL and nR are the number of samples in the left and right subsets, respectively, n is the total number of samples, and GiniL and GiniR are the Gini indices of the left and right subsets, calculated as:
Gini = 1 k = 1 K p k 2
where pk is the proportion of the k-th class in the current subset.
(3)
Select Optimal Threshold. Choose the split point t* that minimizes the Gini index as the global discrimination threshold for feature fi:
t * = arg min t Gini ( t )
As shown in Table 1, compared to interference pulses, PD signals exhibit a higher value in the WPDR feature but lower values in the other features. Therefore, the WPDR of PD signals will be greater than the discrimination threshold, while the PTR, PIR1, PIR2, and PIR3 will be less than their respective discrimination thresholds. By comprehensively evaluating multiple characteristics, it can effectively remove random pulse interference while minimizing the impact of deviations caused by the randomness of individual PD pulse waveforms, thereby ensuring a more robust and accurate identification of PD signals. The judgment conditions for PD pulses are as follows:
WPDR   >   0 . 50 PTR   <   0 . 28 PIR 1 < 0.13 PIR 2 < 0.15 PIR 3 < 0.12
Finally, the waveforms in the pulse array are judged one by one. The pulses that fully satisfy the judgment conditions are completely retained and arranged according to their occurrence times in the original signal. This reconstruction yields the time-domain waveform of the denoised signal, thereby completing the entire process of adaptive noise interference suppression. The signal identification method based on waveform characteristics can effectively distinguish PD signals from random pulse interference while improving the computational efficiency of the algorithm, which is particularly beneficial for large datasets.

3. Suppression of On-Site Noise Interference in PD Signals

3.1. Acquisition of PD Signals

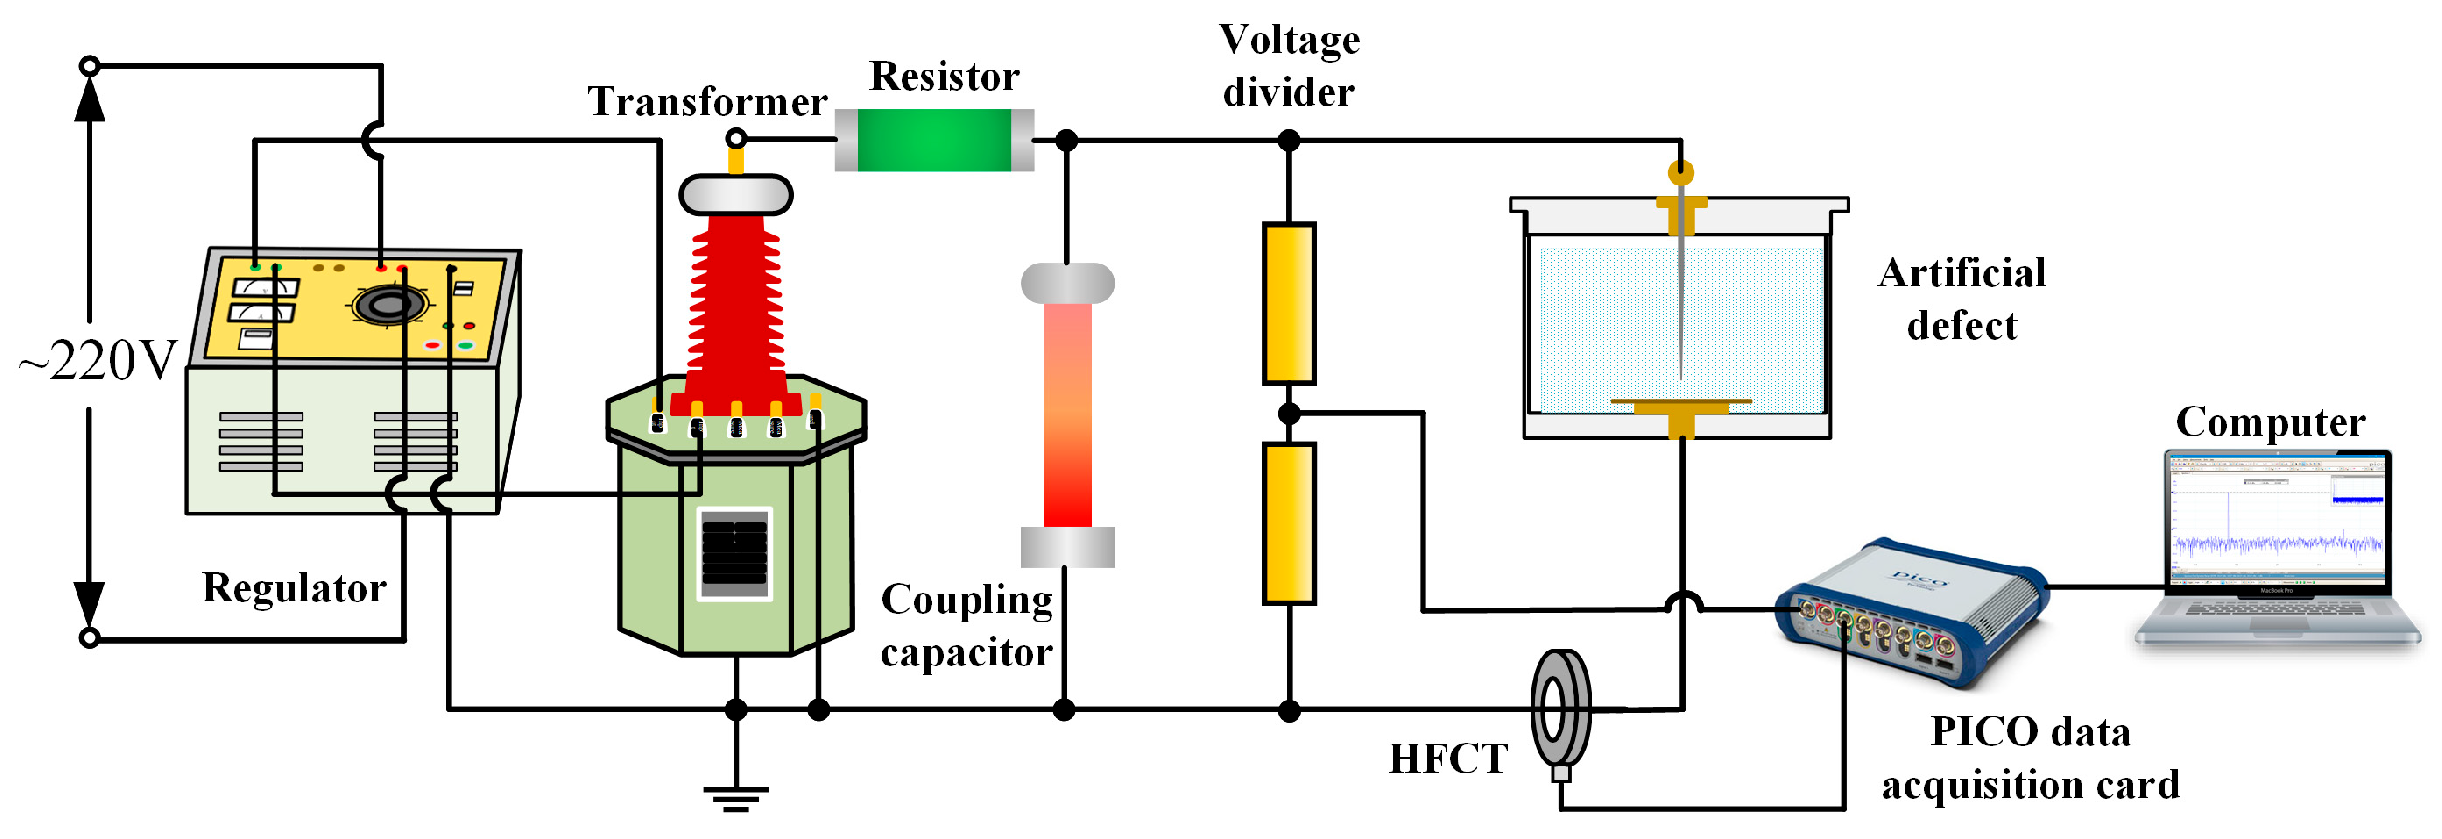
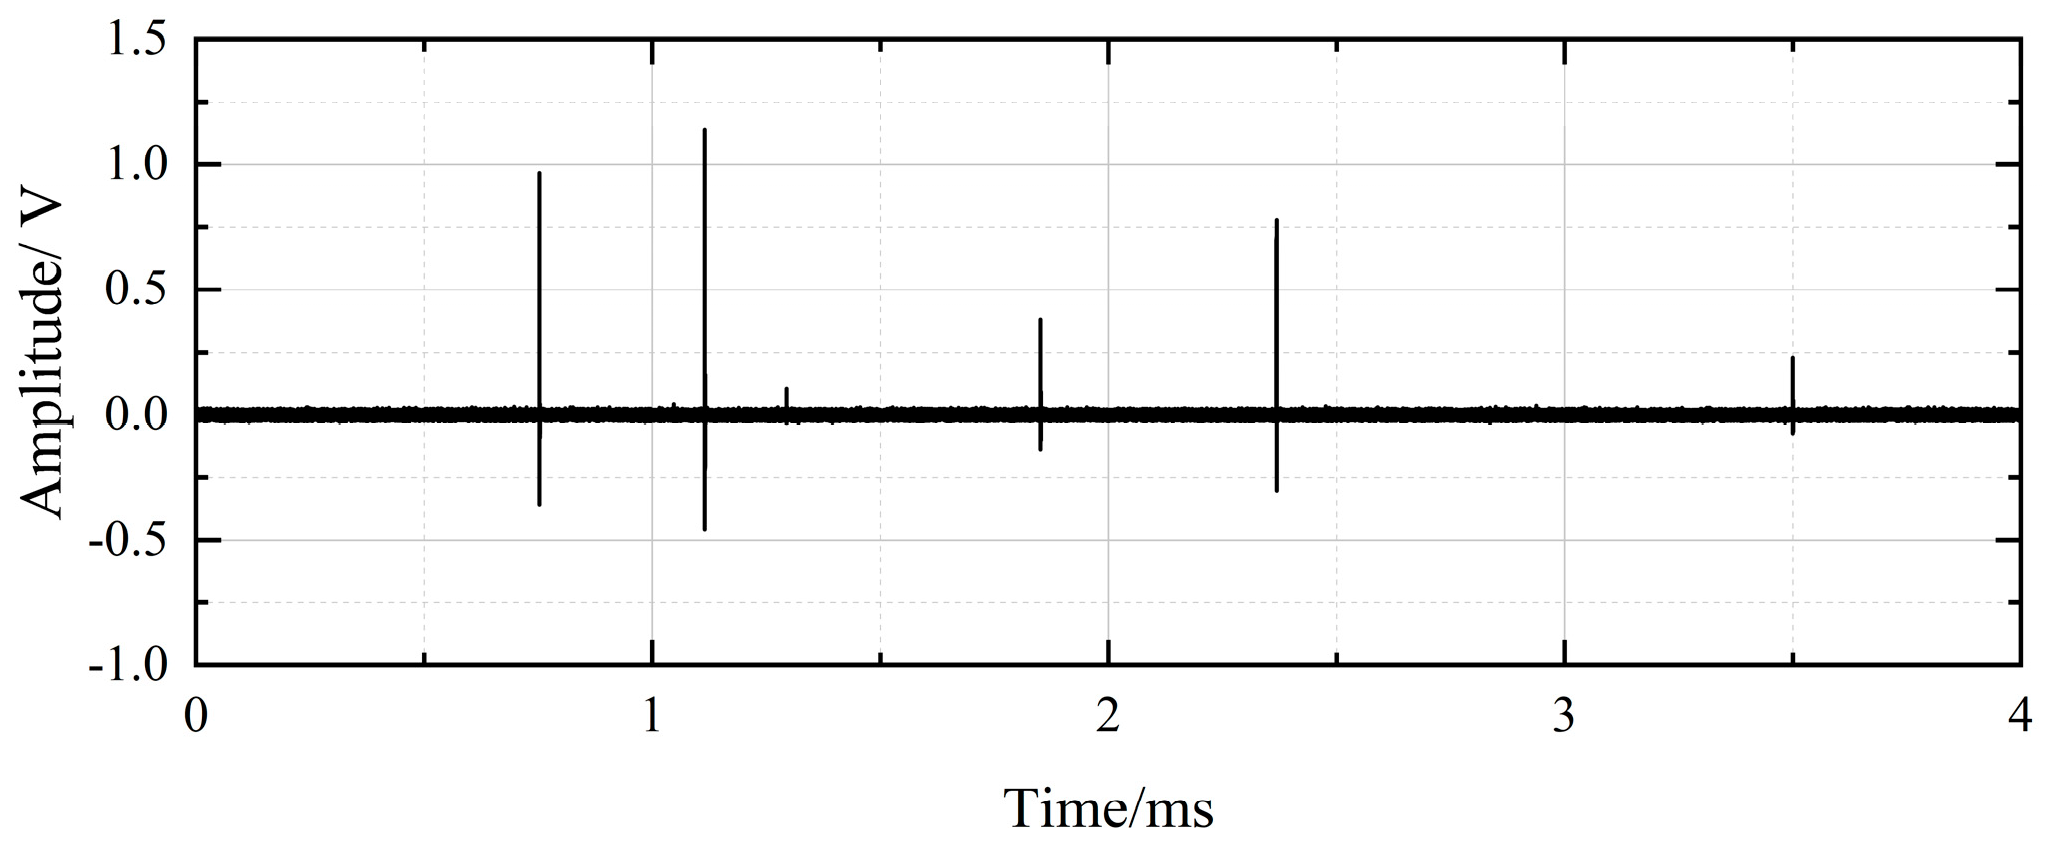
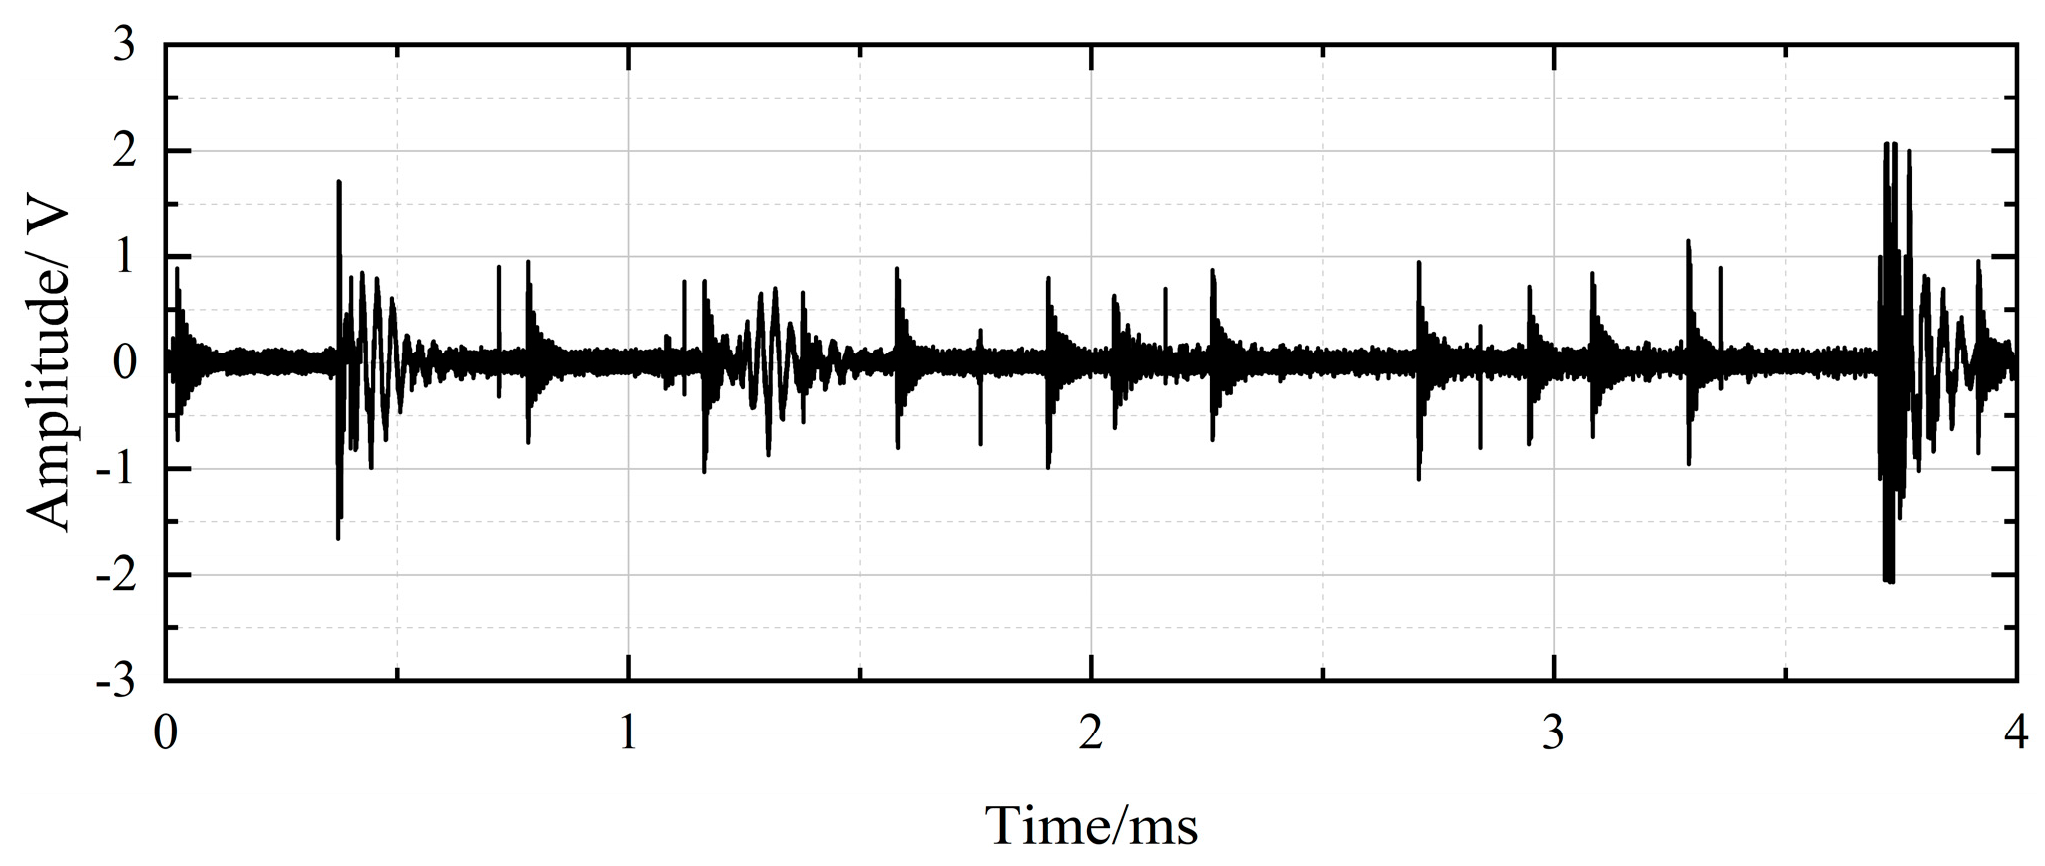
In the laboratory, a PD signal acquisition circuit was constructed as shown in Figure 5. The high-voltage needle electrode was made of tungsten and polished multiple times to achieve a smooth surface, with a curvature radius of 30 μm. The ground electrode was a flat plate, on which a layer of oil-impregnated insulating cardboard was fixed to prevent breakdown between the two electrodes. The distance between the needle electrode and the insulating cardboard was set at 10 mm. A PD-free AC test transformer was utilized to supply voltage to the defect, while a current-limiting resistor with a resistance of 5 MΩ was incorporated to safeguard the experimental setup. A high-frequency current transformer (HFCT), which exhibits a flat frequency response and high frequency gain within the range of 80 kHz to 40 MHz, as well as a PICO acquisition card, was used to measure the high-frequency current. The collected PD signals are shown in Figure 6. The measured signals do not contain the typical interference pulses found in substations, such as those caused by discharges on power lines. Instead, they only include non-pulse noise, such as white noise, whose amplitude is significantly smaller than that of the PD pulses.

3.2. The Denoising Results of On-Site Noise Interference

To validate the effectiveness of the proposed denoising algorithm against on-site noise interference, high-frequency current signals were collected from the core grounding point of a transformer during normal operation at a substation using a high-frequency current transformer. However, during normal operation, the probability of PD occurring in the transformer is low, making it difficult to directly capture PD signals on-site. Nevertheless, since electromagnetic interference is persistent and independent of whether PD occurs within the transformer, the high-frequency current signals measured on-site in the absence of PD can approximate the noise interference encountered in on-site PD detection. By superimposing the PD signals measured in the laboratory with the noise interference collected from the substation, PD signals with superimposed on-site noise interference were constructed, as shown in Figure 7. This method, utilizing real PD signals and on-site noise, can more accurately simulate the PD detection signals in substation environments.
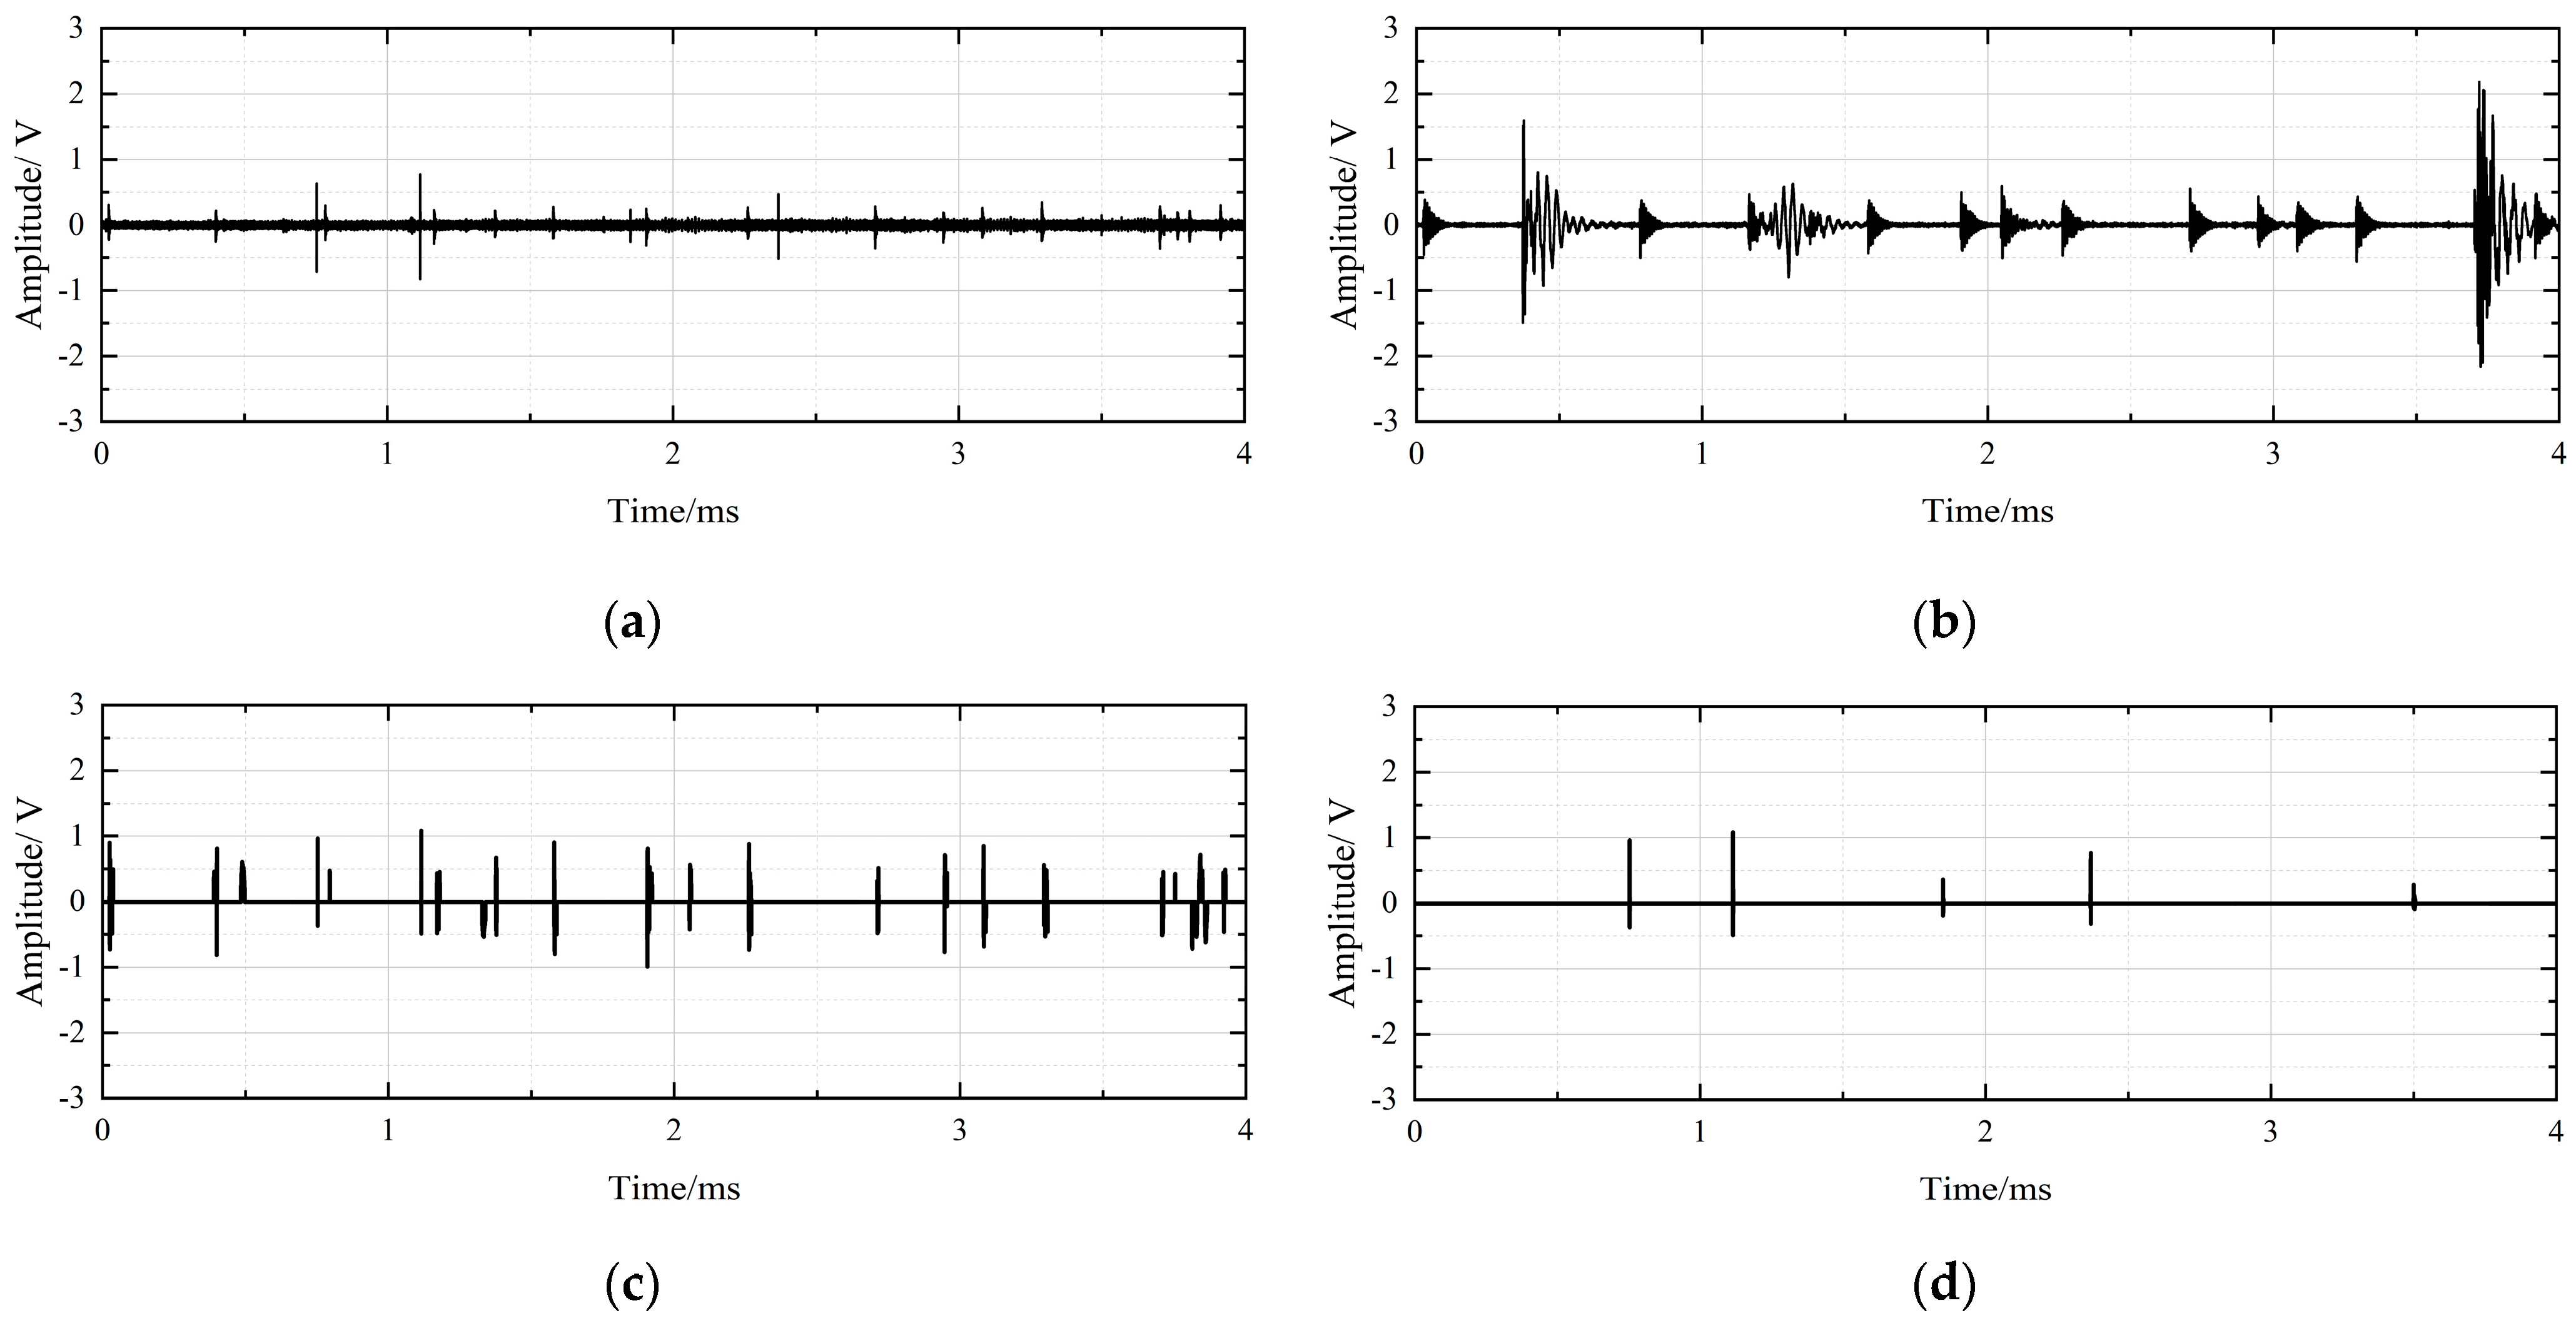
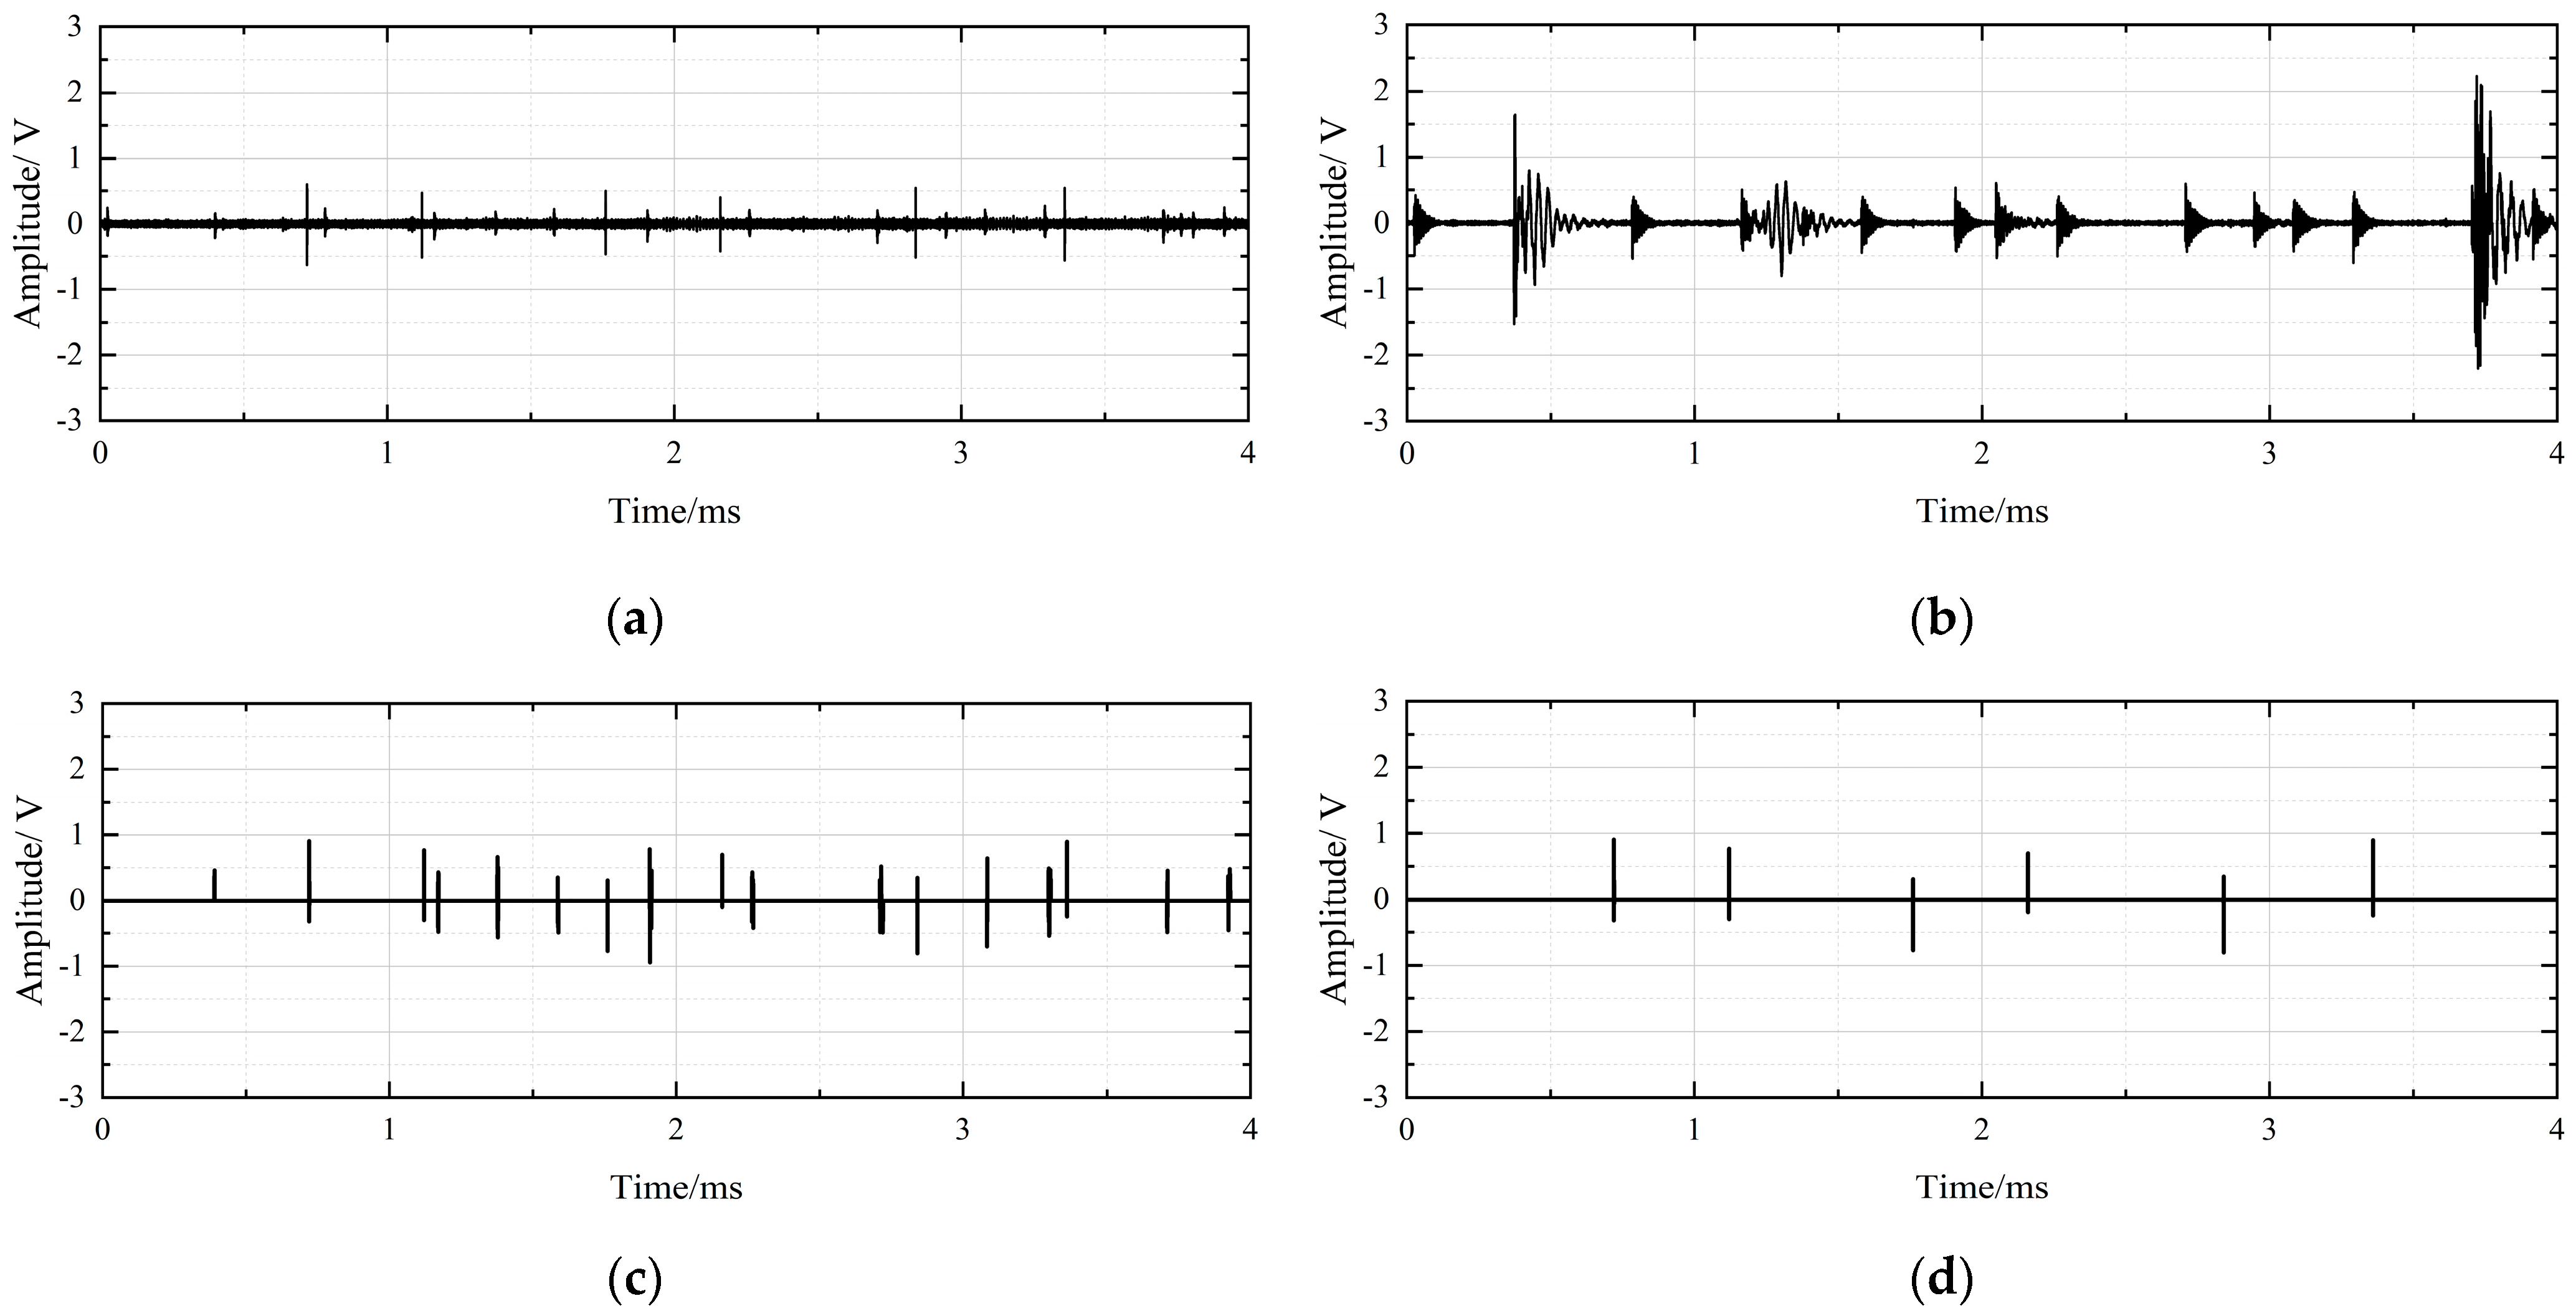
The noisy signal shown in Figure 7 was subjected to denoising using four different methods: a 10 MHz high-pass filter, the VMD-LB-PSO-WTD algorithm [14], the signal separation algorithm based on the time-frequency map (T-F map) [18] and the algorithm proposed in this paper. The denoising performance was quantitatively evaluated using four key metrics: Root Mean Square Error (RMSE), Normalized Cross-Correlation (NCC), Signal to Noise Ratio (SNR), and Noise Reduction Ratio (NRR). These indicators were applied to measure the similarity between the denoised waveforms and the original PD signals. RMSE and NCC are used to quantify the similarity between the denoised signal and the original PD signal. Specifically, a lower RMSE value and a higher NCC value indicate greater alignment between the denoised signal and the original signal. The SNR is used to assess the intensity of residual noise in the denoised signal, where a higher SNR value signifies less residual noise and more effective denoising. The NRR measures the efficiency of noise filtering, with a higher NRR value indicating a smoother denoised signal and more pronounced noise suppression. The definitions of these metrics are shown in (13) to (16).
R M S E = i = 1 n ( x i y i ) 2 n
N C C = i = 1 n ( x i μ x ) ( y i μ y ) i = 1 n ( x i μ x ) 2 i = 1 n ( y i μ y ) 2
S N R = 10 log 10 i = 1 n x i 2 i = 1 n ( y i x i ) 2
N R R = 10 × ( log 10 σ 1 2 log 10 σ 2 2 )
where {xi} represents the original PD signal sequence without noise; {yi} denotes the denoised signal sequence; n indicates the number of data points in the signal; μx and μy are the arithmetic means of {xi} and {yi}, respectively; σ1 and σ2 represent the standard deviations of the signal before and after denoising, respectively. Since the amplitude of the noise in the signal shown in Figure 6 is significantly smaller than that of the PD pulses, its impact on the amplitude and waveform of the latter can be neglected. Therefore, the signal in Figure 6 is approximated as a noise-free PD signal sequence, and the denoising effectiveness of the algorithm is evaluated using the aforementioned metrics. The results of these denoising processes are illustrated in Figure 8.
The denoising results indicate that the 10 MHz high-pass filter can suppress random pulse interference to some extent. However, due to the overlapping frequency ranges of random pulse interference and PD signals, it is difficult to completely separate the two types of signals. Additionally, the high-pass filter causes significant attenuation of the PD signals. The VMD-LB-PSO-WTD algorithm performs well in removing white noise but has limited effectiveness in suppressing random pulse interference. It may also mistakenly remove PD signals. The signal separation algorithm based on the time-frequency map is more effective in targeting random pulse interference, but noticeable noise residues still remain after denoising. In contrast, the algorithm proposed in this paper not only accurately identifies PD signals and effectively filters out various interferences but also preserves the integrity of PD signals with minimal attenuation during the denoising process. It demonstrates excellent denoising performance for complex interference conditions in substations.
Table 2 presents the calculated results for the four denoising methods. The algorithm proposed in this paper demonstrates significant advantages across all evaluation metrics. The denoised waveform exhibits a high degree of consistency with the original PD signal, effectively preserving its key characteristics. In contrast, other methods fail to accurately identify and eliminate random pulse interference, resulting in noise levels that remain higher than the PD signal after denoising. This adversely affects signal detection and may lead to issues such as misjudgment or missed detection.
To further validate the generality of the proposed method, the needle electrode in the experimental circuit shown in Figure 5 was replaced with a ball electrode to measure surface discharge signals. The measured pulses were then randomly arranged along the time axis. The on-site noise, identical to that in Figure 7, was superimposed to construct the noisy signal, as illustrated in Figure 9. The denoising results using the aforementioned four algorithms are shown in Figure 10.
The results demonstrate that the proposed algorithm significantly outperforms other methods in denoising performance, accurately identifies PD signals, and achieves effective noise suppression for different types of PD signals.

4. Denoising of Field-Measured Signals

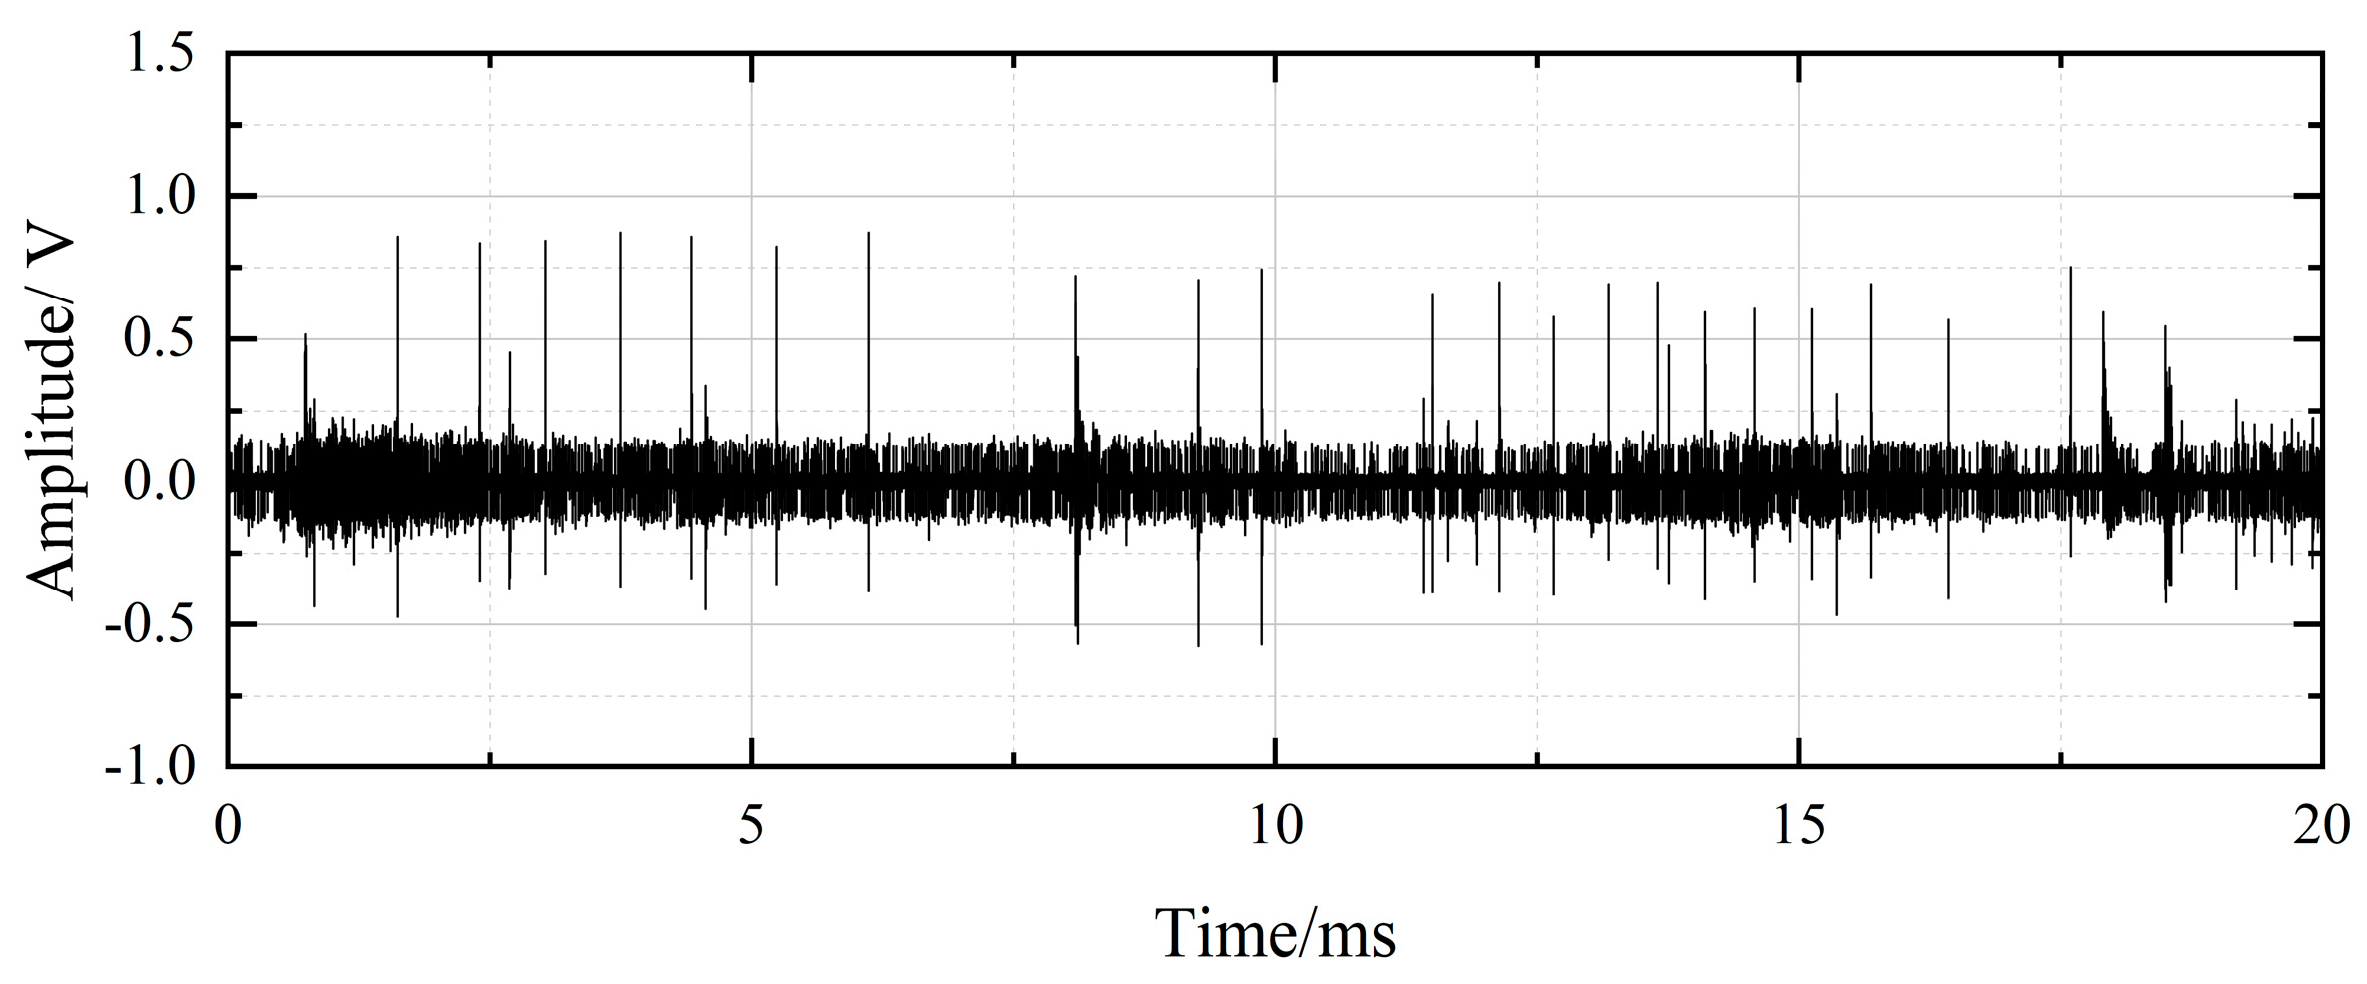
In order to more thoroughly evaluate the denoising performance of the algorithm proposed in this paper, field-measured PD signals from a substation were denoised. Abnormal discharge phenomena were detected in a transformer at a substation, and signals were collected from the transformer core grounding point using HFCT, as shown in Figure 11.
In field-measured signals, significant noise interference is present, with noise amplitudes potentially comparable to those of PD pulses, and frequency ranges that may overlap with those of PD pulses. The denoising process was carried out using the aforementioned four methods, and the results are illustrated in Figure 12.
Since the pure PD pulses are not accessible for direct comparison in the denoising results, the denoising performance can be evaluated by utilizing the sample entropy (SE) as a criterion [19]. SE is a measure used to quantify the complexity and regularity of a time series. A lower SE value indicates that the denoised signal has higher regularity, suggesting successful removal of noise and preservation of the underlying PD patterns. Conversely, a higher SE value implies greater randomness, which may indicate residual noise or distortion of the PD signal. The SE is defined as follows:
SE ( m , r , N ) = ln ( A B )
where m is the embedding dimension, r is the tolerance threshold, N is the length of the time-series, A and B represent the number of template vector pairs within a distance r for m + 1 and m points, respectively, defined as follows:
A = i = 1 N m j = 1 , j i N m d [ x m + 1 ( i ) , x m + 1 ( j ) ] < r B = i = 1 N m j = 1 , j i N m d [ x m ( i ) , x m ( j ) ] < r
where xm(i) is a template vector of length m, d[x(i), x(j)] represents the distance between vectors, defined as follows:
x m ( i ) = [ x ( i ) , x ( i + 1 ) , , x ( i + m 1 ) ]
d [ x ( i ) , x ( j ) ] = max k = 0 , 1 , m 1 [ x ( i + k ) x ( j + k ) ]
The SE of the denoising results for the four denoising algorithms was calculated separately, and the results are shown in Table 3.
The denoising results indicate that high-pass filtering is unable to remove interference pulses that overlap with the frequency of PD signals, while also causing attenuation of the PD pulses. The VMD-LB-PSO-WTD algorithm fails to specifically suppress interference pulses and leads to significant attenuation and distortion of the PD pulses. The signal separation algorithm based on the time-frequency map can avoid the attenuation of PD signals but is unable to identify noise interference with similar time-frequency characteristics, resulting in a substantial amount of residual noise. In contrast, the proposed algorithm can more effectively identify and distinguish PD signals from noise interference, completely preserving the PD signals, and demonstrates excellent denoising performance for PD signals under complex interference conditions in substations.

5. Conclusions

This paper proposes an intelligent suppression method for noise interference in PD signals based on waveform characteristics adaptive recognition. Denoising processing was performed on PD signals superimposed with on-site noise interference and field-measured signals, leading to the following conclusions:
(1)
The instantaneous zero-crossing density of white noise is greater than that of pulse waveforms. However, the presence of periodic narrowband interference can significantly reduce the instantaneous zero-crossing density of the noise signal. By using a 10 MHz high-pass filter, the impact of periodic narrowband interference on the instantaneous zero-crossing density of non-pulse noise signals can be effectively eliminated.
(2)
The Waveform Polarity Deviation Ratio, Peak Time Ratio, and Peak Interval Ratio effectively distinguish PD signals from interference pulses while capturing the common characteristics of different PD signals. Adaptive calculation of discrimination thresholds for individual features using univariate analysis enables rapid and accurate identification of PD pulses.
(3)
The proposed algorithm effectively suppresses noise interference while significantly reducing the attenuation of PD signals. It adaptively calculates threshold parameters and intelligently identifies PD signals, making it suitable for the rapid suppression of complex noise interference in on-site PD detection at substations.

Author Contributions

Conceptualization, S.C. and Z.L.; methodology, Z.X. and Z.W.; software, Z.L.; validation, H.W., X.W. and W.X.; formal analysis, R.Y.; investigation, Z.W. and S.C.; data curation, X.W. and H.W.; writing—original draft preparation, Z.L. and Z.X.; writing—review and editing, S.C.; visualization, R.Y.; supervision, H.M. All authors have read and agreed to the published version of the manuscript.

Funding

The authors declare that this study received funding from State Grid Zhejiang Electric Power Co., Ltd., Quzhou Power Supply Company under Contract SGZJQZ00BDJS2500924. The funder had the following involvement with the study: conducting experimental measurements, participating in method design, data analysis, algorithm validation, and other related work.

Data Availability Statement

The original contributions presented in the study are included in the article; further inquiries can be directed to the corresponding author.

Conflicts of Interest

Author Shaoyu Chen, Ziyue Xu, Zhulu Wang, Hongli Wang, Xinjian Wu, Ran Yao and Weidong Xie were employed by State Grid Zhejiang Electric Power Co., Ltd., Quzhou Power Supply Company. The remaining authors declare that the research was conducted in the absence of any commercial or financial relationships that could be construed as a potential conflict of interest.

References

  1. Mahmud, S.; Chen, G.; Golosnoy, I.O.; Chen, G.; Wilson, G.; Jarman, P. Bridging phenomenon in contaminated transformer oil. In Proceedings of the 2012 IEEE International Conference on Condition Monitoring and Diagnosis, Bali, Indonesia, 23–27 September 2012; pp. 180–183. [Google Scholar]
  2. Li, Q.; Li, S.; Si, W. Analysis of the key problem about insulation condition assessment of oil-paper in power transformers based on partial discharge. High Volt. Eng. 2017, 43, 2558–2565. Available online: http://dianda.cqvip.com/Qikan/Article/Detail?id=672917476&from=Qikan_Search_Index (accessed on 1 November 2025).
  3. Duan, L.; Hu, J.; Zhao, G.; Chen, K.; He, J.; Wang, S.X. Identification of partial discharge defects based on deep learning method. IEEE Trans. Power Deliv. 2019, 34, 1557–1568. [Google Scholar] [CrossRef]
  4. Liao, R.; Yang, L.; Li, J.; Grzybowski, S. Aging condition assessment of transformer oil-paper insulation model based on partial discharge analysis. IEEE Trans. Dielectr. Electr. Insul. 2011, 18, 303–311. [Google Scholar] [CrossRef]
  5. Hussein, R.; BashirShaban, K.; El-Hag, A.H. Denoising of acoustic partial discharge signals corrupted with random noise. IEEE Trans. Dielectr. Electr. Insul. 2016, 23, 1453–1459. [Google Scholar] [CrossRef]
  6. Hussain, M.R.; Refaat, S.S.; Abu-Rub, H. Overview and partial discharge analysis of power transformers: A literature review. IEEE Access 2021, 9, 64587–64605. [Google Scholar] [CrossRef]
  7. Zhong, J.; Bi, X.; Shu, Q.; Zhang, D.; Li, X. An improved wavelet spectrum segmentation algorithm based on spectral kurtogram for denoising partial discharge signals. IEEE Trans. Instrum. Meas. 2021, 70, 3514408. [Google Scholar] [CrossRef]
  8. Luo, X.; Niu, H.; Hu, R.; Liu, F.; Wu, J. A modified method of suppressing narrow-band interference using fast fourier transform power spectrum. Proc. CSEE 2013, 33, 167–175. Available online: http://dianda.cqvip.com/Qikan/Article/Detail?id=45614426&from=Qikan_Article_Detail (accessed on 1 November 2025).
  9. Zhong, J.; Bi, X.; Shu, Q.; Chen, M.; Zhou, D.; Zhang, D. Partial discharge signal denoising based on singular value decomposition and empirical wavelet transform. IEEE Trans. Instrum. Meas. 2020, 69, 8866–8873. [Google Scholar] [CrossRef]
  10. Chan, J.; Ma, H.; Saha, T.; Ekanayake, C. Self-adaptive partial discharge signal de-noising based on ensemble empirical mode decomposition and automatic morphological thresholding. IEEE Trans. Dielectr. Electr. Insul. 2014, 21, 294–303. [Google Scholar] [CrossRef]
  11. Ashtiani, M.; Shahrtash, S. Partial discharge de-noising employing adaptive singular value decomposition. IEEE Trans. Dielectr. Electr. Insul. 2014, 21, 775–782. [Google Scholar] [CrossRef]
  12. Fan, G.; Liu, S.; Liu, W.; Wang, L. Suppression of the periodic narrow-band noise in discharge signal by FFT spectrum minimum entropy deconvolution filtering. High Volt. Eng. 2017, 43, 1378–1385. Available online: http://dianda.cqvip.com/Qikan/Article/Detail?id=671862401&from=Qikan_Search_Index (accessed on 1 November 2025).
  13. Lei, Z.; Wang, F.; Li, C. A denoising method of partial discharge signal based on improved SVD-VMD. IEEE Trans. Dielectr. Electr. Insul. 2023, 30, 2107–2116. [Google Scholar] [CrossRef]
  14. Hua, X.; Mu, H.; Jin, L.; Ji, Y.; Zhan, J.; Shao, X.; Zhang, G. A novel adaptive parameter optimization method for denoising partial discharge ultrasonic signals. IEEE Trans. Dielectr. Electr. Insul. 2023, 30, 2734–2743. [Google Scholar] [CrossRef]
  15. Maresch, K.; Freitas-Gutierres, L.; Oliveira, A.; Borin, A.; Cardoso, G.; Damiani, J.; Morais, A.; Correa, C.; Martins, E. Advanced diagnostic approach for high-voltage insulators: Analyzing partial discharges through zero-crossing rate and fundamental frequency estimation of Acoustic Raw Data. Energies 2023, 16, 6033. [Google Scholar] [CrossRef]
  16. Sahoo, N.; Salama, M.; Bartnikas, R. Trends in partial discharge pattern classification: A survey. IEEE Trans. Dielectr. Electr. Insul. 2005, 12, 248–264. [Google Scholar] [CrossRef]
  17. Yao, R.; Li, J.; Hui, M.; Bai, L.; Wu, Q. Feature selection based on random forest for partial discharges characteristic set. IEEE Access 2020, 8, 159151–159161. [Google Scholar] [CrossRef]
  18. Imburgia, A.; Di Fatta, A.; Romano, P.; Rizzo, G.; Li Vigni, V.; Ala, G. A study on partial discharges pattern recognition under DC voltage through clustering algorithms and cross-correlation filter. IEEE Trans. Dielectr. Electr. Insul. 2023, 30, 2543–2550. [Google Scholar] [CrossRef]
  19. Ardilla-Rey, J.; Rivera-Caballero, O.; Boya-Lara, C. Sample Entropy as a Performance Indicator of UHF Real Signal Denoising from Partial Discharges. IEEE Trans. Dielectr. Electr. Insul. 2025, 32, 1333–1342. [Google Scholar] [CrossRef]
Figure 1. Algorithm flowchart.
Electronics 14 04380 g001
Figure 2. Schematic diagram of the instantaneous zero-crossing density of a time series. (a) Without periodic narrowband interference; (b) With superimposed periodic narrowband interference.
Electronics 14 04380 g002
Figure 3. Schematic of the instantaneous zero-crossing density of the signal after high-pass filtering.
Electronics 14 04380 g003
Figure 4. Start and end times of the pulse waveform.
Electronics 14 04380 g004
Figure 5. PD signals acquisition circuit.
Electronics 14 04380 g005
Figure 6. Measured PD signals.
Electronics 14 04380 g006
Figure 7. PD signals with field noise interference.
Electronics 14 04380 g007
Figure 8. Denoising results of PD signals with superimposed on-site noise interference. (a) 10 MHz high-pass filter; (b) VMD-LB-PSO-WTD; (c) T-F map; (d) The proposed algorithm.
Electronics 14 04380 g008
Figure 9. The surface discharge signals with field noise interference.
Electronics 14 04380 g009
Figure 10. Denoising results of surface discharge signals with superimposed on-site noise interference. (a) 10 MHz high-pass filter; (b) VMD-LB-PSO-WTD; (c) T-F map; (d) The proposed algorithm.
Electronics 14 04380 g010
Figure 11. The field-measured signals.
Electronics 14 04380 g011
Figure 12. Denoising results of field-measured signals. (a) 10 MHz high-pass filter; (b) VMD-LB-PSO-WTD; (c) T-F map; (d) The proposed algorithm.
Electronics 14 04380 g012
Table 1. The average values of the calculation results for the waveform features.
Waveform FeaturePD SignalsInterference Pulses
WPDR0.600.30
PTR0.190.42
PIR10.080.18
PIR20.100.17
PIR30.060.15
Table 2. Evaluation of the denoising effect of the different denoising methods.
MethodRMSENCCSNR/dBNRR
10 MHz high-pass filter0.02400.2432−8.01118.45
VMD-LB-PSO-WTD0.19050.0002−26.010.6138
T-F map0.06160.0359−16.2110.46
The proposed algorithm0.00790.87691.64430.21
Table 3. SE of denoising results of the different denoising methods.
MethodSE
10 MHz high-pass filter5.4065
VMD-LB-PSO-WTD0.4511
T-F map0.0031
The proposed algorithm0.0001
Disclaimer/Publisher’s Note: The statements, opinions and data contained in all publications are solely those of the individual author(s) and contributor(s) and not of MDPI and/or the editor(s). MDPI and/or the editor(s) disclaim responsibility for any injury to people or property resulting from any ideas, methods, instructions or products referred to in the content.