Abstract
This paper introduces a new analytical model of a multi-service system to which a heterogeneous mixture of stream, elastic, and adaptive traffic is offered, corresponding to data streams transmitted in real-world networks. The heterogeneity results from the coexistence of compressed and non-compressed traffic classes, where the compressed traffic is subject to a finite compression mechanism and includes both elastic and adaptive traffic. The model accounts for access constraints on resources for stream traffic, a strategy frequently used in modern ICT networks to manage the impact of high-rate data streams on overall system performance. The proposed model is developed based on an analysis of the service process within the system using multi-dimensional Markov processes. To assess the accuracy of the analytical model, a digital simulation is conducted. A comparative analysis of the results obtained from the analytical model and the simulation experiments confirms the high accuracy and robustness of the proposed approach, making it suitable for the design and optimization of modern ICT networks, including 5G systems.
1. Introduction
In modern telecommunications and computer networks, packet transmission, based on Internet Protocol version 4 (IPv4) and 6 (IPv6), is a standard transmission technique at the network layer (defined in the Open Systems Interconnection (OSI) model). Through diverse traffic management mechanisms, virtually any data stream can be transmitted while satisfying the requisite quality of service (QoS) requirements. The QoS parameters, including transmission bitrate, latency, jitter, and related metrics, are determined by the services provided to network users. The telecommunications services market is undergoing dynamic evolution, significantly driven by technological advancements and the development of mobile networks. Mobile networks, specifically, have evolved substantially from networks limited to voice connections (1G, 2G) to broadband access networks (4G, 5G).
The ongoing deployment of 5G networks represents a significant step forward, extending services that were previously limited to wired networks. Network resource management, using a method commonly known as network slicing, facilitates the creation of dedicated network slices tailored to predefined service requirements. Within 5G networks, three main service slices have been defined, characterized by traffic attributes such as transmission speed, reliability, and latency. These slices include an ultra-Reliable Low Latency Communications (uRLLC) slice, which supports services demanding both low latency and high reliability. Another slice is a massive Machine Type Communications (mMTC) slice, designed for applications that require low bitrates and low transmission intensity. It enables extended operational lifespans for a wide array of battery-powered terminals. The final primary slice is an enhanced Mobile Broadband (eMBB) slice, which supports services requiring exceptionally high data transmission rates and computational resources for near-real-time information processing. Its performance is largely independent of user density.
From a traffic engineering perspective, the realization of a service within a predefined service slice involves the transmission of a data stream with specific requirements. The boundary values of the traffic parameters are determined by the characteristics of the services provided within the slice, while the exact values in each case are specified in the Service Level Agreement (SLA) between the slice tenant and the 5G network operator [1]. The parameters and their values are specified in the 5G system specification [2]. As a result, a single slice may accommodate services from multiple service slices, each with distinct traffic characteristics. For example, services generated by diverse industrial sectors may belong to different 5G slices. In the context of an autonomous vehicle, passengers can simultaneously access multiple network slices. The autonomous vehicle connects to the network via vehicle-to-everything (V2X) communication [3], while a passenger may initiate an HD video streaming or Internet of Medical Things (IoMT) services using the vehicle’s onboard system. V2X and IoMT communication demands ultra-low latency but does not necessarily require high throughput, whereas the HD video streaming requires a high data rate but is more tolerant of latency. Consequently, the V2X and IoMT communication services and HD video streaming services are allocated to separate network slices, for example, the uRLLC slice and the eMBB slice, respectively.
Currently, 5G mobile communication networks are being deployed globally; however, concurrently, requirements for next-generation 6G networks are being formulated and developed. 6G networks are anticipated to enable data transmission at even higher speeds and within a fully distributed environment. Regardless of the type of next-generation network architecture, service execution is intrinsically linked to the transmission of packet streams with defined QoS parameters. An analysis of modern service transmission mechanisms and their associated requirements allows classification of packet streams as follows:
- Streams with a constant bitrate (CBR), which ensure data transmission with minimal latency and high reliability. These stream parameters remain constant over time, and the traffic they generate is called stream traffic. In 5G networks, this traffic is primarily associated with the uRLLC slice, including applications in sectors such as healthcare (remote operations, diagnostics, medical rescue), transportation (autonomous vehicle operation, traffic management), and industry (production process control) [4].
- Streams with a variable bitrate (VBR), which can be categorized as follows:
- –
- Packet streams that require the transmission of their entire data volume to complete a service, utilizing variable bitrates influenced by temporary fluctuations in system load. These fluctuations in transmission rates, which correlate with extended transmission times, result from either specific characteristics of the user application or from the dynamics of the transport layer protocol. These streams are classified as elastic traffic and are generated by applications that are not time-critical, including file transfers, email delivery, smart metering, and industrial monitoring.
- –
- Packet streams that require transmission within specific time intervals, using variable bitrates that depend on temporary variations in system load. These streams are characterized by fixed transmission times and are susceptible to data loss during periods of increased system congestion. The traffic generated by these streams is referred to as adaptive traffic. Applications generating adaptive traffic include online streaming services that require consistent, low-latency data transfer, and have the ability to adjust bitrates at the cost of service quality—such as changing video codec parameters during streaming. This type of traffic is typical of real-time audio and video services, including immersive entertainment, online gaming, and video streaming.
In modern communication systems, traffic heterogeneity arises from the coexistence of multiple service types and data compression mechanisms. The proposed model integrates stream traffic with traffic that undergoes compression mechanism, including elastic and adaptive types of traffic, which reflect different levels of compression efficiency and service elasticity. This multi-service representation enables the analysis of resource sharing between compressed and non-compressed traffic under finite compression constraints.
In the literature, two main types of compression mechanism are considered: threshold and thresholdless compression. The thresholdless compression mechanism dynamically adjusts the bitrate during traffic stream servicing. Conversely, the threshold compression mechanism uses access functions to establish and maintain a constant compression level for traffic stream service time. It is noteworthy that each slice of the radio interface can be modeled as a multi-dimensional system, encompassing both scenarios of operation: with and without compression mechanisms. This conceptual model of the 5G network is illustrated in Figure 1, where the parameter () represents the capacity of the ith slice of radio interface.
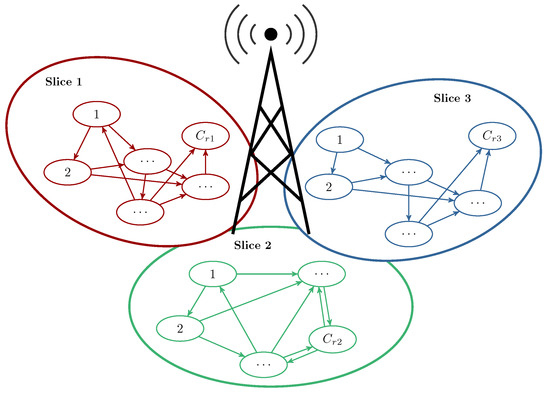
Figure 1.
Process of occupation resources in 5G network radio interface slices.
Research Contribution
The primary research contribution of this paper is the development of a multi-service system model that simultaneously services stream traffic and traffic subjected to compression mechanism, addressing the significant gap in the field. The theory of multi-service systems has evolved in response to engineering demands. The earliest models considered the simultaneous servicing of two traffic streams within the network (narrowband and broadband, e.g., [5]), preceding their widespread practical implementation. The advent of integrated services networks, such as Integrated Services Digital Network (ISDN) and, subsequently, Asynchronous Transfer Mode (ATM), enabled the development of analytical models for multi-service systems, encompassing both full-access and limited-access configurations (e.g., [6,7,8,9]). These models were subsequently extended to incorporate systems employing dedicated access mechanisms, including reservation mechanisms (e.g., [10,11]) and threshold-based mechanisms (e.g., [12,13]). Furthermore, multi-service models for cellular networks, incorporating load-balancing mechanisms (e.g., [13]) and overflow mechanisms ([14,15]), were also investigated. Concurrently, it became necessary to model the Internet, specifically multi-service systems modeling traffic with compression mechanisms. This initiated research on multi-service systems with elastic traffic ([16]) and, later, with both elastic and adaptive traffic (e.g., [17]). The logical consequence of this research is the development of a model with elastic, adaptive, and stream traffic. Such a model is presented in this paper. The main achievements of this paper are as follows:
- This research presents a novel analytical model, based on a reversible two-dimensional Markov process, that accurately represents a system that simultaneously services a mixture of stream traffic (not subject to finite compression mechanism) and elastic and adaptive traffic (subject to finite compression mechanism). The inclusion of stream traffic represents a shift in the approach to determining the compression ratio within the system, given that the resources occupied by stream traffic are not subject to a compression mechanism. Consequently, the maximum compression coefficient is higher than in a system with the same capacity but without stream traffic. To the authors’ knowledge, the model proposed in this paper is the first to offer a coherent and integrated approach to modeling all three of these traffic types that coexist within contemporary network architectures, including 5G networks.
- This paper presents a novel and precise method for determining the compression coefficient, explicitly taking into account the resources occupied by stream services. By employing a two-dimensional occupancy distribution, the proposed method effectively divides the total system resources into those occupied by stream calls and those occupied by elastic or adaptive calls. This division enables the precise determination of the compression ratio for all occupancy states. To the authors’ knowledge, this method for determining the compression ratio has not been previously employed in the analysis of systems servicing a mixture of stream, elastic, and adaptive traffic.
- To ensure the reliable servicing of traffic subject to compression, the proposed model incorporates a dedicated mechanism. This mechanism centers on the introduction of an occupancy limit, denoted as R, for stream calls. This limit serves a dual purpose: first, it provides the resources needed to service compressed traffic; second, it regulates the blocking probability across all traffic classes within the system.
- The service process analysis in the proposed system results in a recursive probability distribution, aligning with the standard analytical techniques for modeling multi-service systems, and validating the theoretical assumptions made.
The subsequent sections of this paper are organized as follows: Section 2 provides a review of the relevant literature. Section 3 presents the proposed analytical model, including a formal parametrization of stream, elastic, and adaptive traffic. Section 4 provides a comparative analysis of analytical and simulation results, followed by a discussion. Finally, Section 5 summarizes the paper’s findings and outlines potential directions for future research.
2. Related Works
The literature presents a variety of analytical models for full-available systems (e.g., links), incorporating both threshold and thresholdless compression mechanisms based on stochastic processes, particularly Markov chains. In [12], a foundational model of a full-available system with threshold compression was introduced, designed to service a finite mixture of Erlang traffic streams. The work presented in [18,19] further developed the model to analyze threshold systems for Engset traffic. Moreover, in [13], a generalized multi-threshold system model, designed to service a mixture of Engset, Erlang, and Pascal traffic streams, was developed and presented. Furthermore, in [20], a threshold compression mechanism with hysteresis was introduced, in which bitrate variations were dependent on the direction of system load fluctuations.
In addition to research on systems with threshold compression mechanisms, studies have also addressed systems with thresholdless compression. In [16], the first multi-service model of a link with a finite compression mechanism for a mixture of Erlang elastic traffic was proposed. The concept of finite compression involves introducing a constraint designed to prevent the reduction of requested resources, such as bitrate, below a predefined threshold. This implies that elastic traffic streams will be accepted for service as long as their admission does not lead to resource consumption that would necessitate reducing existing allocations below this established threshold/minimum. Consequently, finite compression ensures a guaranteed lower bound for bitrate reduction for serviced elastic traffic streams. In contrast, the model proposed by [21] assumes the possibility of unlimited compression, which leads to the reduction of serviced stream bitrates to near-zero values. Subsequent research generalized the model presented in [16] to service a mixture of Erlang elastic and adaptive traffic streams [17], Engset traffic [22], and other traffic types [19], including batched Poisson process call streams [23]. Analytical models of queuing systems with an unlimited compression mechanism were also developed. These models include the first multi-service queuing models for elastic traffic [24], and elastic and adaptive traffic [25].
The application of Markov processes in ICT system analysis moves beyond evaluating service throughput requirements. In [26], such an analysis was used to improve both performance and energy efficiency in virtual machine allocation schemes within Cloud Radio Access Networks (C-RANs). In [27], a novel mechanism for Beyond 5G (B5G) networks was proposed, which enables network-initiated user equipment detection and wake-up via Paging Occasions (POs). This mechanism, grounded in Markov chain theory, achieves up to 40% energy savings compared to existing solutions. In [28], Markov-based mathematical modeling was used to analyze an algorithm designed for efficient backup creation in cloud computing environments, further demonstrating the efficacy of Markov processes.
In addition to system-level and algorithmic analysis, Markov-based models have also been applied to represent the stochastic behavior of network traffic. In [29], a hierarchical Markov Modulated Poisson Process model was proposed to characterize in-turn traffic exhibiting burstiness and long-range dependence, providing a more accurate representation than traditional Poisson or Erlang-based approaches. In [30], a Markov-based approach for characterizing and predicting mobile-application traffic was presented, where different activity states such as idle, burst, and streaming were represented as transitions in a discrete-time Markov chain. The analytical potential of Markov processes for modeling self-similar and long-range dependent network traffic was further demonstrated in [31], which introduced a Markovian framework capable of generating self-similar traffic patterns and reproducing the statistical characteristics observed in real communication systems. In [32], a Markov approach was applied to macroscopic vehicular traffic, introducing two-dimensional stationary distribution estimated from real trajectory data. In [33], a three-dimensional Markov-based classifier for Wi-Fi traffic was developed, exploiting packet-level features such as bitrate, inter-arrival time, and packet rate.
In [34], a two-state Markov chain was employed to develop an error model for 5G networks, characterizing the statistical properties of the network’s error process. In [35], a handover algorithm utilizing a Markov chain predictor was developed, which determined transfer timing and location, thereby reducing unnecessary transfers. This approach prioritizes sustained vehicle connectivity to the 5G base station, thereby enhancing network performance. Furthermore, in [36], Markov chains were applied to analyze the physical infrastructure of cloud computing from an Infrastructure as a Service (IaaS) perspective.
Regarding multi-service system modeling, in [37], a model of a full-available system was proposed, concurrently servicing a mixture of stream traffic and elastic traffic subject to finite compression mechanism. To the authors’ knowledge, an analytical model of the system to which stream, elastic, and adaptive traffic is offered, where elastic and adaptive traffic are subject to finite compression, remains unexplored; thus, this paper presents this model. The proposed model considers the influence of stream traffic on the maximum compression coefficient for elastic and adaptive traffic streams. Additionally, it introduces the capability to limit resources allocated to stream traffic, thereby preventing stream traffic from fully occupying resources and ensuring service availability for traffic subject to compression. The analytical modeling results were validated through simulation experiments for a selection of systems.
3. An Analytical Model of a Multi-Service System with Finite Compression Mechanism and Stream Traffic
3.1. Traffic Parametrization
For the purposes of the model, a call (often referred to in the literature as a flow) is defined as a stream of packets associated with a given service. Numerous studies have shown that call-level traffic can be approximated by Poisson processes, e.g., [19,38], which allows the analysis of service processes in multi-service systems using multi-dimensional Markov processes. However, this approach requires the assumption of constant bitrate (CBR) for individual call streams. Because, in practice, most packet streams exhibit variable bitrates (VBRs), methods have been developed to determine CBR representations of such streams. Required CBR values are most commonly determined either based on the peak bitrates of real VBR packet streams or on the so-called equivalent bandwidth (EB) [39,40]. It should be noted that the former approach may lead to system overdimensioning, as the peak values of VBR streams are typically short-lived. Nevertheless, most recent studies recommend selecting a CBR equivalent to the maximum bitrate of the call, e.g., [19,21,41,42]. However, this approach, while simple, may lead to inefficient resource utilization.
A more realistic estimation of CBR values can be achieved through parametrization based on equivalent bandwidth. In this case, CBR values are estimated using algorithms that take into account parameters such as peak and average bitrate, bitrate variance, maximum acceptable packet delay, and/or other parameters defined by the network operator, e.g., [43,44,45,46,47]. It is important to emphasize that the choice of algorithm for determining CBR based on equivalent bandwidth does not affect the system modeling approach, only its parametrization.
In this study, the call arrival stream is assumed to follow a Poisson process, and the service time distribution is considered exponential. Such an assumption is commonly adopted in multi-service system research in the general case, that is, when the average traffic intensity of individual traffic classes remains constant over time. Given these assumptions, and considering that each call is represented by a CBR corresponding to a defined EB, the traffic offered to the multi-service system can be described by the following parameters:
- m—the number of all call classes offered to the system.
- —intensity of the call of class i .
- —service intensity of a call of class i .
- —demanded bitrate (equivalent CBR) for a call of class i .
- —allocation unit, the greatest common divisor for the demanded bitrates of all traffic classes offered to the system [43]:
- —the number of resources necessary to set up a call of class i :
- —average traffic intensity of a call of class i (determined in relation to calls) :
- —average traffic intensity of a call of class i (determined in relation to AUs):
- V—total bitrate of the system .
- C—total capacity of the system :
3.2. Stream, Elastic, and Adaptive Traffic
This section introduces an analytical model of a multi-service system with a real capacity of AUs. It is assumed that stream call classes, elastic call classes, and adaptive call classes are offered to the system (see Figure 2). Furthermore, elastic and adaptive traffic are subject to the finite compression mechanism. In systems employing this mechanism, the maximum compression coefficient, , is defined. This coefficient determines the analytical capacity of the system, , as given by
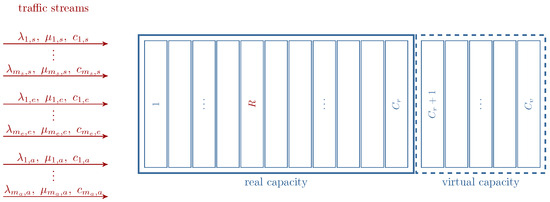
Figure 2.
Diagram of a multi-service system with the real and virtual capacity.
The analytical capacity () provides an analytical extension to the real capacity of the system. Consequently, the difference, , represents the virtual capacity (area) of the system. The introduction of analytical capacity allows the following interpretation of the compression mechanism: the compression mechanism is not activated until the total allocated resources exceed . When the total allocated resources exceed , the compression mechanism is activated, and elastic and adaptive calls are compressed until the total uncompressed allocated resources do not exceed . The total number of occupied AUs is defined as the sum of uncompressed resource demands of all call classes offered to the system. Furthermore, to ensure that stream calls do not prevent service availability for compressed calls, the parameter R () is introduced to cap the maximum resources allocated to stream calls.
Given the preceding assumptions, the service process of the system under consideration is characterized as follows:
- Stream calls are lost when insufficient resources are available for connection establishment. Specifically, a stream call is rejected if, upon admission attempt, either the total resources occupied by stream calls would exceed R, or the total occupied resources would exceed .
- For elastic and adaptive calls, if the available resources are insufficient to admit a new call, the compression mechanism is applied to all currently serviced elastic and adaptive calls, including the incoming call. This process reduces the resource demanded by these calls, enabling the admission of a new call, provided the aggregate uncompressed resource demand for all calls, including the new one, does not exceed . Otherwise, the new call is rejected. In addition to reducing the resource demand of elastic and adaptive calls, activation of the compression mechanism may also lead to an increase in service time. Compression does not affect the service time of adaptive calls; however, for elastic calls, its activation extends the service time.
A common feature of elastic and adaptive calls is the reduction in available resources when system occupancy reaches a level that triggers the compression mechanism. The difference between these two traffic types lies in the treatment of service time. For elastic calls, the compression mechanism cannot reduce the amount of data to be transmitted. Consequently, when available resources decrease, the transmission time of elastic calls must be proportionally extended. This behavior is characteristic of traffic transmitted under the TCP protocol. In contrast, adaptive calls maintain a constant service time, while a reduction in available resources results in a proportional reduction of the transmitted data volume. Such behavior is typical of calls generated by online streaming applications. The distinction between these two call types is further illustrated in Figure 3.
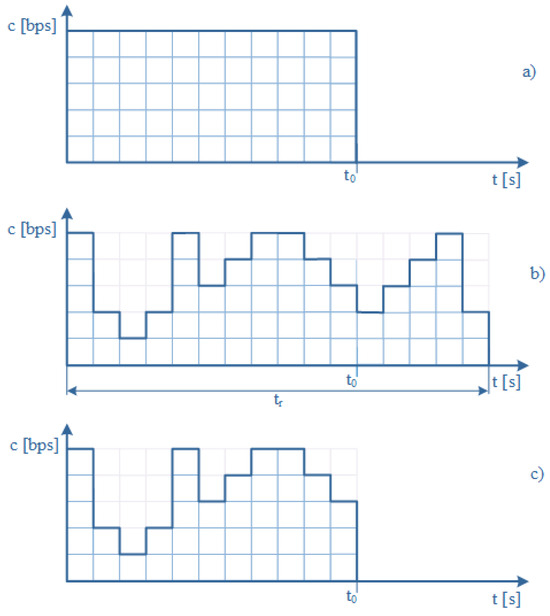
Figure 3.
Traffic types in computer networks: (a) stream (without compression), (b) elastic, (c) adaptive.
Figure 3a illustrates the data transmission process in the absence of compression. For a given transmission rate (allocated resources), the time required to transmit the data equals . In the case of elastic traffic, all data must be transmitted regardless of the available resource reduction. As a result, the transmission time increases to , as shown in Figure 3b. Figure 3c presents the transmission process for adaptive traffic. In this case, variations in the transmission rate do not extend the total transmission time. Instead, the amount of transmitted data is reduced accordingly.
The compression ratio is inversely proportional to the number of AUs occupied by calls subject to the compression mechanism () and decreases with the number of AUs occupied by stream calls (). The ratio ranges from , representing maximum compression, to unity, indicating no compression. Let denote the occupancy state of the system, where AUs are occupied by stream calls and AUs by calls that are subject to compression mechanism (elastic and adaptive calls). Consequently, the compression ratio, , for a system in occupancy state is given by the following equation:
According to the adopted definition of the compression coefficient (Equation (7)), when the number of occupied allocation units (AUs) in the system is less than or equal to (), no compression occurs and the coefficient equals one. As the system occupancy increases (), the compression mechanism becomes active, and the coefficient value is given by Equation (7). In the considered system, the level of compression increases with the number of resources occupied by stream calls. The resources used by these calls cannot be compressed, which explains the difference, , in the numerator of Equation (7). On the other hand, an increasing number of resources occupied by compressed calls also contributes to a higher compression level (the coefficient value decreases). The maximum compression in the system occurs when the number of resources occupied by stream calls reaches R (i.e., all available stream resources are in use) and the number of resources occupied by compressed calls equals . Therefore, the maximum achievable compression in the system is described by Equation (8), for which the compression coefficient takes its minimum possible value:
To illustrate the operation of the system with calls subject to the compression mechanism under the proposed analytical model, consider the following example. An adaptive call, demanding 1 AU for connection setup, is offered to a system with a real capacity of AUs. The maximum compression ratio for the system is assumed to be . The compression mechanism remains inactive when the total occupied AUs are less than or equal to the system’s real capacity (Figure 4a). When AUs are occupied, subsequent call requests are accepted upon activation of the compression mechanism. This mechanism proportionally reduces the AUs allocated to both the currently serviced and the new call, based on the current compression ratio (Equation (7), provided that ). Figure 4b depicts the system’s state after activating the compression mechanism and admitting two additional calls. Using the maximum compression ratio () and Equation (6), the analytical capacity of the system, , for the analytical model is determined to be AUs. The occupied state of the real system that corresponds to the occupied state of the analytical model is shown in Figure 4b.
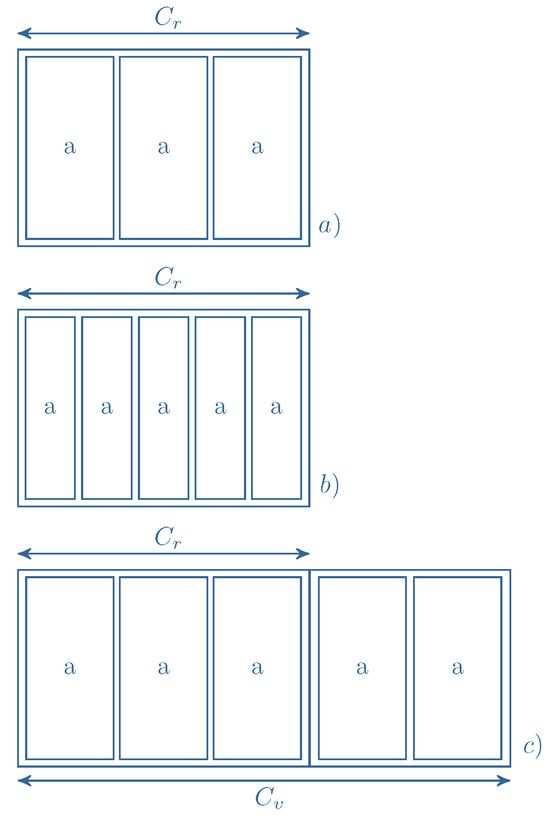
Figure 4.
Systems with compressed traffic: a system without compression mechanism (a), a system with compression mechanism (b), and the equivalent system with virtual capacity considered in the analytical model (c).
The impact of stream calls on the compression ratio is illustrated in Figure 5 and Figure 6. These examples relate to the system shown in Figure 4, where both stream and adaptive calls demand 1 AU for service. Figure 5 presents a scenario with a single stream call being serviced. As stream calls are not subject to the compression mechanism, their resource occupancy remains uncompressed, i.e., the number of AUs they occupy does not change. However, the analytical capacity, , allows two additional calls subject to the compression mechanism to be admitted. Consequently, a maximum of four compressed calls can be serviced, resulting in a compression ratio K of . In the second scenario (Figure 6), two stream calls are present in the system. This leads to a compression ratio of , given the analytical capacity . It is noteworthy that as the number of serviced stream calls increases, the compression ratio decreases, even as the absolute number of compressed calls decreases. Therefore, in the proposed model, the introduction of the limit R for stream calls (defined as the maximum number of AUs that can be allocated to stream calls) enables further control over the system’s compression ratio. In Figure 5 and Figure 6, the R limit is set to 2 AUs.
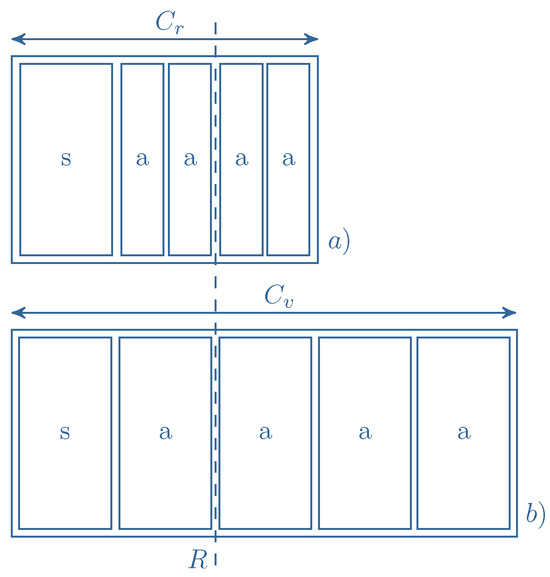
Figure 5.
Compression mechanism in the system with one stream call in service: (a) real capacity of the system, (b) the equivalent system with virtual capacity.
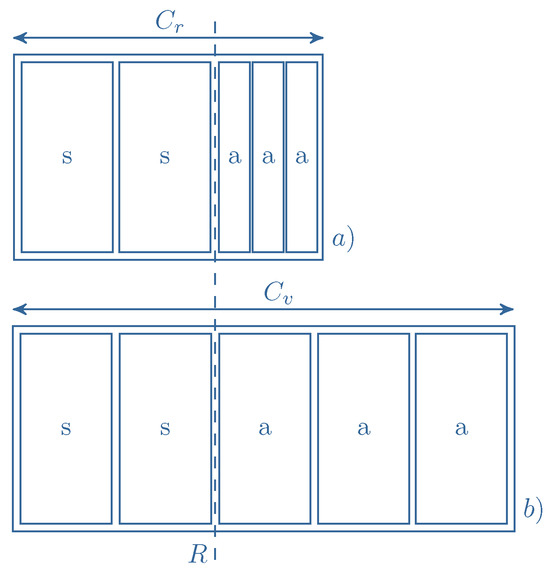
Figure 6.
Compression mechanism in a system with two stream calls in service: (a) real capacity of the system, (b) the equivalent system with virtual capacity.
The service process in multi-service systems can be characterized using the concepts of microstates and macrostates. A microstate is defined as a sequence of natural numbers that specifies the number of calls being serviced for each class within the system. Consequently, a microstate can be expressed as
where denotes the number of calls of class i type u, currently being serviced in the system, where , and s represents stream traffic, e elastic traffic, and a adaptive traffic. For notational brevity, the microstate is denoted as . The total number of AUs occupied by stream calls in microstate , denoted as , is given by
where the parameter represents the number of AUs demanded by a stream call of class i. Similarly, the total numbers of AUs occupied by elastic calls () and adaptive calls () in microstate are expressed as
where and denote the number of AUs demanded by elastic calls of class i and adaptive calls of class i, respectively. The total number of AUs, , occupied by calls subject to the compression mechanism in microstate is, then,
A state space, , of the service process under consideration is defined as
A macrostate is defined on the basis of the total number of AUs occupied in the system by stream calls and calls subject to compression mechanism, without regard to their distribution among individual classes. Therefore, macrostate is determined by the set of microstates in which the total number of AUs occupied by stream calls is equal to , and the total number of AUs occupied by elastic and adaptive calls is equal to :
The adopted definition (15) divides the set of macrostates into two areas: the real area, the area of those macrostates for which , and the compression area, the area of those macrostates for which .
Figure 2 presents a schematic diagram of the multi-service server with the finite compression mechanism. In this figure, the boundary R introduced for stream calls is delineated. Recall that the boundary R represents the maximum number of AUs that can be occupied by stream calls. The value of this parameter influences the maximum compression coefficient within the system. This results from the fact that only the system’s AUs occupied by elastic and adaptive calls participate in the compression process. Resources occupied by stream calls are excluded from this process. Consequently, if stream calls occupy a maximum of R AUs, only AUs remain available for elastic and adaptive calls. Therefore, the maximum compression coefficient is given by Equation (8).
Recall that, given the number of occupied AUs by stream calls and those subject to compression mechanism in a given occupancy state , the compression coefficient is determined by Equation (7).
It is important to emphasize that the compression coefficient depends on the total number of AUs occupied by stream calls and by calls subject to compression mechanism—not on the number of AUs occupied by individual call classes of different traffic types.
Let denote the average traffic intensity of calls of class i type u in microstate , where and . Based on Equation (4), we assume that the average traffic intensity of class i type u in the microstate depends on this microstate in the following way:
where is the number of AUs allocated to the calls of class i type u in microstate , and the offered traffic of class i type u in microstate , , (defined with respect to calls) can be written:
where determines the arrival intensity of calls of class i type u, and determines the service intensity for calls of class i type u in microstate for and . According to the adopted servicing method, the number of demanded AUs and the service intensity for stream traffic calls are constant for each microstate , i.e.,
and
where .
For elastic and adaptive call classes, the demanded number of AUs changes upon exceeding the real capacity of the system, as follows:
where and . The service intensity for elastic traffic classes increases inversely proportionally to the decrease in the demanded number of AUs:
where . For adaptive traffic, the service intensity remains constant for each microstate :
where . Note that both and for depend only on the total number of occupied AUs. Therefore, these parameters take identical values for each microstate belonging to a given macrostate:
for ,
where and ,
for and
for . Applying Equations (17)–(22), Equation (16) yields the following form for stream and elastic traffic:
where and . For adaptive traffic, Equation (16) becomes
where . Consequently, using Equations (23)–(27), the average traffic intensity of class i type u in macrostate is given by
where and .
For adaptive traffic, it can be written as follows:
where .
3.3. Analysis of the Service Process at the Microstate Level
To determine the occupancy distribution within the system, let us consider the service process occurring in three neighboring microstates, as illustrated in Figure 7.

Figure 7.
A fragment of the service process for four adjacent states.
In [25], it is demonstrated that the service process in a multi-service system with elastic traffic is non-reversible in the virtual area. However, let us assume that in a system with stream, elastic, and adaptive traffic, the service process is reversible in both real and virtual areas. The assumption of reversibility implies local balance equations, which, for the neighboring states in Figure 7, take the following form:
for , and where represents the probability of microstate , denotes a single stream call of class i, denotes a single elastic call of class i, and denotes a single adaptive call of class i. By multiplying both sides of Equations (32)–(34) by the respective number of AUs demanded and applying transformations based on Equations (16) and (17), the following solution is obtained:
for and where . Equation (36) does not hold in the virtual area [48]. Consequently, the product in Equations (35)–(37) is replaced with a value (expressed in AUs), which ensures the reversibility of the service process that occurs in the system. Therefore, following this substitution, the parameter for stream, elastic, and adaptive traffic classes is defined by the following formulae:
for and where .
The assumption of service process reversibility implies the independence of the serviced call streams. Consequently, the equations of type (35), the equations of type (36), and the equations of type (37) can be summed. Thus, considering Equations (38)–(40), we obtain
The bracketed summation on the left side of Equation (41) represents the total service stream in microstate , expressed in AUs. This total service stream cannot exceed the real capacity . Consequently, for microstates in which the occupancy does not exceed , the total service stream (expressed in AUs) is equal to (). For microstates with an occupancy exceeding , the total service stream equals . Therefore, the occupancy distribution at the microstate level is given by
where , and the probability of microstate is determined from the normalization condition.
3.4. Analysis of the Service Process at the Macrostate Level
The probability of macrostate , denoted as , represents the occupancy probability of AUs. It is defined as the sum of probabilities of all corresponding microstates, , and is given by
where the set is defined by Equation (15):
From the definition in Equation (43), it follows that
for and . By summing up Equation (42) over all microstates in the set , and using Equations (43)–(47), the occupancy distribution at the macrostate level is given by
where the probability is determined from the normalization condition.
The computational complexity of the recursive formula presented in this study can be approximated as , where C denotes the analytical capacity of the system () and m represents the number of traffic classes offered to the system (). The recursive approach ensures near-linear growth with system capacity, making the method suitable for medium-sized multi-service systems. To further improve scalability for large configurations, the optimization algorithm proposed in [49] was employed. This algorithm aims to reduce computation time and improve convergence efficiency as the system capacity increases.
3.5. Blocking Probability
Blocking occurs in macrostates in which the system lacks sufficient AUs to service a new call. The set of blocking macrostates for stream calls, denoted as , is defined as
for . Here, represents the number of AUs occupied by stream calls, represents the number of AUs occupied by compressed calls, is the number of AUs required by a stream call of class i, and R is the maximum number of AUs that can be occupied by stream calls.
The set of blocking macrostates for calls subjected to the compression mechanism, denoted as , is defined as
for and . Here, denotes the number of AUs required by a call of class i and type u, where u represents elastic or adaptive traffic. To determine the blocking probability for a given traffic class, we sum the probabilities of all blocking states for that class:
for and .
4. Numerical Results
This section presents a comparative analysis of the simulation results and analytical calculations, derived from the proposed analytical model, for selected systems with stream, elastic, and adaptive traffic.
4.1. Parameters of Systems Under Consideration
Figure 8, Figure 9, Figure 10, Figure 11, Figure 12 and Figure 13 present the results of the analytical and simulation modeling for systems with parameters specified in Table 1. The parameters listed in Table 1 and Table 2 are expressed in allocation units (AUs).
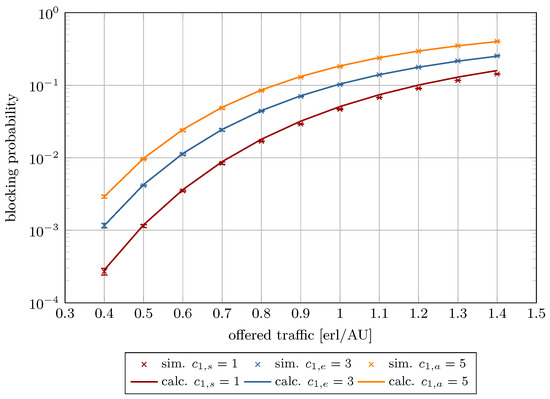
Figure 8.
Blocking probability in System 1.
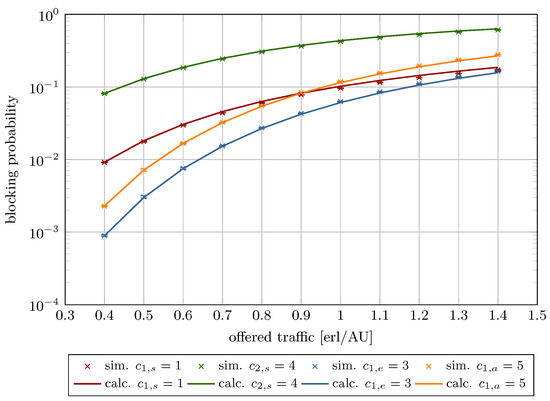
Figure 9.
Blocking probability in System 2.
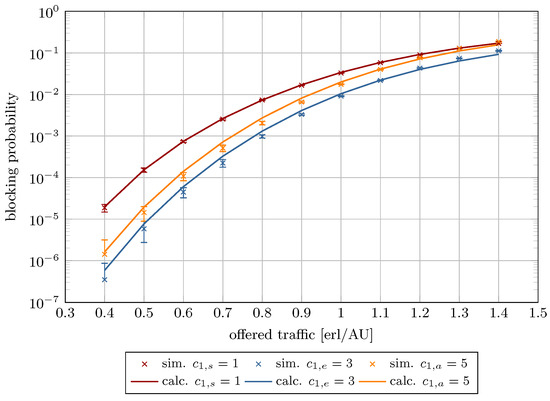
Figure 10.
Blocking probability in System 3.
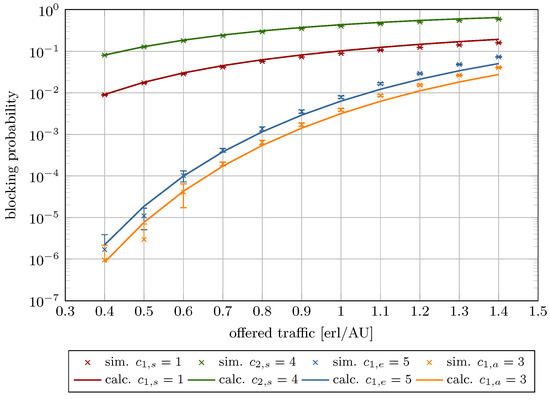
Figure 11.
Blocking probability in System 4.
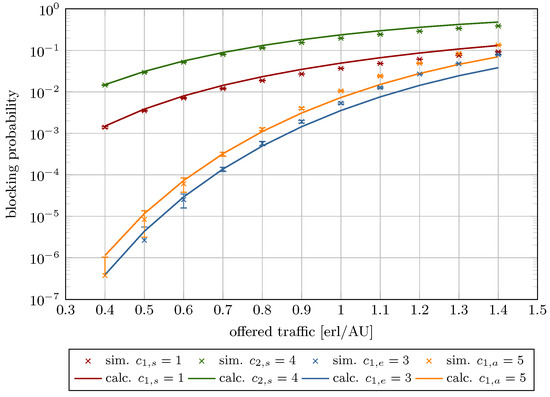
Figure 12.
Blocking probability in System 5.
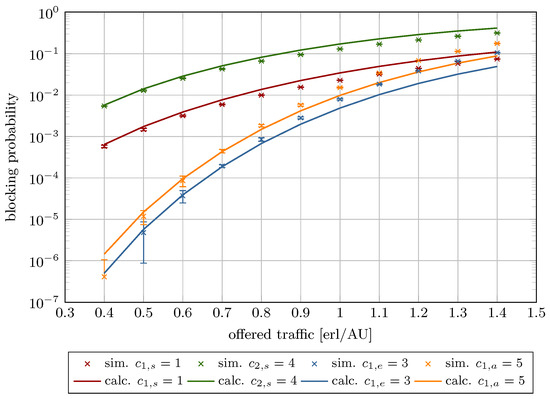
Figure 13.
Blocking probability in System 6.

Table 1.
Example systems with the compression mechanism (the results are obtained as a function of the average traffic intensity offered for each 1 AU).

Table 2.
Example systems with the compression mechanism (the results are obtained as a function of the R parameter).
The results are presented as a function of the average traffic offered per AU, denoted as a, and calculated as follows:
Figure 14, Figure 15, Figure 16 and Figure 17 illustrate the blocking probability as a function of parameter R for the system specified in Table 2. The presented results were obtained with the assumption that the traffic offered for each AU of the system is equal to 0.5 Erl (Figure 14 and Figure 16), and 1.0 Erl (Figure 15 and Figure 17).
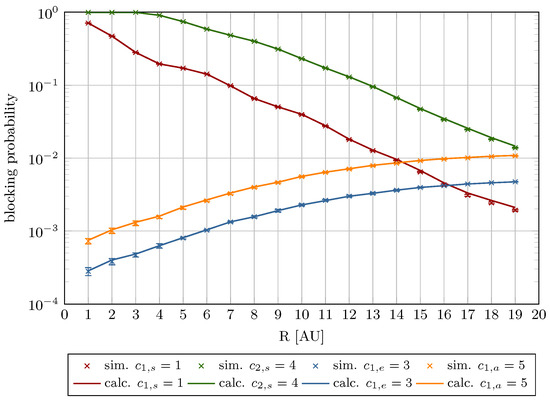
Figure 14.
Blocking probability as a function of R for Erl (System I).
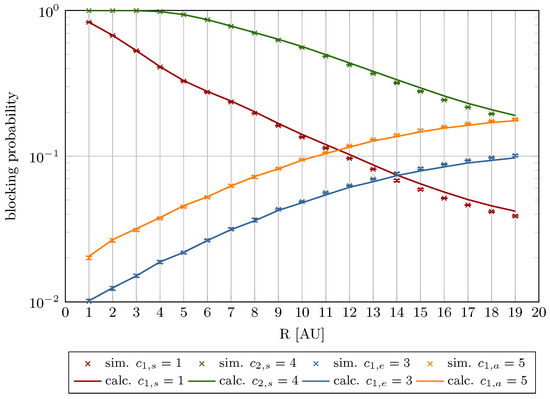
Figure 15.
Blocking probability as a function of R for Erl (System I).
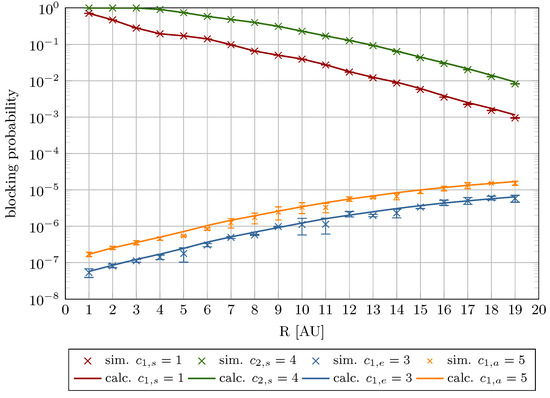
Figure 16.
Blocking probability as a function of R for Erl (System II).
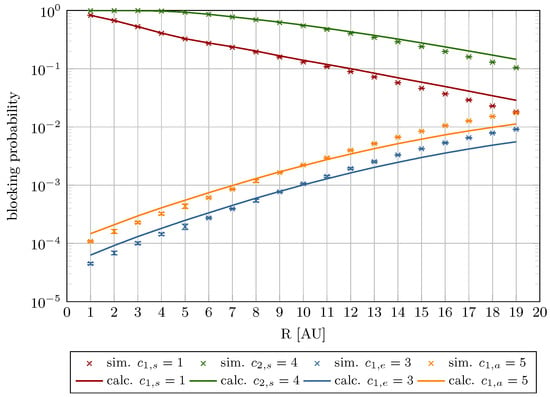
Figure 17.
Blocking probability as a function of R for Erl (System II).
To validate the accuracy of the proposed analytical model, a simulator was developed and implemented in C++. The simulator used the discrete event scheduling method, enabling call-level performance analysis of ICT systems. Each data point presented in the graphs is derived from five independent simulation runs, each preceded by a warm-up phase, conducted in accordance with established simulation experiment methodologies [50]. To ensure statistical significance across all traffic classes, each simulation run was terminated upon processing 1,000,000 calls, a threshold determined by the traffic class with the lowest arrival rate (; see Equation (17)), thereby guaranteeing sufficient data for reliable analysis of all call types. Inter-arrival and service times were generated using pseudo-random number generators with exponential distributions, parametrized by and , respectively. These assumptions allowed the simulator to accurately model the increasing call count within the system as traffic offered per AU increased, as defined in Equation (52). The simulator operates without a graphical user interface; results are outputted to structured text files for subsequent analysis. The results of the simulation experiments are marked on the graphs as points with 95% confidence intervals, determined based on Student’s t-distribution. It is worth noting that the confidence intervals increase for small values of offered traffic, where loss events for flows requiring the smallest number of allocation units (1 AU) occur extremely rarely. The simulation process was verified using NetSim Network Simulator [51].
The preceding examples were designed to demonstrate the capabilities of the proposed model using systems with parameters that allowed clear representation.
To further demonstrate the model’s scalability, it was utilized to calculate the blocking probability for a 100 Mbps network node, referred to as System III. A simplified schematic of System III is illustrated in Figure 18. The system services three traffic classes: stream, elastic, and adaptive, which correspond to the service types considered in this study within the network slice:
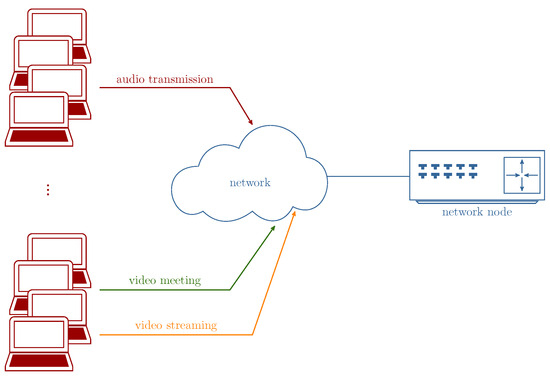
Figure 18.
Simplified diagram of a computer network.
- Audio transmission requiring a constant bitrate of 256 kbps (stream traffic).
- Data transmission using the TCP protocol with a maximum transmission rate of 2 Mbps (elastic traffic).
- Transmission of video streams with a maximum transmission rate of 4 Mbps (720p) (adaptive traffic).
The conversion of system parameters, expressed in bps, to dimensionless AUs was carried out using Equations (1), (2) and (5), which resulted in the following:
- System III capacity: 300 AUs.
- Audio transmission (stream traffic): AU.
- Video meeting (elastic traffic): AUs.
- Video streaming (adaptive traffic): AUs.
This conversion establishes that 1 AU is equivalent to 256 kbps. The maximum compression coefficient was set to 0.5, and the R parameter was defined to 80% of the node’s capacity. The blocking probabilities are presented as a function of the traffic offered per AU, as defined by Equation (52). A simplified schematic of the network fragment is shown in Figure 18, whereas Figure 19 presents the corresponding blocking probability values.
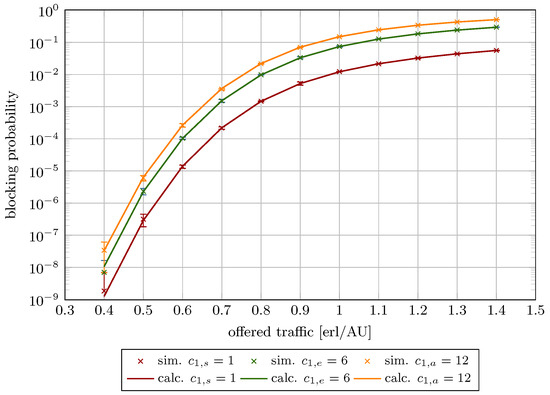
Figure 19.
Blocking probability in System III.
4.2. Discussion
The proposed analytical model is approximate because it assumes that the service process that occurs in the system is reversible. However, this simplification does not significantly affect the model’s accuracy, as the presented results show that it remains largely insensitive to both virtual capacity and the offered traffic per AU. Thus, the presented results clearly demonstrate that the model provides a strong approximation for systems in which selected classes are subject to the compression mechanism. However, a minor inverse correlation was observed between model precision and the parameter R, which defines the maximum AUs allocated to stream-class calls.
Figure 8, Figure 9, Figure 10, Figure 11, Figure 12 and Figure 13 present the blocking probability results for Systems 1–6 as defined in Table 1. To isolate and illustrate the impact of system parameters, such as analytical capacity (influenced by the maximum compression coefficient ; see Equation (6)), the AUs demanded by individual traffic classes, the constraint on stream traffic R, and the offered traffic, the real capacity was held constant across all systems.
The results are plotted as a function of the offered traffic per AU ranging from 0.3 to 1.4. This interval encompasses three operational regimes: low load (), nominal load (), and overload (). The model exhibits high accuracy with low relative errors within the low and nominal traffic ranges. As expected, model accuracy decreases under overload conditions, where real systems inherently experience significantly elevated blocking probabilities. Frequent overloads indicate a need for system redesign or capacity expansion.
Table 3 provides numerical results for the blocking probability for Systems 1–6 across the three aforementioned load regimes. In turn, Table 4 presents the calculated relative and absolute errors. As shown, in the case of Systems 1–4, even under high load, the relative error remains below 30%. In contrast, Systems 5 and 6 display notably higher deviations. These discrepancies link directly to the maximum compression coefficient. When AUs and AUs or AUs, the resulting compression coefficient falls below a critical threshold, causing substantial traffic degradation—manifested as extended transmission durations and/or reduced bandwidth availability for compressed calls.

Table 3.
Blocking probability in Systems 1–6.

Table 4.
Relative ( [%]) and absolute errors ( [-]) of blocking probability for Systems 1–6.
The decline in model accuracy as R increases is attributable to its direct impact on the compression coefficient, as defined in Equation (8). Higher R values amplify the influence of compression mechanism on elastic and adaptive calls parameters, particularly resource requirements and service times. These phenomena are reflected in the blocking probability curves, which vary with offered traffic intensity and R (Figure 8, Figure 9, Figure 10, Figure 11, Figure 12 and Figure 13).
Furthermore, the figures demonstrate that increasing R reduces stream traffic blocking probability while increasing elastic and adaptive class blocking probabilities. This phenomenon results from reserving more system capacity for stream calls, reducing AU availability for compressed traffic.
In Figure 19, the discrepancy for class 1 type s arises from significant resource demand heterogeneity among traffic classes. However, given that the blocking probability for class 1 type s is two orders of magnitude lower than other classes, this discrepancy is practically negligible.
In conclusion, this study validates the proposed multi-service analytical model as a highly accurate tool, even with the reversibility simplification. To the authors’ knowledge, this is the first model with stream, elastic, and adaptive traffic classes, offering significant potential for network modeling, capacity planning, and performance optimization.
5. Summary
This study models the service process in ICT systems using a multi-dimensional reversible Markov process—a methodology known for its high accuracy that has been previously applied to various multi-service systems (e.g., [7,8,16,17,25]). This approach results in a product-form solution, which simplifies the development of recursive algorithms for system modeling.
For computational simplicity, it is assumed that the traffic offered to the system with compression is Erlang-type, characterized by a constant call arrival rate independent of system load. Although widely used in traffic analysis for multi-service systems with compression, this assumption may be considered a limitation of the model. Therefore, future work will extend the model to take into account the dependence of call arrival intensity on system load, employing load-dependent traffic streams such as Engset-type and Pascal-type traffic models.
A key assumption in this study is the introduction of a threshold parameter R, which limits the AUs allocated to stream traffic (). This threshold ensures that traffic subject to the compression mechanism can be accommodated, regardless of the load of the system. It means that the R threshold protects the system from total occupancy by stream traffic and, consequently, it prevents blocking of traffic subject to compression mechanism. Furthermore, as demonstrated in Section 3 (Equations (7) and (8)), R regulates the system’s compression ratio.
Building upon the current analytical framework, future research will focus on extending the model towards a comprehensive multi-service queuing system with integrated compression mechanisms. Such a system will be capable of simultaneously servicing both stream and compressed traffic, thus better reflecting the diversity of modern network environments. Further work will also incorporate advanced traffic management and shaping mechanisms, including adaptive calls control and prioritization schemes, which are particularly relevant in the context of 5G and beyond networks.
A key direction of future development will involve relaxing the assumption of purely Erlang-type service processes. To improve modeling precision under heavy-load or heterogeneous conditions, the model will be generalized to accommodate mixed traffic patterns combining Erlang and non-Erlang distributions.
Ultimately, the enhanced model is expected to provide a unified analytical basis for evaluating and optimizing multi-service queueing systems under diverse traffic conditions, supporting both theoretical investigations and practical applications in next-generation communication networks.
Author Contributions
Conceptualization, J.W. and M.S.; methodology, J.W.; software, J.W. and S.H.; validation, J.W., M.S., S.M., and S.H.; formal analysis, J.W.; investigation, J.W. and S.H.; resources, J.W., S.M., and S.H.; writing—original draft preparation, J.W., M.S., S.M., and S.H.; writing—review and editing, J.W., M.S., S.M., and S.H. All authors have read and agreed to the published version of the manuscript.
Funding
This article was supported by the European Universities Support programme of the Polish National Agency for Academic Exchange (agreement no. BPI/WUE/2024/1/00016/U/00001), financed by the European Union under the project “Support for European Universities Alliances” (project no. FERS.01.05-IP.08-0219/23, FERS–European Funds for Social Development).
Data Availability Statement
Data will be made available upon request from the authors.
Conflicts of Interest
The authors declare no conflicts of interest.
List of Symbols
The following symbols are used in this manuscript:
| Symbol | Description |
| Real capacity of the system | |
| Virtual capacity of the system | |
| Analytical capacity of the system | |
| R | Maximum amount of resources available for stream call |
| classes | |
| Number of stream call classes offered to the system | |
| Number of elastic call classes offered to the system | |
| Number of adaptiv call classes offered to the system | |
| X | microstate |
| Set of all microstate defined in the system | |
| Number of calls of class i type u being serviced in microstate X | |
| Total number of AUs occupied by stream calls in microstate X | |
| Total number of AUs occupied by elastic calls in microstate X | |
| Total number of AUs occupied by adaptive calls in microstate X | |
| Total number of AUs occupied by calls that are subjected | |
| to compression mechanism in microstate X | |
| Macrostate | |
| Total number of AUs occupied by stream call classes | |
| in macrostate | |
| Total number of AUs occupied by calls that are subjected | |
| to compression mechanism in macrostate | |
| Maximum compression level | |
| Compression level in macrostate | |
| Intensity of the call of class i type u | |
| Intensity of the call of class i type u in microstate X | |
| Intensity of the call of class i type u in macrostate | |
| Service intensity of the call of class i type u | |
| Service intensity of the call of class i type u in microstate X | |
| Service intensity of the call of class i type u in macrostate | |
| Average traffic intensity of the call of class i type u | |
| (determine in relation to calls) | |
| Average traffic intensity of the call of class i type u | |
| in microstate X (determine in relation to calls) | |
| Average traffic intensity of the call of class i type u | |
| in macrostate (determine in relation to calls) | |
| Average traffic intensity of the call of class i type u | |
| (determine in relation to AUs) | |
| Average traffic intensity of the call of class i type u | |
| in microstate X (determine in relation to AUs) | |
| Average traffic intensity of the call of class i type u | |
| in macrostate (determine in relation to AUs) | |
| Demanded number of AUs by call of class i type u | |
| Demanded number of AUs by call of class i type u | |
| in microstate X | |
| Demanded number of AUs by call of class i type u | |
| in macrostate | |
| Mean value of AUs occupied by call of class i type u | |
| in microstate X | |
| Probability of microstate X | |
| Probability of macrostate | |
| The set of blocking macrostate for calls of class i type u | |
| Blocking probability of calls i type u |
List of Acronyms
The following acronyms are used in this manuscript:
| Acronym | Full Term |
| ICT | Information and Computation Technology |
| IPv4 | Internet Protocol version 4 |
| IPv6 | Internet Protocol version 6 |
| OSI | Open System Interconnection |
| QoS | Quality of Service |
| eMBB | Enhanced Mobile Broadband |
| uRLLC | Ultra_Reliable Low Latency Communications |
| mMTC | Massive Machine Type Communications |
| SLA | Service Level Agreement |
| V2X | Vehicle-to-Everything |
| IoMT | Internet of Medical Things |
| HD | High Definition |
| CBR | Constant Bitrate |
| VBR | Variable Bitrate |
| ISDN | Integrated Service Digital Network |
| ATM | Asynchronous Transfer Mode |
| C-RAN | Cloud Radio Access Networks |
| PO | Paging Occasions |
| IaaS | Infrastructure as a Service |
| AU | Allocation Unit |
References
- 3GPP. Concepts, Use Cases and Requirements (Release 18); Technical Report; 3rd Generation Partnership Project: Sophia Antipolis, France, 2023. [Google Scholar]
- 3GPP. 5G End to End Key Performance Indicators (KPI) (Release 18); Technical Report; 3rd Generation Partnership Project: Sophia Antipolis, France, 2023. [Google Scholar]
- 3GPP. Service Requirements for V2X Services; Stage 1 (Release 17); Technical Report; 3rd Generation Partnership Project: Sophia Antipolis, France, 2022. [Google Scholar]
- Elayoubi, S.; Ben Jemaa, S.; Altman, Z.; Galindo-Serrano, A. 5G RAN Slicing for Verticals: Enablers and Challenges. IEEE Commun. Mag. 2019, 57, 28–34. [Google Scholar] [CrossRef]
- Gimpelson, L. Analysis of Mixtures of Wide- and Narrow-Band Traffic. IEEE Trans. Commun. Technol. 1965, 13, 258–266. [Google Scholar] [CrossRef]
- Kaufman, J.S. Blocking in a Shared Resource Environment. IEEE Trans. Commun. 1981, 29, 1474–1481. [Google Scholar] [CrossRef]
- Roberts, J.W. A service system with heterogeneous user requirements—Application to multi-service telecommunications systems. In Performance of Data Communications Systems and Their Applications; Pujolle, G., Ed.; North-Holland Publishing Company: Amsterdam, The Netherlands, 1981; pp. 423–431. [Google Scholar]
- Stasiak, M. Blocking probability in a limited-availability group carrying mixture of different multichannel traffic streams. Ann. Des Télécommunications 1993, 48, 71–76. [Google Scholar] [CrossRef]
- Iversen, V.B. Modelling Restricted Accessibility for Wireless Multi-service Systems. In Wireless Systems and Network Architectures in Next Generation Internet; Cesana, M., Fratta, L., Eds.; Springer: Berlin/Heidelberg, Germany, 2006; pp. 93–102. [Google Scholar] [CrossRef]
- Roberts, J.W. Teletraffic Models for the Telecom 1 Integrated Service Network. In Proceedings of the 10th International Teletraffic Congress, Montreal, QC, Canada, 8–15 June 1983; pp. 1–7. [Google Scholar]
- Głąbowski, M.; Kaliszan, A.; Stasiak, M. Asymmetric convolution algorithm for blocking probability calculation in full-availability group with bandwidth reservation. IET Circuits Devices Syst. 2008, 2, 87–94. [Google Scholar] [CrossRef]
- Kaufman, J.S. Blocking with retrials in a completely shared resource environment. Perform. Eval. 1992, 15, 99–116. [Google Scholar] [CrossRef]
- Stasiak, M.; Głąbowski, M.; Wisniewski, A.; Zwierzykowski, P. Modeling and Dimensioning of Mobile Networks: From GSM to LTE; Wiley, Ltd.: Hoboken, NJ, USA, 2010. [Google Scholar] [CrossRef]
- Iversen, V.B. Systems with selective overflow and change of bandwidth. In Proceedings of the 2012 1st IEEE International Conference on Communications in China (ICCC), Beijing, China, 15–17 August 2012; pp. 694–697. [Google Scholar] [CrossRef]
- Głąbowski, M.; Hanczewski, S.; Stasiak, M. Modelling of Cellular Networks with Traffic Overflow. Math. Probl. Eng. 2015, 2015, 15. [Google Scholar] [CrossRef]
- Stamatelos, G.M.; Koukoulidis, V.N. Reservation-based Bandwidth Allocation in a Radio ATM Network. IEEE/ACM Trans. Netw. 1997, 5, 420–428. [Google Scholar] [CrossRef]
- Rácz, S.; Gerő, B.P.; Fodor, G. Flow level performance analysis of a multi-service system supporting elastic and adaptive services. Perform. Eval. 2002, 49, 451–469. [Google Scholar] [CrossRef]
- Moscholios, I.D.; Logothetis, M.D.; Kokkinaki, G. On the calculation of blocking probabilities in the multirate state-dependent loss models for finite sources. Mediterr. J. Comput. Netw. 2007, 3, 100–109. [Google Scholar]
- Logothetis, M.D.; Moscholios, I.D. Efficient Multirate Teletraffic Loss Models Beyond Erlang; John Wiley & Sons, Ltd.: Hoboken, NJ, USA, 2019. [Google Scholar] [CrossRef]
- Sobieraj, M.; Stasiak, M.; Weissenberg, J.; Zwierzykowski, P. Analytical Model of the Single Threshold Mechanism with Hysteresis for Multi-Service Networks. IEICE Trans. Commun. 2012, 95-B, 120–132. [Google Scholar] [CrossRef]
- Bonald, T.; Virtamo, J. A recursive formula for multirate systems with elastic traffic. IEEE Commun. Lett. 2005, 9, 753–755. [Google Scholar] [CrossRef]
- Vassilakis, V.G.; Moscholios, I.D.; Logothetis, M.D. Call-Level Performance Modelling of Elastic and Adaptive Service-Classes with Finite Population. IEICE Trans. Commun. 2010, 91-B, 151–163. [Google Scholar] [CrossRef]
- Moscholios, I.D.; Vardakas, J.; Logothetis, M.D.; Boucouvalas, A. Congestion probabilities in a batched Poisson multirate loss model supporting elastic and adaptive traffic. Ann. Telecommun. 2013, 68, 327–344. [Google Scholar] [CrossRef]
- Hanczewski, S.; Stasiak, M.; Weissenberg, J. A Queueing Model of a Multi-Service System with State-Dependent Distribution of Resources for Each Class of Calls. IEICE Trans. Commun. 2014, E97-B, 1592–1605. [Google Scholar] [CrossRef]
- Hanczewski, S.; Stasiak, M.; Weissenberg, J. Queueing model of a multi-service system with elastic and adaptive traffic. Comput. Netw. 2018, 147, 146–161. [Google Scholar] [CrossRef]
- Younes, S.; Idi, M.; Robbana, R. Discrete-time Markov decision process for performance analysis of virtual machine allocation schemes in C-RAN. J. Netw. Comput. Appl. 2024, 225, 103859. [Google Scholar] [CrossRef]
- Agiwal, M.; Agiwal, A.; Maheshwari, M.K.; Muralidharan, S. Split PO for paging in B5G networks. J. Netw. Comput. Appl. 2022, 205, 103430. [Google Scholar] [CrossRef]
- Kita, N.; Oki, E. Unavailability-aware allocation of backup resources considering failures of virtual and physical machines. Comput. Netw. 2024, 239, 110141. [Google Scholar] [CrossRef]
- Muscariello, L.; Mellia, M.; Meo, M.; Marsan, M.A.; Cigno, R.L. Markov models of Internet traffic and a new hierarchical MMPP model. Comput. Commun. 2005, 28, 1835–1851. [Google Scholar] [CrossRef]
- Aceto, G.; Ciuonzo, D.; Montieri, A.; Pescapè, A. Characterization and Prediction of Mobile-App Traffic Using Markov Modeling. IEEE Trans. Netw. Serv. Manag. 2021, 18, 907–925. [Google Scholar] [CrossRef]
- Domański, A.; Domańska, J.; Filus, K.; Szyguła, J.; Czachórski, T. Self-Similar Markovian Sources. Appl. Sci. 2020, 10, 3727. [Google Scholar] [CrossRef]
- Besenczi, R.; Bátfai, N.; Jeszenszky, P.; Major, R.; Monori, F.; Ispány, M. Large-scale simulation of traffic flow using Markov model. PLoS ONE 2021, 16, e0246062. [Google Scholar] [CrossRef]
- Koksal, O.K.; Temelli, R.; Ozkan, H.; Gurbuz, O. Markov Model Based Traffic Classification with Multiple Features. In Proceedings of the 2022 International Balkan Conference on Communications and Networking (BalkanCom), Sarajevo, Bosnia and Herzegovina, 22–24 August 2022; pp. 173–177. [Google Scholar] [CrossRef]
- Myint, S.H.; Yu, K.; Sato, T. Modeling and Analysis of Error Process in 5G Wireless Communication Using Two-State Markov Chain. IEEE Access 2019, 7, 26391–26401. [Google Scholar] [CrossRef]
- Ghosh, S.; Bhattacharya, A. A Markov Chain-Based Handover Decision Algorithm for Vehicular Networks in 5G. IEEE Trans. Veh. Technol. 2021, 70, 6852–6863. [Google Scholar]
- Chang, X.; Xia, R.; Muppala, J.K.; Trivedi, K.S.; Liu, J. Effective Modeling Approach for IaaS Data Center Performance Analysis under Heterogeneous Workload. IEEE Trans. Cloud Comput. 2018, 6, 991–1003. [Google Scholar] [CrossRef]
- Hanczewski, S.; Stasiak, M.; Weissenberg, J. A Model of a System With Stream and Elastic Traffic. IEEE Access 2021, 9, 7789–7796. [Google Scholar] [CrossRef]
- Bonald, T.; Roberts, J.W. Internet and the Erlang Formula. SIGCOMM Comput. Commun. Rev. 2012, 42, 23–30. [Google Scholar] [CrossRef]
- Hui, J.Y. Resource allocation for broadband networks. IEEE J. Sel. Areas Commun. 1988, 6, 1598–1608. [Google Scholar] [CrossRef]
- Kelly, F. Notes on Effective Bandwidth. In Stochastic Networks: Theory and Applications; Kelly, F., Zachary, S., Ziedins, I., Eds.; Oxford University Press: Oxford, UK, 1996; pp. 141–168. [Google Scholar]
- Sagkriotis, S.G.; Pantelis, S.K.; Moscholios, I.D.; Vassilakis, V.G. Call blocking probabilities in a two-link multirate loss system for Poisson traffic. IET Netw. 2018, 7, 233–241. [Google Scholar] [CrossRef]
- Lin, Y.T.; Bonald, T.; Elayoubi, S.E. Flow-level traffic model for adaptive streaming services in mobile networks. Comput. Netw. 2018, 137, 1–16. [Google Scholar] [CrossRef]
- Roberts, J.W.; Mocci, U.; Virtamo, J.T. (Eds.) Broadband Network Teletraffic-Performance Evaluation and Design of Broadband Multiservice Networks: Final Report of Action COST 242; Lecture Notes in Computer Science; Springer: Berlin/Heidelberg, Germany, 1996; Volume 1155. [Google Scholar] [CrossRef]
- Guerin, R.; Ahmadi, H.; Naghshineh, M. Equivalent capacity and its application to bandwidth allocation in high-speed networks. IEEE J. Sel. Areas Commun. 1991, 9, 968–981. [Google Scholar] [CrossRef]
- Norros, I. On the use of fractional Brownian motion in the theory of connectionless networks. IEEE J. Sel. Areas Commun. 1995, 13, 953–962. [Google Scholar] [CrossRef]
- Pras, A.; Nieuwenhuis, L.; van de Meent, R.; Mandjes, M. Dimensioning Network Links: A New Look at Equivalent Bandwidth. IEEE Netw. 2009, 23, 5–10. [Google Scholar] [CrossRef][Green Version]
- Brown, T.C.; Pollett, P.K. Poisson approximations for telecommunications networks. J. Aust. Math. Soc. Ser. B Appl. Math. 1991, 32, 348–364. [Google Scholar] [CrossRef]
- Hanczewski, S.; Stasiak, M.; Weissenberg, J. The Queueing Model of a Multiservice System with Dynamic Resource Sharing for Each Class of Calls. In Computer Networks; Kwiecień, A., Gaj, P., Stera, P., Eds.; Communications in Computer and Information Science; Springer: Berlin/Heidelberg, Germany, 2013; Volume 370, pp. 436–445. [Google Scholar] [CrossRef]
- Nilsson, A.A.; Perry, M. Provisioning Models for Digital Loop Carriers. In Proceedings of the 13th International Teletraffic Congress (ITC-13), Volume: Discussion Circles, Copenhagen, Denmark, 19–26 June 1991; pp. 271–276. [Google Scholar]
- Tyszer, J. Object-Oriented Computer Simulation of Discrete-Event Systems; Springer: New York, NY, USA, 1999. [Google Scholar]
- Tetcos: NetSim-Network Simulation Software; Tetcos: Bengaluru, India, 2024.
Disclaimer/Publisher’s Note: The statements, opinions and data contained in all publications are solely those of the individual author(s) and contributor(s) and not of MDPI and/or the editor(s). MDPI and/or the editor(s) disclaim responsibility for any injury to people or property resulting from any ideas, methods, instructions or products referred to in the content. |
© 2025 by the authors. Licensee MDPI, Basel, Switzerland. This article is an open access article distributed under the terms and conditions of the Creative Commons Attribution (CC BY) license (https://creativecommons.org/licenses/by/4.0/).