Abstract
In this paper, a novel model of dust storm intensity variations and its effects on earth–satellite link design for total attenuation prediction has been developed. The proposed model expresses the total dust-induced attenuation as a function of the empirically derived specific attenuation in (dB/km) and effective slant path distance. The formulation incorporates the vertical variation in dust storm intensity along the propagation path to more accurately represent the attenuation experienced by slant links. The effective slant path distance is obtained as a combination of a total slant path distance and an adjustment factor. The adjustment factor has been developed based on the visibility height model of the dust storm structure. The proposed model has been validated with one-year measured attenuation on 6.2 km and 7.6 km long microwave links operating at 21.2 GHz and 14.5 GHz, respectively.
1. Introduction
As wireless communication systems evolve towards 6G and integrated space–air–ground architectures, the demand for reliable, high-capacity, and uninterrupted connectivity becomes increasingly critical. Hybrid Satellite–Terrestrial Networks (HSTNs) represent a cornerstone of this vision by combining the wide coverage of the satellite links with the flexibility of terrestrial and aerial platforms. Nevertheless, the propagation environment, such as rain, snow, fog, cloud, and dust storms, possesses a significant challenge to maintain consistent link performance [1,2].
Sand and dust storms (SDSs) are complicated meteorological events that occur when strong winds lift dust into the atmosphere, moving dust particles over considerable distances that may reach up to hundreds of kilometers away from the source area [3]. Dust storms, common in many deployment zones across the Middel East, Africa, and Asia, cause signal attenuation, depolarization, and scattering that can degrade communication quality and limit system reliability [4,5,6,7,8]. Regularly, dust storm intensity is measured with visibility reduction. Moderate dust storms are classified with optical visibility ranging from 1000 m to 500 m, while a severe dust storm is defined when the visibility is less than 500 [5]. Furthermore, relative humidity has been reported to accompany sand and dust storms. As a result, a fast shift in relative humidity during a storm can directly impact dust’s dielectric constant moisture content, which is considerably reflected in signal strength due to dust particle property alterations [6]. In addition, wind shears and turbulence may cause airborne dust particle canting angles and oscillations [9]. The duration that the particles remain airborne is governed by the relationship between the wind-driven uplift forces and the gravitation settling velocity of the particles. When the prevailing wind speed exceeds the particle’s descents velocity, the dust can remain suspended in the air for long periods. Coarse particles (diameter > 80 µm) exhibit high settling speed and therefore fall to the ground rapidly after a storm, whereas fine dust particles (diameter > 20 µm) possess very low terminal velocities and persist serval kilometers above the surface for days. The extended suspension of fine particles causes sustained degradation of satellite communication signals, increasing attenuation and phase distortion along the transmission path [10].
Different communication media using broadband communication can be affected by dust storms, such as satellites, terrestrial links, high-altitude platforms (HAPs), and unmanned aerial vehicles (UAVs), especially when using broadband, which requires high frequencies that are sensitive to dust storms. Dust storm varies along the slant path in which the microwave and millimeter waves propagate based on the elevation angle. Investigation and modeling of dust storm vertical variation are essential to predicting total vertical attenuation along the link [11].
The literature contains attenuation prediction models that estimate dust storm attenuation based on different assumptions and theories. Mathematical, experimental, and machine learning prediction models have been developed at various accuracy levels [2,12,13,14,15,16,17,18,19]. Conventional dust attenuation models compute path loss in dB/km by assuming a uniform dust concentration along the propagation path. The vertical distribution of dust storms is highly nonuniform, leading to inaccurate attenuation estimates [20,21,22]. To overcome this, Elsheikh et al. introduced a vertical path as an adjustment factor, derived from Chu’s attenuation prediction model [23], to account for height-dependent variations in dust density and their corresponding impact on signal attenuation.
where
l is signal slant path, h1 is the measured vertical visibility, and ho is the reference height.
The angle is the elevation angle.
Chu’s model is based on Rayleigh scattering approximation [12]. At lower frequencies, the attenuation is primarily governed by the absorption component of the extension cross-section, exhibiting characteristics consistent with Rayleigh scattering. The attenuation induced by dust particles is determined by parameters such as visibility, operating frequency, maximum particle size, and the complex permittivity of the dust medium. However, at higher frequencies, the Rayleigh scattering model becomes less reliable, as its simplified assumptions lead to significant deviations in attenuation prediction [24]. This limitation is particularly critical for millimeter wave and satellite communication links operating under dust storm conditions, where non-Rayliegh scattering mechanisms and complex particle–wave interactions significantly influence signal degradation. Due to several important shortcomings, including simple assumptions regarding particle size and shape and the extension of these assumptions to a complex and highly unpredictable phenomenon, Chu’s attenuation prediction model has frequently underestimated measured attenuation. Furthermore, a lot of analytical techniques overlook the crucial influence that humidity has on the physical properties of dust particles, which has a direct impact on signal behavior. Recent empirical models, on the other hand, that take humidity and other atmospheric factors into account, have shown noticeably better agreement with measured data [25].
Furthermore, Kamal Harb et al. [21,26] proposed a model to represent the vertical nonuniformity of dust storms in order to simplify the complex computation of signal attenuation for satellite, high-altitude platforms (HAPs), and unmanned aerial vehicle (UAV) communication systems. In their formulation, the vertical dust profile is divided into several horizontal homogeneous layers, typically ranging from two to eight, each possessing distinct particle size distributions. As a result, the overall slant path is segmented into smaller sections that depend on local visibility, with each section characterized by its specific parameters, such as mean particle diameter and visibility.
L(ϴ) = L1 + L2 +……….+ Ln−1 + Ln
L(ϴ) slant path layers.
However, the multi-layer DUSA storm concept has improved the microwave and millimeter wave attenuation prediction during dust storms compared to the conventional methods, and the layering concept remains a significant challenge. Forming dust storms into vertically independent/isolated layers by ignoring their dynamic nature is not logical since dust storms are complicated phenomena. Therefore, dust particles can be affected by wind turbulence, gravity, humidity, etc. Consequently, dust particles will not remain in one layer and can interfere between layers [9,22,25].
A long-term measurement campaign conducted in Khartoum, Sudan, investigated the impact of dust storms on four microware links with varying path lengths [27]. The experimental data obtained from links of 2.6 km and 2.8 km operating at 14.4 GHz and 21.3 GHz, respectively, were used. Along with concurrent metrological observations, an empirical dust attenuation model was formulated under the assumption of uniform dust distribution along the propagation path [17]. Furthermore, two additional terrestrial microwave links with extended lengths (6.2 km and 7.6 km) operating at 21.2 GHz and 14.5 GHz were analyzed to account for the nonuniform variation in dust storm intensity. These longer links were employed to validate the proposed model by approximating them at low elevation paths [27]. The predicted attenuation of Chu’s modified and Harb’s models has been compared with measured total attenuation at 22 GHz and 14.4 GHz for 6.2 km and 7.6 km, respectively, as shown in Figure 1 and Figure 2.
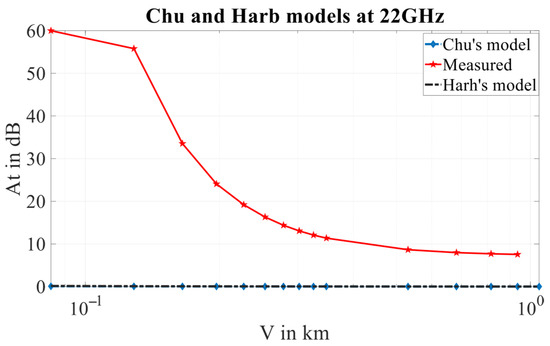
Figure 1.
Chu’s and Harb’s predictions compared to measured attenuation at 22 GHz.
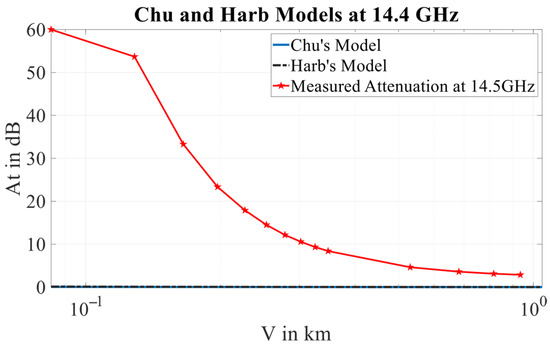
Figure 2.
Chu’s and Harb’s predictions compared to measured attenuation at 14.4 GHz.
As demonstrated in Figure 1 and Figure 2, all existing models diverge markedly from the measured attenuation, primarily due to simplifying assumptions—most notably single-particle scattering and the omission of dust dynamics during storm conditions. Both conventional baselines diverge markedly from the measurements, with the largest discrepancies at low visibility (V < 0.3 km). At 14.4 GHz, the measured attenuation decreases from ~60 dB at V ≈ 0.08 km to ~3–5 dB near V ≈ 1 km, whereas the Chu and Harb models remain near zero and under-predict throughout. The same pattern holds at 22 GHz: measured attenuation decays smoothly and monotonically with increasing visibility, while Chu/Harb consistently fall well below the observed levels. Both models appear to be very far from the measured attenuation because of the inherent simplifying assumptions they use to approximate the complexity of signal propagation through dust storms (e.g., idealized particle size/shape distributions, fixed dielectric properties, and vertically homogeneous layers).
This study introduces a novel dust storm intensity variation model for earth–satellite link design, formulated as a product of the specific attenuation and an effective propagation distance. Unlike conventional approaches such as Chu’s Rayleigh, a scattering model, which assumes a uniform dust concentration, or Harb’s multi-layer DUSA storm model, which treats the vertical layer as an isolated layer and neglects inter-layer dynamics and humidity effects, the proposed model captures the continuous vertical nonuniformity of the dust storm intensity along the propagation path. By integrating the empirically developed visibility height with the humidity-dependent dielectric parameters, the model reflects the real-time changes in dust particle permittivity and moisture content, critical factors influencing millimeter wave signal behavior. Validation using measured data from 6.2 km to 7.6 km microwave links realistically operating at 21.2 GHz and 14.4 GHz confirms its improved prediction accuracy under a realistic propagation environment. Consequently, this model provides a physically consistent and experimentally verified framework for the design optimization and performance evaluation of 6G enabled Hybrid Satellite–Terrestrial Networks (HSTNs), ensuring robust and sustainable connectivity under severe dust storm conditions.
2. Modeling of Dust Storm Nonuniformity
2.1. Development of the Vertical Adjustment Factor
An experiment was performed for five years in Khartoum Sudan (1975–1980) for an earth–satellite station in Khartoum operating at 10 GHz [22]. In the computation, the maximum height of the dust storm was considered to be 4 km. The visibility along the path is not constant. The visibility (V) at any height (h) can be related to the visibility (Vo) at a reference height (ho), as shown in Figure 3, by the following relation
where V is the visibility at any height (h), which can be related to the visibility (Vo) at the reference height (ho).
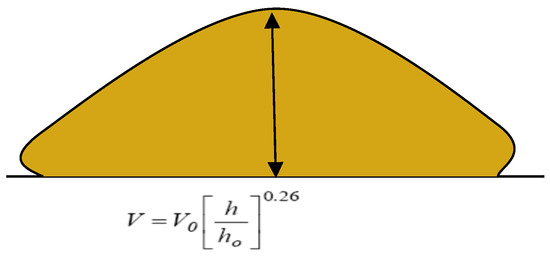
Figure 3.
Visibility levels and the height during the dust storm [23].
The visibility–height relationship justified the use of the exponent (0.26), which originates from long-term empirical measurements at the Khartoum Earth Station (1975–1980) and has been widely referenced in the dust storm modeling literature [23]. It also specified that the model is applicable for dust storm heights up to approximately 4 km, which corresponds to the typical vertical extent observed in severe storms.
The total attenuation of an electromagnetic wave (AT) through an earth-to-satellite microwave link of length d via a medium of precipitation is expressed as follows [23,27]:
where Ap (dB/km); the specific attenuation from the dust precipitating particles can be calculated using the Elsheikh empirical model as follows [17]:
where
V is the visibility in km.
Coefficients a = 0.6301 and b = −1.123.
f: frequency in GHz.
c, d, e are coefficients that represent the imaginary part of the dielectric constant at different frequencies and moistures, as in [17].
Therefore, the total attenuation AT can be obtained by substituting the value of the visibility (V) from Equation (5) in Equation (7) and both into (6), as shown in Equation (8) below
On the other hand, the total attenuation might be expressed as follows:
The formula can be re-expressed as follows:
where
AT: Total Attenuation in dB.
rv: Vertical path adjustment factor caters for vertical intensity variation.
d: Link length in Km.
As: Specific attenuation in dB/km.
By substituting (7) and (8) in (9), the variation in visibility with height will affect the EM signal slant path, as shown in Figure 4.
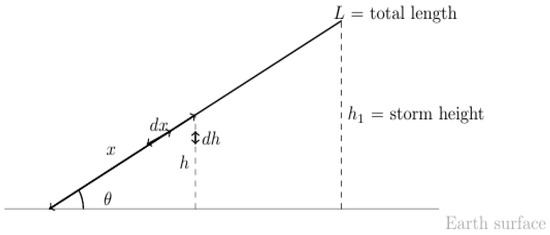
Figure 4.
Dust storm height, signal slant path, and elevation angle.
Hence,
where
L is the signal slant path, and b is a coefficient = −1.123 [17].
Then, the equation can be re-written as follows:
From Figure 4, the value of dx can be expressed as
The value of L from Figure 4 is
Then, Equation (6) can be expressed as follows:
By performing the integration, we obtain the adjustment factor rv that considers the dust storm intensity variations along the slant path, as in (16)
Hence, by substituting the value of the signal slant path L as in (14), the vertical dust storm adjustment factor is as follows:
where
h1 is the height for the measured visibility V, and the angle is the elevation angle. The reduction factor can be related to the visibility (Vo) at reference height (ho).
Therefore, a vertical dust storm adjustment factor is developed to incorporate the effects of the vertical nonuniformity in the dust concentration along the propagation path, ensuring a more realistic representation of attenuation across the entire storm height. This factor is based on the relationship between visibility at different heights, signal slant path, and the elevation angle. After simplification, it has been concluded that the adjustment factor depends only on the dust storm height (h1) and the elevation angle θ, as in Equation (17).
2.2. Effects on Different Heights/Elevation Angles
Considering that the maximum dust storm’s height is 4 km, the elevation angle θ rises as it gets closer to 90°. The signal slant path through the dust storm will be shortened as a result, and the correction factor will be a fraction of one. Conversely, when the elevation angle value falls toward 0°, the adjustment factor values will correspondingly exceed one, which will be reflected in the total signal attenuation. Figure 5 shows a 3D representation of the vertical adjustment factor rv, as proposed in Equation (17).
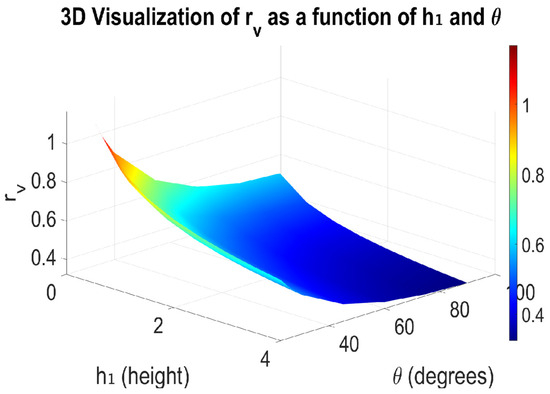
Figure 5.
A 3D visualization of the vertical adjustment factor rv as a function of h1 and θ.
Figure 5 illustrates the relationship between the vertical adjustment factor and dust storm heights ranging from 0.5 km to 4 km, as well as different elevation angles from 22.5° to 90°. The data suggest that the vertical adjustment factor rv increases as the dust storm height decreases and as the elevation angle approaches an acute angle. Specifically, when the height h1 diminishes, the adjustment factor rises, indicating that signals may undergo more adjustments, potentially resulting in greater signal loss at lower altitudes. The influence of elevation angle on the adjustment factor can be categorized into two regimes: Smaller angles (e.g., 22.5–30°) exhibit higher adjustment factors, meaning that signals traveling at low elevation angles are more affected by atmospheric conditions. Conversely, larger angles (e.g., 75–90°) show lower adjustment factors, indicating that signals propagating closer to vertical experience fewer adjustments and less atmospheric interference.
2.3. Total Attenuation Perdition
The total vertical attenuation prediction model AT as in (9) is a product of three components: the empirical specific attenuation As in dB/km as in (7) [17], the proposed vertical adjustment factor rv as in (17), and the signal slant path L as in Equation (14).
Alternatively, AT can be re-expressed as follows:
where
AT is total attenuation in dB
As is an empirical specific attenuation in dB/km.
rv is the vertical adjustment factor.
L is the slant path in km.
Leff is the effective signal slant path in km.
By substituting the values of the specific attenuation As, the adjustment factor rv, and the slant path L from Equations (7), (17) and (14), respectively, the total vertical attenuation due to dust storm is as follows:
where
V is the visibility in km; coefficients a = 0.6301 and b = −1.123.
f = frequency in GHz, c, d, e: parameters represent imaginary parts of dielectric constant at different frequencies and moisture as in [17].
ho is the earth station reference height, and h1 is the storm height.
L is the signal slant path, and θ is the elevation angle.
As shown in Equation (18), the proposed formula depends on the complex moisture content and visibility; both are sensitive to humidity and regional variations.
3. Attenuation Prediction Using the Proposed Model at 14.4 GHz and 22 GHz
Total attenuation has been predicted for both frequencies 14.4 GHz and 22 GHz, respectively, using the proposed model for dust storm intensity variation for earth–satellite link, as in Equation (18), at different elevation angles θ, dust storm heights h1, and different moisture levels.
3.1. Predicted Total Attenuation at 14.4 GHz
Since moisture levels have significant impacts on attenuation predicted by proposed model (18), three moisture contents [17] are considered with seven slant paths for different elevations angles; they are presented in Figure 6, Figure 7 and Figure 8.
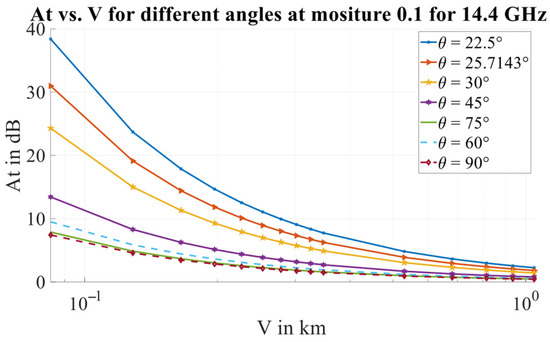
Figure 6.
Predicted attention at 0.1 moisture content for 14.4 GHz at different elevation angles and visibility levels.
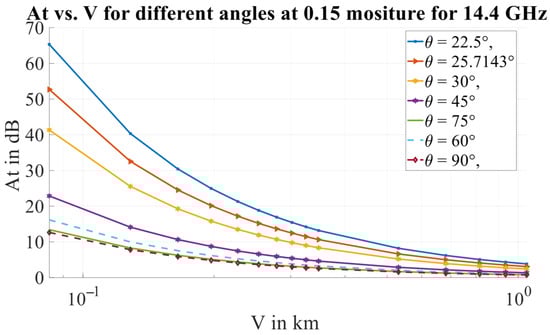
Figure 7.
Predicted attention at 0.15 moisture content for 14.4 GHz at different elevation angles and visibility levels.
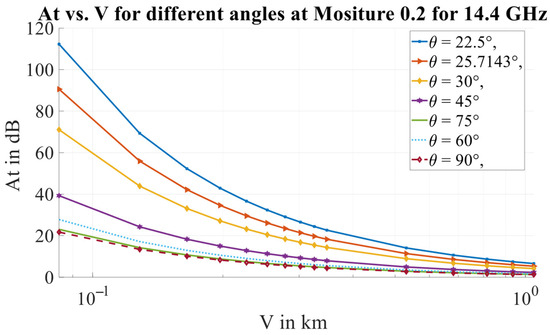
Figure 8.
Predicted attention at 0.2 moisture content for 14.4 GHz at different elevation angles and visibility levels.
Figure 4, Figure 5 and Figure 6 demonstrate that attenuation at 14.4 GHz is influenced by elevation angle, moisture content, and visibility. Moisture has the strongest influence, with attenuation increasing nonlinearly as humidity rises. Elevation angle is the next critical factor: lower elevation angles (22.5–30°) suffer much higher losses than greater angles (≥60–90°), which are obvious because of longer slant paths, particularly in humid conditions. Visibility also plays an essential role, with attenuation decreasing as visibility increases, though the effect levels off at longer path lengths. In combination, the worst-case scenario occurs in the event of a low elevation angle, high moisture, and short visibility, leading to severe predicted attenuation > 110 dB. The best-case scenario is achieved in the event of a high elevation angle, low moisture, and long visibility, where predicted attenuation is ≤0.5 dB.
3.2. Predicted Total Attenuation at 22 GHz
Figure 9, Figure 10 and Figure 11 show the predicted total attenuation for 22 GHz using the proposed model in Equation (16) considering vertical dust storm intensity variation at different moisture content levels, as in [17].
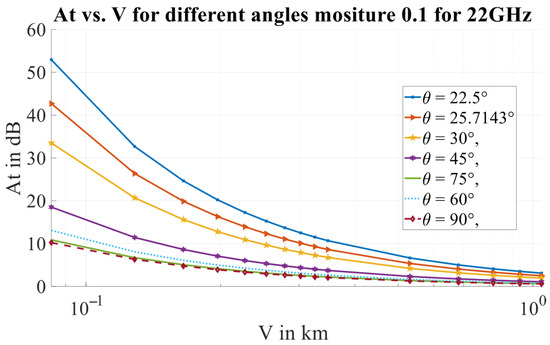
Figure 9.
Predicted attention at 0.1 moisture content for 22 GHz at different elevation angles and visibility levels.
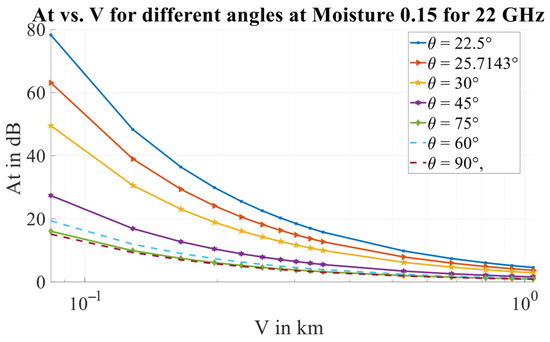
Figure 10.
Predicted attention at 0.15 moisture content for 22 GHz at different elevation angles and visibility levels.
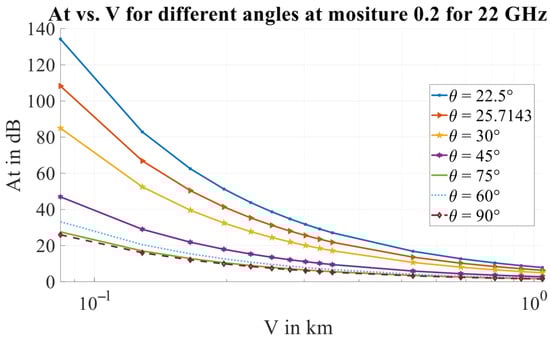
Figure 11.
Predicted attention at 0.2 moisture content for 22 GHz at different elevation angles and visibility levels.
Figure 9, Figure 10 and Figure 11 clearly demonstrate that atmospheric attenuation at 22 GHz is strongly influenced by moisture content, elevation angle, and visibility conditions. In general, attenuation increases significantly with higher moisture levels and at lower elevation angles, where the signal traverses a longer atmospheric path. Poor visibility further amplifies this effect, leading to very high attenuation values that may exceed 120–135 dB under extreme conditions. Such worst-case scenarios render the propagation channel highly unstable and unsuitable for reliable communication.
3.3. Applicability to Bent Pipe Multi-Hop Architecture
The attenuation term derived in Equation (16) is additive in dB and therefore integrates directly into end-to-end link budgets. For a route decomposed into uplink RF, inter-satellite link(s), and downlink RF, the cumulative dust loss is
where each hop uses its local visibility, frequency, dielectric parameters, and elevation. This “drop-in” structure covers transparent (bent pipe) payloads and cascades naturally over multi-hop paths. In mega-constellation settings, geographically correlated disturbances (regional dust outbreaks) can degrade many ground–LEO legs simultaneously and force detours; embedding per affected hop enables the quantitative assessment of margin, availability, and routing overhead. For mixed RF/FSO chains, the proposed term parameterizes the RF hops, while FSO ISLs follow standard optical extinction/scintillation models, allowing for closed-form/outage-based end-to-end evaluation in hybrid 6G scenarios [28,29].
Table 1 shows an example of predicted total attenuation (uplink, downlink, and earth-to-earth) using the proposed model for the three-hops route at dust (severe, moderate, and light) for a 45° elevation angle.

Table 1.
Example 3-hop route under severe, moderate, and light dust (Equation (16); ).
From Table 1, using a 45° elevation angle, the predicted total attenuation suggests service outages under severe and moderate dust storms, whereas service remains viable under light dust. Moreover, attenuation grows at lower elevation angles and diminishes at higher angles.
3.4. Validation of the Proposed Model
Two terrestrial microwave links with longer lengths were monitored by considering the nonuniformity of dust storm intensity variations [27]. The dust storm characteristics and the attenuation due to dust on 6.2 km and 7.6 km microwave links operating at 21.2 GHz and 14.5 GHz can be compared to the model with very low elevation angles and corresponding dust heights, as in Figure 12 and Figure 13. Figure 12 shows measured attenuation from MABLOOL_JAREEF SHARIG, which operates at 21.2 GHz over a 6.2 km terrestrial path [27].
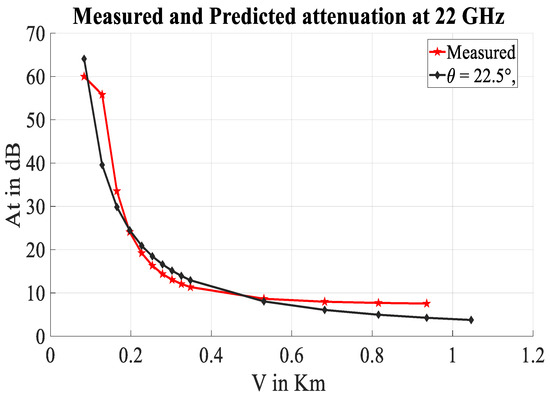
Figure 12.
Measured and predicted attenuation for MABLOOL_JAREEF SHARIG 6.2 km operating at 21.2 GHz.
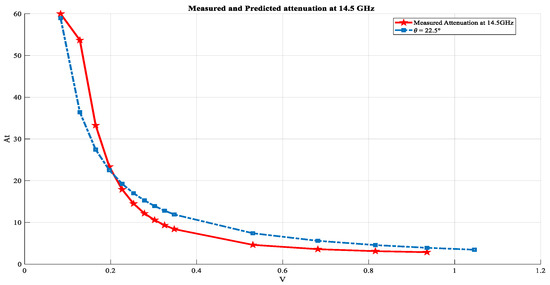
Figure 13.
Measured and predicted attenuation for BIA2_MANCHIA 7.6 km operating at 14.5 GHz.
The earth–satellite link at an elevation angle of 22.5 degree at a dust storm height (h1) of 2.4 km is equivalent to 6.2 km slant path length. Hence, the predicted attenuation using the proposed model of dust storm intensity variations on earth–satellite link at an elevation angle of 22.5 degrees and dust storm height of 2.4 km is compared with the measurement in Figure 12. Figure 12 shows that when visibility exceeds 0.6 km, the prediction slightly underestimates attenuation. In the mid-range (0.6 km to 0.3 km), there is close agreement. At lower visibility levels below 0.3 km, the prediction again slightly underestimates the measured attenuation.
Figure 13 shows another comparison between measured and predicted total attenuation using the proposed model and the measured attenuation from BIA2_MANCHIA, which operates at 14.4 GHz over 7.6 km [24]. The comparison utilizes measurements and predictions based on Equation (18) at an elevation angle of 22.5 degrees and a dust storm height (h1) of 2.91 km. Figure 13 shows visibility that exceeds 0.5 km, where the prediction tends to overestimate the attenuation. In the mid-range (0.5 km to 0.2 km), the measurements and predictions align well. At visibility below 0.2 km, the predicted attenuation slightly underestimates the measured values for a frequency of 14.4 GHz.
The proposed model for dust storm intensity variations on earth–satellite link provides reliable forecasts by accounting for dust intensity variations along the propagation path for very low elevation angles. Generally, both Figure 12 and Figure 13 indicate good agreement between measured and predicted attenuation across different visibility levels. By assuming the vertical variations in dust intensity, as shown in Figure 3, higher elevation angles would predict the total attenuation with similar reliability.
4. Conclusions
Dust storm effects are significant for designing reliable earth-to-satellite links in the desert. Dust storm intensity variations and its effects on earth–satellite link must be considered for a total attenuation prediction. Based on the visibility height dust storm model, an adjustment factor has been developed in this article to account for the dust storm’s intensity variations along the vertical path. A novel model for dust storm intensity variations on earth–satellite link has been proposed by combining the effective distance with an empirical specific attenuation prediction model, as reported earlier. The proposed model is derived as a function of specific attenuation due to dust in (dB/km) and the effective slant path distance, considering that dust storm intensity varies along the vertical link. The effective slant path distance is obtained as a combination of a total slant path distance and an adjustment factor. The adjustment factor has been developed based on the previously proposed visibility height model of the dust storm structure. The proposed model has been validated with one-year measured attenuation on microwave links operating at 21.2 GHz and 14.5 GHz by assuming a low elevation angle approximation. For the proposed model for earth–satellite link, we found good agreement between the measured and predicted attenuation across different visibility levels. Hence, it is very important to design reliable earth–to–satellite links in arid areas.
Funding
The author extends his appreciation to the Deanship of Scientific Research at King Khalid University, KSA, for funding this work through the Small Research Group under Grant Number (R.G.P.1/127/46).
Data Availability Statement
The original contributions presented in this study are included in the article. Further inquiries can be directed to the author.
Conflicts of Interest
The author declares no conflicts of interest.
References
- Tirmizi, S.B.R.; Chen, Y.; Lakshminarayana, S.; Feng, W.; Khuwaja, A.A. Hybrid Satellite–Terrestrial Networks toward 6G: Key Technologies and Open Issues. Sensors 2022, 22, 8544. [Google Scholar] [CrossRef]
- Chen, H.-Y.; Ku, C.-C. Calculation of wave attenuation in sand and dust storms by the FDTD and turning bands methods at 10–100 GHz. IEEE Trans. Antennas Propag. 2012, 60, 2951–2960. [Google Scholar] [CrossRef]
- Harb, K.; Omair, B.; Abdul-Jauwad, S.; Al-Yami, A.; Al-Yami, A. A proposed method for dust and sand storms effect on satellite communication networks. In Proceedings of the Innovations on Communication Theory INCT, Istanbul, Turkey, 9–11 May 2012; pp. 33–37. [Google Scholar]
- Gu, Z.; He, Y.; Zhang, Y.; Su, J.; Zhang, R.; Yu, C.W.; Zhang, D. An overview of triggering mechanisms and characteristics of local strong sandstorms in China and haboobs. Atmosphere 2021, 12, 752. [Google Scholar] [CrossRef]
- Musa, A.; Bashir, S.O.; Abdalla, A.H. Review and assessment of electromagnetic wave propagation in sand and dust storms at microwave and millimeter wave bands—Part I. Prog. Electromagn. Res. M 2014, 40, 91–100. [Google Scholar] [CrossRef]
- Musa, A.; Bashir, S.O.; Abdalla, A.H. Review and Assessment of Electromagnetic Wave Propagation in Sand and Dust Storms at Microwave and Millimeter Wave Bands—Part II. Prog. Electromagn. Res. M 2014, 40, 101–110. [Google Scholar] [CrossRef]
- Musa, A.; Paul, B.S. Dust Particles’ Permittivity in Microwave Signal Propagation: A Review. J. Commun. 2020, 15, 38–44. [Google Scholar] [CrossRef]
- Alozie, E.; Musa, A.; Faruk, N.; Imoize, A.L.; Abdulkarim, A.; Usman, A.D.; Imam-Fulani, Y.O.; Adewole, K.S.; Oloyede, A.A.; Sowande, O.A.; et al. A review of dust-induced electromagnetic waves scattering theories and models for 5G and beyond wireless communication systems. Sci. Afr. 2023, 21, e01816. [Google Scholar] [CrossRef]
- Musa, A.; Camara, M.F.; Abdulla, A.H.; Bashir, S.O.; Hamed, S.M.A. Modeling of dust particles canting as input to microwave cross polarization. In Proceedings of the 2015 International Conference on Computing, Control, Networking, Electronics and Embedded Systems Engineering (ICCNEEE), Khartoum, Sudan, 7–9 September 2015; pp. 87–90. [Google Scholar] [CrossRef]
- Afzaal, K.; Bandopadhyaya, T.K.; Poonam, S. Effect of soil textural class and relative humidity of regions in accurate prediction of attenuation of millimeter waves during sand and dust storms. In Proceedings of the Fourth International Kharkov Symposium ‘Physics and Engineering of Millimeter and Sub-Millimeter Waves’. Symposium Proceedings (Cat. No.01EX429), Kharkov, Ukraine, 4–9 June 2001; Volume 1, pp. 393–395. [Google Scholar] [CrossRef]
- Harb, K.; Abdalla, A.T.; Mohamed, M.; Abdul-Jauwad, S. HAPs communication in Saudi Arabia under dusty weather conditions. In Proceedings of the 2013 IEEE 11th Malaysia International Conference on Communications (MICC), Kuala Lumpur, Malaysia, 26–28 November 2013; pp. 379–380. [Google Scholar] [CrossRef]
- Chu, T. BSTJ brief: Effects of sandstorms on microwave propagation. Bell Syst. Tech. J. 1979, 58, 549–555. [Google Scholar] [CrossRef]
- Ahmed, A.S.; Ali, A.A.; Alhaider, M.A. Airborne Dust Size Analysis for Tropospheric Propagation of Millimetric Waves into Dust Storms. Geosci. Remote Sens. IEEE Trans. 1987, GE-25, 593–599. [Google Scholar] [CrossRef]
- Goldhirsh, J. Attenuation and backscatter from a derived two-dimensional duststorm model. Antennas and Propagation. IEEE Trans. 2001, 49, 1703–1711. [Google Scholar] [CrossRef]
- Elabdin, Z.; Islam, M.R.; Khalifa, O.O.; Raouf, H.E.A.; Salami, M.J.E. Development of mathematical model for the prediction of microwave signal attenuation due to duststorm. In Proceedings of the 2008 International Conference on Computer and Communication Engineering, Kuala Lumpur, Malaysia, 13–15 May 2008; pp. 1156–1161. [Google Scholar] [CrossRef]
- Sharif, S.M. Attenuation properties of dusty media using Mie scattering solution. Prog. Electromagn. Res. M 2015, 43, 9–18. [Google Scholar] [CrossRef]
- Elsheikh, E.A.A.; Islam, M.R.; Habaebi, M.H.; Ismail, A.F.; Zyoud, A. Dust Storm Attenuation Modeling Based on Measurements in Sudan. IEEE Trans. Antennas Propag. 2017, 65, 4200–4208. [Google Scholar] [CrossRef]
- Dong, X.-Y.; Chen, H.-Y.; Guo, D.-H. Microwave and millimeter-wave attenuation in sand and dust storms. IEEE Antennas Wirel. Propag. Lett. 2011, 10, 469–471. [Google Scholar] [CrossRef]
- Shamim, M.Z.M.; Elsheikh, E.A.A.; Salih, F.E.M.S.; Islam, M.R. Signal Attenuation Prediction Model for a 22 GHz Terrestrial Communication Link in Sudan Due to Dust and Sand Storms Using Machine Learning. IEEE Access 2021, 9, 164632–164642. [Google Scholar] [CrossRef]
- Harb, K.; Butt, O.; Al-Yami, A.A.; Abdul-Jauwad, S. Probabilistic dust storm layers impacting satellite communications. In Proceedings of the 2013 IEEE International Conference on Space Science and Communication (IconSpace), Melaka, Malaysia, 1–3 July 2013; pp. 407–411. [Google Scholar] [CrossRef]
- Harb, K.; Abdillah, S.; Abdul-Jauwad, S. Dust & sand (DUSA) storms impact on LEO satellite microwave radio links. In Proceedings of the 2014 7th Advanced Satellite Multimedia Systems Conference and the 13th Signal Processing for Space Communications Workshop (ASMS/SPSC), Livorno, Italy, 8–10 September 2014; pp. 442–447. [Google Scholar] [CrossRef]
- Jervase, J.; Sharif, S. Influence of duststorms and reflector tolerance on cross polarization of earth satellite links. In Proceedings of the Arabsat Symposium, Riyadh, Saudi; 1988; pp. 166–169. [Google Scholar]
- Elsheikh, E.A.A.; Islam, M.R.; Al-Khateeb, K.; Alam, A.Z.; Elshaikh, Z.O. A proposed vertical path adjustment factor for dust storm attenuation prediction. In Proceedings of the 2011 4th International Conference on Mechatronics (ICOM), Kuala Lumpur, Malaysia, 17–19 May 2011; pp. 1–3. [Google Scholar] [CrossRef]
- Vishvakarma, B.R.; Rai, C.S. Limitations of Rayleigh scattering in the prediction of millimeter wave attenuation in sand and dust storms. In Proceedings of the IGARSS’93–IEEE International Geoscience and Remote Sensing Symposium, Tokyo, Japan, 18–21 August 1993; Volume 1, pp. 267–269. [Google Scholar] [CrossRef]
- Eltahir, E.I.; Islam, R.; Elsheikh, E.A.A.; Zyoud, A.; Abdalla, A.H.; Habaebi, M.H.; Rahim, S.K.A.; Hamdan, M. Review on Millimeter Wave Propagation Through Sand and Dust Storm—Impact of Humidity. IEEE Access 2025, 13, 149695–149718. [Google Scholar] [CrossRef]
- Harb, K.M.; Mitu, S.S.I.; Ullah, M.; Attia, H. Nonuniform Scattering of Microwave Radiation Due to Layered DUSA Storm: Theory and Experiment. IEEE Can. J. Electr. Comput. Eng. 2021, 44, 384–389. [Google Scholar] [CrossRef]
- Elsheikh, E.A.A.; Rafiqul, I.M.; Habaebi, M.H.; Zyoud, A.; Suliman, F.E.M.; Eltahir, E.I.; Amin, N.W. Effect of Dust Storm Intensity Variations on Total Path Attenuation Prediction. IEEE Trans. Antennas Propag. 2021, 70, 2884–2890. [Google Scholar] [CrossRef]
- Ouyang, Q.; Ye, N.; An, J. On the Vulnerability of Mega-Constellation Networks Under Geographical Failure. IEEE Trans. Netw. 2025, 33, 2049–2062. [Google Scholar] [CrossRef]
- Lee, J.-Y.; Lim, B.; Ko, Y.-C. Performance analysis of multi-hop low earth orbit satellite network over mixed RF/FSO links. ICT Express 2024, 10, 1051–1058. [Google Scholar] [CrossRef]
Disclaimer/Publisher’s Note: The statements, opinions and data contained in all publications are solely those of the individual author(s) and contributor(s) and not of MDPI and/or the editor(s). MDPI and/or the editor(s) disclaim responsibility for any injury to people or property resulting from any ideas, methods, instructions or products referred to in the content. |
© 2025 by the author. Licensee MDPI, Basel, Switzerland. This article is an open access article distributed under the terms and conditions of the Creative Commons Attribution (CC BY) license (https://creativecommons.org/licenses/by/4.0/).