1. Introduction
With the proposal and promotion of strategic goals such as the Paris Agreement and the “30·60” dual-carbon goals [
1,
2], renewable energy, represented by photovoltaic (PV) and wind turbine generation (WTG), is being installed and accessed to distribution network with high proportion. The renewable energy can effectively reduce carbon emissions during power generation and consumption [
3,
4]. The global installed capacity of renewable energy achieved significant growth in 2024, with a total capacity of 4448 gigawatts (GW). The 585 GW new installed capacity added in 2024 accounts for 92.5% of the global new installed power capacity. The total installed capacity of solar and wind energy increased by 32% and 11%, respectively. Renewable energy accounted for 31% of the total global power generation [
5,
6]. But its output uncertainty and intermittency may cause voltage fluctuation and complex power flow change, seriously affecting the safety operation for distribution network [
7,
8]. In addition, rapid economic development has led to a large number of user load installation, which also pose challenges to its secure and stable operation. It is crucial to scientifically and effectively evaluate the distribution network reliability under renewable energy and user load installation.
Previous studies have extensively focused on distribution network reliability assessment [
9,
10,
11]. The reliability assessment of distribution network with distributed generation (DG) are as follows: Jooshaki et al. [
12] proposed a reliability evaluation method for distribution network with unknown topology structure on basis of the hybrid linear formulation. Karngala et al. [
13] proposed a new reliability evaluation model of distribution network by considering the DG, energy storage systems (ESS), and resource coordination. Zhang et al. [
14] proposed a reliability assessment model of distribution network based on the data-driven and model-driven method. Zhang et al. [
15] proposed a multi-state reliability analysis method to discuss distribution network with ESS. Meera et al. [
16] systematically summarized several key reliability enhancement technologies. Vargas et al. [
17] proposed a variable-frequency inter-harmonic domain-modeling method to improve the reliability of the distribution network.
In terms of distribution network fault reconfiguration, Li et al. [
18] introduced a discrete multi-modal to enhance the robustness of fault reconfiguration solution. Yang et al. [
19] discussed a fault recovery and reconfiguration strategy for distribution network based on hybrid particle swarm optimization approach. Mahdavi et al. [
20] investigated an efficient linearized model for distribution network reconfiguration by considering load diversity and temperature dependence. Fan et al. [
21] examined a fault reconfiguration model for distribution network by Boolean expression. Liu et al. [
22] introduced a hybrid framework integrating both data-driven and model-driven methods. Mo et al. [
23] discussed a novel fault classification and location method for distribution network by integrating super-resolution techniques and graph neural network. Shang et al. [
24] proposed a novel deep reinforcement learning method to address the dynamic fault reconfiguration problem in real time for ship power system. Wen et al. [
25] proposed a dynamic reconfiguration method considering real-time initial topology changes to optimize the operation of distribution network. Ben et al. [
26] proposed a multi-objective optimization method that combines distribution network reconfiguration with the siting and sizing of DG. He et al. [
27] optimized congestion management in distribution network through network reconfiguration and demand response. Cao et al. [
28] proposed a coordinated topology reconfiguration method for power distribution network.
In summary, many results have been achieved in the reliability of distribution network, but further exploration is still needed:
- (1)
The existing distribution network reliability assessment methods predominantly focus on a single reliability index, which fails to establish an effective multi-dimensional reliability evaluation system. In addition, the influence of fault reconfiguration, the integration of WTG and PV, ESS, and user load on the distribution network is not fully analyzed.
- (2)
The most existing reliability assessment methods of distribution network only consider operational constraints, such as node power balance and line voltage drop limits. However, in engineering practice, critical practical constraints, such as cyber–physical constraints in engineering practice and topological constraints during fault reconfiguration and islanding processes, also need to be considered seriously.
- (3)
The existing fault reconfiguration of distribution network primarily focuses on minimizing load shedding, which lacks the comprehensive evaluation of load restoration capabilities in scenarios with the integration of WTG, PV, ESS, and user load. And the accurate quantification of total restored load and realistic post-fault scenarios in distribution network also cannot be intuitively reflected and manifested.
The paper’s main innovations and contributions are as follows:
- (1)
A multi-dimensional reliability evaluation system is established, in which the reliability evaluation indices for distribution network, including system average interruption duration indicator (SAIDI), customer average interruption duration indicator (CAIDI), system average interruption frequency indicator (SAIFI), and average service availability indicator (ASAI), are introduced, and the influence of the fault reconfiguration, the distributed generation installation, the types of distributed generation installation, the distributed generation installation capacity, and the new load installation access points are fully discussed and analyzed from multiple perspectives in our study.
- (2)
The radial topology constraints of fault reconfiguration and island division, cyber–physical constraints, and system operation constraints are comprehensively considered to conform to the engineering reality in our study.
- (3)
A post-fault load restoration model for distribution network by considering fault reconfiguration and multiple constraints is established in our study. In the model, an objective function centered on maximizing the total load recovery is considered, and the integration of renewable energy and user load is studied.
Given the above, this paper proposes a multi-dimensional reliability evaluation method of distribution network under renewable energy installation and load installation, considering fault reconfiguration and multiple constraints. Firstly, the component state transition model for the distribution network, the photovoltaic output model, wind turbine generation, and the charging and discharging model of energy storage systems are presented. Secondly, a post-fault load restoration model for distribution network by considering fault reconfiguration and multiple constraints under distributed generation integration is established in our study. Subsequently, the reliability evaluation indices, including SAIDI, CAIDI, SAIFI, and ASAI, are introduced, and the process of evaluating reliability founded on the sequential Monte Carlo simulation is explained. Finally, the proposed methodology was subjected to validation using the IEEE 69-node distribution network as a simulation platform.
2. Distribution Network-Related Output Model
2.1. Component State Transition Model
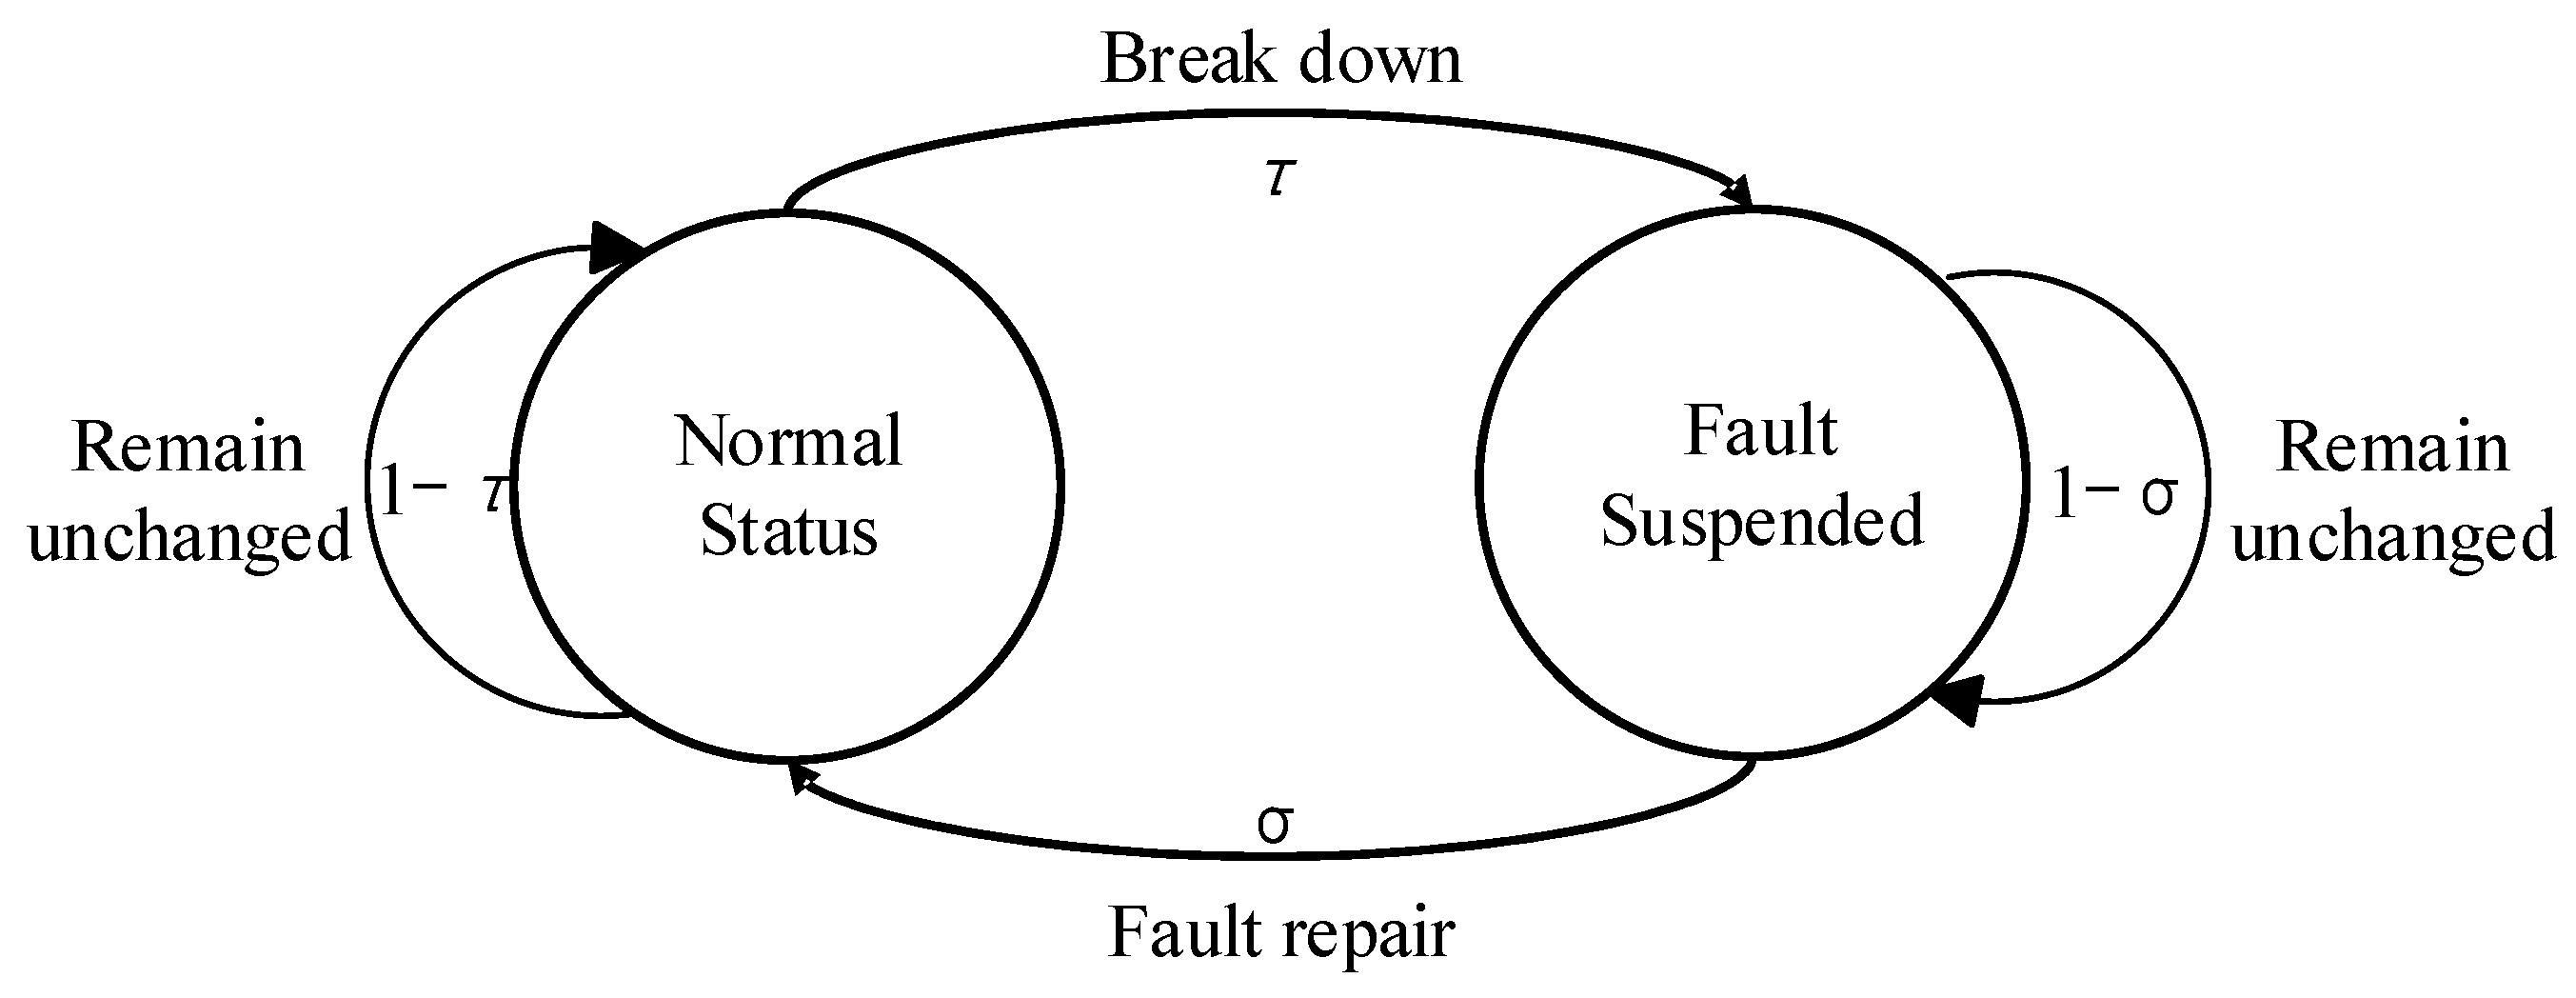
In a reliability assessment of distribution network, to quantitatively describe the probability of a component being in operational or failed states over time, a continuous-time Markov model is employed in our study [
29]. Based on the Markov principle, a state transition model of the component is illustrated in
Figure 1.
It is assumed that the failure-free operating time and repair time of the component follow an exponential distribution, and component state transition model can be regarded as a homogeneous Markov process [
30,
31]. The probability
P0(
t) of the component being in state 0 and the probability
P1(
t) of being in state 1 at time
t can be calculated, respectively, as shown in Equation (1):
In Equation (1), P0(t) and P1(t) represent the probabilities of the component being in state 0 and state 1 at time t, respectively; τ denotes the failure rate; σ denotes the repair rate.
2.2. PV Output Power Model
The output power of the photovoltaic system primarily depends on solar irradiance [
32,
33], which exhibits significant diurnal periodicity, seasonal variations, and weather-related persistence characteristics. To accurately represent these features in the annual time series simulation, the following method is adopted in this study.
Firstly, based on the typical meteorological year data recorded by the local weather station and the clear-sky irradiance model, a reference irradiance time series
is obtained. This series characterizes the diurnal and seasonal variation trends throughout the year. Secondly, to simulate short-term random fluctuations caused by weather disturbances, a first-order autoregressive model is employed to construct a stochastic residual sequence. It generates the fitted irradiance time series
G(
t), as shown in Equation (2):
In Equation (2),
denotes the random deviation at time
t;
represents white noise following a standard normal distribution;
is the autoregressive coefficient that characterizes the temporal continuity of irradiance and can be determined based on local meteorological conditions;
denotes the intensity of random disturbances.
In Equation (3), PPV(t) and represent the actual and maximum output power of the PV, respectively; Gstd represents the irradiance under standard test conditions; denotes the overall efficiency of the photovoltaic system.
2.3. Wind Turbine Generation Output Model
The output power of a wind turbine is determined by wind speed [
34]. And it exhibits both seasonal variations and short-term temporal correlations. In this study, hourly wind speed data from a typical meteorological year are used as the baseline to capture the deterministic seasonal trend. To represent the stochastic fluctuations caused by atmospheric disturbances, a first-order autoregressive model is introduced. And it generates the simulated wind speed sequence
v(
t), as shown in Equation (4):
In Equation (4), is the baseline hourly wind speed profile obtained from multi-year meteorological data; denotes the random deviation at time t. is the autoregressive coefficient describing short-term persistence of wind condition; is the volatility parameter; and is a standard normal random variable.
The output power of the wind turbine is calculated based on its standard power characteristic curve, as shown in Equation (5):
In Equation (5), va denotes the cut-in wind speed; vb denotes the rated wind speed; vc denotes the cut-out wind speed; Pr is the rated power of the wind turbine.
2.4. ESS Charging and Discharging Model
Due to the high efficiency of charging and discharging and longer period life, lithium batteries are extensively deployed as ESS in power system to balance the power fluctuations between DG and load demand [
35]. Consequently, lithium batteries are used as ESS in our study, and the corresponding charging and discharging model is as follows in Equation (6):
In Equation (6), PESS,ch(t) and PESS,dis(t), respectively, represent the charging power and discharging power for ESS; Pmax,ch and Pmax,dis represent the maximum charging power and discharging power for ESS, respectively; μch(t) and μdis(t) are 0–1 variables, representing the charging and discharging states of the ESS, respectively. They cannot both be 1 at the same time to prevent simultaneous charging and discharging of the ESS.
The dynamic update equation of the core state variable of the ESS—the state of charge—is shown in Equations (7) and (8):
In Equations (7) and (8), S(t) represents the remaining capacity for ESS at time t; ηch and ηdis represent the charging efficiency and discharging efficiency of the ESS, respectively; Smax and Smin represent the upper limit and lower limit for ESS capacity, respectively. At the start of the simulation, the initial SoC of the ESS is set to 50%.
3. A Post-Fault Load Restoration Model for Distribution Network by Considering Fault Reconfiguration and Multiple Constraints
3.1. Objective Function
When a fault occurs in distribution network, the distributed generation output can be quickly adjusted by the information network to increase load recovery. Meanwhile, fault reconfiguration and islanding are also effective methods for load supply of distribution network [
36]. To ensure maximum power supply to the user, an optimal load restoration model considering fault reconfiguration, island partitioning, and cyber–physical constraint is established. The corresponding objective function is shown in Equation (9), and the related constraints are described in
Section 3.2.
In Equation (9), F represents the total load recovery after the fault; Fj represents the load recovery after distribution network fault reconfiguration. This portion of the load is supplied by changing the switch status in the network. And it allows the fault-isolated area to receive power from other sources in the main grid. Yj refers to the load nodes outside the island; Nj is the number of load nodes outside the island; is the load weight of the Yj-th node outside the island; represents the active power of the Yj-th node; is a binary variable indicating whether the Yj-th node is included in the island. If = 0, it means the Yj-th node is not connected to the island. If = 1, it means the Yj-th node is connected to the island. Fis represents the load recovery associated with island formation. This portion of the load is restored by using distributed power sources downstream of the fault area to form an independently powered island. ND refers to the number of load points; Kis represents the island within distribution network; φ is the set of islands; ri is the weight of the i-th load; Pi represents the active power of node i load; αi indicates whether node i is included in the island.
3.2. Multiple Constraints
3.2.1. The Radial Topology Constraints of Fault Reconfiguration and Island Division
For load restoration in distribution network, maintaining a radial topology is an important constraint. When multiple faults occur in distribution network, the restoration strategy must ensure the normal operation of non-faulted areas and the power supply recovery of faulted areas [
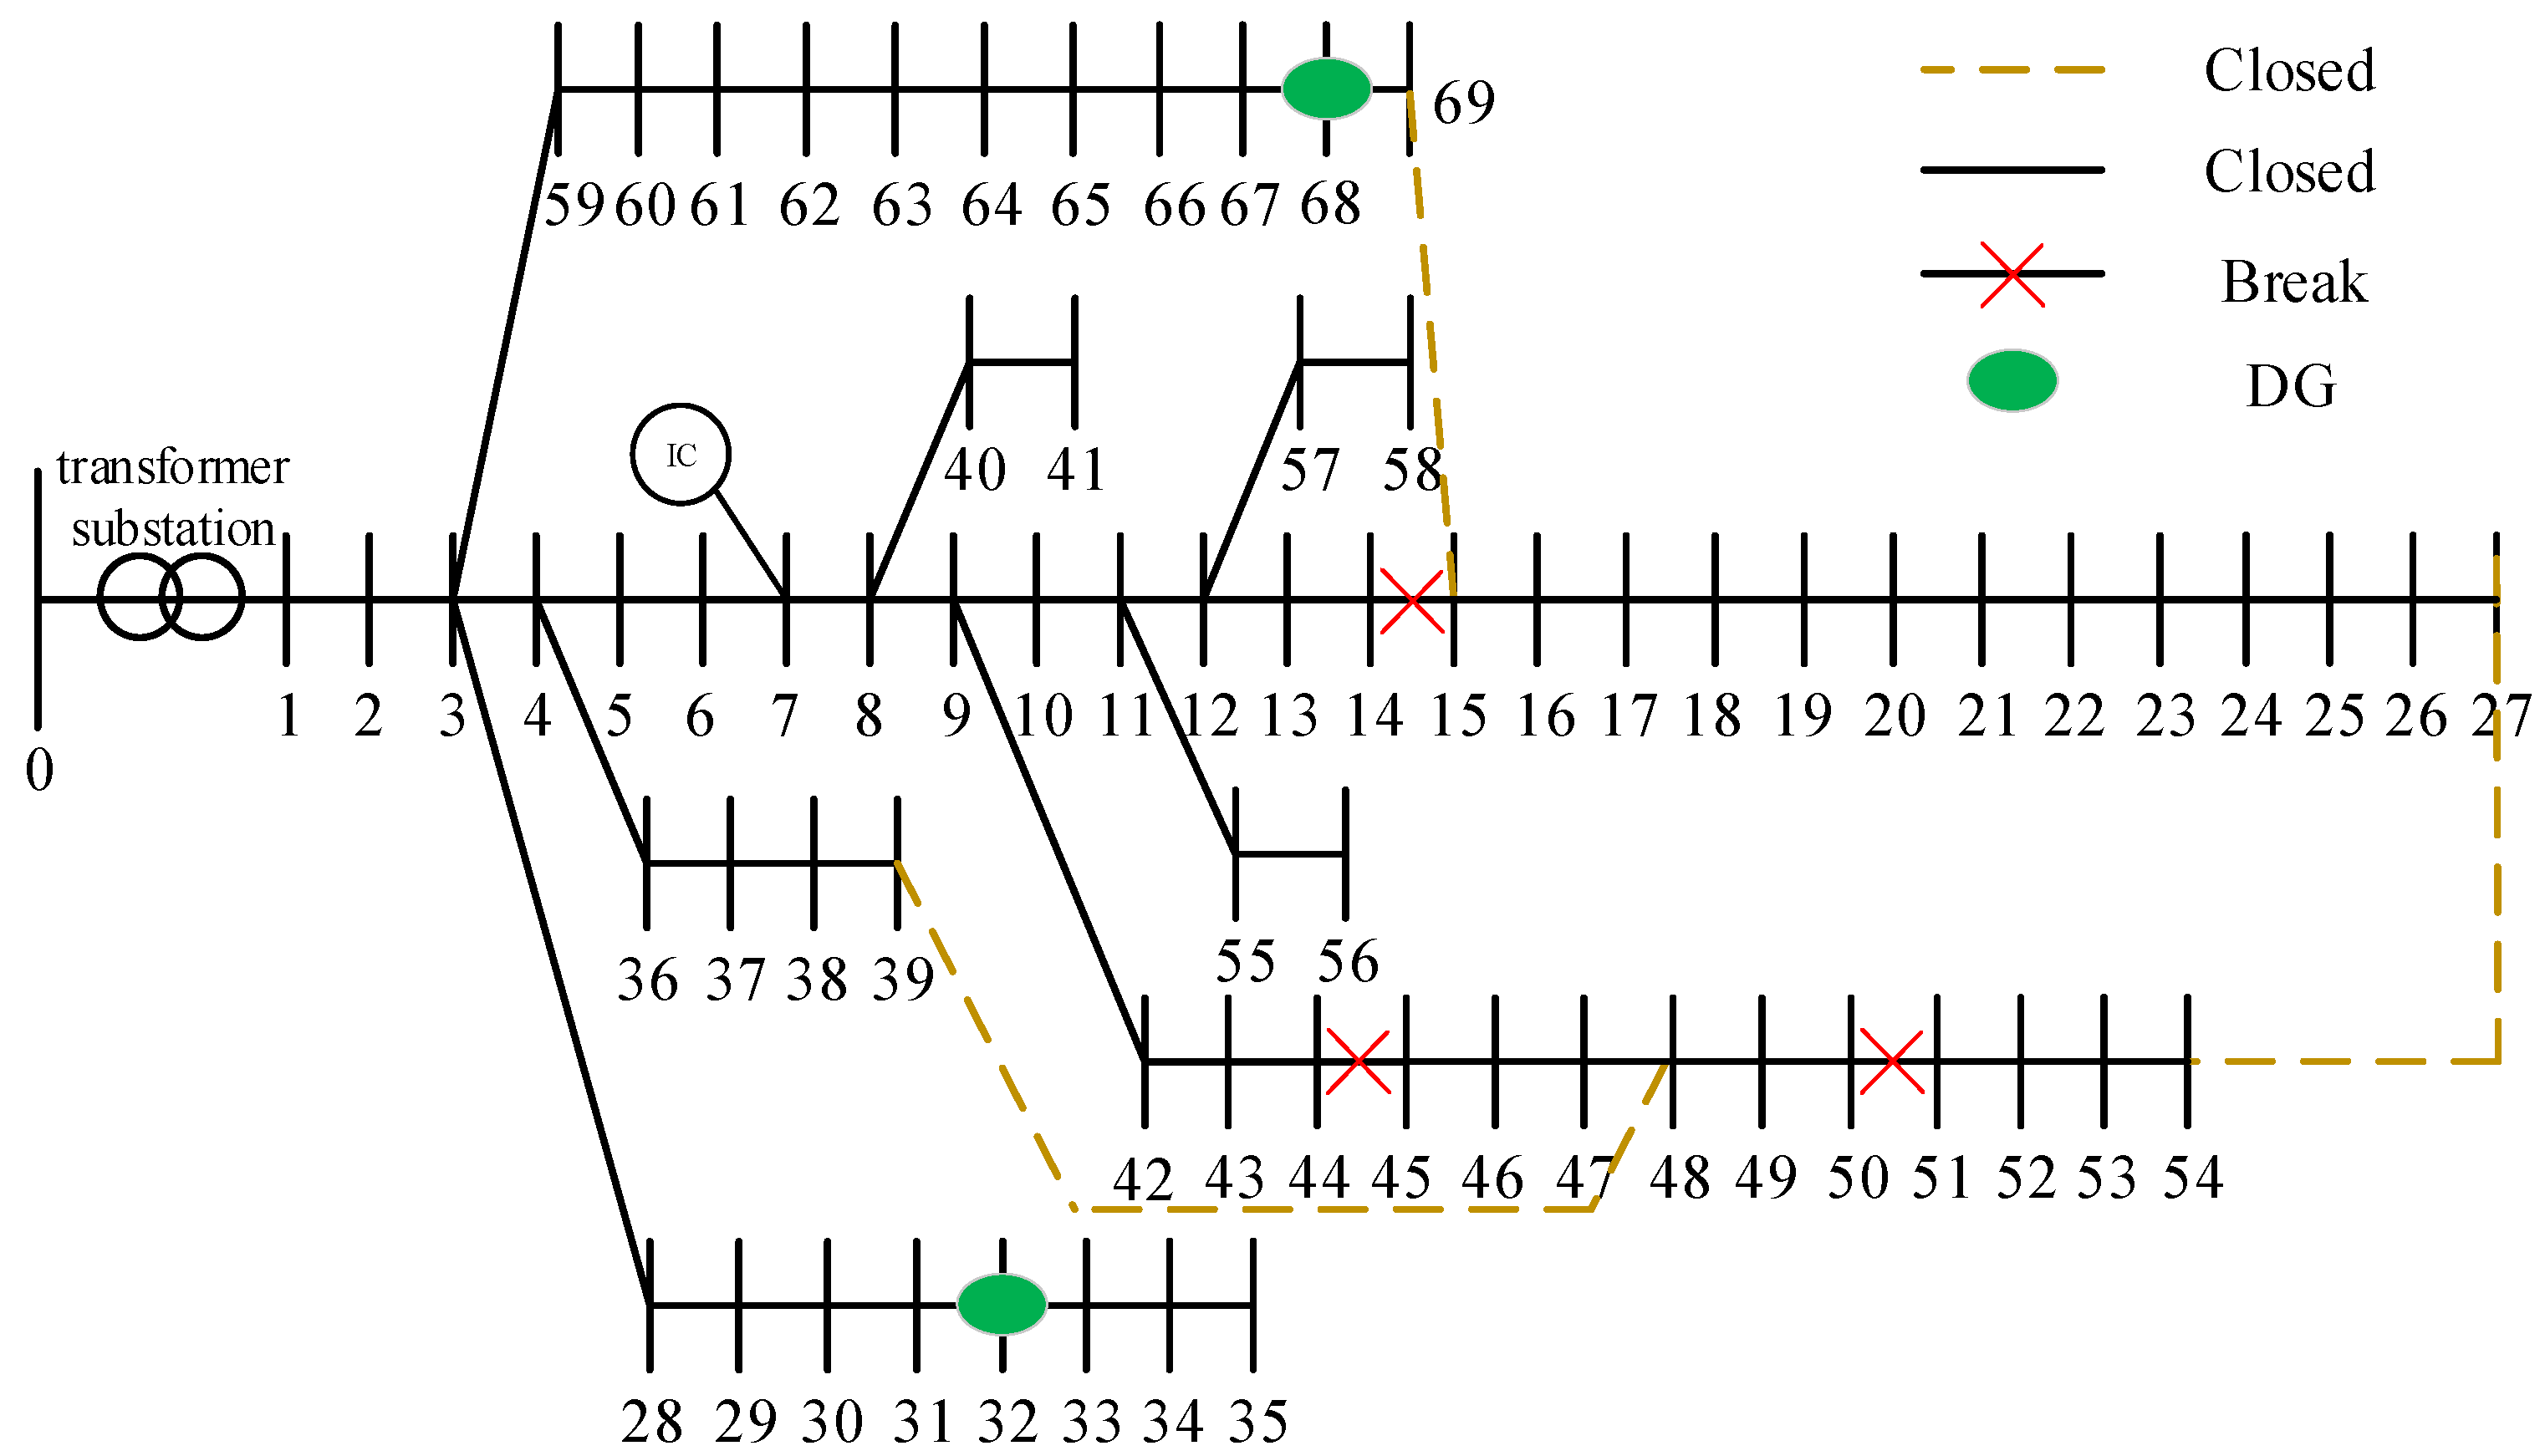
37]. Islanded operation becomes a key strategy—especially for nodes equipped with DG. For instance, three faults occur in the distribution network in
Figure 2. Nodes 2 and 3 are installed with DG, which can form independently powered islands. In contrast, nodes 4 and 5 form power-loss islands due to lack of DG to establish effective power supply.
- (1)
When operating on an isolated island, the power generation of DG must be equal to the sum of the total load power and the network loss, as shown in Equation (10).
In Equation (10), represents the island index; represents the total number of DG within island ; represents the total number of load nodes; and , respectively, represent the active power output and reactive power output of the iD-th DG; and , respectively, represent the active and reactive power demands for the node i; and , respectively, represent the active power loss and reactive power loss.
- (2)
The distribution network lines must satisfy connectivity and radiality constraints. The directed virtual multi-commodity flow model based on spanning tree constraints ensures network connectivity by describing the flow of commodities within the network. And it achieves the radial requirements through further extension and interruption of the spanning tree, as shown in Equations (11)–(14).
In Equations (11)–(14), N is the set of all nodes in distribution network; B is the set of all lines in distribution network; s is the substation node; Fl,ij is the virtual flow sent to node l via the directed line ij; μij is a 0–1 variable, where μij = 1 if the directed line ij is included in the directed spanning tree, otherwise μij = 0; λij is a 0–1 variable, where λij = 1 if the virtual connection status of the directed line ij is closed, otherwise λij = 0; βij is a 0–1 variable, where βij = 1 if line ij is closed, otherwise βij = 0. Equation (11) provides a unified description of the balance between the inflow and outflow of virtual goods; Equation (12) links the virtual flow and the branch-status variable to ensure that no flow passes through an open line; Equation (13) specifies the number of directed lines in the spanning tree; Equation (14) associates the spanning tree with virtual connections and actual connection states.
3.2.2. Cyber–Physical Constraints
In a cyber–physical system, the power network and the communication network form a bidirectional coupling relationship. On one hand, power infrastructure provides the necessary electrical support for the communication node. On the other hand, the communication network enables intelligent control of power devices. This deep interaction leads to a cascade failure characteristic within the system. When a power node experiences an anomaly, its associated communication node may fail due to power loss; conversely, a fault in a communication node may prevent the corresponding power device from being properly controlled [
38]. When the distribution network nodes perform load restoration operations, whether the corresponding information nodes can function normally can be determined according to the constraint [
39], as shown in Equation (15).
In Equation (15), σi is the power supply state indicator variable for information node i (σi = 1 is normal, and σi = 0 is unpowered); Πi denotes the set of distribution network nodes connected to information node i; Pj represents the active power demand at distribution node j; is the amount of load restored at distribution node j; ϕ denotes the coupling degree between the information network and the distribution network, with a value range of [0, 1]. And a larger ϕ value indicates a stronger degree of coupling.
When an information node fails, the corresponding distribution network node must comply with the following constraints:
In Equation (16), εi is a 0–1 variable. If information node i is normally connected to the IC, then εi = 1; otherwise, εi = 0. d represents the DG node, and s represents the substation node. and represent the output of substation node and DG node, respectively. and are the maximum output limits of the substation node and the DG node, respectively. It indicates that when an information node fails, the energy supply equipment of the corresponding distribution network should stop supplying energy.
The effective connection between each information node and the information central node is the guarantee of its normal operation, as expressed in Equation (17).
In Equation (17), is a binary variable. If the link between information node and information node z is functioning properly, ; otherwise, ; t denotes the IC node; Z1,…, Zm represent the intermediate nodes on the path connecting information node to the IC.
To overcome the challenge of solving under complex network structure, equivalent constraints are introduced as follows.
In Equations (18) and (19), E represents the set of links in the information network; denotes the number of links connected to the information node. Equation (18) indicates that the IC node is properly connected; Equation (19) indicates that the operational status of other nodes is determined by checking whether they are connected to the functioning information node.
3.2.3. System Operation Constraints
This paper uses the DistFlow model to establish distribution network constraints, and introduces load-shedding variables and line connection status variables to reflect fault reconstruction [
40]. The constraints include line voltage drop balance constraints, power balance constraints, fault line constraints. And the second-order cone relaxations of voltage, current, and power relationships are expressed in Equations (20)–(26).
In Equations (20)–(26), Vj is the square of the voltage magnitude at node j; Iij is the square of the current magnitude of branch ij; M is a very large positive number; rij and xij are the resistance and reactance of branch ij, respectively; βij∈ (0, 1) indicates the connectivity state of branch ij; u is the set of upstream branches of node j; v is the set of downstream branches of node j; Pij and Qij are the active and reactive power of branch ij, respectively; Ps,i and Qs,i are the active and reactive power injected at the substation node, respectively; Pg,i and Qg,i are the active and reactive power output of the distributed generation nodes, respectively; Pj and Qj are the active and reactive load demands of node j, respectively. Equations (20) and (21) are the line voltage drop balance constraints, which are satisfied using the big-M method to accommodate the varying topologies of complex distribution networks. Equations (22) and (23) represent the power balance constraints at the nodes. Equations (24)–(26) are the constraints on active power, reactive power, and current for faulty lines.
When a line fault occurs in the distribution network, if all power sources are unable to supply node
j, then the load at that node must be disconnected; if there is a power source that can supply node j, whether the load at that node is disconnected is determined by scheduling. According to the handling method in Equation (19), a variable γ
j is set to represent the power supply status of node
j, which satisfies
In Equations (27) and (28), γj is a 0–1 variable. If node j is powered on, then γj = 1; otherwise, γj = 0. Equation (27) represents the relationship between node power-on and load shedding; Equation (28) indicates that the power supply node is powered on.
3.3. Model Optimized Solution Using Enhanced Fireworks Algorithm
The post-fault load restoration model established in
Section 3.1 and
Section 3.2 belongs to a typical mixed-integer nonlinear programming problem. Intelligent optimization algorithms (e.g., genetic algorithm and artificial bee colony algorithm) can effectively address such problems [
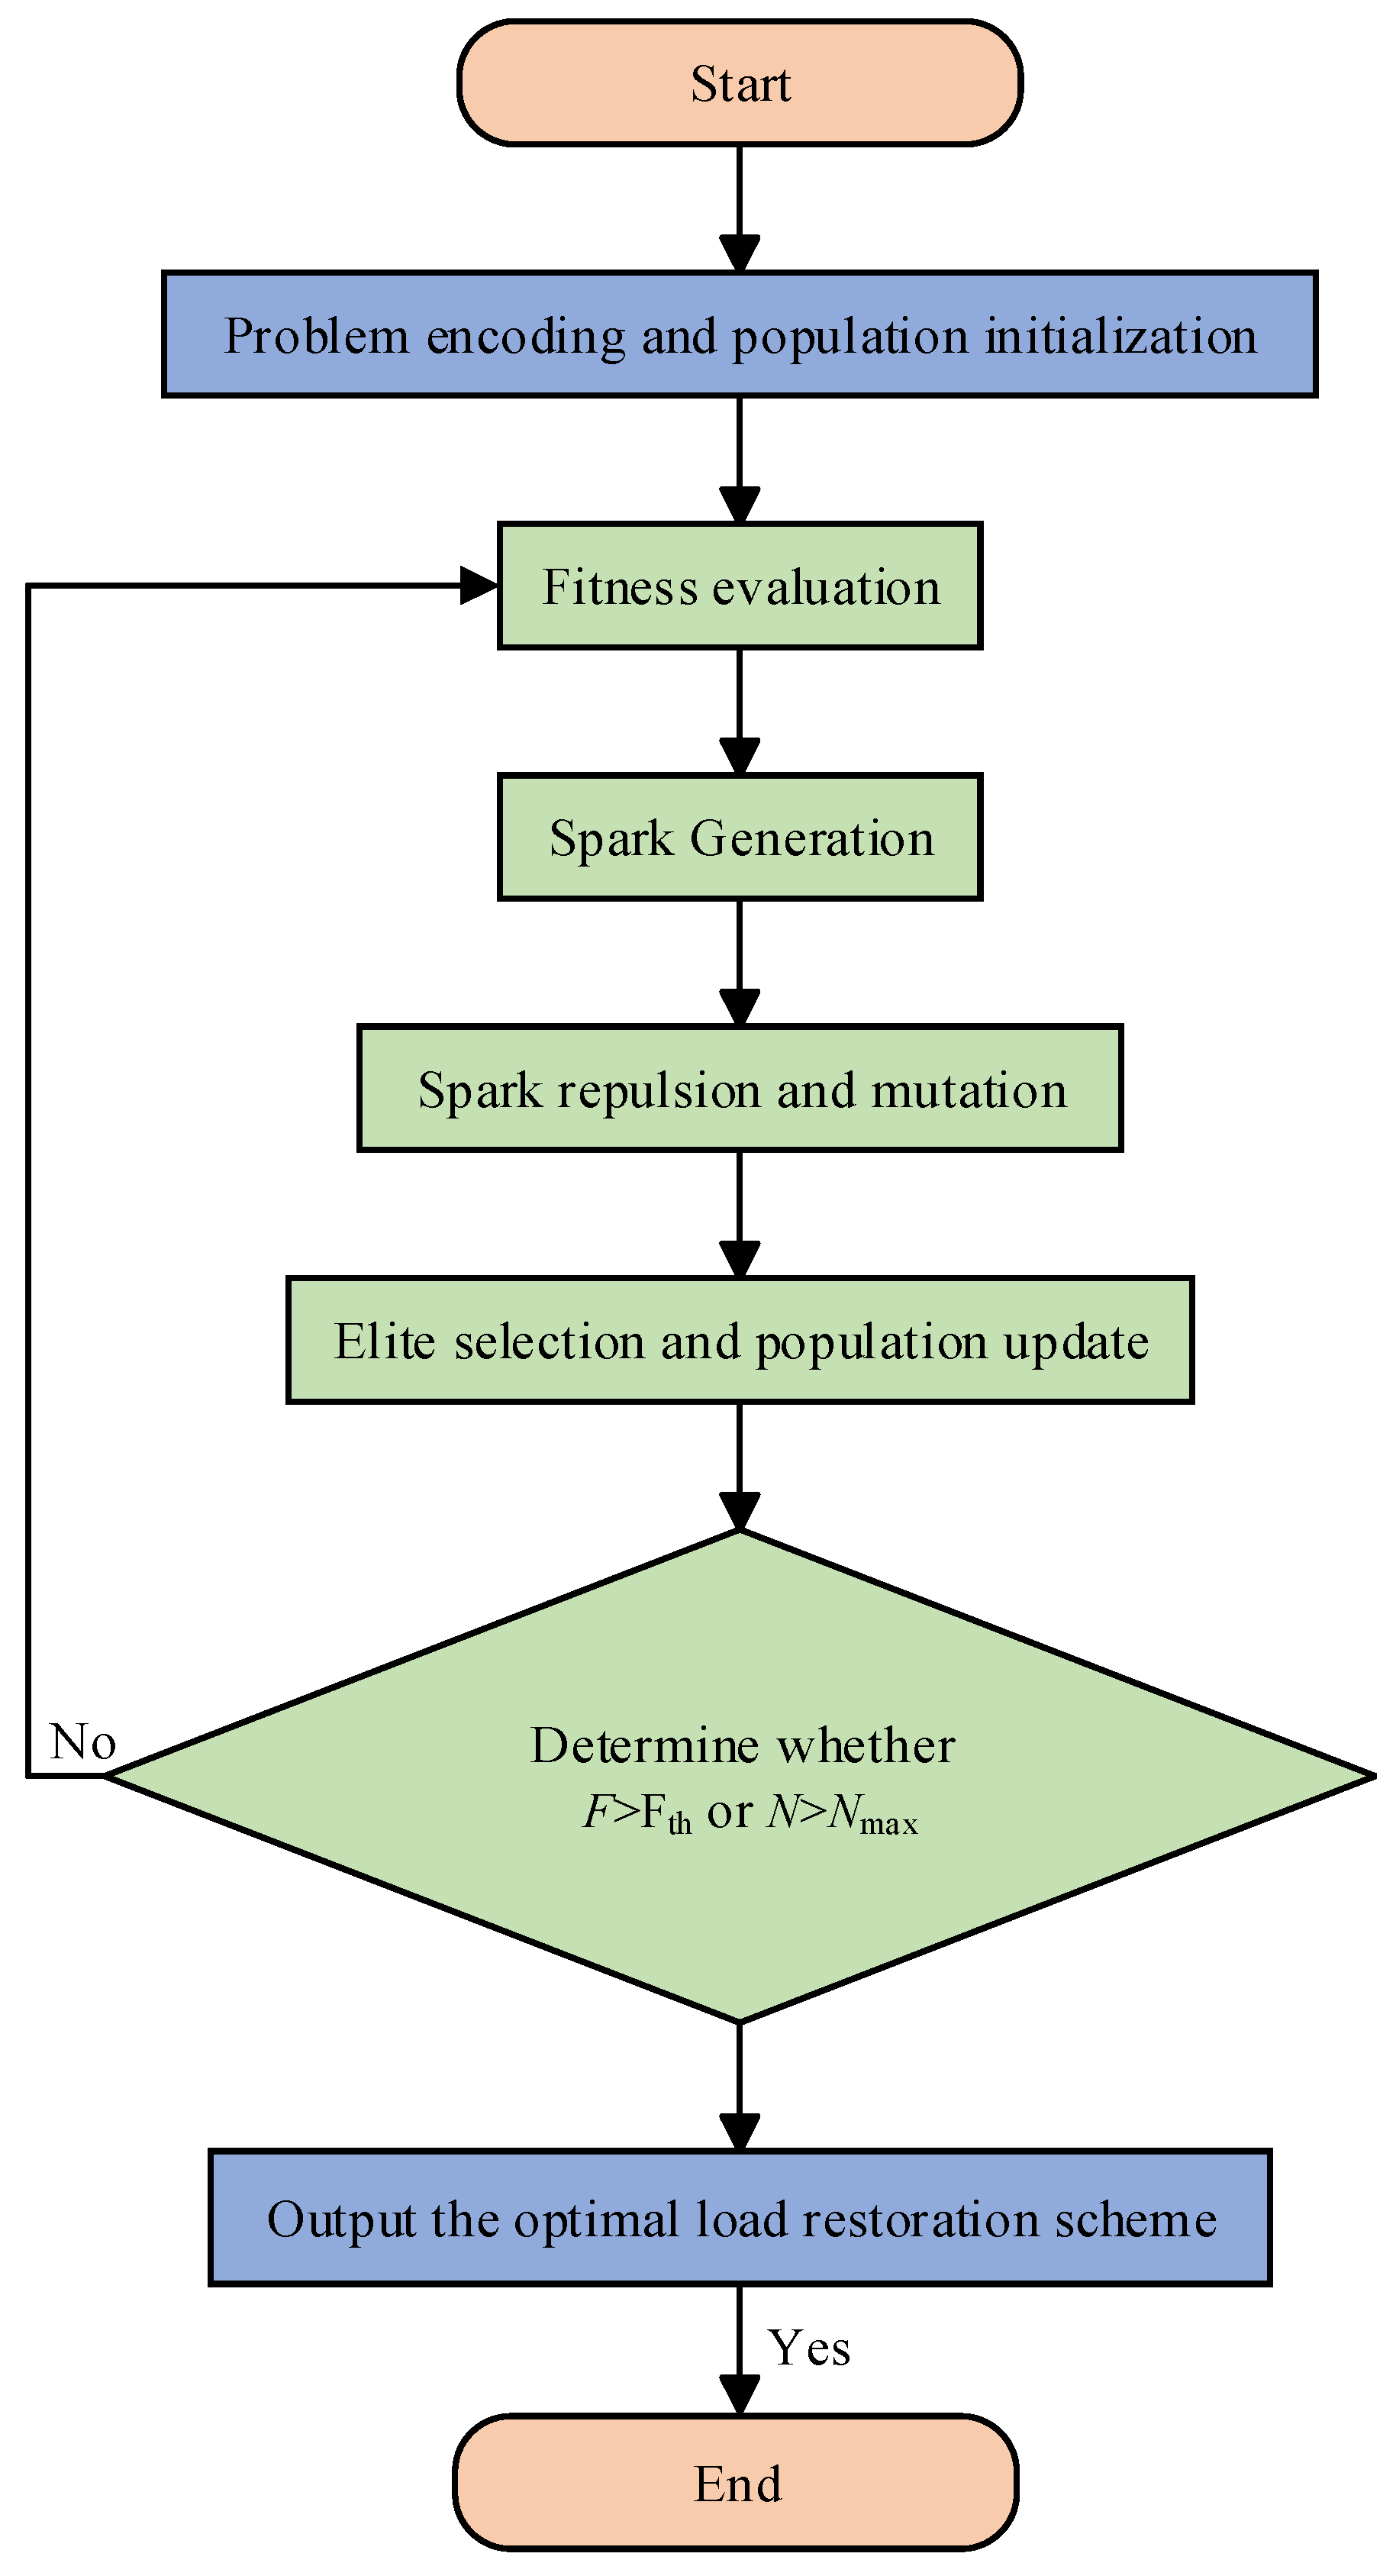
41]. Compared with other algorithms, the enhanced fireworks algorithm (EFA) has advantages of better cohesiveness and dispersibility, high adaptability, and strong local and global search capabilities. So, this study adopts it to solve the proposed load restoration optimization model, as shown in the following steps and
Figure 3. Other intelligent optimization algorithms are also capable of solving such problems, but the comparisons with them are beyond the scope of this paper.
Step 1: Generate the initial population using a segmented hybrid encoding method. The first segment uses binary encoding to represent islanding decision variables. The second segment uses integer encoding to represent switch statuses, incorporating reconfiguration time-interval constraints. The third segment uses continuous encoding to represent the power output levels of distributed generators.
Step 2: Randomly generate a certain number of solutions encoded in this manner to form the initial population. The initial number of fireworks is set to
NPOP = 50, which ensures population diversity while effectively controlling computational cost. And each solution represents a potential fault restoration scheme.
In Equation (29), F represents the total load recovery after the fault; Cj represents the load recovery after the reconfiguration; Cis represents the load recovery associated with island formation.
Step 3: Each firework generates a certain number of sparks based on its fitness value. The explosion amplitude Ai of each firework i is dynamically calculated, but its value is constrained within the range [Amin, Amax], where Amin = 10−5 ensures local search accuracy, and Amax = 50 prevents excessive dispersion during the early search stage. Higher-quality fireworks produce a larger number of sparks with a smaller explosion amplitude. Lower-quality fireworks produce fewer sparks but with a larger explosion amplitude.
Step 4: Introduce the repulsion factor to adjust spark positions.
In Equation (30), H denotes the fireworks generated in the fireworks algorithm; L represents the position of the generated fireworks; n indicates the dimension of the fireworks; denotes the position vector after repulsion adjustment; represents the n dimensional position component of the spark; denotes the repulsion factor.
Step 5: A mutation operation is subsequently performed. The mutation rate is set to pm = 0.2, meaning that 20% of the individuals in the population undergo mutation. And it prevents premature convergence.
Step 6: The next-generation population is formed by selecting the individuals with the best fitness from the current fireworks and sparks.
Step 7: The process terminates when the number of iterations N > Nmax or the objective function F > Fmax is satisfied, and the total restored load is then output.
To verify the effectiveness and superiority of the EFA in solving the fault recovery model proposed in this study, a comparative analysis is conducted with the genetic algorithm (GA). Both algorithms adopt the same population size of 50 and a maximum number of iterations of 500. They are executed under the test case presented in
Section 5.1.2, and the comparison of their convergence curves is shown in
Figure 4.
As analyzed from
Figure 4, considering both convergence speed and stability, the EFA outperforms the genetic algorithm in solving the complex fault recovery model proposed in this study. Its efficient global search capability and robust convergence characteristics ensure the rapid generation of high-quality and feasible power restoration strategies after faults for distribution network.
4. Reliability Assessment Method for Distribution Network Based on the Monte Carlo Simulation
In engineering practice, to effectively evaluate the power supply reliability and power quality of distribution network, multiple reliability indices are used to reflect the reliability of the distribution network from multiple perspectives, including distributed generation installation, types of distributed generation installation, distributed generation installation capacity, and new load installation access points. In this paper, SAIDI, CAIDI, SAIFI, and ASAI are adopted as evaluation indicators [
42,
43].
4.1. Assessment Indicators
- 2.
CAIDI:
- 3.
SAIFI:
- 4.
ASAI:
Assuming that the total system load corresponds to
Ntotal users, and the number of users at each node is allocated according to its load proportion,
In Equation (35), Pi represents the load at node i; Ni denotes the number of users associated with node i.
4.2. Assessment Process
Based on the load restoration model with fault reconfiguration and multiple constraints established in
Section 3, multiple reliability indices are considered in our study. And the sequential Monte Carlo simulation is applied to perform reliability evaluation of the distribution network under renewable energy installation and load installation, with the following steps and
Figure 5.
Step 1: Load the component data of the distribution network after fault reconfiguration, along with the corresponding load point data. Set the simulation clock to Tsim = 0, the total simulation duration to Ttotal = 8760 h, and the maximum number of simulation runs to Nmax = 10,000. The fault location and isolation time is set to TF1 = 120 s, the switching operation time to TSW = 30 s per operation, and the DG startup synchronization time to TDG/ESS = 30 s.
Step 2: Perform random sampling of component states based on the sequential Monte Carlo simulation method. For each component, a random failure-free operating time is generated as . R1 is a random number with the interval [0, 1]; and τ is the failure rate. The component with the minimum TTF is selected as the failed component, and the next event time is set as .
Step 3: At time Tsim, component m fails. The repair time of this component is sampled as . R2 is a random number uniformly distributed in the interval [0, 1], and σ is the repair rate. The sampled TTR is simultaneously considered as the system fault duration, and the repair completion time is given by .
Step 4: Advance the simulation clock from
Tsim to
Tnext. Within the time interval [
Tsim,
Tnext], renewable energy outputs and loads are updated at a fixed time step ∆
t. The irradiance
G(
t) and wind speed
v(
t) at each time step are retrieved from the pre-generated sequences. And the photovoltaic output
PPV(
t) and wind turbine output
Pwind(
t) are calculated using the power models described in
Section 2.2 and
Section 2.3, respectively. Meanwhile, the state of charge of the ESS is updated according to the operating condition of the grid.
Step 5: During the fault duration [
Tsim,
Trepair], the fault recovery optimization model established in
Section 3 is invoked. A fault traversal search is then conducted to identify the set of load points in the distribution network affected by the failure of component
m. Network reconfiguration and island partitioning are performed to optimize the spatial distribution of energy resources. Optimize the allocation of energy resources through ESS and wind–solar output.
Step 6: Advance the simulation clock directly to the repair completion time, Tsim = Trepair. Based on the optimized recovery results obtained in Step 5, the outage duration for each load point is calculated as follows: if restored through main grid reconfiguration: Toutage = TF1 + (Naction × TSW); if restored through islanded operation, Toutage = TF1 + (Naction × TSW) +TDG/ESS; if not restored, Toutage = TTR; Naction is the total number of switching operations. The cumulative outage frequency and duration for each load point are then updated, and the data from this simulation are aggregated into the annual reliability indices.
Step 7: For the repaired component m, resample a new TTF. Compare the next event times of all components to determine the new TTFmin and Tnext. If Tnext ≥ Ttotal, the current annual simulation ends; otherwise, return to Step 2.
Step 8: Output the reliability indices of individual load points and the overall system reliability indices.
5. Case Study Analysis
In this section, the improved IEEE 69-node distribution network is applied to the case study [
44], with DG installed at nodes 32 and 68. Firstly, the influence of DG installation on the fault reconfiguration characteristics of the distribution network is studied. Secondly, multi-dimensional reliability indices, such as SAIDI, CAIDI, SAIFI, and ASAI, are deeply investigated and analyzed from multiple perspectives, including the installation of DG, locations of DG installations, types of DG installations, DG installation capacity, and user load installation access.
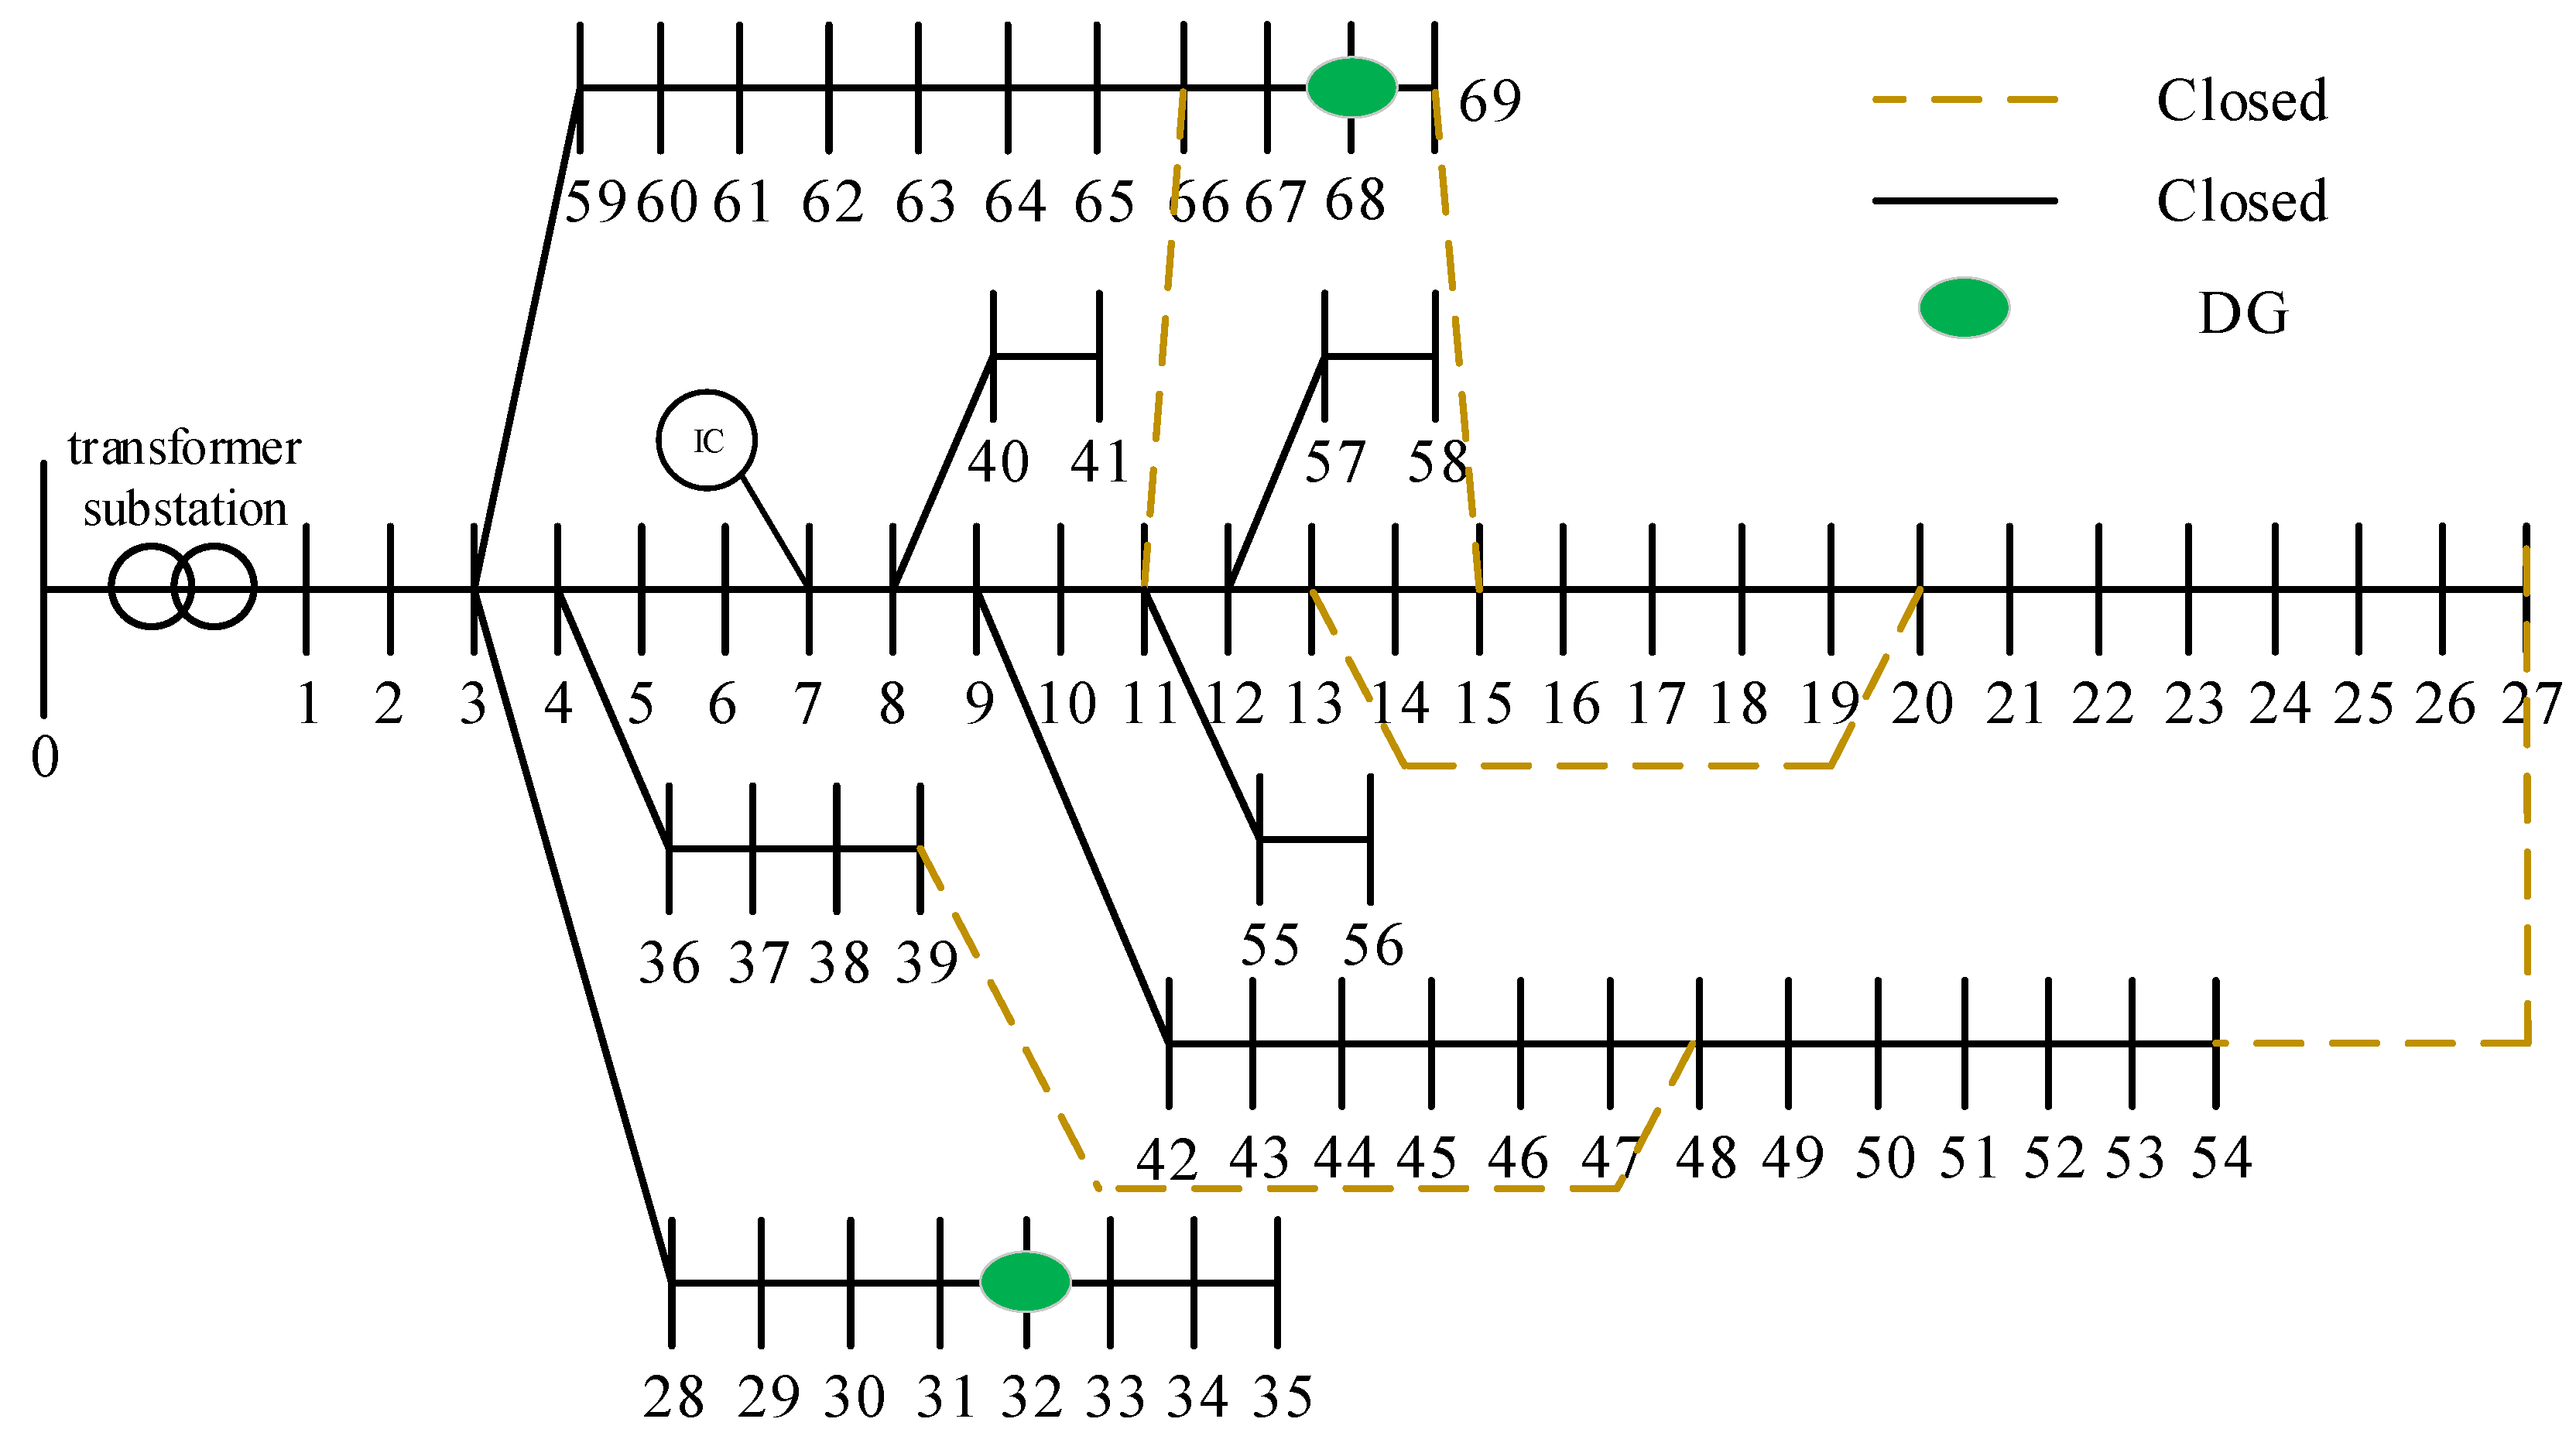
It is assumed that the topology of the information network corresponds one-to-one with distribution network, as shown in
Figure 6. The corresponding component reliability parameters and distribution network node load levels are presented in
Table 1 and
Table 2, respectively.
5.1. Fault Reconfiguration Characteristics Analysis of Distribution Network with Renewable Energy
Based on the post-fault load restoration model proposed in
Section 3, this subsection analyzes fault reconfiguration characteristics of distribution network under renewable energy installation access from two perspectives: (1) the voltage variations at each node before and after fault reconfiguration; (2) the influence of information constraints.
5.1.1. Voltage Variation Characteristics of Nodes Before and After Fault Reconfiguration
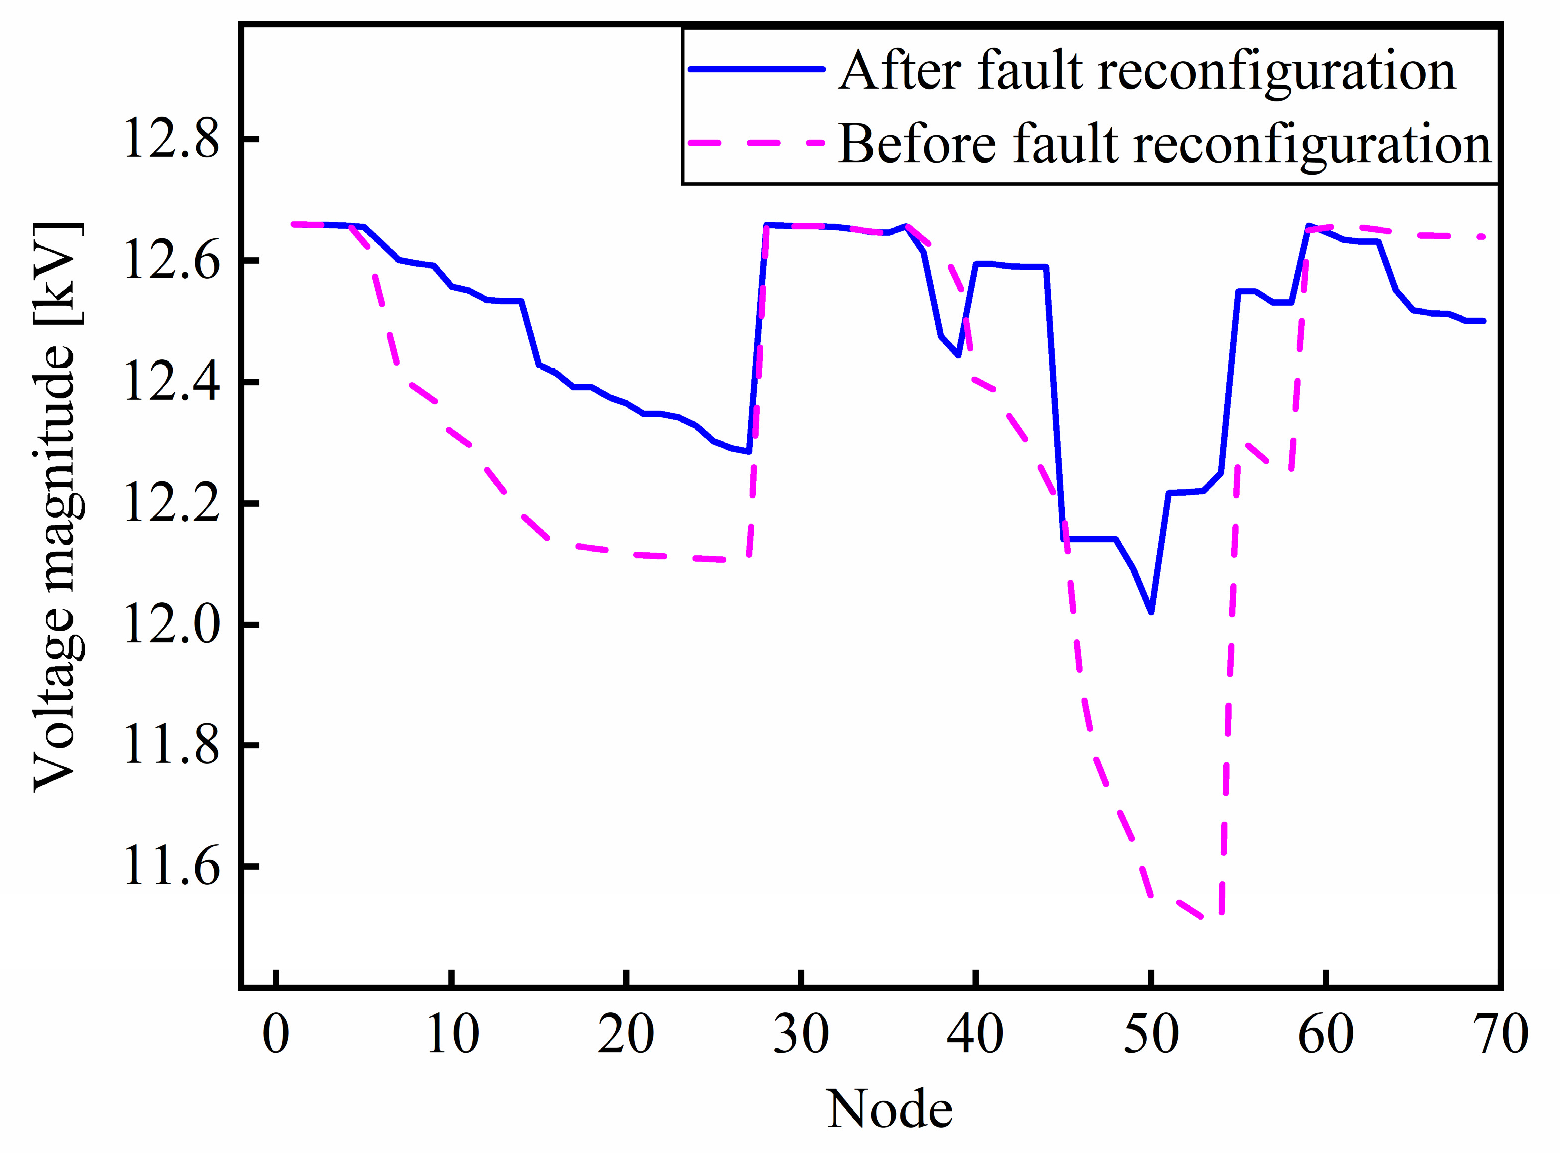
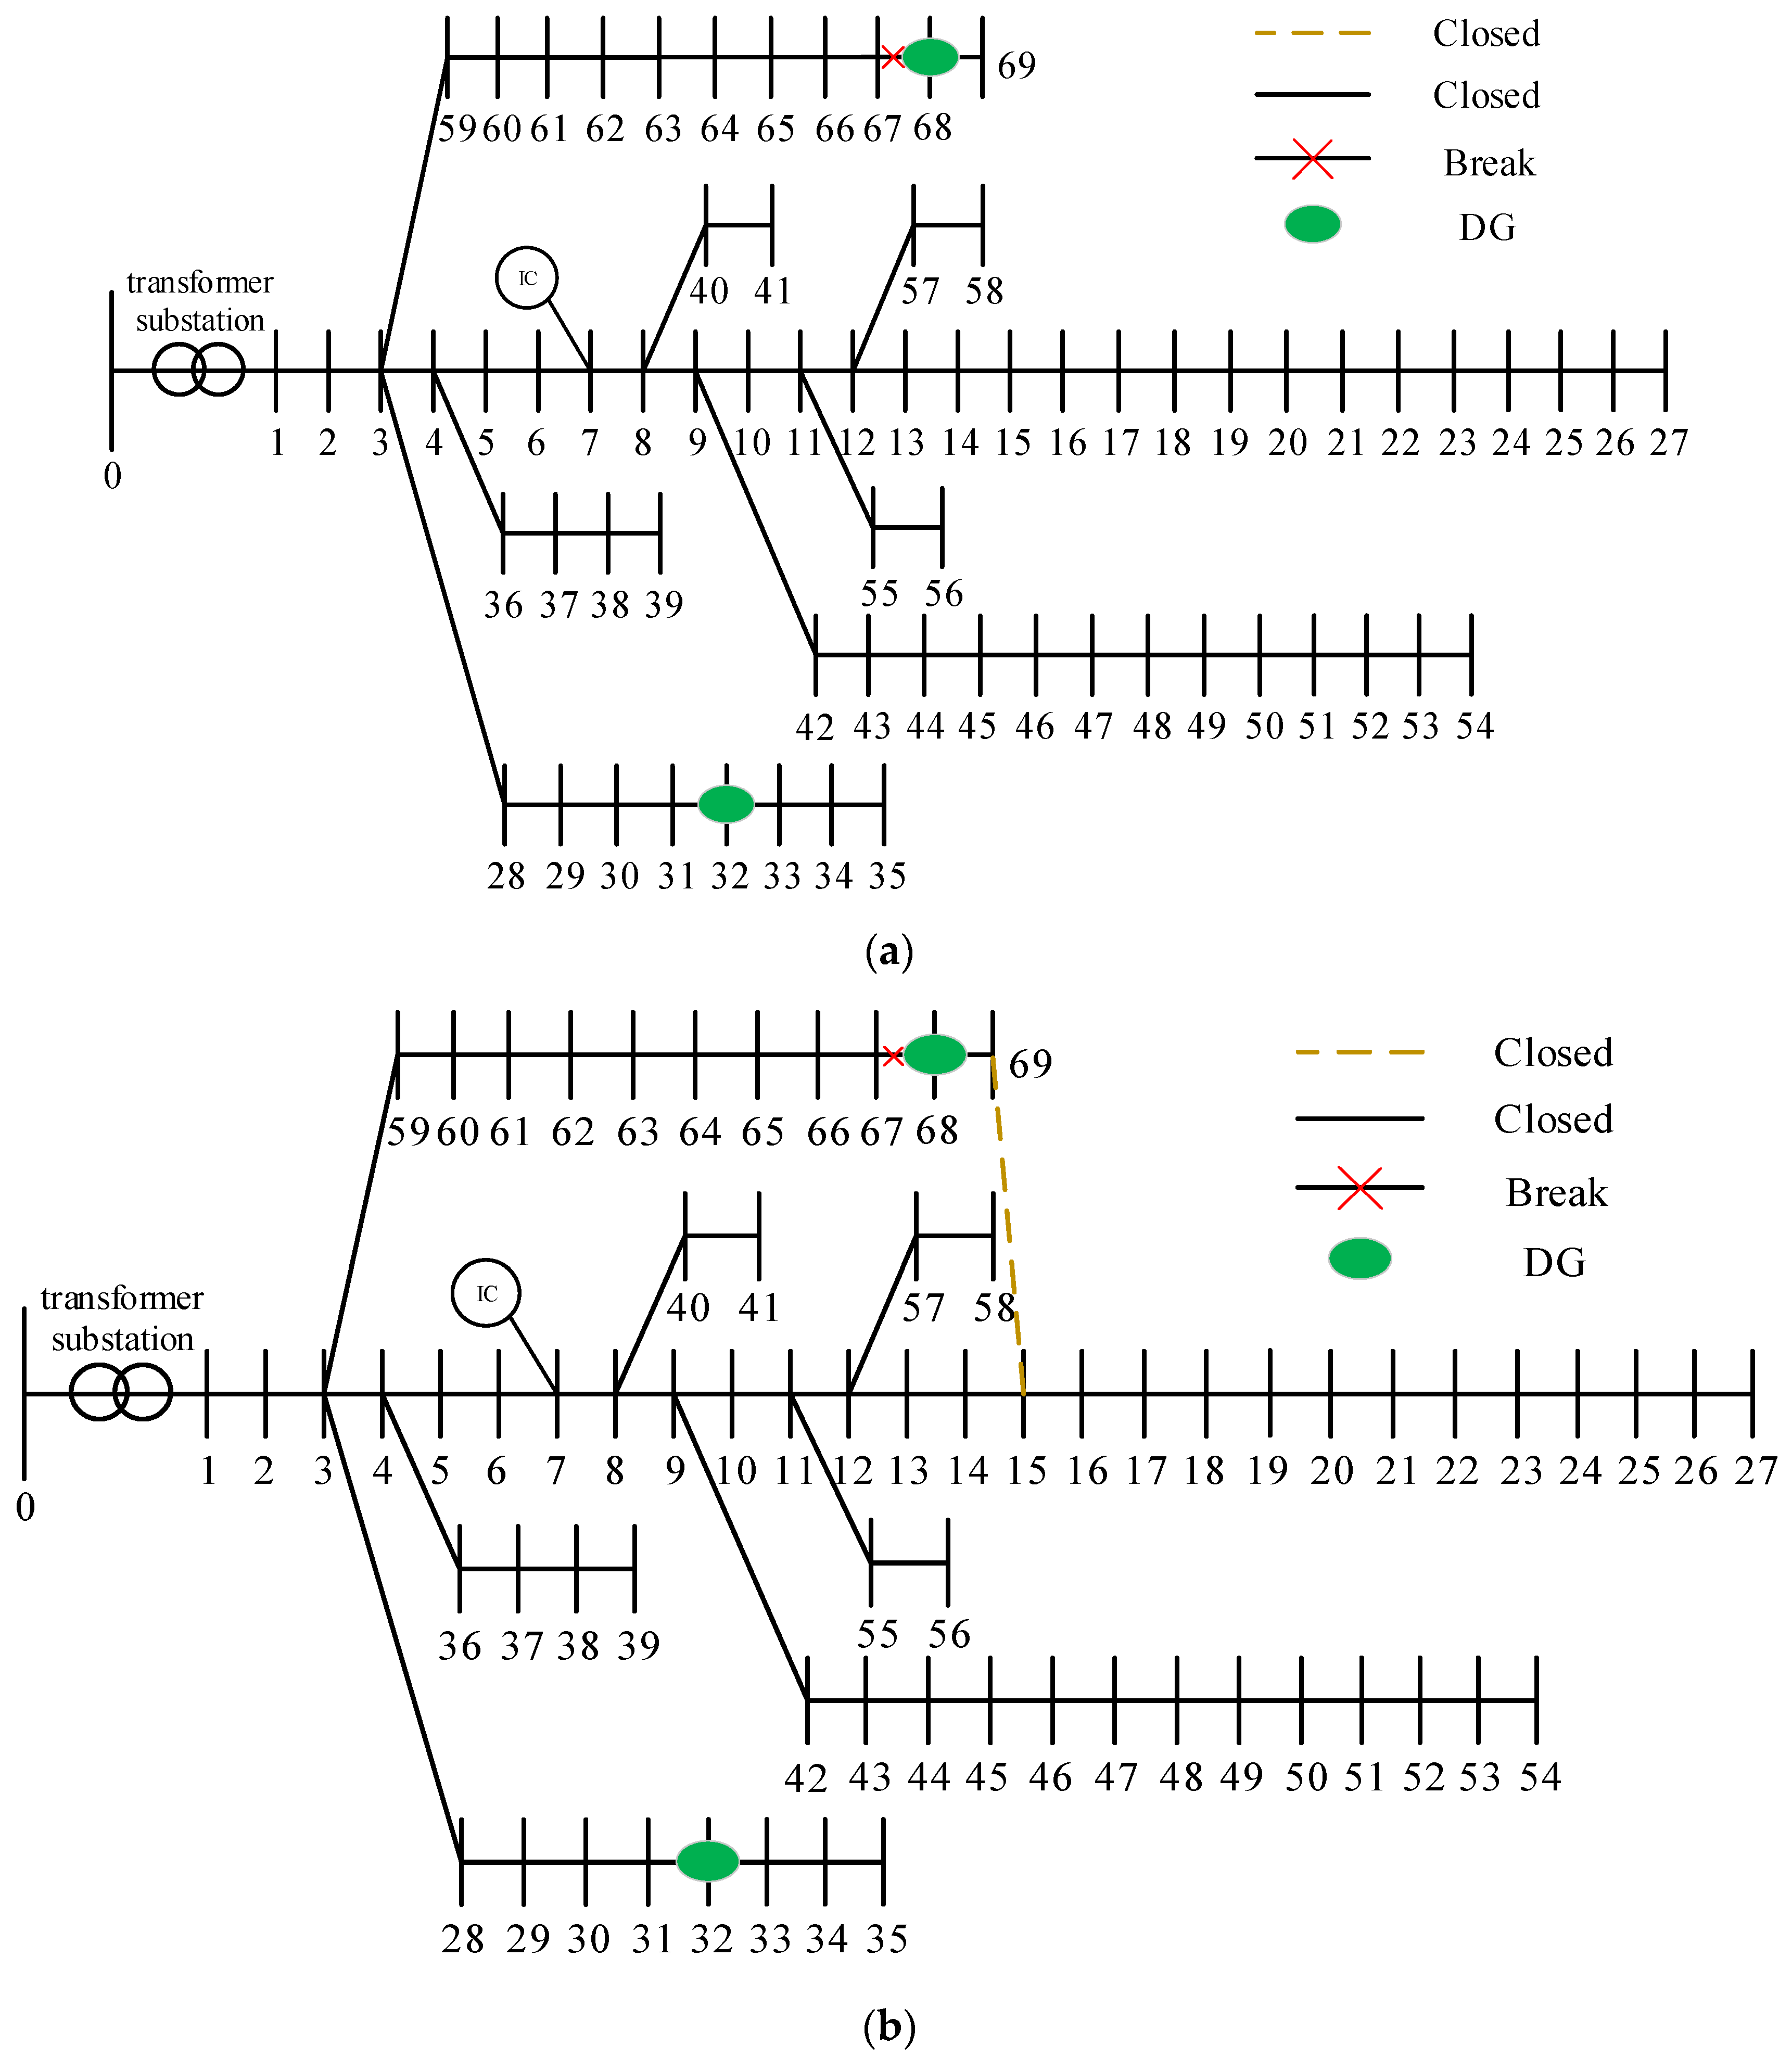
Assuming that faults occur on lines 14–15, 44–45, and 50–51, and DG with an installed capacity of 0.2 MW is connected at nodes 32 and 68, a post-fault analysis is conducted, and the fault reconfiguration results and the voltage variations at each node before and after reconfiguration are obtained, as shown in
Figure 6 and
Figure 7.
As analyzed from
Figure 7, after fault reconfiguration of distribution network, node 69 is connected to node 15, node 27 is connected to node 54, and node 39 is connected to node 48. This ensures power supply and maintains the connectivity between all nodes and the Information Center (IC) at node 7. It preserves the controllability of the cyber–physical system. The restored load of the distribution network is 3.558 MW, accounting for 93.58% of the total lost load. In this situation, only a small portion of the load remained disconnected.
As analyzed from
Figure 8, before the fault reconfiguration of the distribution network, the voltage magnitude between nodes 6 and 27 is relatively low. And the voltage magnitude between nodes 47 and 54 is excessively low, indicating a severe power supply deficiency. After fault reconfiguration, the voltage magnitudes at each node in distribution network remain relatively stable. The average voltage magnitude before reconfiguration is 12.32255 kV, while after reconfiguration it increases to 12.48484 kV. And the improvement rate is 1.317% in the average voltage magnitude. It is evident that the node voltages in the distribution network have significantly improved compared to the state before fault reconfiguration.
It is obvious that although both are DG access node 32 and node 68, the voltage at node 32 remains stable and the voltage at node 68 fluctuates. This result highlights the critical influence of DG location on local voltage support in the system.
5.1.2. Influence of Cyber–Physical Constraints on Fault Reconfiguration Characteristics
Taking the fault on line 67–68 as an example, the influence of cyber–physical constraint on the fault reconfiguration for distribution network is studied, as illustrated in
Figure 9.
As analyzed from
Figure 9a, a restoration strategy is presented with the maximum amount of load restored (3.74839 MW). The load at nodes 68–69 is supplied by local DG, forming an electrical island. Although this solution is economically optimal, it leads to uncommunication between the island and the IC located at node 7. And it becomes an uncontrollable and unobservable “black-box” network.
As analyzed from
Figure 9b, it incorporates an additional hard constraint that all restored areas must maintain communication connectivity with the IC. The strategy abandons the formation of an uncontrollable island by adjusting the network topology to ensure all powered nodes remain connected to node 7, where the IC is located. The total restored load is slightly reduced to 3.74276 MW. It ensures controllability and observability of the entire distribution network and achieves a trade-off between security and economic optimality within the cyber–physical system.
5.2. Reliability Analysis of the Distribution Network with Renewable Energy
In this subsection, based on the post-fault load restoration model proposed in
Section 3 and the reliability evaluation method proposed in
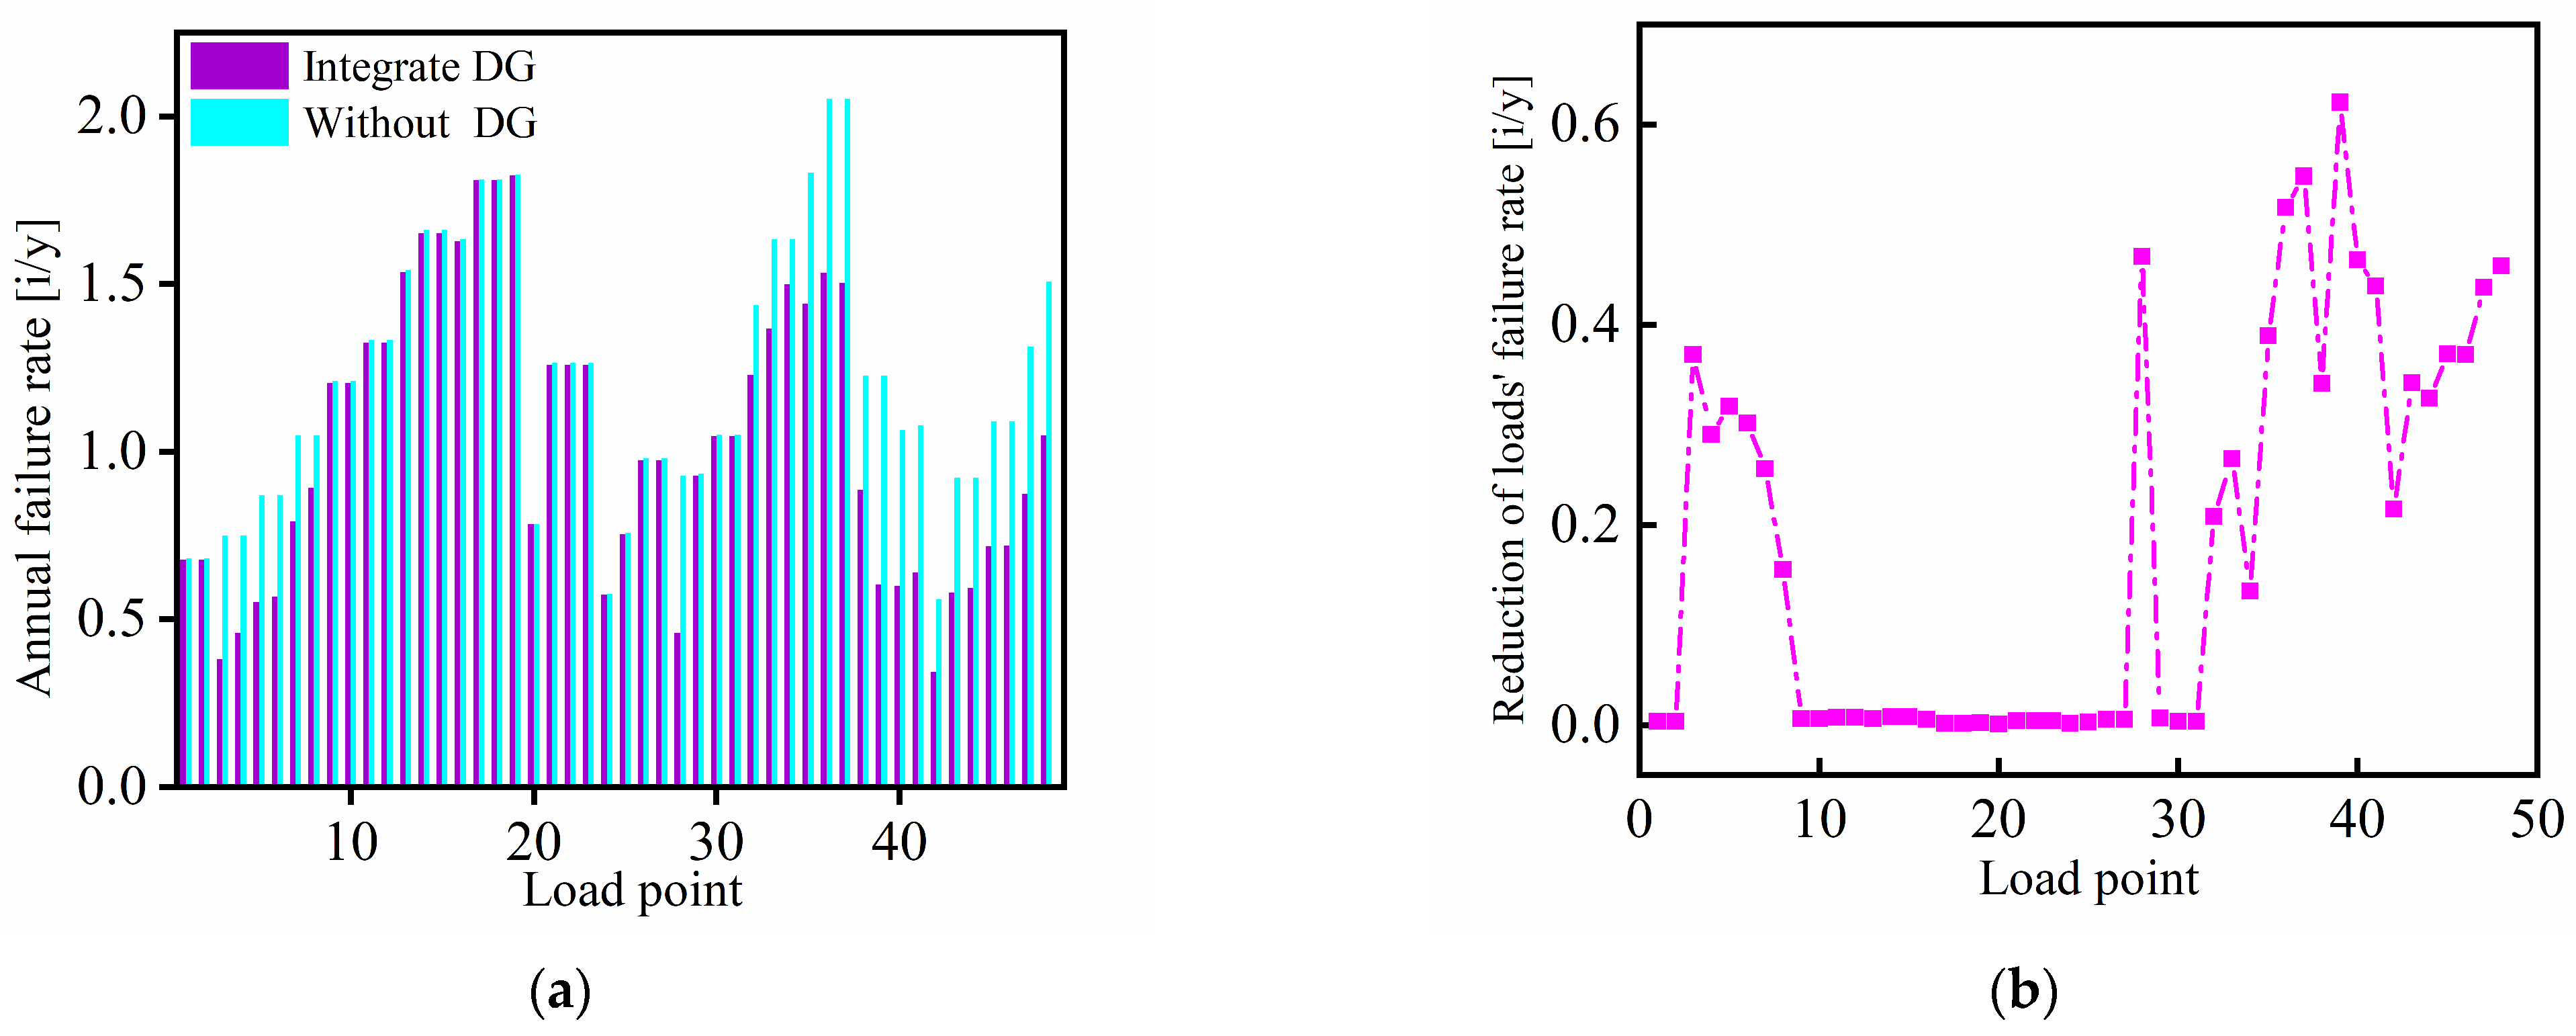
Section 4, the influence of DG installation access on the distribution network reliability is studied. Two 0.2 MW PV are installed into the distribution network. The simulation duration is set to one year with 10,000 iterations. The annual average outage frequency and duration at each load point, with and without DG, are calculated and shown in
Figure 10a and
Figure 11a, respectively. The reductions in these metrics are presented in
Figure 10b and
Figure 11b.
As shown in
Figure 10a,b, the integration of DG significantly reduces the annual average number of power outages for most load points. The mean annual average number of outages across all load points in the distribution network decreases from 1.2138 to 1.0319. The mean reduction is 0.1819 outages per year. And the reduction rate is 14.99%. Meanwhile, the largest reduction in the annual average number of outages occurs at load point 39, with a decrease of 0.62214 outages per year. The smallest reduction occurs at load point 7, with a decrease of 0.001113 outages per year.
As shown in
Figure 11a,b, the integration of DG significantly reduces the annual average outage duration for most load points. The mean annual average outage duration across all load points in distribution network decreases from 20.9510 h to 17.7117 h, with a mean reduction of 3.2393 h per year. And the reduction rate represents 15.46%. Meanwhile, the largest reduction in the annual average outage duration occurs at load point 39, with a decrease of 12.07514 h per year. And the smallest reduction occurs at load point 20, with a decrease of 0.058448 h per year.
As shown in
Table 3, with DG integration, the reliability indicator SAIFI of the distribution network after fault reconfiguration decreases from 1.1689 to 0.9302 interruptions per customer per year, with a reduction rate of 20.42%. The SAIDI decreases from 19.846 to an average of 15.888 h per customer per year, with a reduction rate of 19.94%. The ASAI improves from 99.77% to 99.81%, representing an increase of 0.04%.
5.3. Reliability Assessment of Distribution Network with Different DG Types
In this section, the influence of DG types on reliability of distribution network is investigated. In distribution network, the types of DG are set as PV and ESS, with a uniform capacity of 0.2 MW for all DG. Three scenarios are considered: ① both node 32 and node 68 integrate PV; ② both node 32 and node 68 integrate WTG; ③ both node 32 and node 68 integrate ESS. The simulation duration is set to one year, with 10,000 iterations. And the system reliability results are calculated, as illustrated in
Table 4.
As shown in
Table 4, the SAIFI value in scenario 3 is 3.60% lower than in scenario 1, and 2.06% lower than in scenario 2. The CAIDI value in scenario 3 is 1.94% lower than in scenario 1, and 1.11% lower than in scenario 2. The SAIDI value in scenario 3 is 5.48% lower than in scenario 1, and 3.15% lower than in scenario 2. And the ASAI value in scenario 3 is 0.04% higher than in scenario 1, and 0.015% higher than in scenario 2.
Based on the comprehensive analysis of the four reliability indicators, scenario 3 (both node 32 and node 68 integrate ESS) yields the most significant improvement in distribution network reliability, followed by scenario 2 (both node 32 and node 68 integrate WTG), and the least improvement for scenario 1 (both node 32 and node 68 integrate PV). The reason is that ESS are stable and constant power output sources that are not affected by external environmental factors. In contrast, both WTG and PV are subject to weather conditions, and WTG generally operate for longer durations with smaller fluctuations, resulting in relatively better reliability enhancement than PV.
5.4. Reliability Assessment of Distribution Network with Different DG Capacities
Based on the three scenarios in
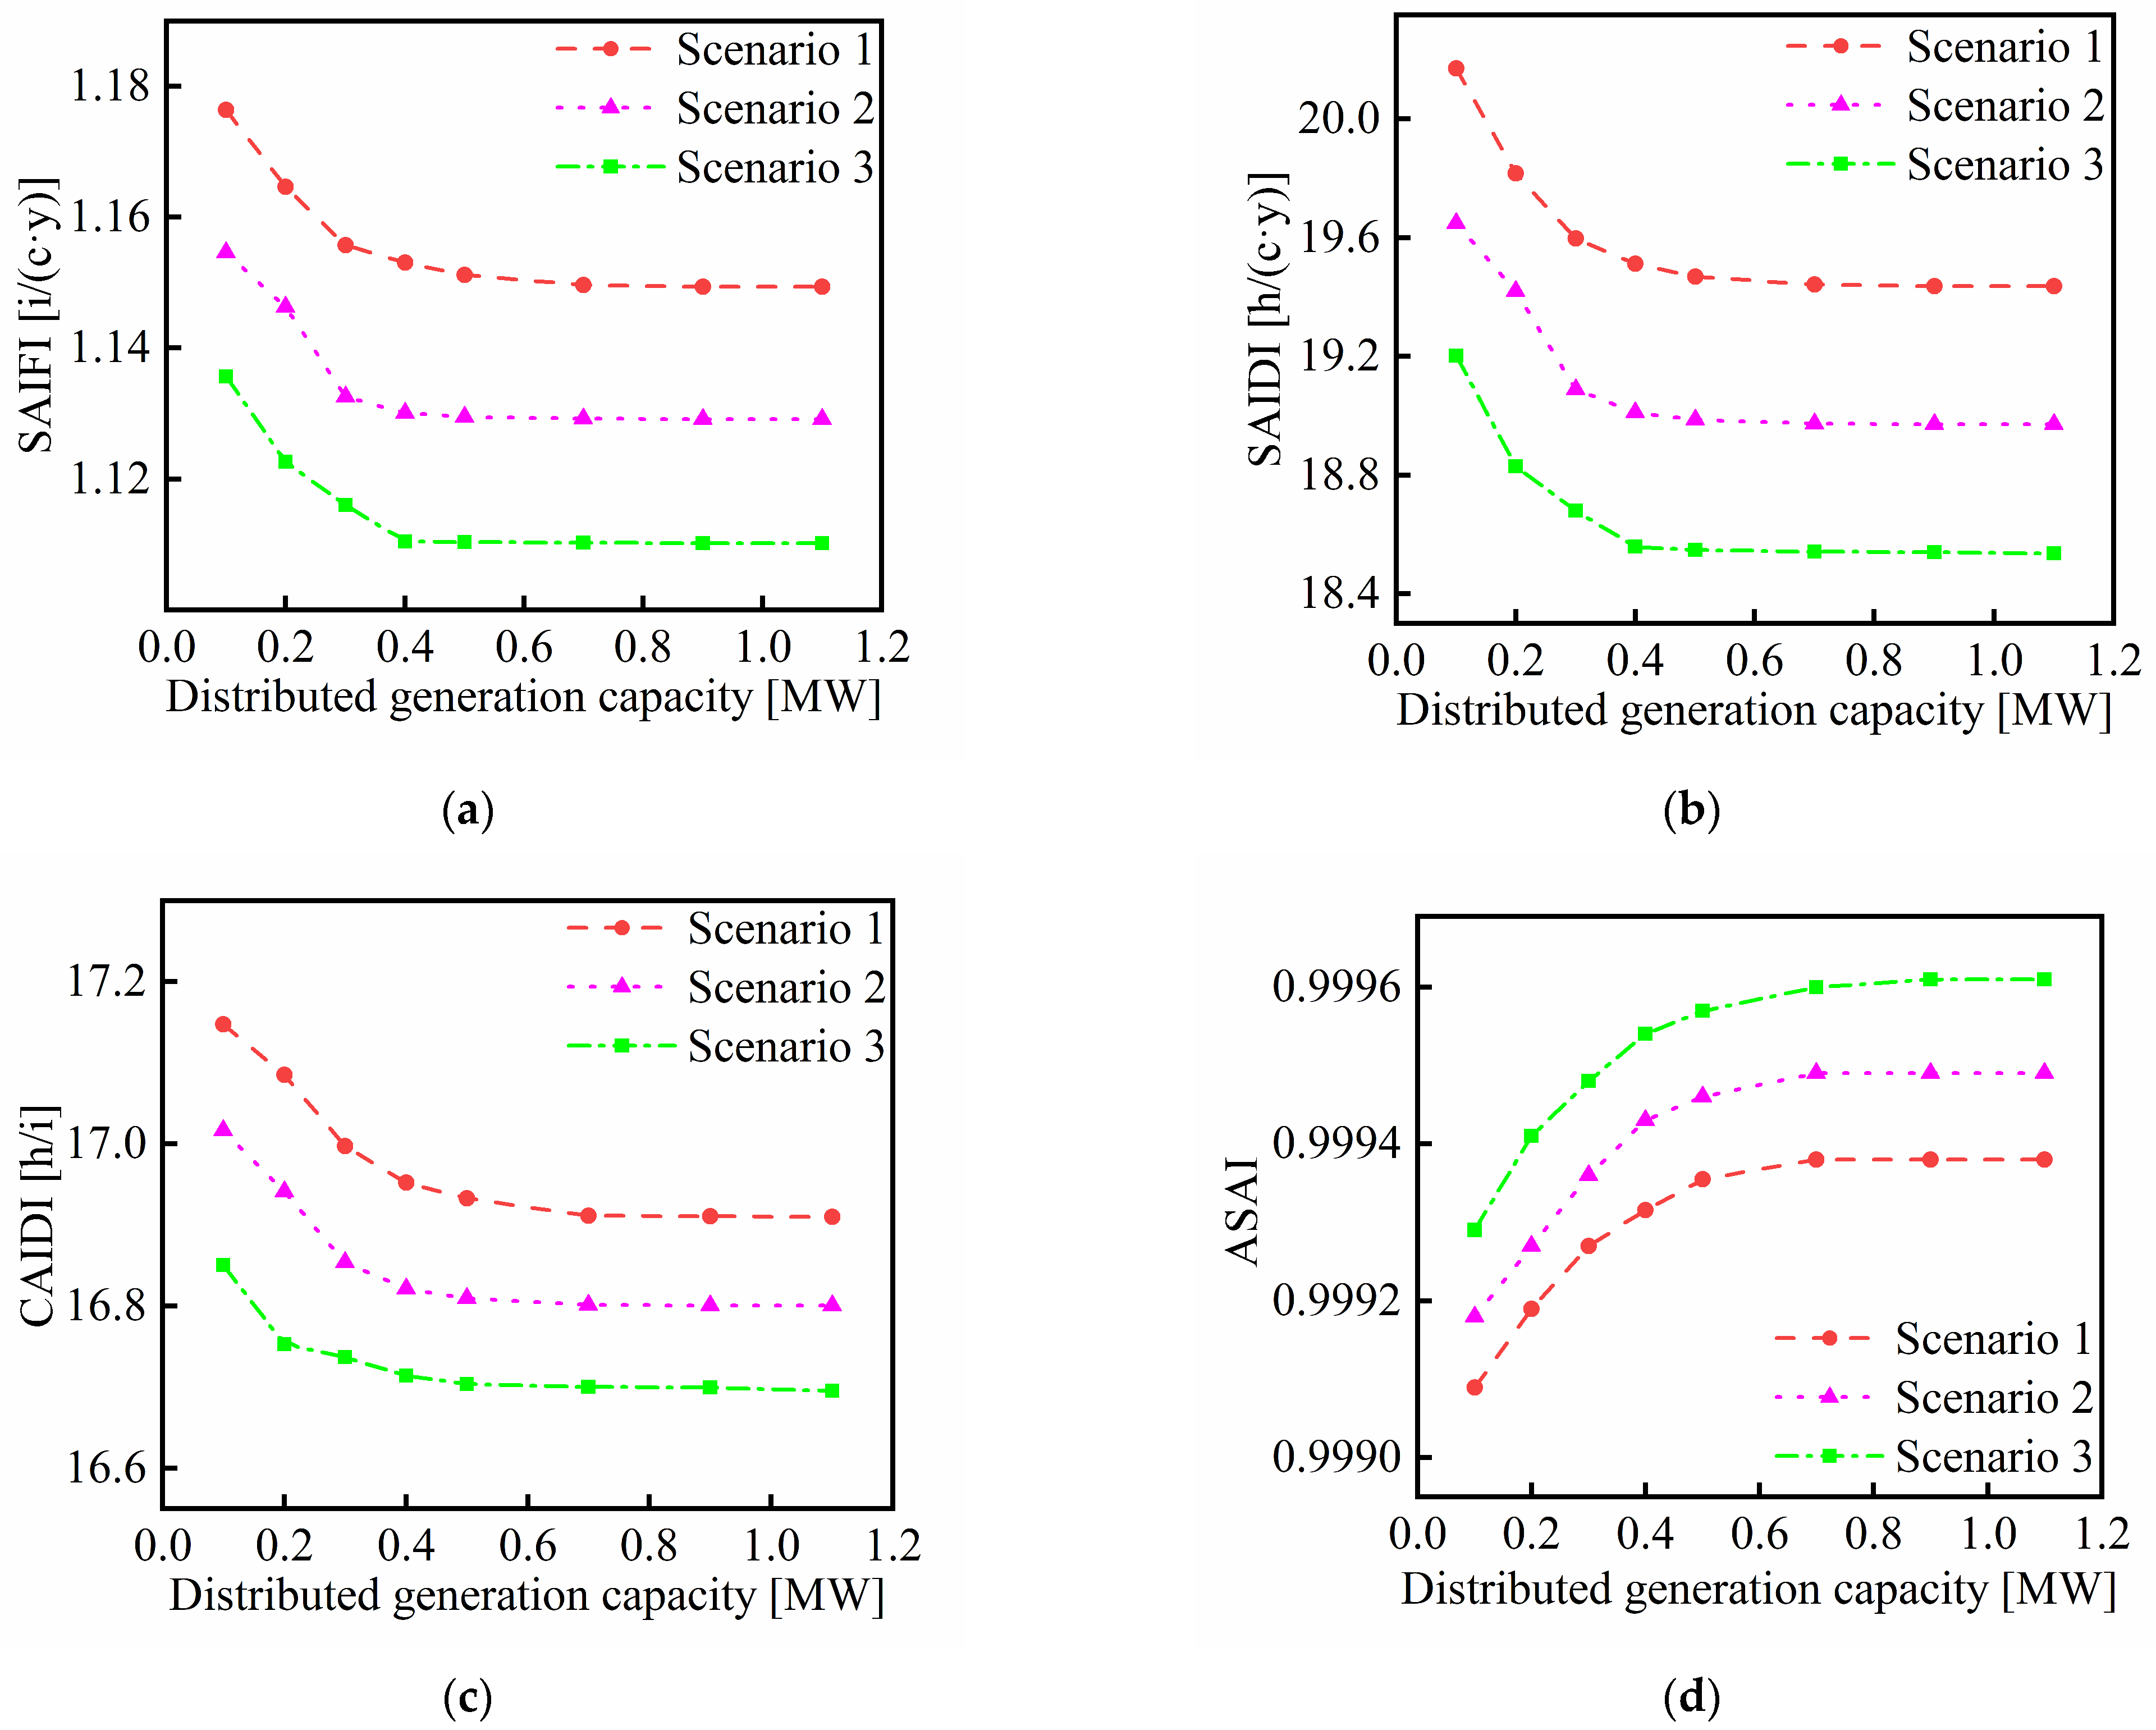
Section 5.3, the rated capacities of PV and ESS, which integrate in distribution network, are 0.1 MW, 0.2 MW, 0.3 MW, 0.4 MW, 0.5 MW, 0.7 MW, 0.9 MW, and 1.1 MW, respectively. And the influence of DG capacity on the distribution network reliability is examined, and the results are illustrated in
Figure 12.
In
Figure 12a, the SAIFI value of distribution network decreases when the rated capacity of DG increases. Moreover, under the same DG capacity, scenario 3 exhibits the lowest SAIFI value, followed by scenario 2. And scenario 1 shows the highest SAIFI value. In
Figure 12b, the SAIDI value of distribution network decreases when the rated capacity of DG increases. Moreover, under the same DG capacity, scenario 3 exhibits the lowest SAIDI value, followed by scenario 2. And scenario 1 shows the highest SAIDI value. In
Figure 12c, the CAIDI value of distribution network decreases when the rated capacity of DG increases. Moreover, under the same DG capacity, scenario 3 exhibits the lowest CAIDI value, followed by scenario 2. And scenario 1 shows the highest CAIDI value. In
Figure 12d, the ASAI value of distribution network increases with the rated capacity of DG increases. Furthermore, under the same DG capacity, scenario 1 exhibits the lowest ASAI value, followed by scenario 2. And scenario 3 shows the highest ASAI value.
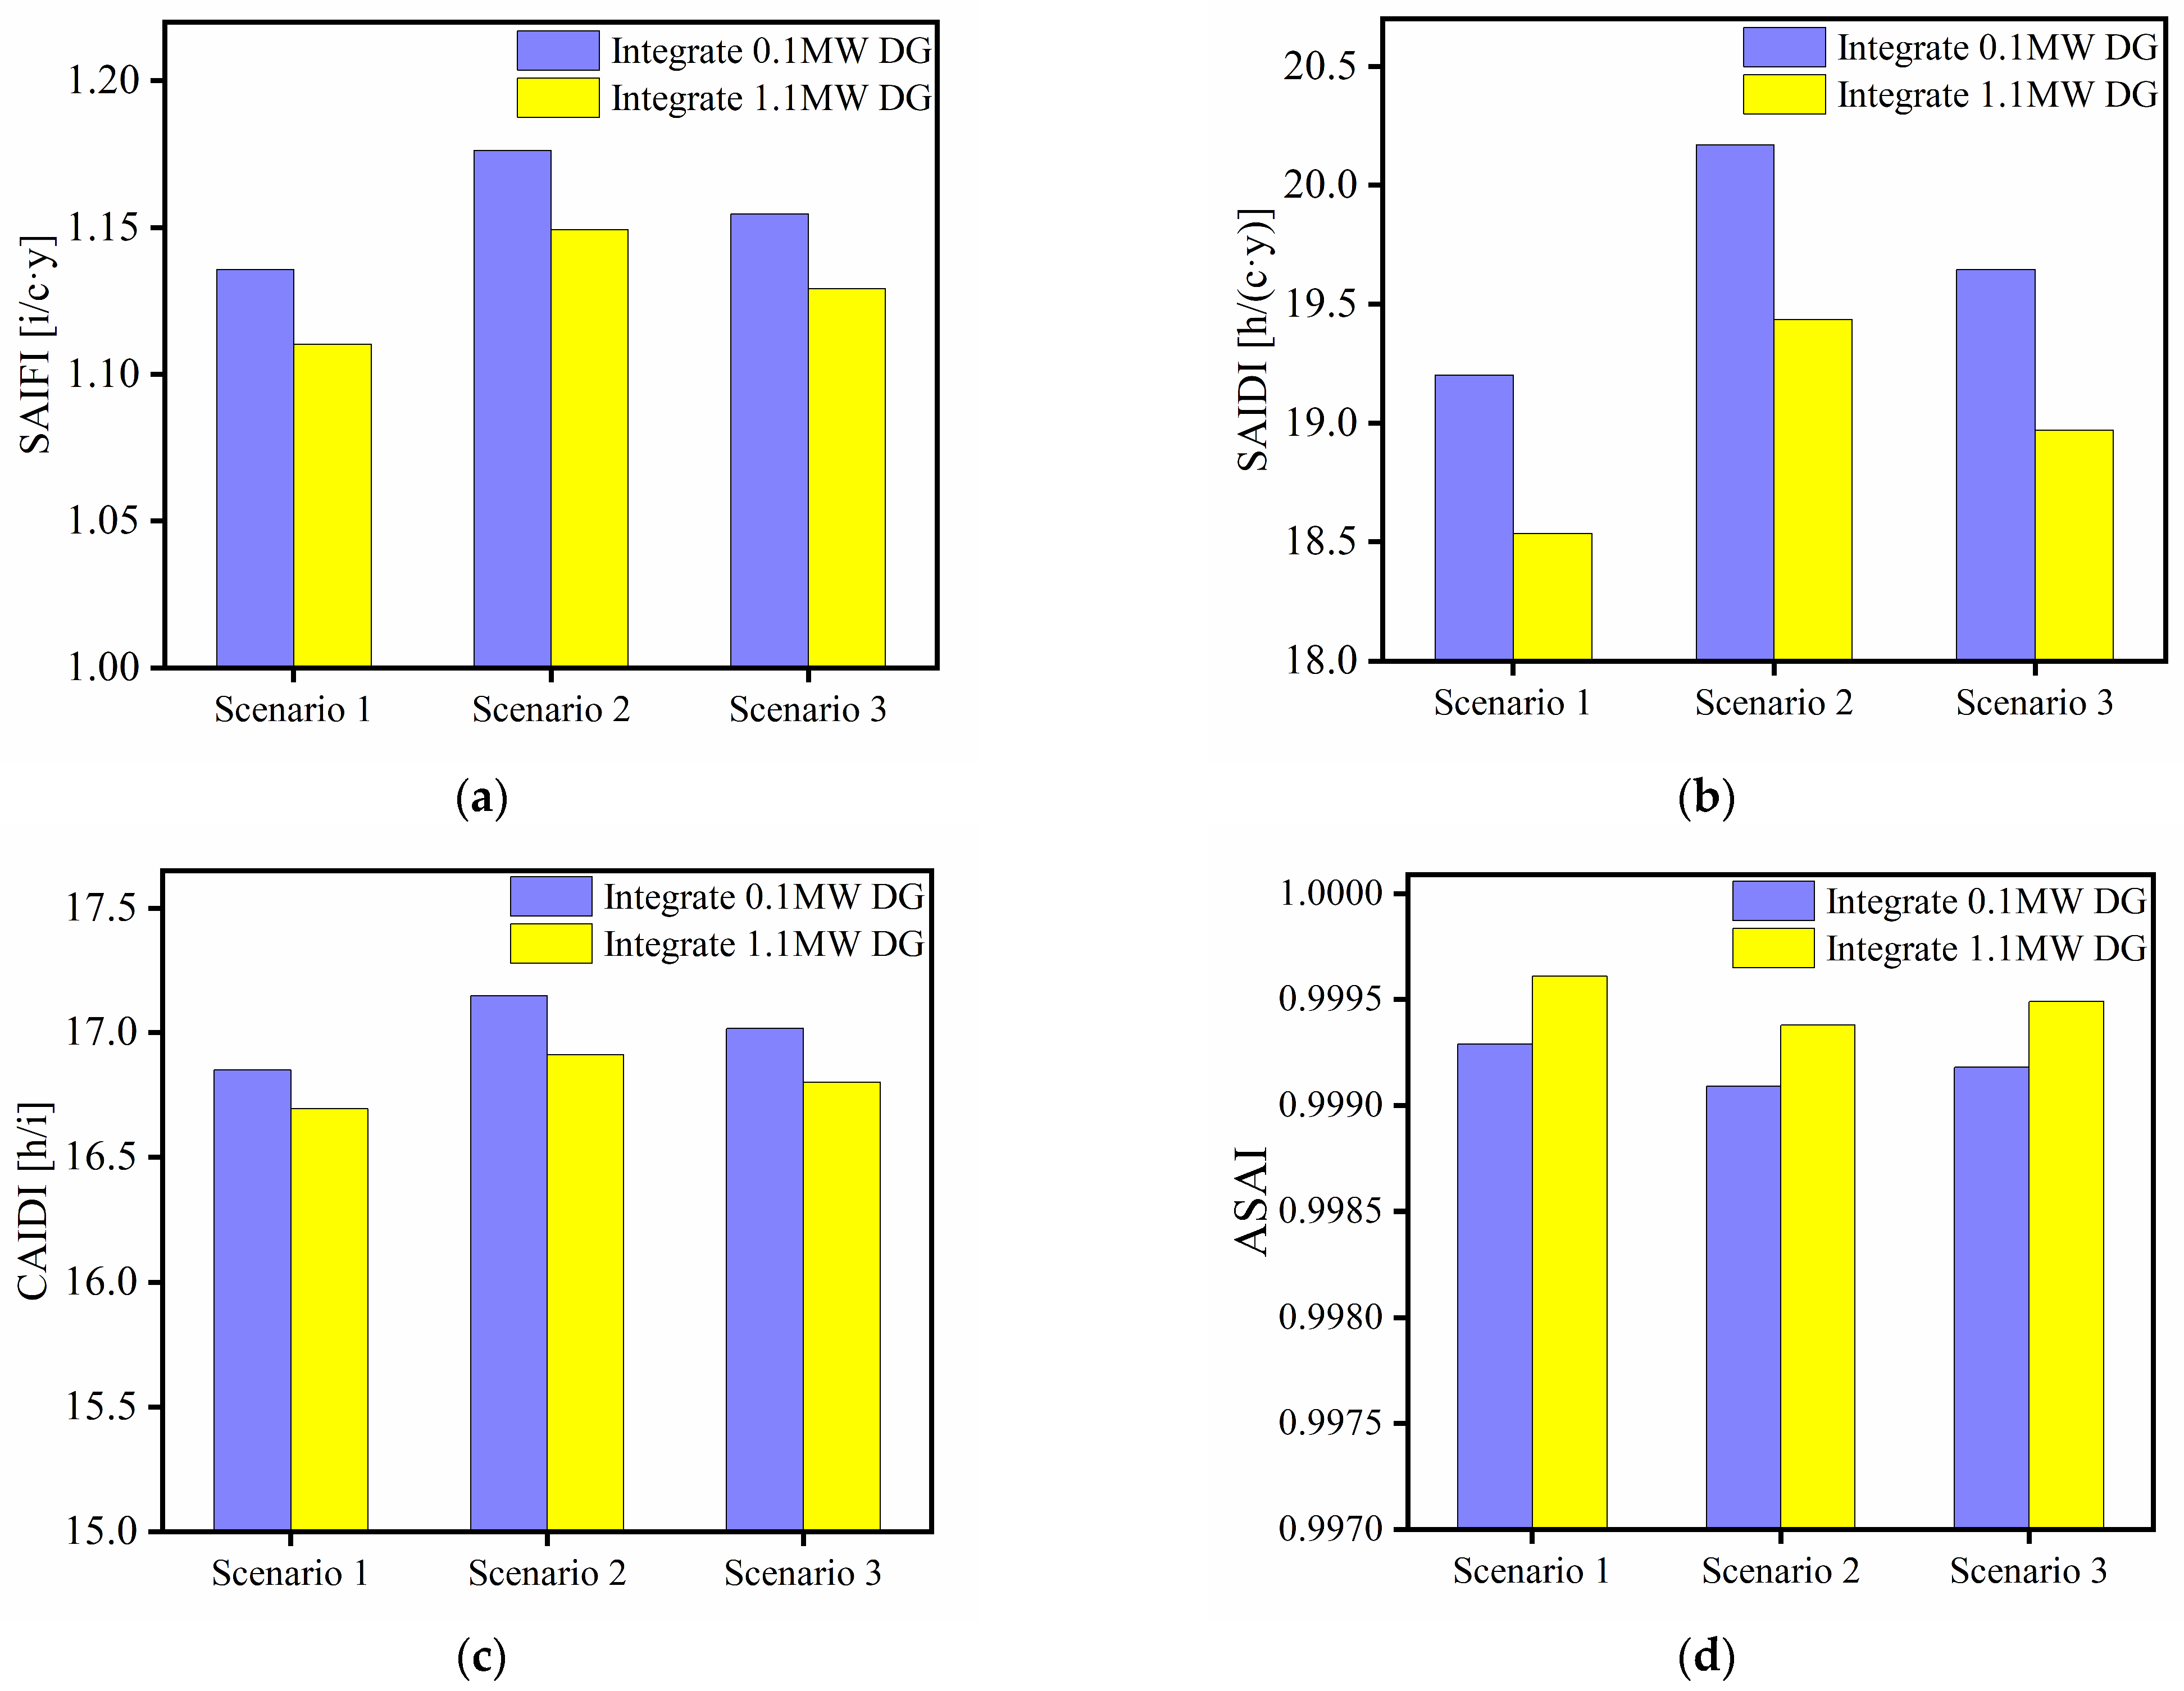
As shown in
Figure 13a–d, in scenario 1, as the DG capacity increases from 0.1 MW to 1.1 MW, the ASAI value increases 0.029%, the SAIDI value decreases 3.64%, the SAIFI value decreases 2.29%, and the CAIDI value decreases 1.38%. In scenario 2, as the DG capacity increases from 0.1 MW to 1.1 MW, the ASAI value increases 0.031%, the SAIDI value decreases 3.45%, the SAIFI value decreases 2.21%, and the CAIDI value decreases 1.27%. In scenario 3, as the DG capacity increases from 0.1 MW to 1.1 MW, the ASAI value increases 0.032%, the SAIDI value decreases 3.47%, the SAIFI value decreases 2.24%, and the CAIDI value decreases 1.26%.
As shown in
Figure 12 and
Figure 13, with the increase in the DG capacity, the distribution network reliability improves and gradually stabilizes. The reason is that the increased capacity of DG allows them to share more load and provide sufficient electricity to maintain the power supply and improve the distribution network reliability.
Among the three scenarios, scenario 3 (both node 32 and node 68 integrate ESS) has the most significant enhancement in distribution network reliability. Scenario 2 (both node 32 and node 68 integrate WTG) shows a moderate improvement, and scenario 1 (both node 32 and node 68 integrate PV) yields the least improvement. This reason is the same as that in
Section 5.3.
5.5. Reliability Assessment of Distribution Network with Different DG Integration Location
This section studies the influence of DG integration location on distribution network reliability. Two scenarios are set: ① PVs are integrated at node 32 and node 68; ② PVs are integrated at node 5 and node 12. The capacity of each PV is 0.2 MW. The simulation duration is set to one year, with 10,000 simulation iterations. And the results can be found in
Figure 14.
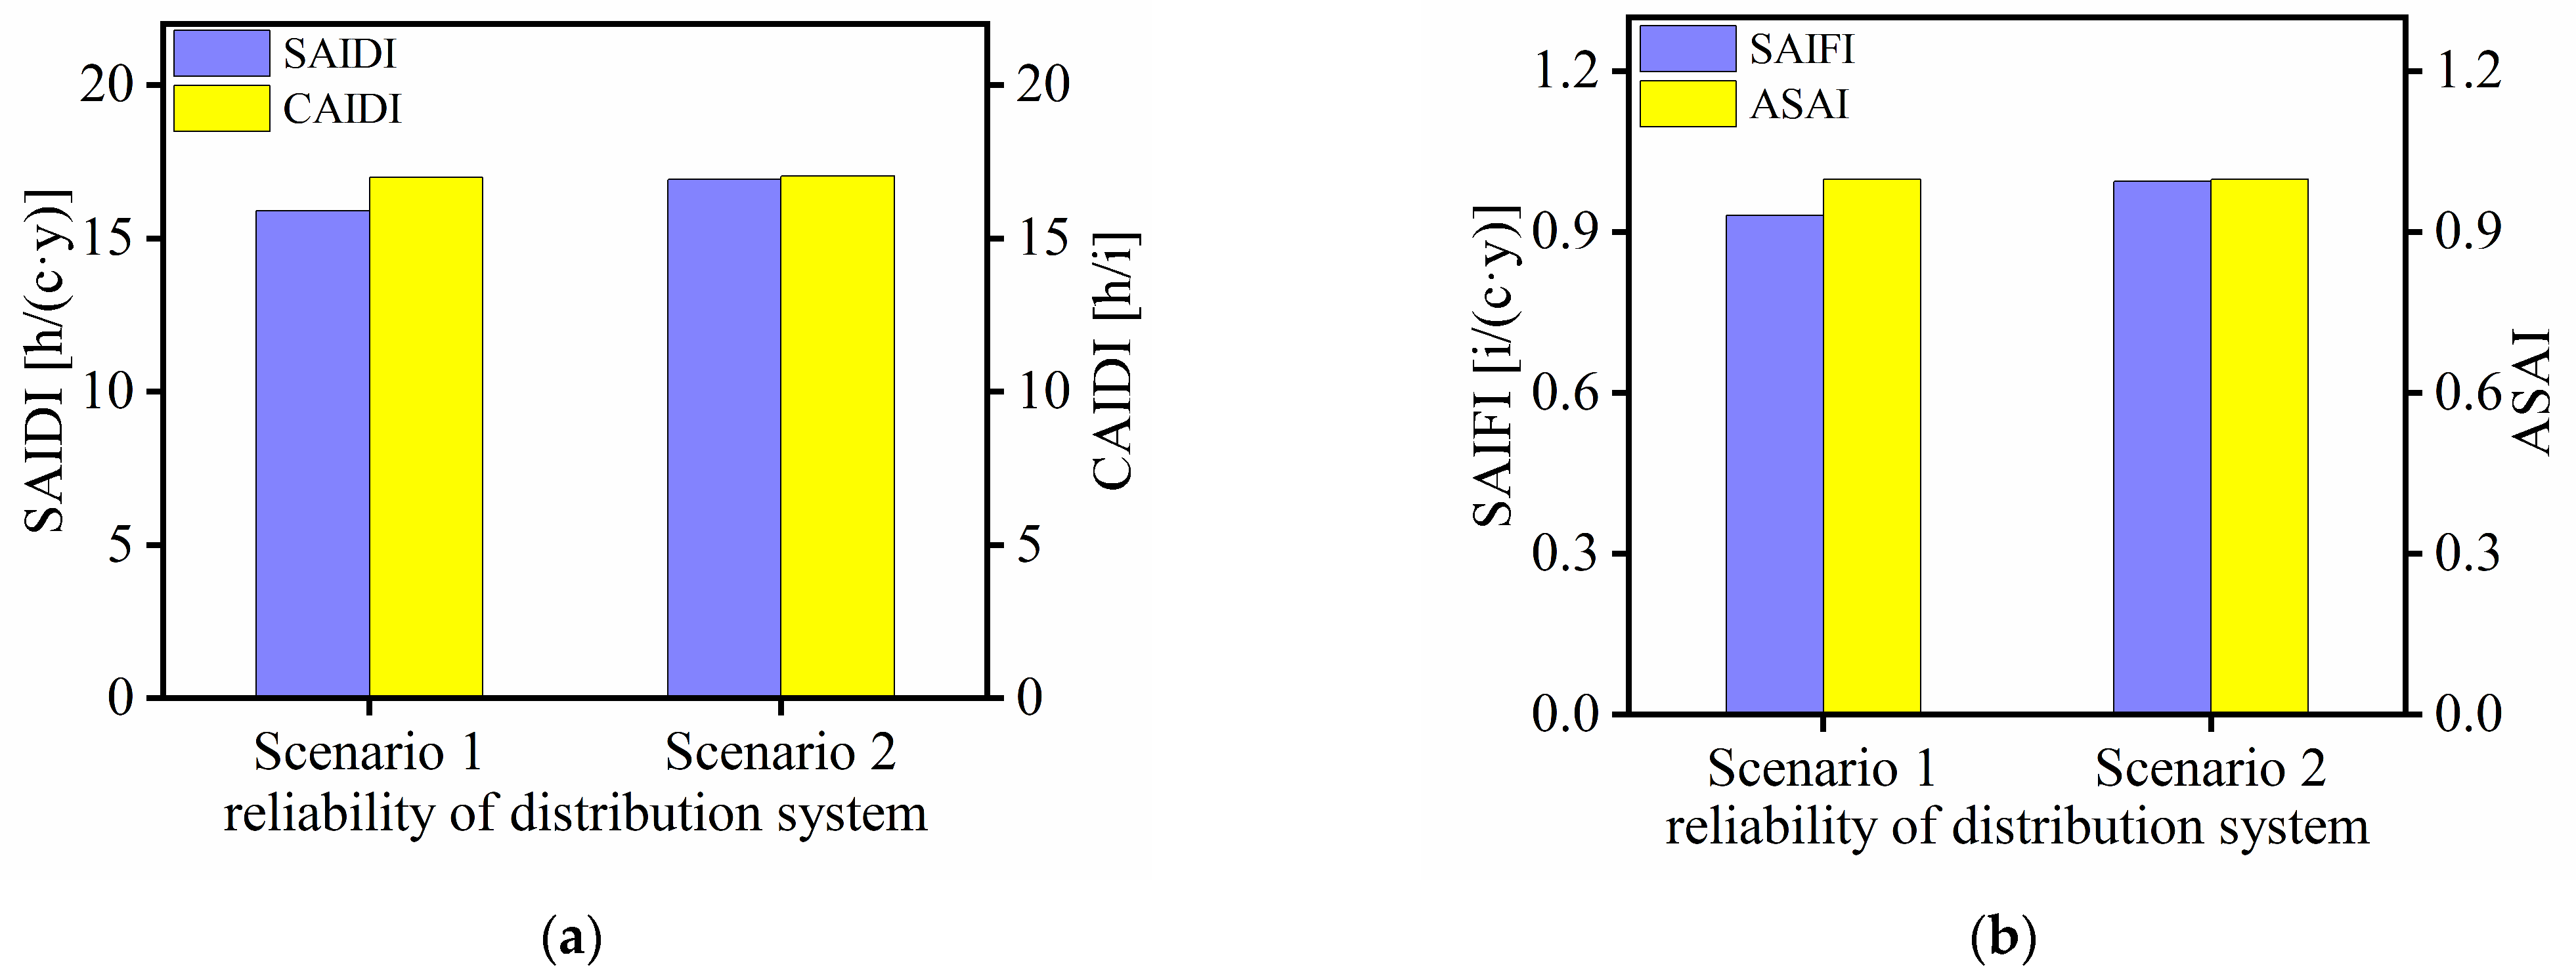
As shown in
Figure 14, scenario 2 exhibits a 6.9% growth in SAIFI, a 0.27% growth in CAIDI, and a 6.5% growth in SAIDI compared to scenario 1, while ASAI decreases by 0.03%. These results suggest that the distribution network reliability in scenario 1 is higher than that in scenario 2. This clearly demonstrates that the reliability benefit of DG is distinctly localized. Their influence is primarily confined to the electrical region near the point of interconnection. Nodes at the end of feeders generally exhibit poorer voltage stability and are more sensitive to faults. Nodes 32 and 68 are, respectively, located at the ends of two main feeders. Locating DG at these positions can effectively improve voltage profile and enhance power supply reliability for end loads. Therefore, in practical engineering planning, it should be given to deploying DG in weaker sections of the grid to maximize the enhancement of distribution network reliability.
5.6. Reliability Analysis of Distribution Network with User Load Installation
In addition to the installation of DG such as PV and ESS, the installation of user load is also a factor that needs to be considered. This subsection studies the influence of user load installation on the reliability of distribution network with DG, and three scenarios are set: ① no user load installation; ② installation of an additional 0.12 MW load at node 10; ③ installation of an additional 0.12 MW load at node 11. The corresponding reliability evaluation results are shown in
Figure 15.
As shown in
Figure 15, the installation of user load increases SAIFI, SAIDI, and CAIDI, while decreasing ASAI. Moreover, the changes in SAIFI, SAIDI, CAIDI, and ASAI vary depending on the access point. Compared to scenario 1, scenario 2 shows an increase of 26.9% in SAIFI, 0.85% in CAIDI, and 27.22% in SAIDI, while ASAI decreases by 0.10%. Compared to scenario 1, scenario 3 shows an increase of 38.82% in SAIFI, 2.16% in CAIDI, and 40.95% in SAIDI, while a decrease of 0.17% in ASAI. Compared to scenario 2, scenario 3 shows an increase of 9.3% in SAIFI, 1.29% in CAIDI, and 10.8% in SAIDI, while ASAI decreases by 0.07%.
The degree of reliability degradation in scenario 3 is slightly more pronounced than in scenario 2. The underlying reason lies in the fact that node 11 occupies a more electrically vulnerable position within the grid. After the addition of new load, this branch becomes more susceptible to triggering the thermal stability limit constraint during fault reconfiguration. To meet safety operational requirements, the optimization model is forced to forgo the restoration of power to this load section.
6. Conclusions
This paper proposes a multi-dimensional reliability evaluation method for distribution network under renewable energy installation and load installation, considering fault reconfiguration and multiple constraints. Firstly, the component state transition model for the distribution network, the photovoltaic output model, wind turbine generation, and the energy storage system’s charging and discharging model are presented. Secondly, a post-fault load restoration model for distribution network by considering fault reconfiguration and multiple constraints under distributed generation integration is established. Moreover, the reliability evaluation indices for the distribution network, including SAIDI, CAIDI, SAIFI, and ASAI, are introduced, and the reliability evaluation process founded on the sequential Monte Carlo simulation is explained. Finally, the IEEE 69-node distribution network is employed as a case study to validate the effectiveness of the proposed model and method, and the reliability of the distribution network is discussed in-depth from multiple perspectives, including distributed generation installation, types of distributed generation installation, distributed generation installation capacity, and new load installation access points.
The case study analysis demonstrates the following: ① Fault reconfiguration affects node voltages in the distribution network, and the average voltage before fault reconfiguration was 12.32255 kV, increasing to 12.48484 kV after fault reconfiguration, representing an average voltage magnitude improvement rate of 1.317%. ② Compared to the restored load level without considering cyber–physical constraints, the restored load level under cyber–physical constraints decreased by only 0.15%. However, without these constraints, the island formed by nodes 68–69 disconnected from the IC, leading to loss of control over the island, which is an undesirable outcome in practical engineering. ③ With the integration of two 0.2 MW PV, load point 39 showed the largest reduction in annual average outage frequency (0.62214 times/year), while load point 7 showed the smallest reduction (0.001113 times/year). Load point 39 also exhibited the greatest reduction in annual average outage duration (12.07514 h/year), while load point 20 showed the smallest reduction (0.058448 h/year). And ASAI increased from 99.77% to 99.81%, reflecting a 0.04% improvement. ④ The type of DG installation significantly impacts distribution network reliability. Scenario 3 (both node 32 and node 68 integrate ESS) improved the ASAI by 0.05% compared to scenario 1 (both node 32 and node 68 integrate PV) and by 0.017% compared to scenario 2 (both node 32 and node 68 integrate WTG). ⑤ Increasing DG capacity consistently enhances distribution network reliability, with improvements gradually stabilizing. Scenario 3 (both node 32 and node 68 integrate ESS) delivered the most significant reliability improvements: ASAI increased by 0.034%, SAIDI decreased by 3.52%, SAIFI decreased by 2.23%, and CAIDI decreased by 1.29%. ⑥ Different DG integration locations bring different impacts. Scenario 2 exhibits a 6.9% growth in SAIFI, a 0.27% growth in CAIDI, and a 6.5% growth in SAIDI than in scenario 1, while ASAI decreases by 0.03%. ⑦ New customer load connections increase SAIFI, SAIDI, and CAIDI while reducing ASAI. Scenario 3 (installation of an additional 0.12 MW load at node 11) resulted in the lowest ASAI and the highest SAIFI, SAIDI, and CAIDI.
