Article

A Robust Corroded Metal Fitting Detection Approach for UAV Intelligent Inspection with Knowledge-Distilled Lightweight YOLO Model

1
State Grid Henan Electric Power Research Institute, Zhengzhou 450000, China
2
State Grid Henan Electric Power Company, Zhengzhou 450000, China
3
School of Computer and Information Engineering, Henan Normal University, Xinxiang 453007, China
*
Author to whom correspondence should be addressed.
Electronics 2025, 14(22), 4362; https://doi.org/10.3390/electronics14224362
Submission received: 28 August 2025 / Revised: 1 November 2025 / Accepted: 5 November 2025 / Published: 7 November 2025
(This article belongs to the Special Issue Advances in Data-Driven Artificial Intelligence)

Abstract

Detecting corroded metal fittings in UAV-based transmission line inspections is challenging due to the small object size and environmental interference, causing high false and missed detection rates. To address these, this paper proposes a novel knowledge-distilled lightweight YOLO model, integrating a densely-connected convolutional network and spatial pixel-aware self-attention mechanism in the teacher model training stage to enhance feature transfer and structured feature utilization for reducing environmental interference, while employing the lightweight MobileNet as the feature extractor in the student model training stage and optimizing candidate box migration via the teacher model’s efficient intersection-over-union non-maximum suppression (EIoU-NMS). This model overcomes the challenges of small-object fitting detection in complex environments, improving fault identification accuracy and reducing manual inspection costs and missed detection risks, while its lightweight design enables rapid deployment and real-time detection on UAV terminals, providing a reliable technical solution for unmanned smart grid operation. Experimental results on actual UAV inspection images demonstrate that the model significantly enhances detection accuracy, reduces false and missed detections, and achieves faster speeds with substantially fewer parameters, highlighting its outstanding effectiveness and practicality in power system maintenance scenarios.

1. Introduction

The State Grid, as a critical infrastructure in China, plays a vital role in ensuring the safe transmission of electricity. As the power grid continues to expand, transmission lines are being constructed across vast regions, characterized by long spans and wide distribution. These lines are constantly exposed to outdoor environments, making them vulnerable to factors such as snow accumulation, sand abrasion, humidity, and human-induced damage. These conditions often lead to defects like corrosion and damage in transmission line fittings, which can cause safety incidents. Among the critical components of transmission lines is the vibration hammer protection fitting, also named metal fitting (referred to as “fitting”). Fittings play a protective role by reducing the vibration amplitude of transmission lines under wind forces. However, in complex field environments, fittings are prone to rust, which increases the risk of detachment and can lead to public safety incidents. Timely detection of rust or damage in these fittings, followed by maintenance or replacement, is crucial for ensuring the safe and reliable operation of transmission lines. An example of a rusted fitting is illustrated in Figure 1.
Currently, multi-modal intelligent situation awareness is widely studied in fields such as real-time air traffic control, where the methods like control intent understanding and trajectory prediction [1] enhance dynamic environment perception by fusing sensor data and semantic reasoning [2]. In multi-UAV systems, dynamic path planning [3] for cooperative tasks in uncertain environments has also advanced, enabling efficient coordination under complex and communication-limited conditions, demonstrating the potential of edge-based intelligent decision-making. Besides traditional manual inspections, unmanned aerial vehicle (UAV) inspections have begun to incorporate ultrasonic and thermal imaging techniques to enable automated inspections. However, existing UAV inspection methods still rely heavily on manual operations and require manual processing of faulty data. Obviously, advancing intelligent UAV inspections for transmission lines has significant room for improvement. By integrating computer vision and deploying online object detection models, intelligent UAV inspections can replace traditional methods, reducing inspection costs and enhancing efficiency.
Traditional image detection algorithms recognize objects using techniques such as noise filtering and foreground–background separation. For instance, median filtering [4] is used to remove noise, while image background segmentation algorithms [5,6] separate foreground and background to identify target objects. Additionally, edge detection algorithms like Canny edge detection [7], Hough transform [8], and line segment detector (LSD) [9] can be employed to detect target objects. However, these traditional algorithms are only effective in specific backgrounds and struggle with the complex environments of transmission lines, resulting in low detection accuracy and insufficient robustness. As a result, traditional image detection methods are unsuitable for intelligent inspections of transmission lines.
As a promising technique, deep learning-based image object detection models have received substantial attention in the past decade. In general, these models are generally categorized into two types: two-stage and one-stage models. For two-stage models, such as the Faster R-CNN [10], Zheng et al. [11] utilized deformable convolution operations during the feature extraction stage to fully capture target feature information. In one-stage models, such as YOLOv3, Chen et al. [12] introduced an attention mechanism and feature pyramids during the feature extraction stage to enhance the accuracy of detecting hardware corrosion. While these methods improve detection accuracy, they often suffer from drawbacks such as model complexity, high parameter volume, and long detection times, making them unsuitable for real-time inspections.
The rapid development of mobile intelligent terminal devices, such as UAVs, calls for the development of lightweight and real-time object detection models for deploying deep learning techniques. Several approaches have been proposed to achieve lightweight image object detection, such as designing lightweight networks or integrating efficient neural networks into deep learning models. For example, Ji et al. [13] enhanced YOLOv5 by incorporating the C3CrossConv module to reduce computational load [14] and employing a global attention mechanism to focus on relevant object attributes. Betti et al. [15] proposed a fast and efficient network for small object detection, achieving higher accuracy than YOLOv3 with fewer parameters and lower computational costs. As the latest version of YOLO family, YOLOv11 has been successfully applied to solve various detection problems such as vibratory position detection [16] and bone fracture detection [17], etc. Moreover, YOLO is quite suitable to be used as a basic architecture due to its merits like clear structure and good extensibility. Xie et al. [18] introduced CSPPartial-YOLO, a lightweight model that integrates a partial hybrid dilated convolution (PHDC) block and coordinate attention to improve small object detection in remote sensing images. Akdoğan et al. [19] designed a Progressed and Preprocessed YOLO (PP-YOLO) to detect cherry and apple trees by applying Histogram Equalization (HE) and Wavelet Transform (WT) image preprocessing techniques to the images. While these models reduce complexity through lightweight designs, their simplified structures and limited feature extraction capabilities often result in lower accuracy for detecting small objects in outdoor environments, leading to higher missed detection rates.
Another kind of lightweight image object detection model is knowledge distillation. This method enhances the detection accuracy by using a pre-trained model as the teacher model, which provides guiding information to train a simpler student model. For instance, Jobaer et al. [20] applied knowledge distillation to small object detection in blurry images and proposed a self-supervised method with a deblurring subnet and attention modules. Similarly, Zhang et al. [21] utilized knowledge distillation (InstKD) for 3D detector compression by leveraging expanded bounding boxes (E-Bbox) and contribution maps (CM) to dynamically balance foreground–background regions. Knowledge distillation also shows promising performance on small and dense objects. Li et al. [22] proposed a multi-scale feature fusion with knowledge distillation for object detection in aerial imagery. While existing knowledge distillation methods mainly aim to enhance the accuracy of the student model, they typically adopt generic lightweight networks without specifically considering the unique constraints and requirements of resource-limited scenarios such as UAV-based deployment.
In summary, the key to solving the corroded fitting detection problem in intelligent inspections lies in three aspects:
(1) Unlike generic YOLO distillation teacher models, we integrate DenseNet to enhance feature transmission and alleviate gradient vanishing, and employ the spatial pixel-aware self-attention (SPSA) to exploit pixel-wise correlations for structured feature utilization—effectively suppressing complex background interference in UAV inspection scenes, a key gap in prior works.
(2) We use the teacher model’s EIoU-NMS to filter high-quality candidate boxes for the student model, and optimize the distillation temperature to balance information absorption—avoiding the over-distillation issue of generic soft-label transfer in previous methods.
(3) Our student model adopts MobileNetV3 instead of generic lightweight backbones. It achieves 10.5 MB size and 0.016 s detection time—outperforming prior lightweight YOLO distillation models in UAV edge deployment.
The model’s effectiveness is validated using real-world UAV inspection images from the outdoor environments of China. The contribution of this paper lies in constructing a high-performance teacher model and a lightweight student model, leveraging knowledge distillation to develop a robust and lightweight corroded fitting detection model. Unlike existing object detection models, this approach employs knowledge distillation with an improved high-capacity teacher model to guide the student model’s training. Compared to the student model trained without knowledge distillation and unimproved teacher model, the proposed approach maintains its compact size while achieving higher accuracy and robustness.

2. Background

2.1. YOLOv5 Image Object Detection Models

With the growing development of deep learning [23], convolutional neural networks (CNNs) have emerged as the primary approach for addressing image object detection challenges. Deep learning-based image object detection models learn feature representations of targets from extensive datasets, enabling object localization and classification. The two-stage models, such as region-CNN (R-CNN) [24], Fast R-CNN [25], and Faster R-CNN [10], utilize a region proposal network (RPN) to generate proposal boxes, followed by object localization and classification. In contrast, the one-stage models, including YOLOv3 [26], YOLOv4 [27], YOLOv5, and SSD [28], directly generate candidate boxes, providing object position coordinates and classification probabilities in a single step. In recent years, target feature extraction and imaging technologies based on 3D radar perception and point clouds have also been gradually applied in target detection [29,30]. This makes one-stage models significantly faster, rendering them more suitable for the rapid detection requirements of intelligent UAV inspections of transmission lines.
The YOLOv5 image object detection model, illustrated in Figure 2, is a state-of-the-art one-stage model known for its exceptional detection performance. It incorporates several improvements over its predecessors, YOLOv4 and YOLOv3. The YOLOv5 model comprises four main components: the input layer, the feature extraction stage, the feature fusion stage, and the output layer. Through feature extraction and fusion, YOLOv5 generates three feature maps of varying sizes. These feature maps are divided into grids, with each grid producing candidate boxes responsible for predicting object confidence, class information, and position information. Low-confidence candidate boxes are filtered out using a predefined threshold, and non-maximum suppression is applied to retain high-scoring boxes, ultimately yielding the final detection results.
The loss function of YOLOv5 consists of three components: candidate box confidence loss, candidate box classification loss, and candidate box position regression loss, as follows:
L o s s = L o b j + L c l s + L b o x
L o b j = λ n o o b j i = 0 S 2 j = 0 B 1 i , j o b j · l i , j o b j + λ o b j i = 0 S 2 j = 0 B 1 i , j o b j · l i , j o b j
L c l s = λ c l a s s i = 0 S 2 j = 0 B 1 i , j o b j · l i , j c l s
L b o x = λ c o o r d i = 0 S 2 j = 0 B 1 i , j o b j · l i , j b o x
In Equation (2), S 2 represents the grids on the feature map, and B denotes the number of candidate boxes. 1 i , j o b j takes the value of 1 if there is an object inside the candidate box at position i, j, and 0 if there is no object. 1 i , j n o o b j takes the value of 1 if there is no object inside the candidate box at position i, j, and 0 if there is an object. 1 i , j o b j represents the confidence loss function for the candidate boxes. In Equation (3), 1 i , j c l s represents the classification loss function for the candidate boxes at position i, j, and only calculates the classification loss for positive samples. In Equation (4), 1 i , j b o x represents the position regression loss function for the candidate boxes at position i, j, and similarly, it only calculates the position regression loss for positive sample candidate boxes, while λ is used to balance the various losses.

2.2. Knowledge Distillation

Knowledge distillation is an effective approach for model compression. It first training a complex model with high accuracy and then using this pre-trained teacher model to assist in training a student model with fewer parameters, faster detection speed, and lower latency. The teacher model transfers its acquired knowledge to the student model, thereby enhancing the student model’s accuracy. In knowledge distillation, there are no restrictions on the number of parameters for the teacher model, but the student model should be selected with a simple model structure and fewer parameters. In practical applications, the structurally simple and low-latency student model is deployed on mobile intelligent terminal devices, while the teacher model only serves as a guide during the training of the student model.
Knowledge distillation can be divided into feature-based distillation and response-based distillation. However, feature-based distillation may increase the size of the student model, making it unsuitable for compressing models on mobile intelligent terminal devices. The traditional image object detection model has only 0 and 1 training labels in the classification training process, positive samples have a label of 1, and the label of negative samples is 0. The negative labels do not provide much valuable information during training. However, research has shown that negative labels also contain useful information that can benefit the training process. In response-based knowledge distillation training, the teacher model transfers its output probabilities as soft labels to the student model to increase the amount of information and improving the student model’s generalization ability. The calculation of the probabilities for the soft labels is given by the following formula:
p ( z i , T ) = exp ( z i / T ) j exp ( z j / T )
where z j represents the logit of the i-th class (i.e., the output of the neural network’s final layer), and T is the temperature factor used to adjust the significance of soft labels during the training of the student model. The calculation of the distillation loss is shown as follows:
L R e s D ( p ( z t , T ) , p ( z s , T ) ) = L R ( p ( z t , T ) , p ( z s , T ) )
where L R ( p ( z t , T ) , p ( z s , T ) ) represents the loss between the class probabilities of the teacher and student models, typically measured using the Kullbak–Leibler divergence. Here, z t is the logit of the i-th class from the teacher model, and z s is the logit of the i-th class from the student model. By optimizing this expression, the neural network’s final layer output of the student model is made to match the final layer output of the teacher model. The temperature in knowledge distillation can alter the student model’s attention to negative labels during training. When the temperature value is small, the student model pays less attention to negative labels during training. Conversely, when the temperature value is large, the student model pays more attention to negative labels during training. During the training process, negative labels contain information, where higher probability values in negative labels have a more significant impact while lower probability values have less impact. Thus, the temperature value should be set based on the specific situation. If one wants to make better use of the information from negative labels, it needs to increase the temperature value. On the other hand, if one wants to reduce the impact of negative labels, it is required to decrease the temperature value.

3. Designed Methodology

This paper presents a new knowledge-distilled lightweight YOLO model for robust corroded fitting detection, also comprising a teacher model and a student model. The overall framework of the proposed model is illustrated in Figure 3. To enhance feature extraction, a densely-connected convolutional network (DenseNet) is incorporated into the teacher model for improving feature transfer and reducing the number of parameters. The potential gradient vanishing issues in YOLOv5 are also mitigated. Additionally, spatial pixel-aware self-attention (SPSA) is introduced to better exploit structured feature information from objects, thereby enhancing the feature fusion process in YOLOv5. Our method is inspired by recent advances in local modeling, particularly the Scaling Local Self-Attention [31] and Neighborhood Attention Transformer [32], which introduce effective mechanisms for capturing local contextual information. In complex detection environments, we observe that the relationships between a target pixel and its surrounding pixels are often overlooked in conventional attention mechanisms. While individual pixels may lack discriminative features on their own, neighboring pixels are typically highly correlated and contain valuable contextual information. To better exploit this local structure, we introduce the SPSA mechanism, which adaptively weights the influence of neighboring pixels on the central pixel, thereby enhancing the model’s ability to capture fine-grained spatial relationships and improving the robustness of object detection under challenging conditions. For the student model, a lightweight MobileNetV3 network is employed for feature extraction. Its simplicity, low parameter volume, fast computational speed, and minimal latency make it well-suited for deployment on mobile intelligent terminal devices. Since single-stage object detection models, such as the teacher model, tend to generate a large number of candidate boxes, the EIoU-NMS method is adopted for candidate box selection. This approach improves the accuracy of bounding boxes and enhances the quality of knowledge transferred from the teacher model. During the knowledge distillation process, the teacher model transmits candidate box information to guide the training of the student model, ensuring the effective utilization of valuable feature information. This process ultimately enhances the performance of the student model, leading to improved accuracy in image object detection.

3.1. The Designed Teacher Model

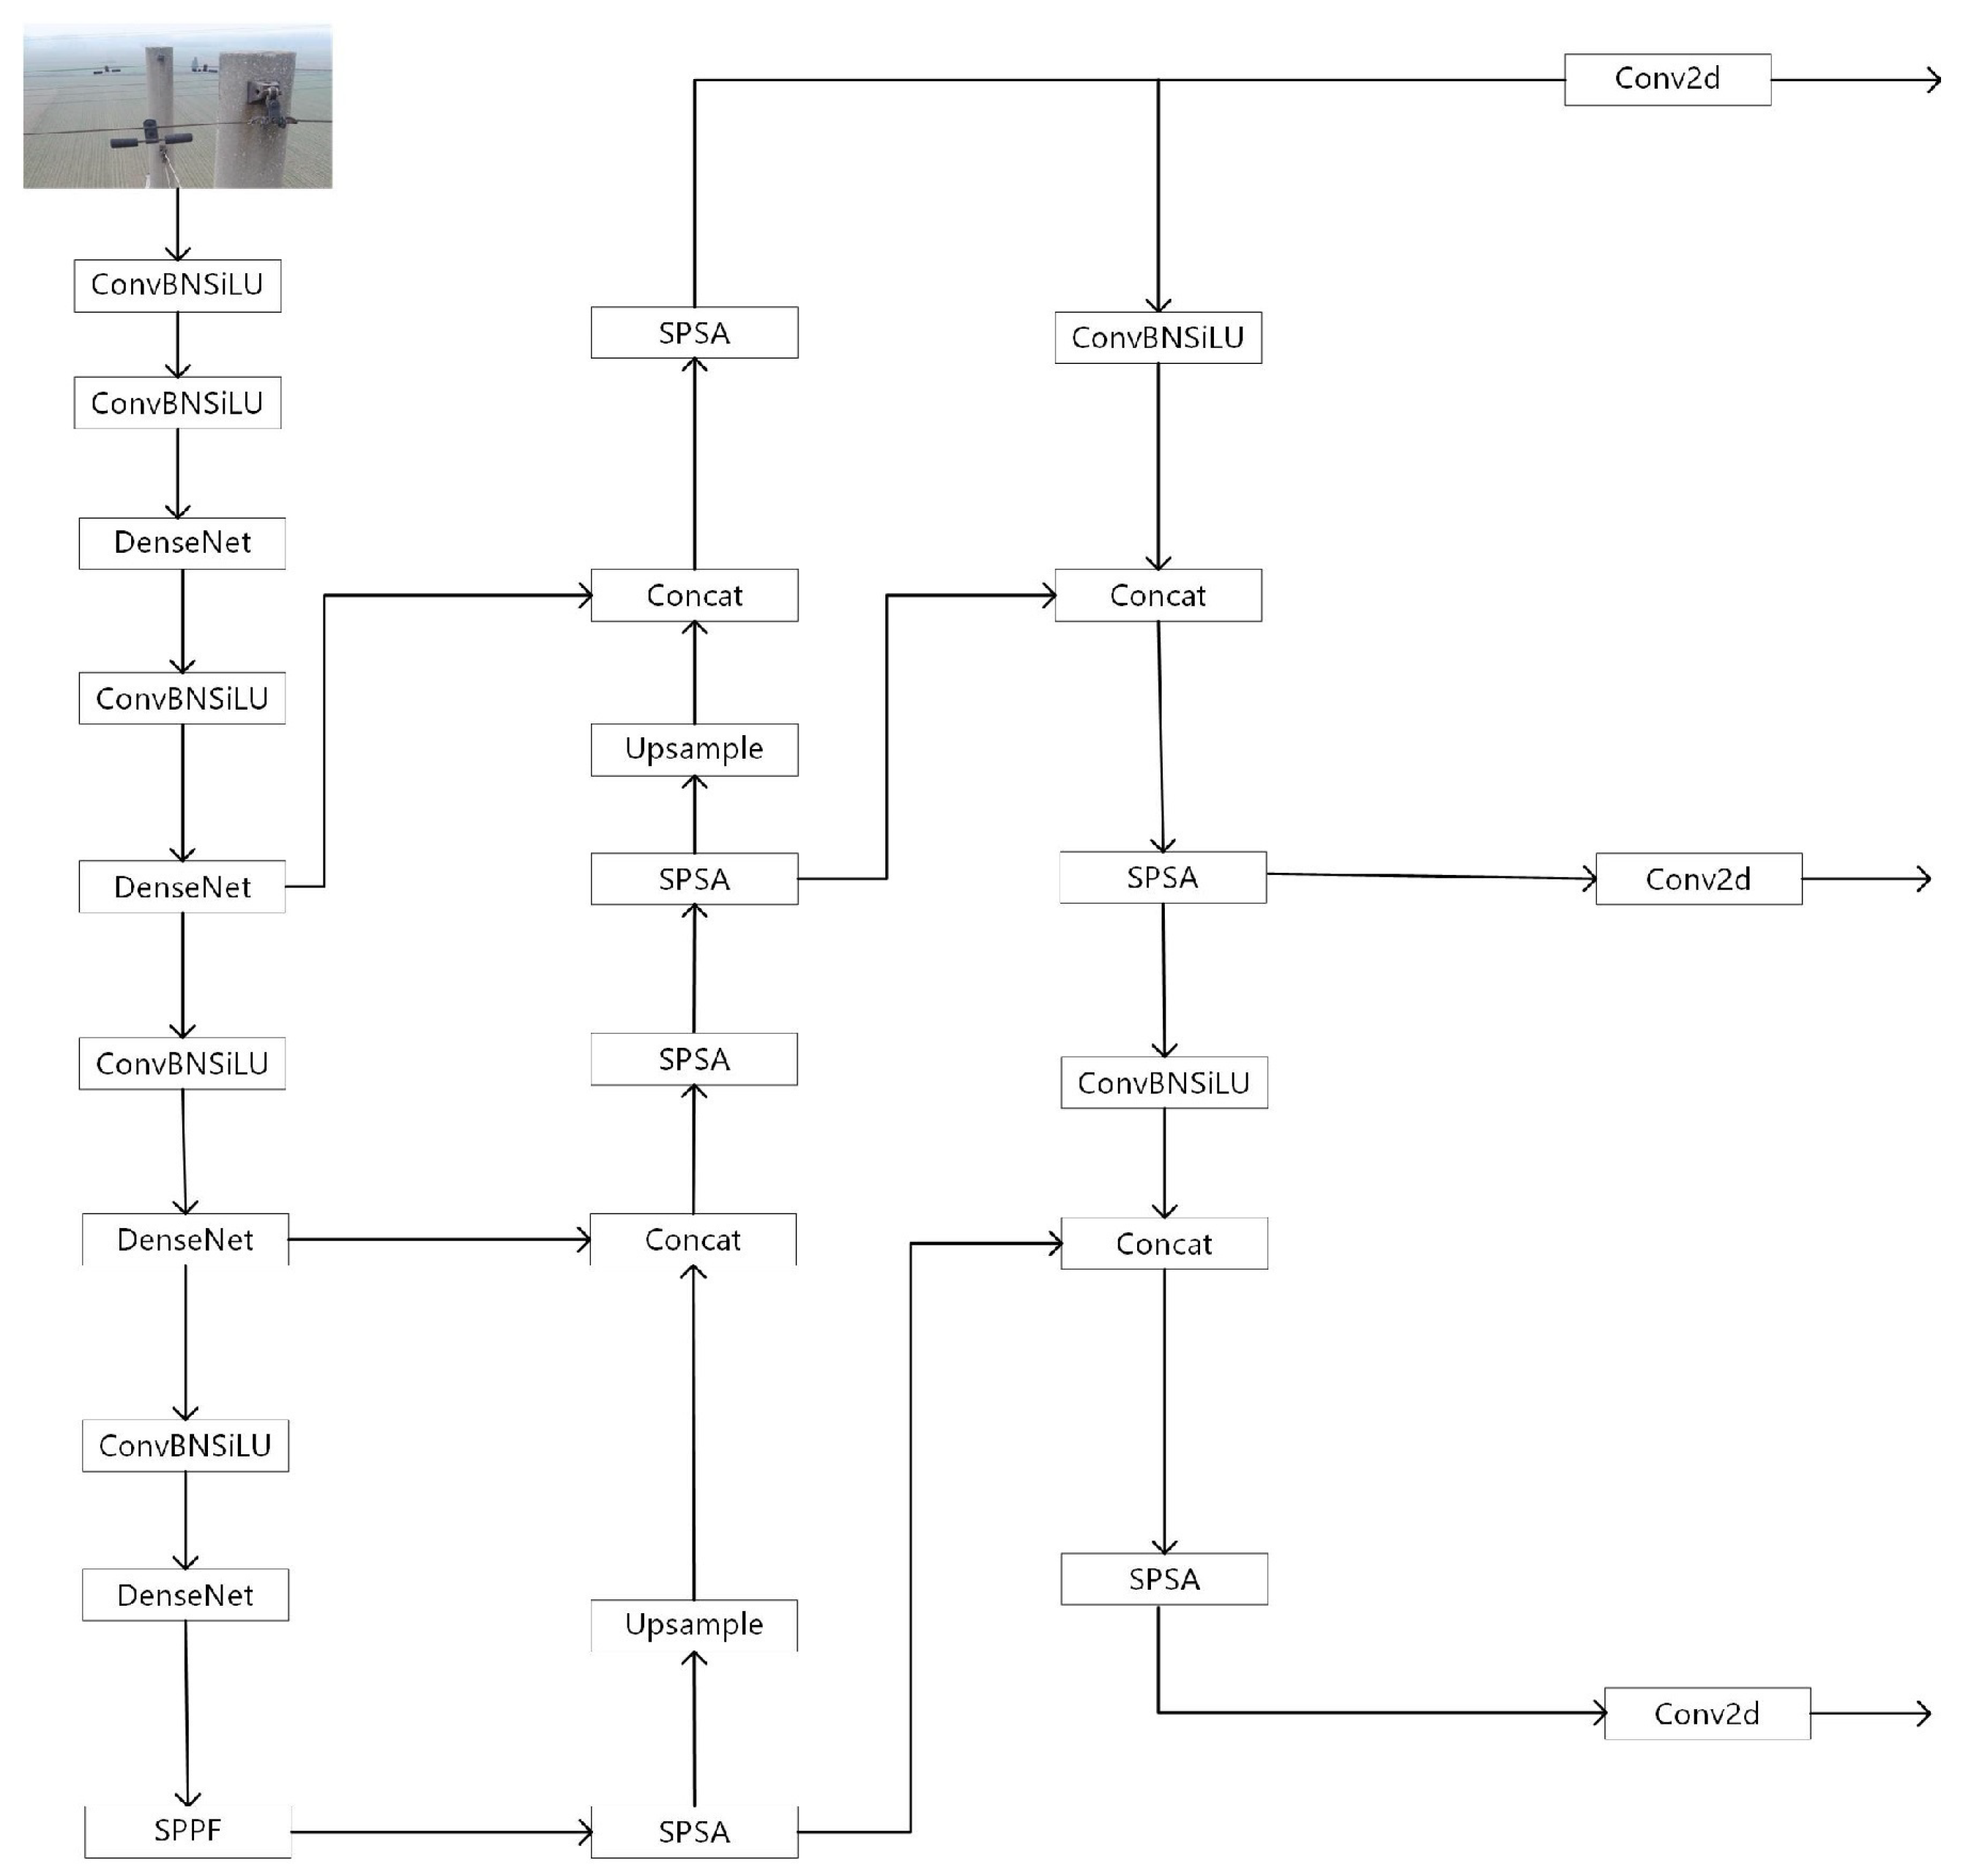
For the teacher model, DenseNet is introduced in the feature extraction phase of the YOLOv5 to enhance feature transmission and reduce the number of parameters. Simultaneously, SPSA is incorporated to enhance the utilization of structured feature information from object, thereby suppressing interference from complex environments and enhancing the robustness of object detection accuracy. The flowchart of the teacher model is shown in Figure 4.

3.1.1. Details of DenseNet

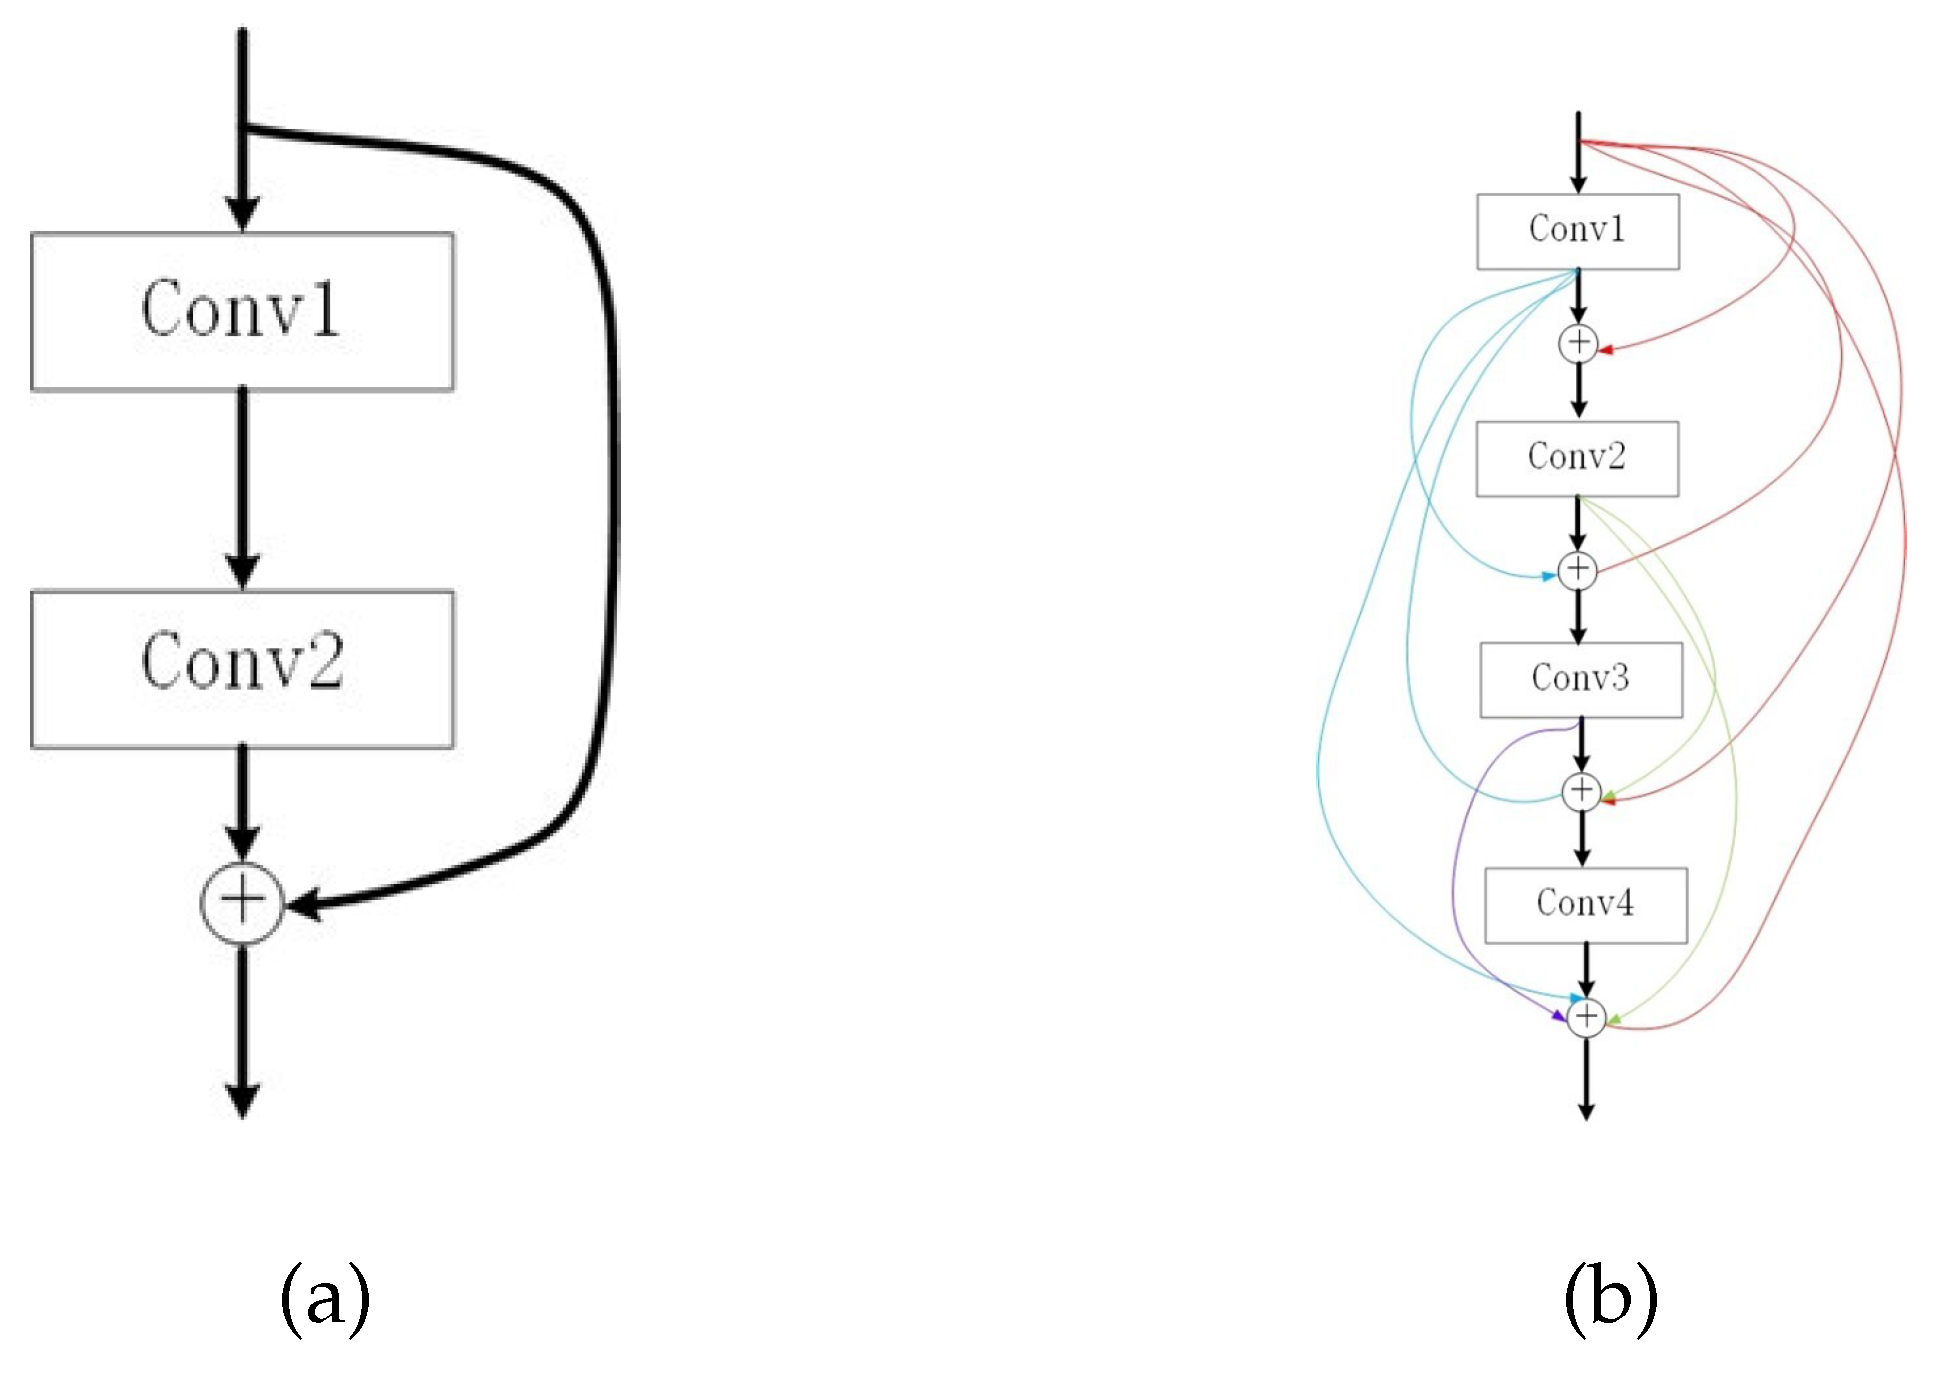
With the wide application of deep learning technology, the number of deep neural network layers is deepening. In deep neural networks, the phenomena of gradient vanishing and gradient exploding may arise. However, residual network (ResNet) addresses these problems by utilizing residual structures with skip connections to reduce parameters. Research has shown that shorter connections between the input and output layers of a neural network can deepen the network, enabling faster and more efficient training of the neural network. To address this issue, we use DenseNet. The details of DenseNet and ResNet are shown in Figure 5. The output of each layer of DenseNet serves as the input of each subsequent layer. Therefore, the input of the feature map of the l-th layer is the concatenation of previous feature maps, which are denoted as X 0 , X 1 , , X l 1 , and the calculation is as follows:
X l = H L ( [ X 0 , X 1 , . . . , X l 1 ] )
where H L represents the concatenation of feature maps. The traditional convolutional neural network has M connections between adjacent layers, whereas DenseNet exhibits M ( M + 1 ) 2 connections. DenseNet gives the illusion of requiring more parameters compared to traditional neural networks. On the contrary, it actually requires fewer parameters. DenseNet does not acquire rich features by constructing extremely deep or wide neural networks. Instead, it strengthens the use of existing features to improve the model’s ability to extract features, resulting in a neural network model that is both easy to train and efficient. DenseNet cascades the features of different layers to increase the subsequent output changes which is the primary distinction between DenseNet and ResNet. Ultimately, it strengthens feature extraction, reduces parameters count, alleviates gradient vanishing, and improves efficiency.

3.1.2. Details of SPSA

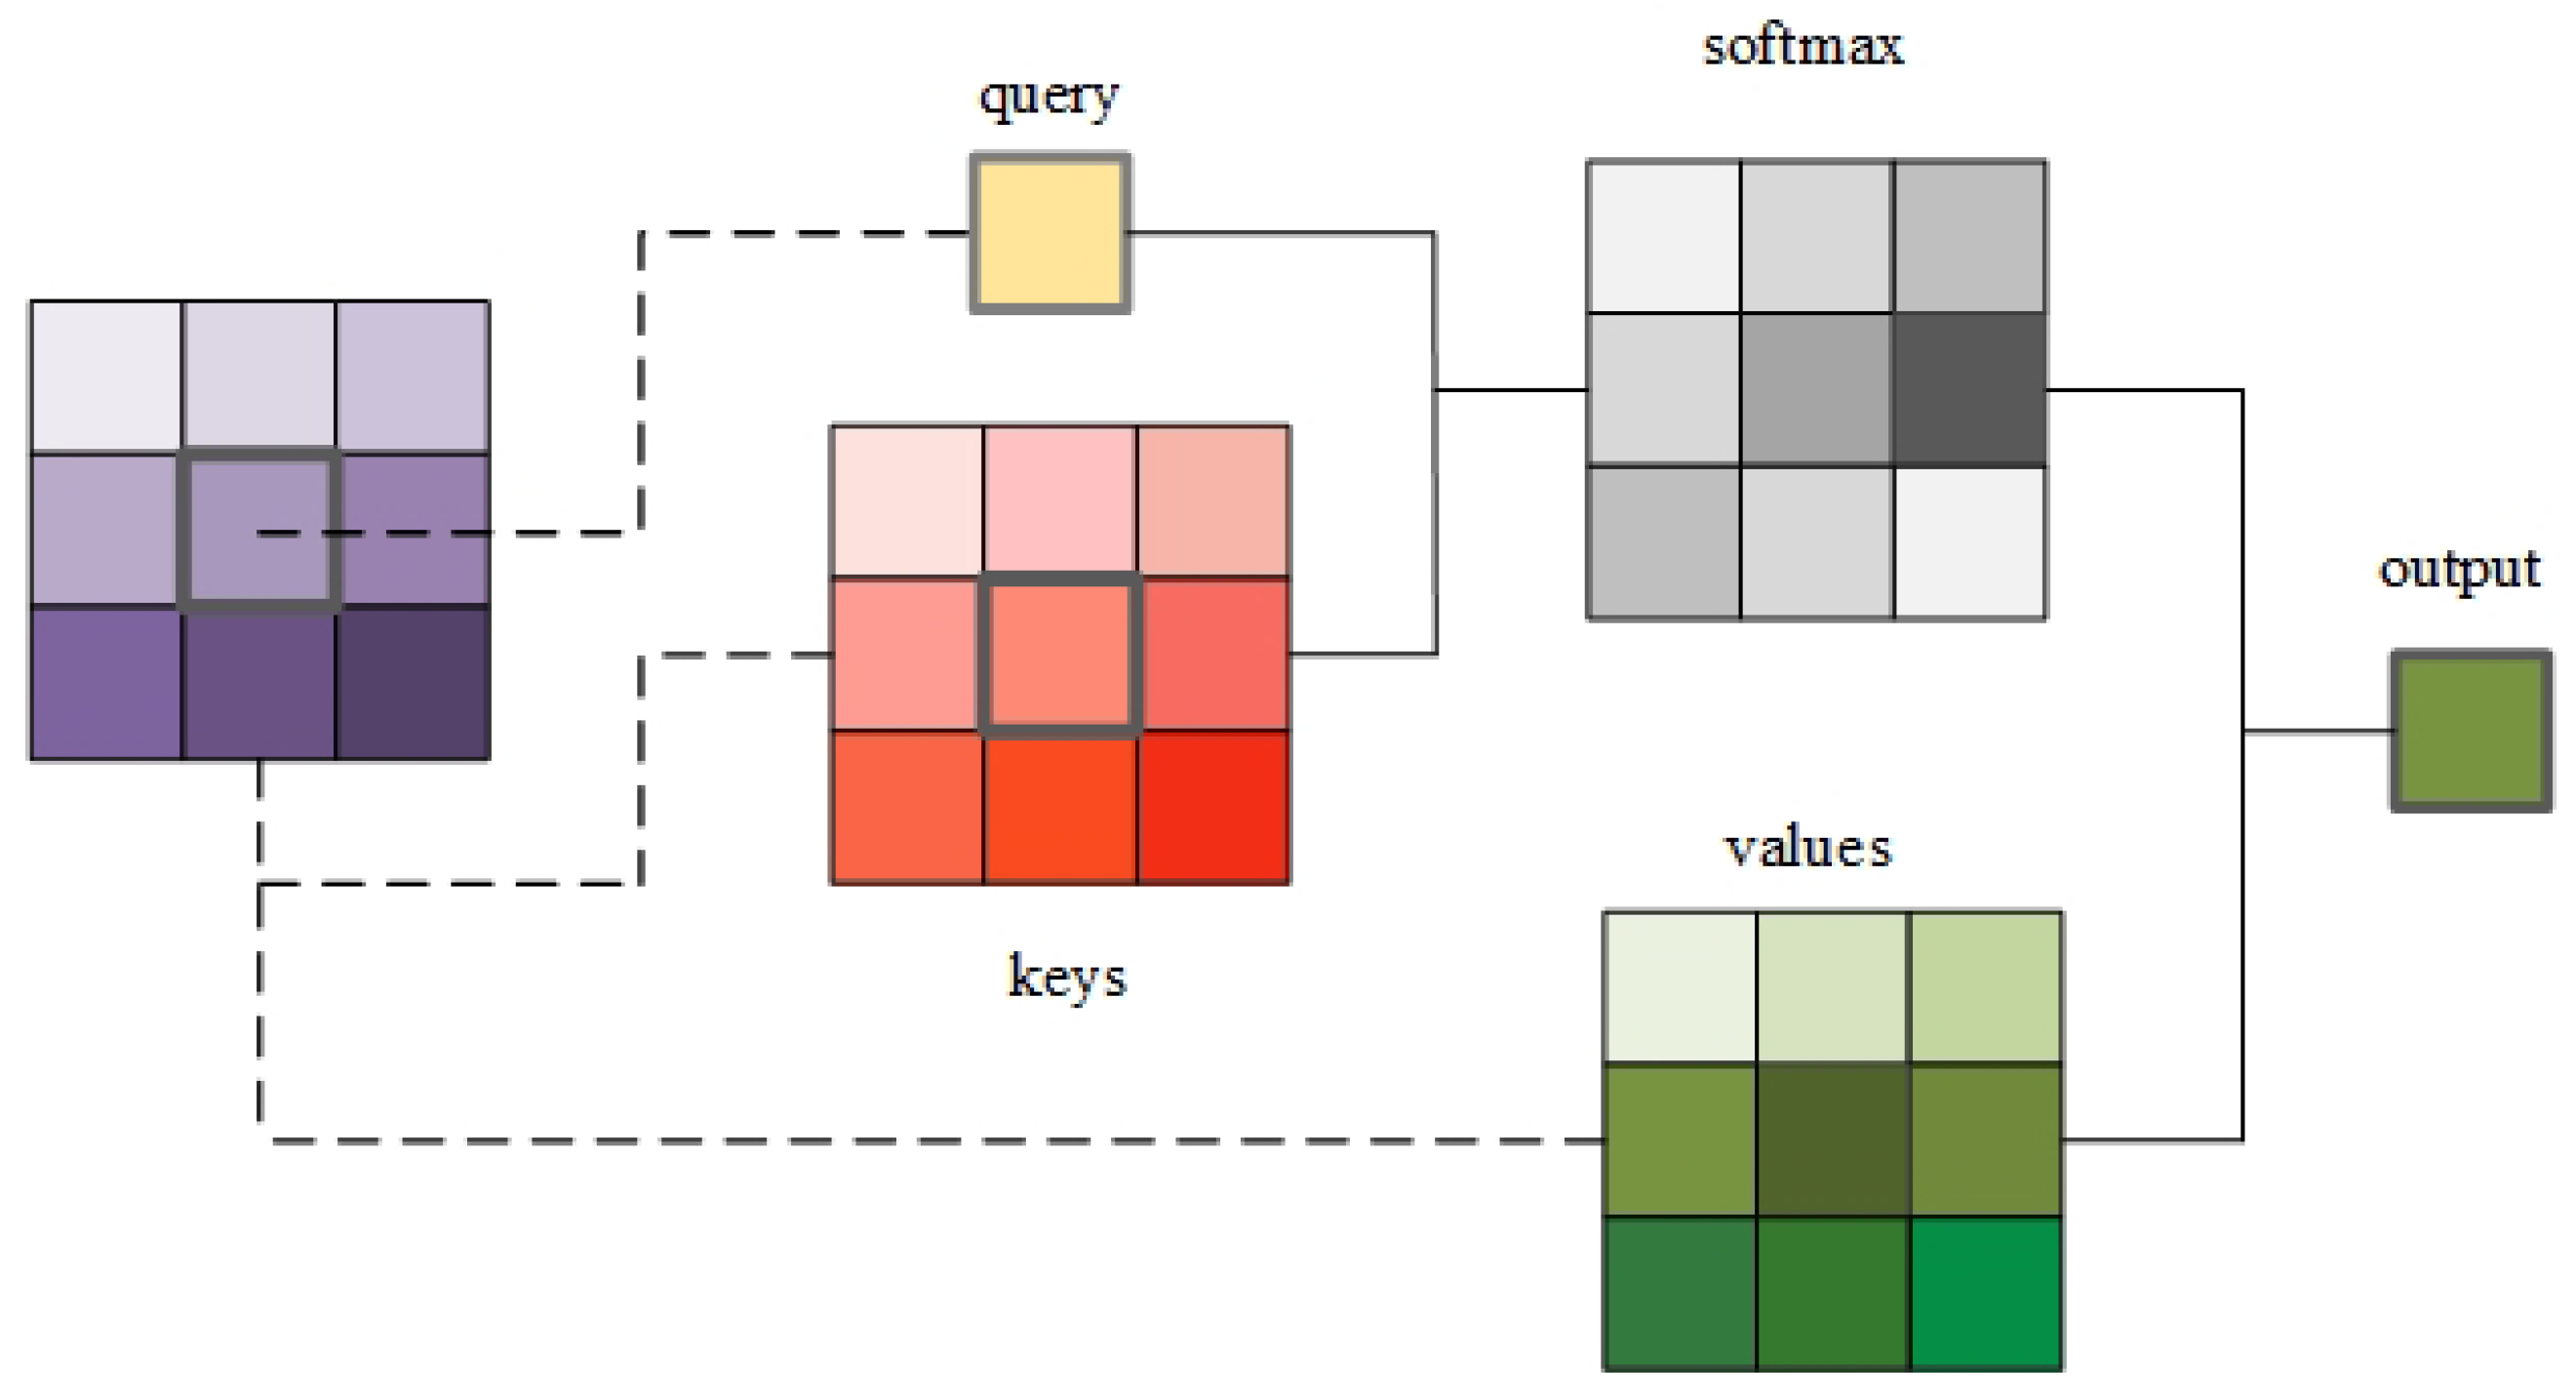
In recent years, attention mechanisms have been extensively integrated into computer vision-based object detection models to enhance their robustness. Traditional attention mechanisms primarily focus on improving feature extraction by emphasizing relevant spatial and channel-based information. The incorporation of global features enhances information retrieval capabilities, while increasing the weight of prominent regional features helps suppress interference from irrelevant data. Existing attention mechanisms, such as channel attention and spatial attention, leverage inter-channel correlations and positional dependencies to refine feature representation. Most conventional attention mechanisms are tightly coupled with convolutional operations. However, whether an independent attention module can be designed without relying on convolutional layers remains an open research question. This necessitates the development of a standalone feature enhancement module that can serve as an alternative to convolutional layers. To address this, we propose a novel self-attention mechanism model, specifically a simple local self-attention module, as illustrated in Figure 6. Since individual pixels contain limited discriminative information, the correlation between adjacent pixels plays a crucial role in feature extraction. The proposed self-attention mechanism assigns adaptive weights to neighboring pixels, reinforcing their influence on the central pixel and thereby enhancing local feature representation. The computation process for a single-head self-attention mechanism is formulated as follows:
y i j = a , b N k ( i , j ) s o f t max a b ( q i j T k a b ) v a b
where y represents the output, a,b N k ( i , j ) represents the region of pixel point x i j within a range of k, the query q i j = W Q x i j , the keys k a b = W K x a b , and the values v a b = W V x a b . In the above three formulas, W Q , W K and W V are three trainable parameter matrices. In image object detection, it is evident that image objects possess significant structural information and positional relationships. Therefore, the positional information of each pixel is crucial as well. The aforementioned method does not incorporate positional information. To enhance the utilization of structured features information from the targets, the positional information of nearby pixels is incorporated into the self-attention mechanism, as shown in Figure 7. The calculation of SPSA with relative positional information is as follows:
y i j = a , b N k ( i , j ) s o f t max a b ( q i j T k a b + q i j T r a i , b j ) v a b
where r represents the offset of surrounding pixels relative to the central pixel.

3.2. The Designed Student Model

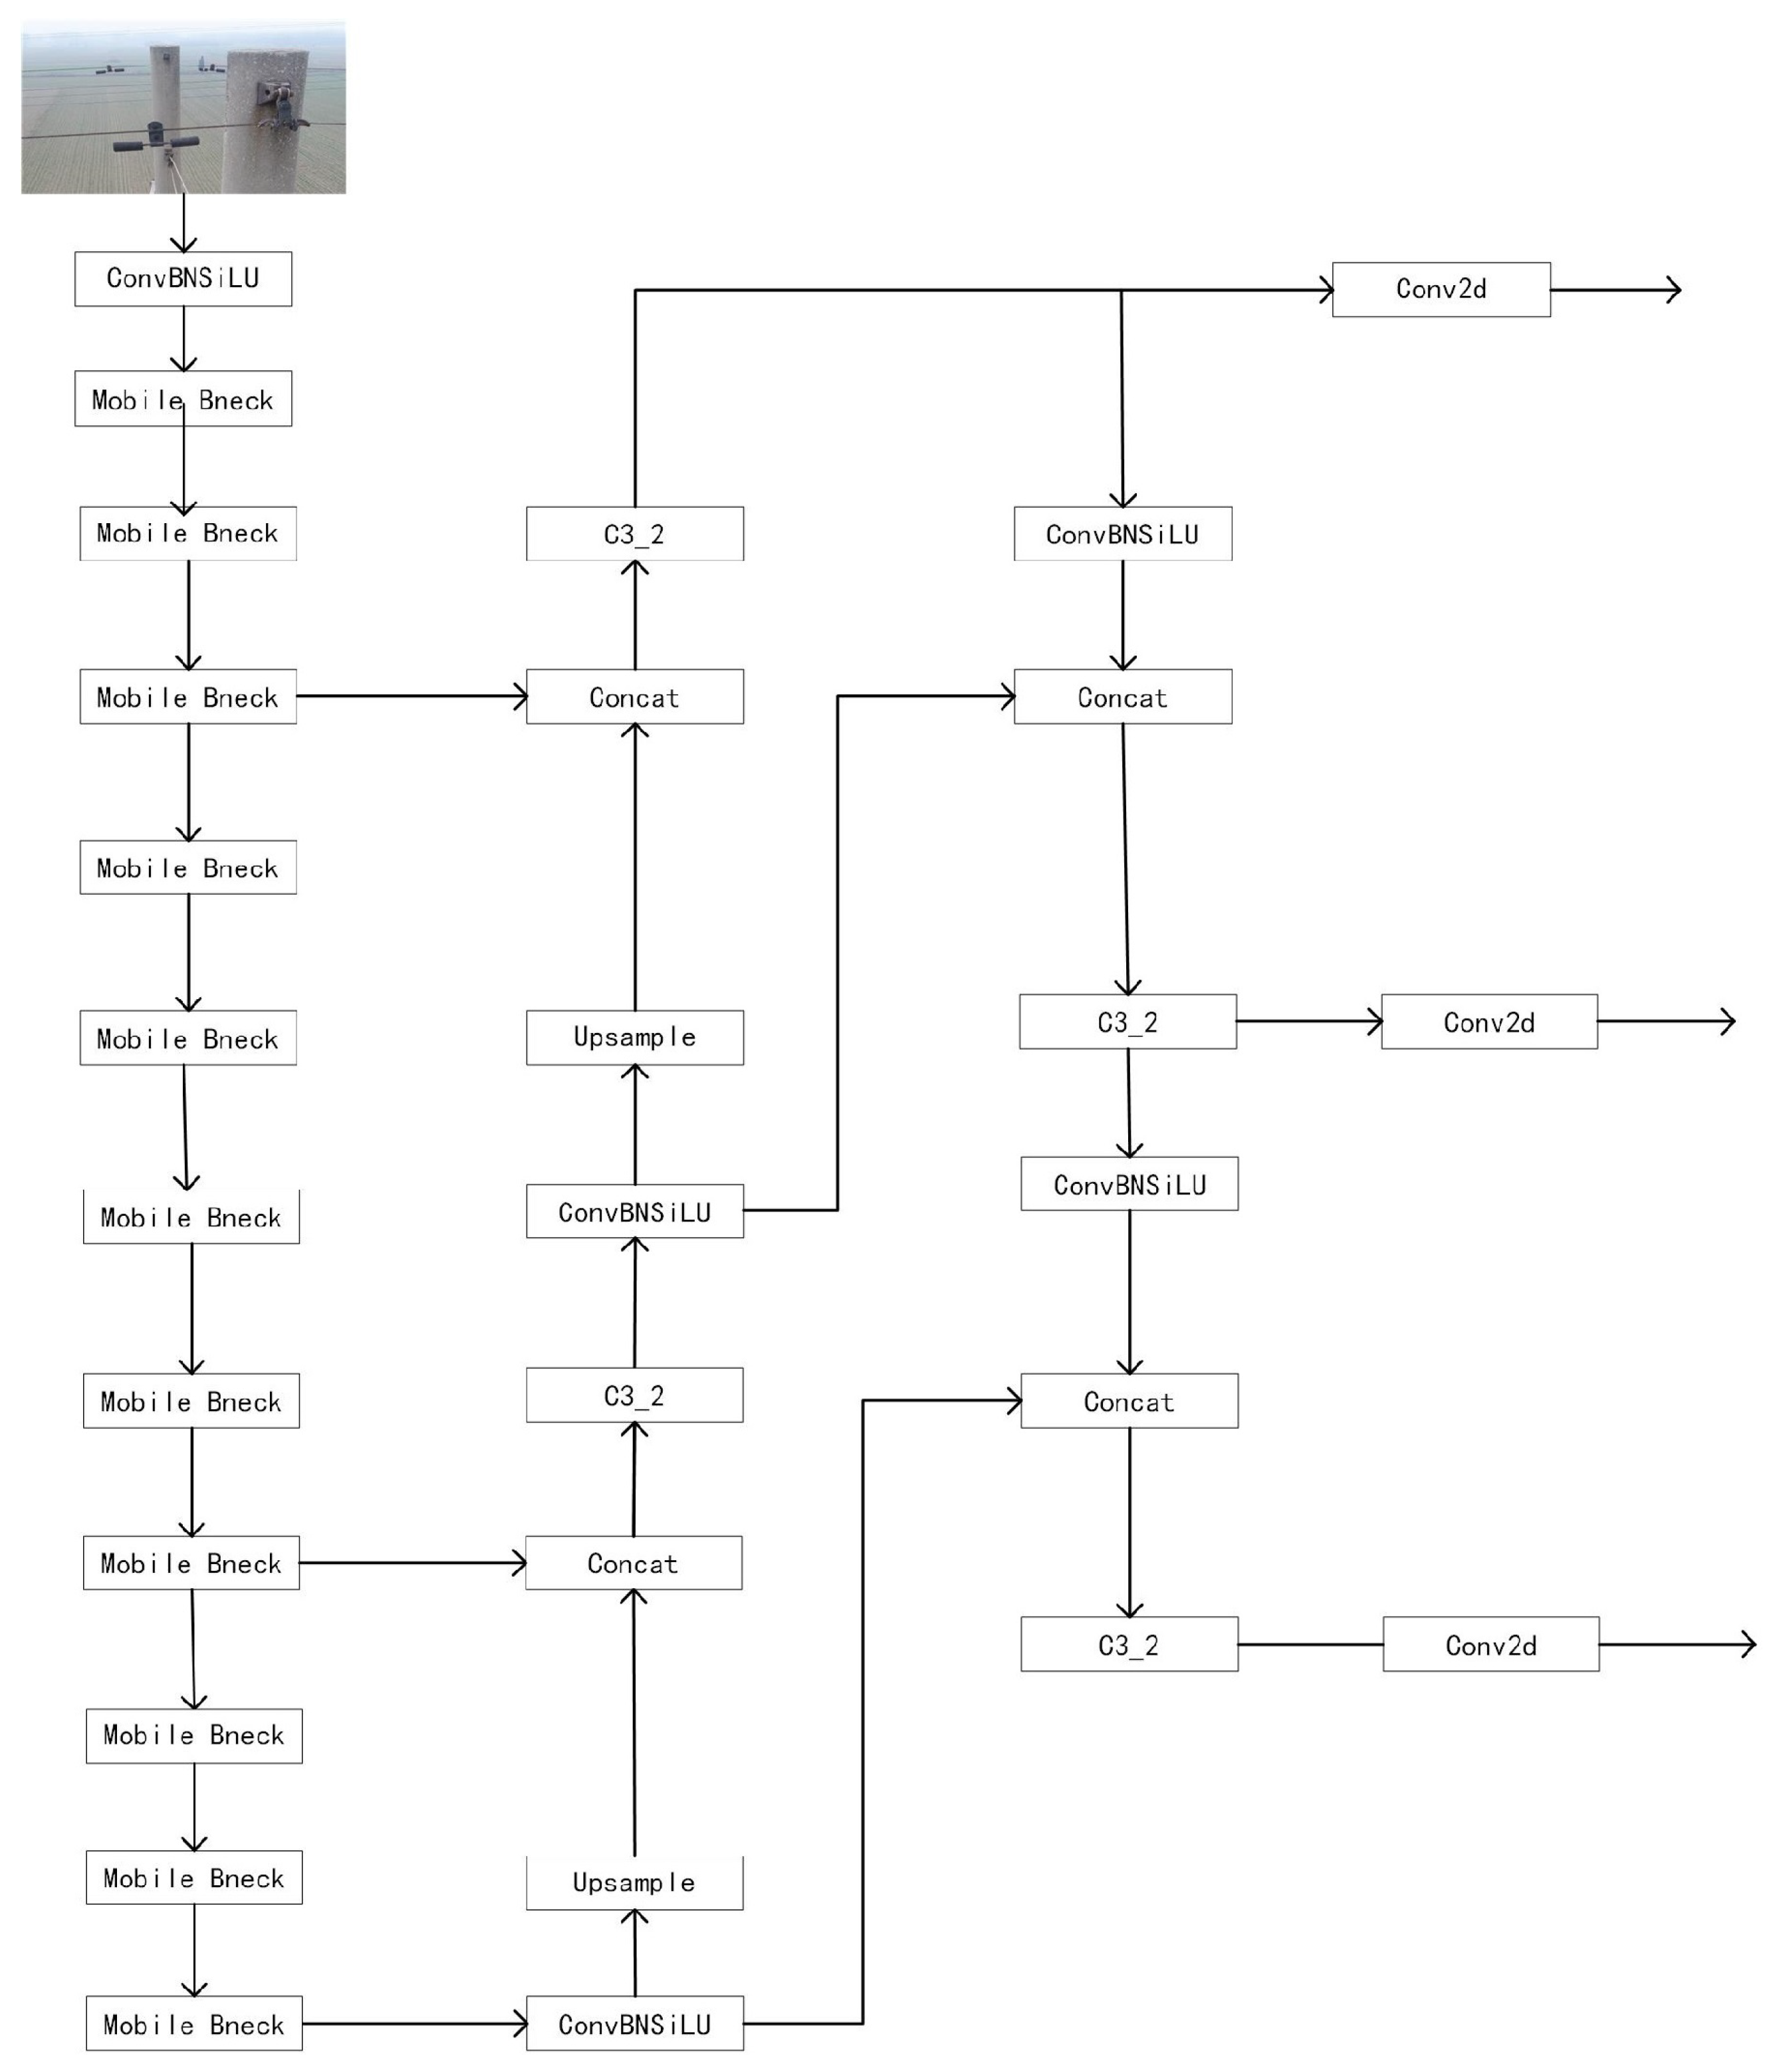
In the training phase of the student model, it is recommended to choose a lightweight and fast image object detection model. Therefore, MobileNetV3 is selected as the feature extractor for YOLOv5, serving as the student model. The flowchart of the student model is shown in Figure 8.
MobileNetV3 is a lightweight network model that achieves this goal by optimizing various structures, which makes it suitable for deployment on mobile intelligent terminal devices. Depthwise separable convolution is applied in MobileNetV3. And its main improvement is that the convolution kernel has only one dimension and does not change the number of channels in the convolution process. The inverted residual structure is formed by using 1 × 1 ordinary convolution. Furthermore, channel attention is introduced to enhance the feature extraction capability. The structure of MobileNetV3 is listed in Table 1. In this paper, the student model replaces the YOLOv5 feature extraction phase with the MobileNetV3, as depicted in Figure 4, Figure 5 and Figure 6.

3.3. Training of Distillation

In order to obtain a small image object detection model with few parameters and high accuracy, this paper uses knowledge distillation method for training. Before introducing the specific formula, the meaning of the superscript was uniformly explained firstly. The superscript g t denotes outputs from the student model (the model being trained to learn both from ground-truth and the teacher). The superscript T represents outputs from the teacher model (a more powerful model, e.g., the improved YOLOv5, providing extra supervision). And the superscript ^ stands for ground-truth labels (the ideal target annotations for basic detection supervision). First, the teacher model is trained, and then the teacher model is used for distillation training to assist in training the student model. The calculation of loss is as follows:
L f i n a l = f o b j ( o i g t , o ^ i , o i T ) + f c l ( p i g t , p ^ i , p i T , o ^ i T ) + f b b ( b i g t , b ^ i , b i T , o ^ i T )
where f obj ( · ) is the function that determines whether a candidate box contains a real object by distinguishing background from foreground [13], f cl ( · ) classifies the category of the candidate box such as identifying a metal fitting as corroded, and f bb ( · ) regresses the coordinates of the candidate box to achieve precise localization of the target. Specifically, f o b j optimizes object existence judgment using the true existence label o i g t , the model prediction value o ^ i , and the auxiliary variable o i T . f c l improves classification accuracy based on the true category label p i g t , the category prediction distribution p i ^ i , and related auxiliary information p i T and o ^ i T . f b b optimizes the prediction accuracy of object position and size using the true bounding box b i g t , the predicted bounding box b ^ i , and the auxiliary variables b i T and o ^ i T . The three work together to make the model close to the real annotation in three dimensions: existence, category, and location.
The calculation of object loss f o b j ( o i g t , o ^ i , o i T ) is as follows:
f o b j ( o i g t , o ^ i , o i T ) = f o b j ( o i g t , o ^ i ) D e t e c t i o n l o s s + λ D f o b j ( o i T , o ^ i ) D i s t i l l a t i o n l o s s
where o i g t is the intersection over union between the candidate box predicted by the student model and the true label, o ^ i is the true value of the label, o i T is the teacher model’s predicted IoU (ranging from 0 to 1), used as a soft label to pass on its object detection judgment through knowledge distillation, and λ D is used to balance the two losses, which is defaulted to 1 in this paper and then calculated using the mean square error. The classification loss of candidate boxes is f c l ( p i g t , p ^ i , p i T , o ^ i T ) , and the calculation is as follows:
f c l ( p i g t , p ^ i , p i T , o ^ i T ) = f c l ( p i g t , p ^ i ) + o ^ i T · λ D · f c l ( p i T , p ^ i )
where p i g t is the candidate box classification probability predicted by the student model, p ^ i is the true value of label classification, p i T is the candidate box classification probability predicted by the teacher model, and the rest is the same as in Equation (11). If the candidate box represents the background, the probability value passed from the teacher model would be extremely low. This helps prevent the student model from learning incorrectly.
The coordinate regression loss of the candidate box is f b b ( b i g t , b ^ i , b i T , o ^ i T ) , which is calculated as follows:
f b b ( b i g t , b ^ i , b i T , o ^ i T ) = f b b ( b i g t , b ^ i ) + o ^ i T · λ D · f b b ( b i T , b ^ i )
where b i g t is the position coordinate of the candidate box predicted by the student model, b ^ i is the true value of the label coordinate, b i T is the position coordinate of the candidate box predicted by the teacher model, and o ^ i T is the weight from the teacher model indicating the reliability of the object prediction. If the teacher model judges a box as background, this value will be very low to prevent the student model from mislearning.

4. Experimental Results

The experiments were conducted using Python 3.7 and PyTorch 1.8.1 on a server equipped with an NVIDIA GTX 3060 GPU, an Intel E5-2630F processor, and 16 GB of RAM. The network was trained for a total of 200 epochs with a batch size of 4, and all input images were resized to 640 × 640 pixels. The learning rate in this paper is set as follows: the initial learning rate is 0.001, and the cosine annealing strategy is adopted, which gradually reduces the learning rate according to a cosine function as the number of training epochs increases. The proposed method has been already deployed on our UAV platform and applied in actual grid inspection in a certain place of South China.

4.1. Dataset Introduction

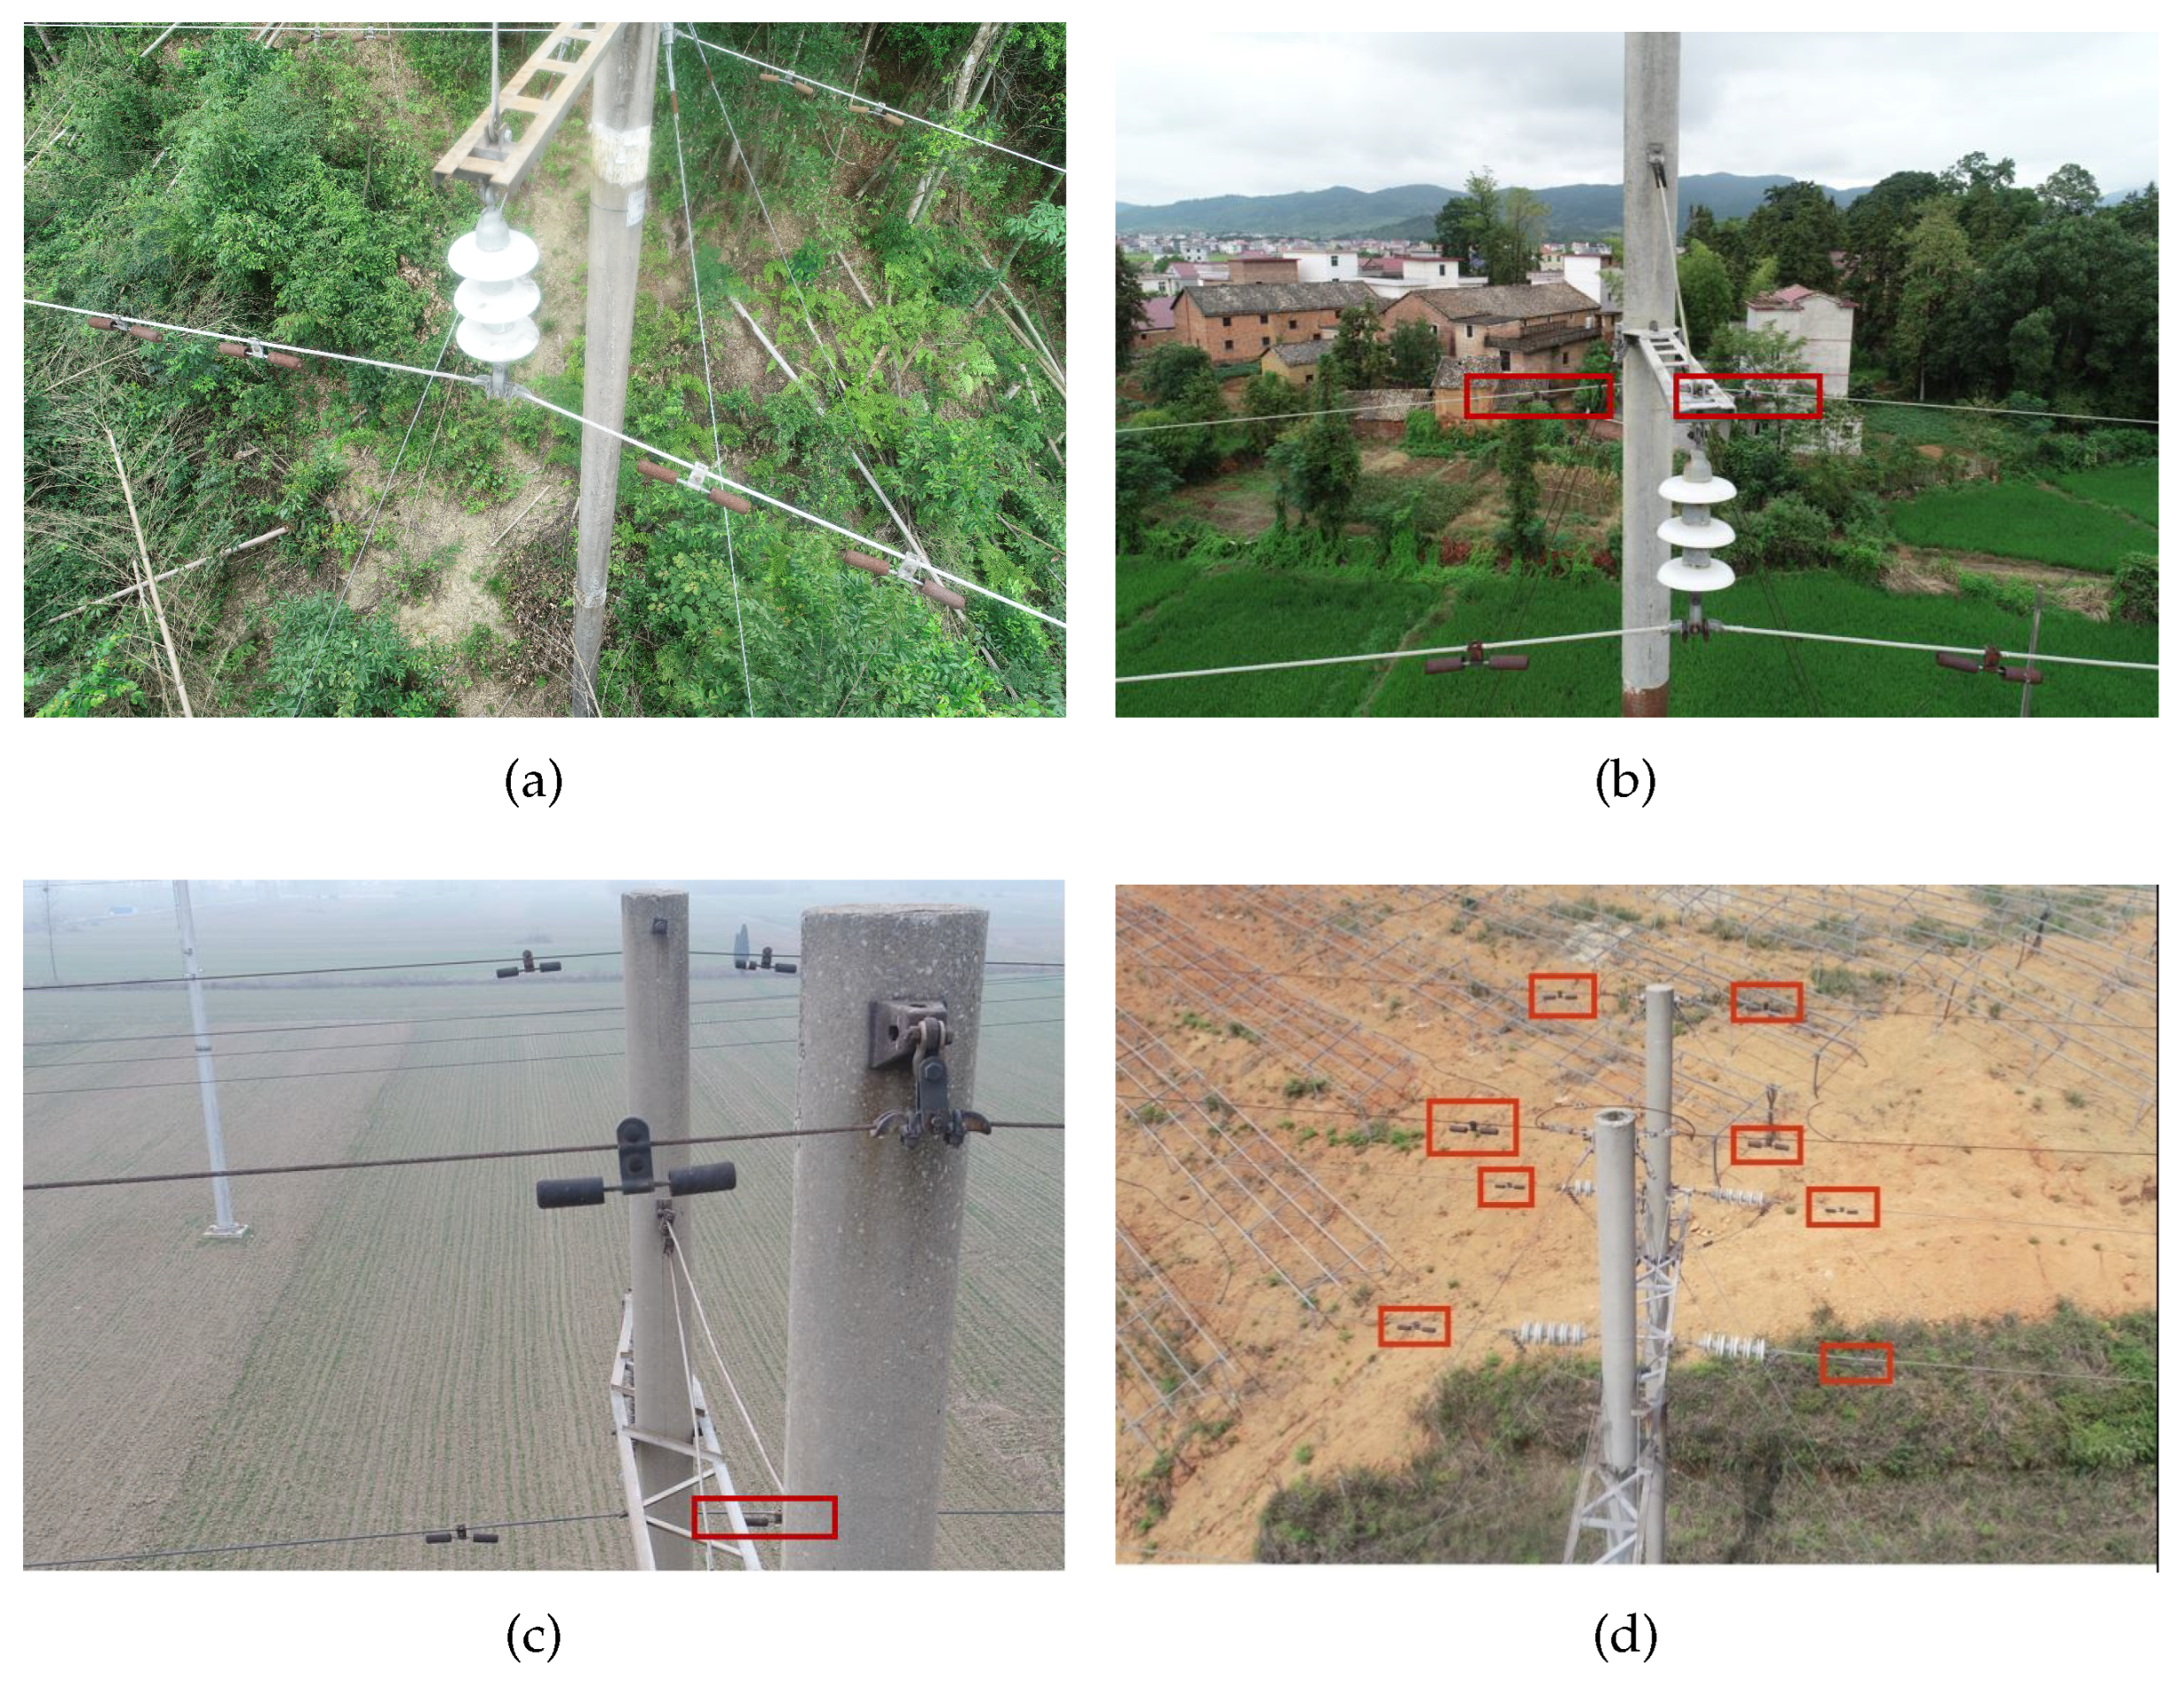
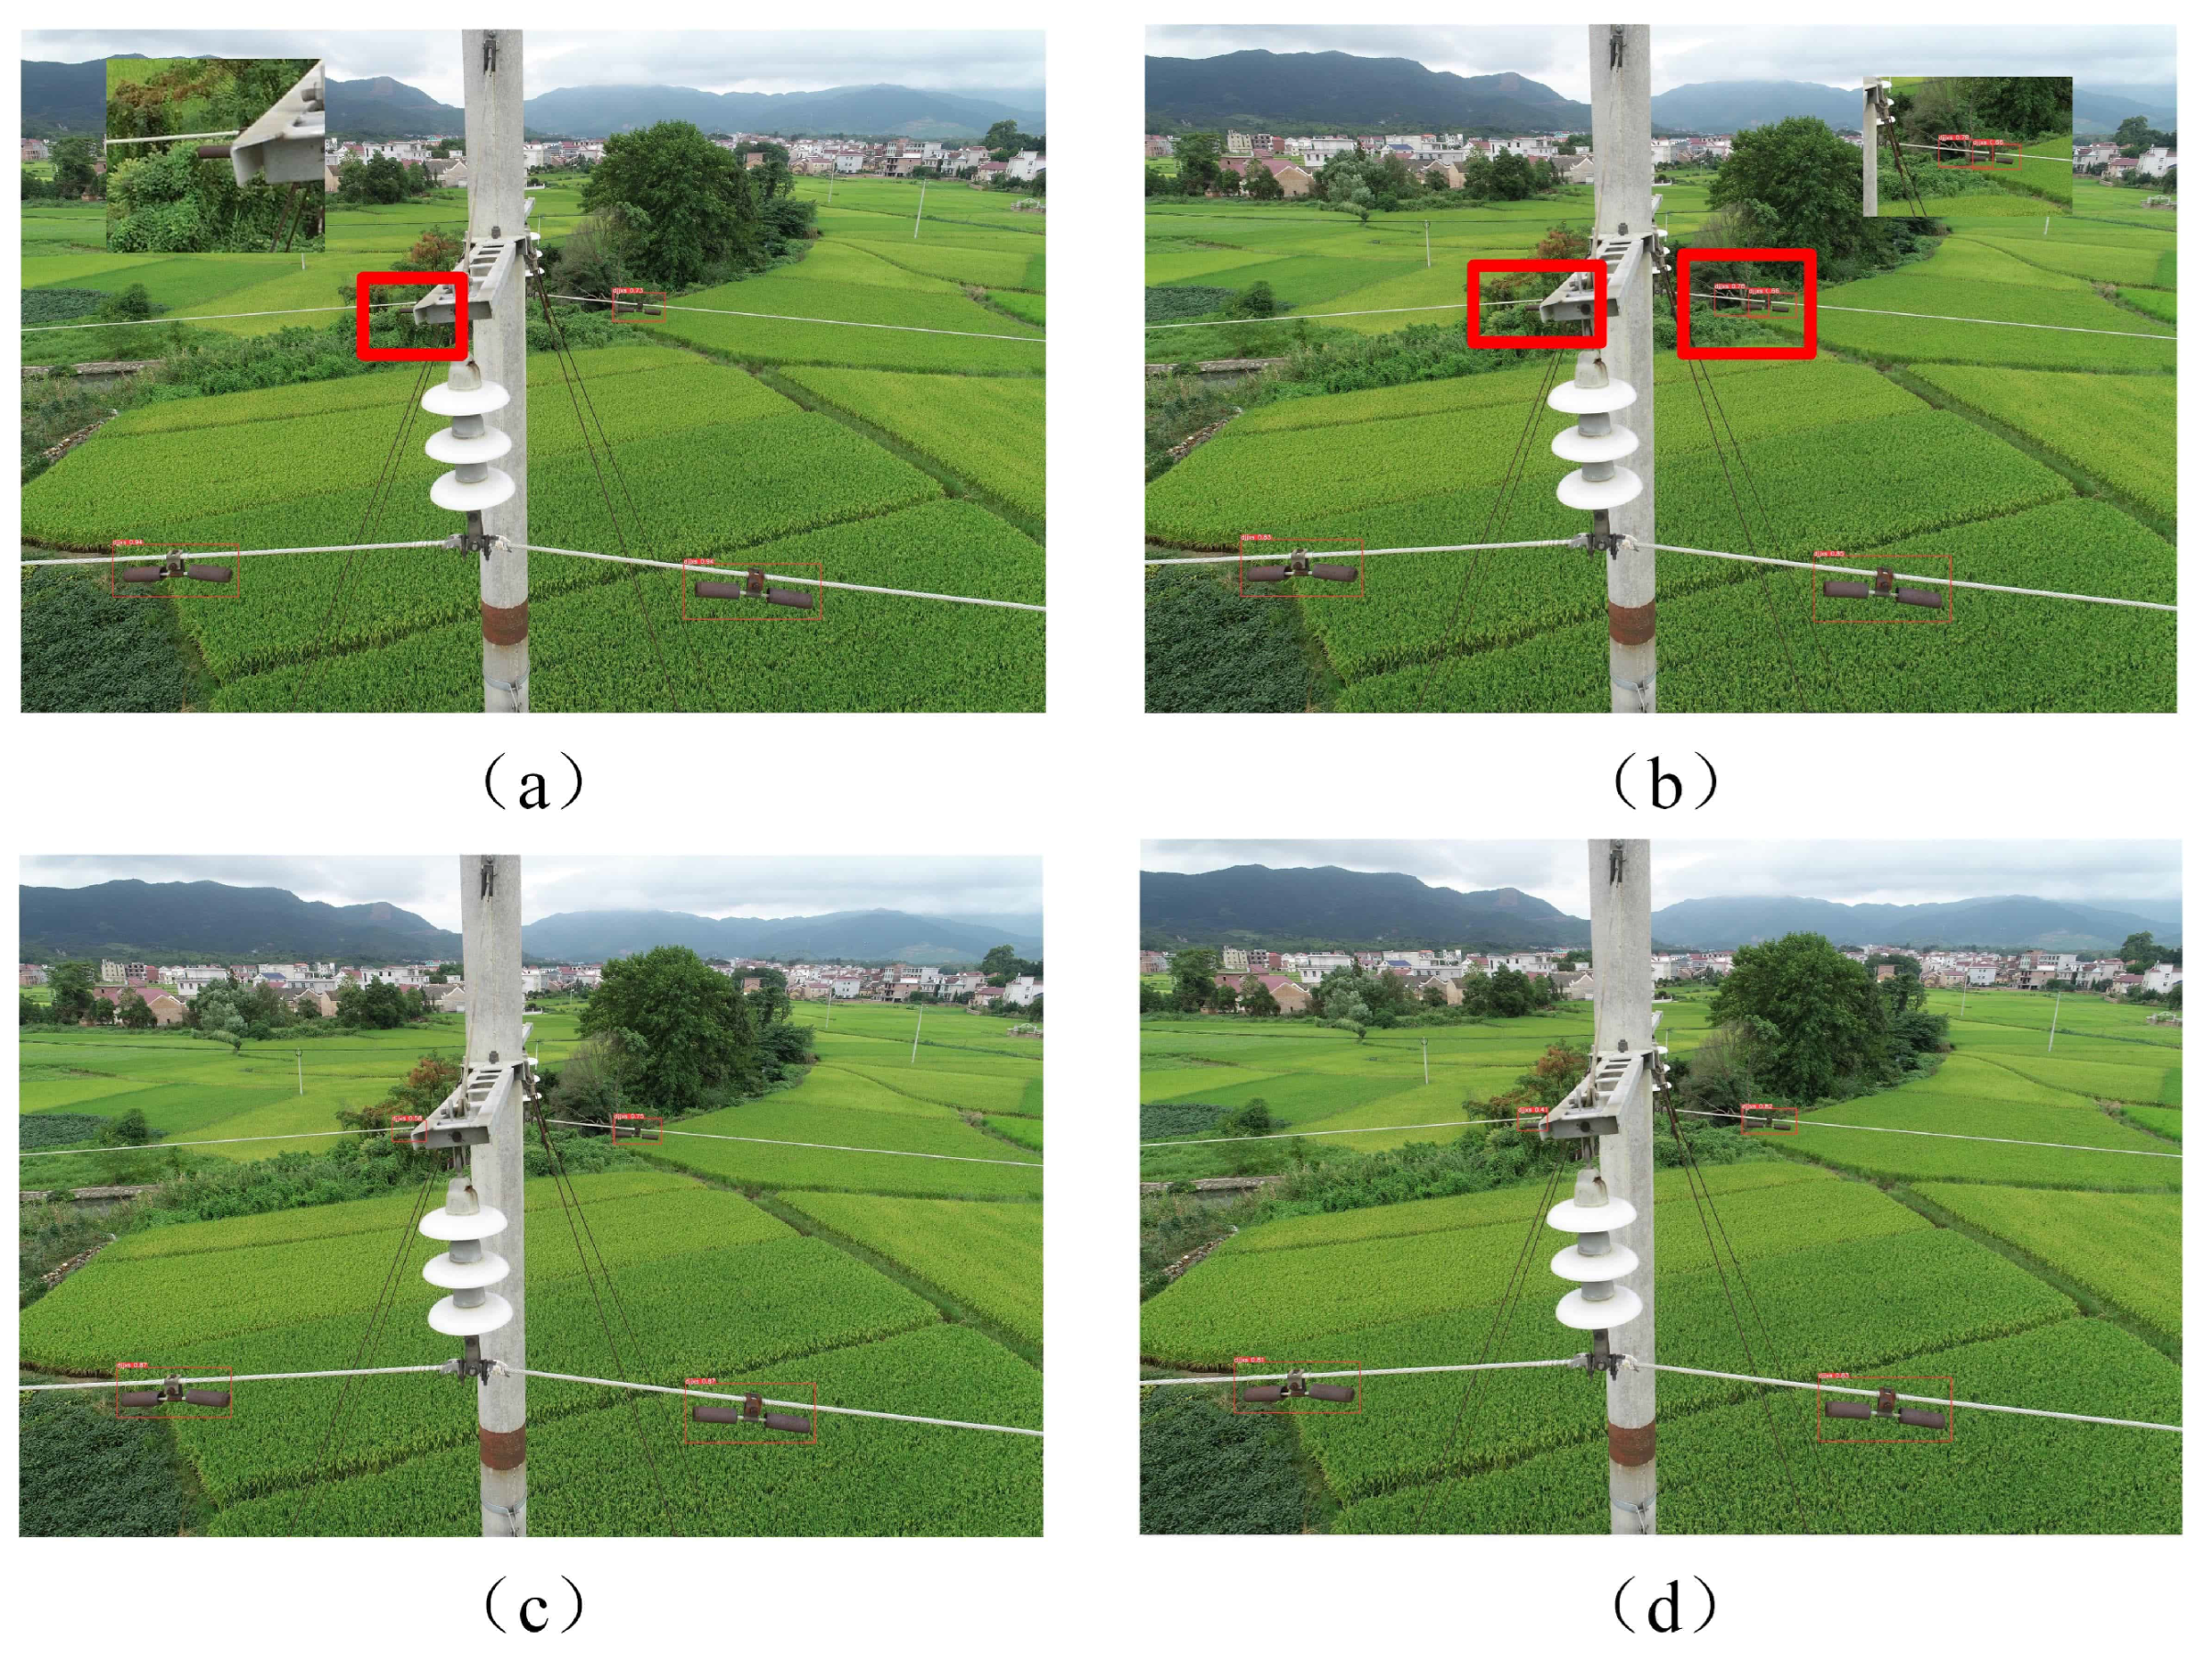
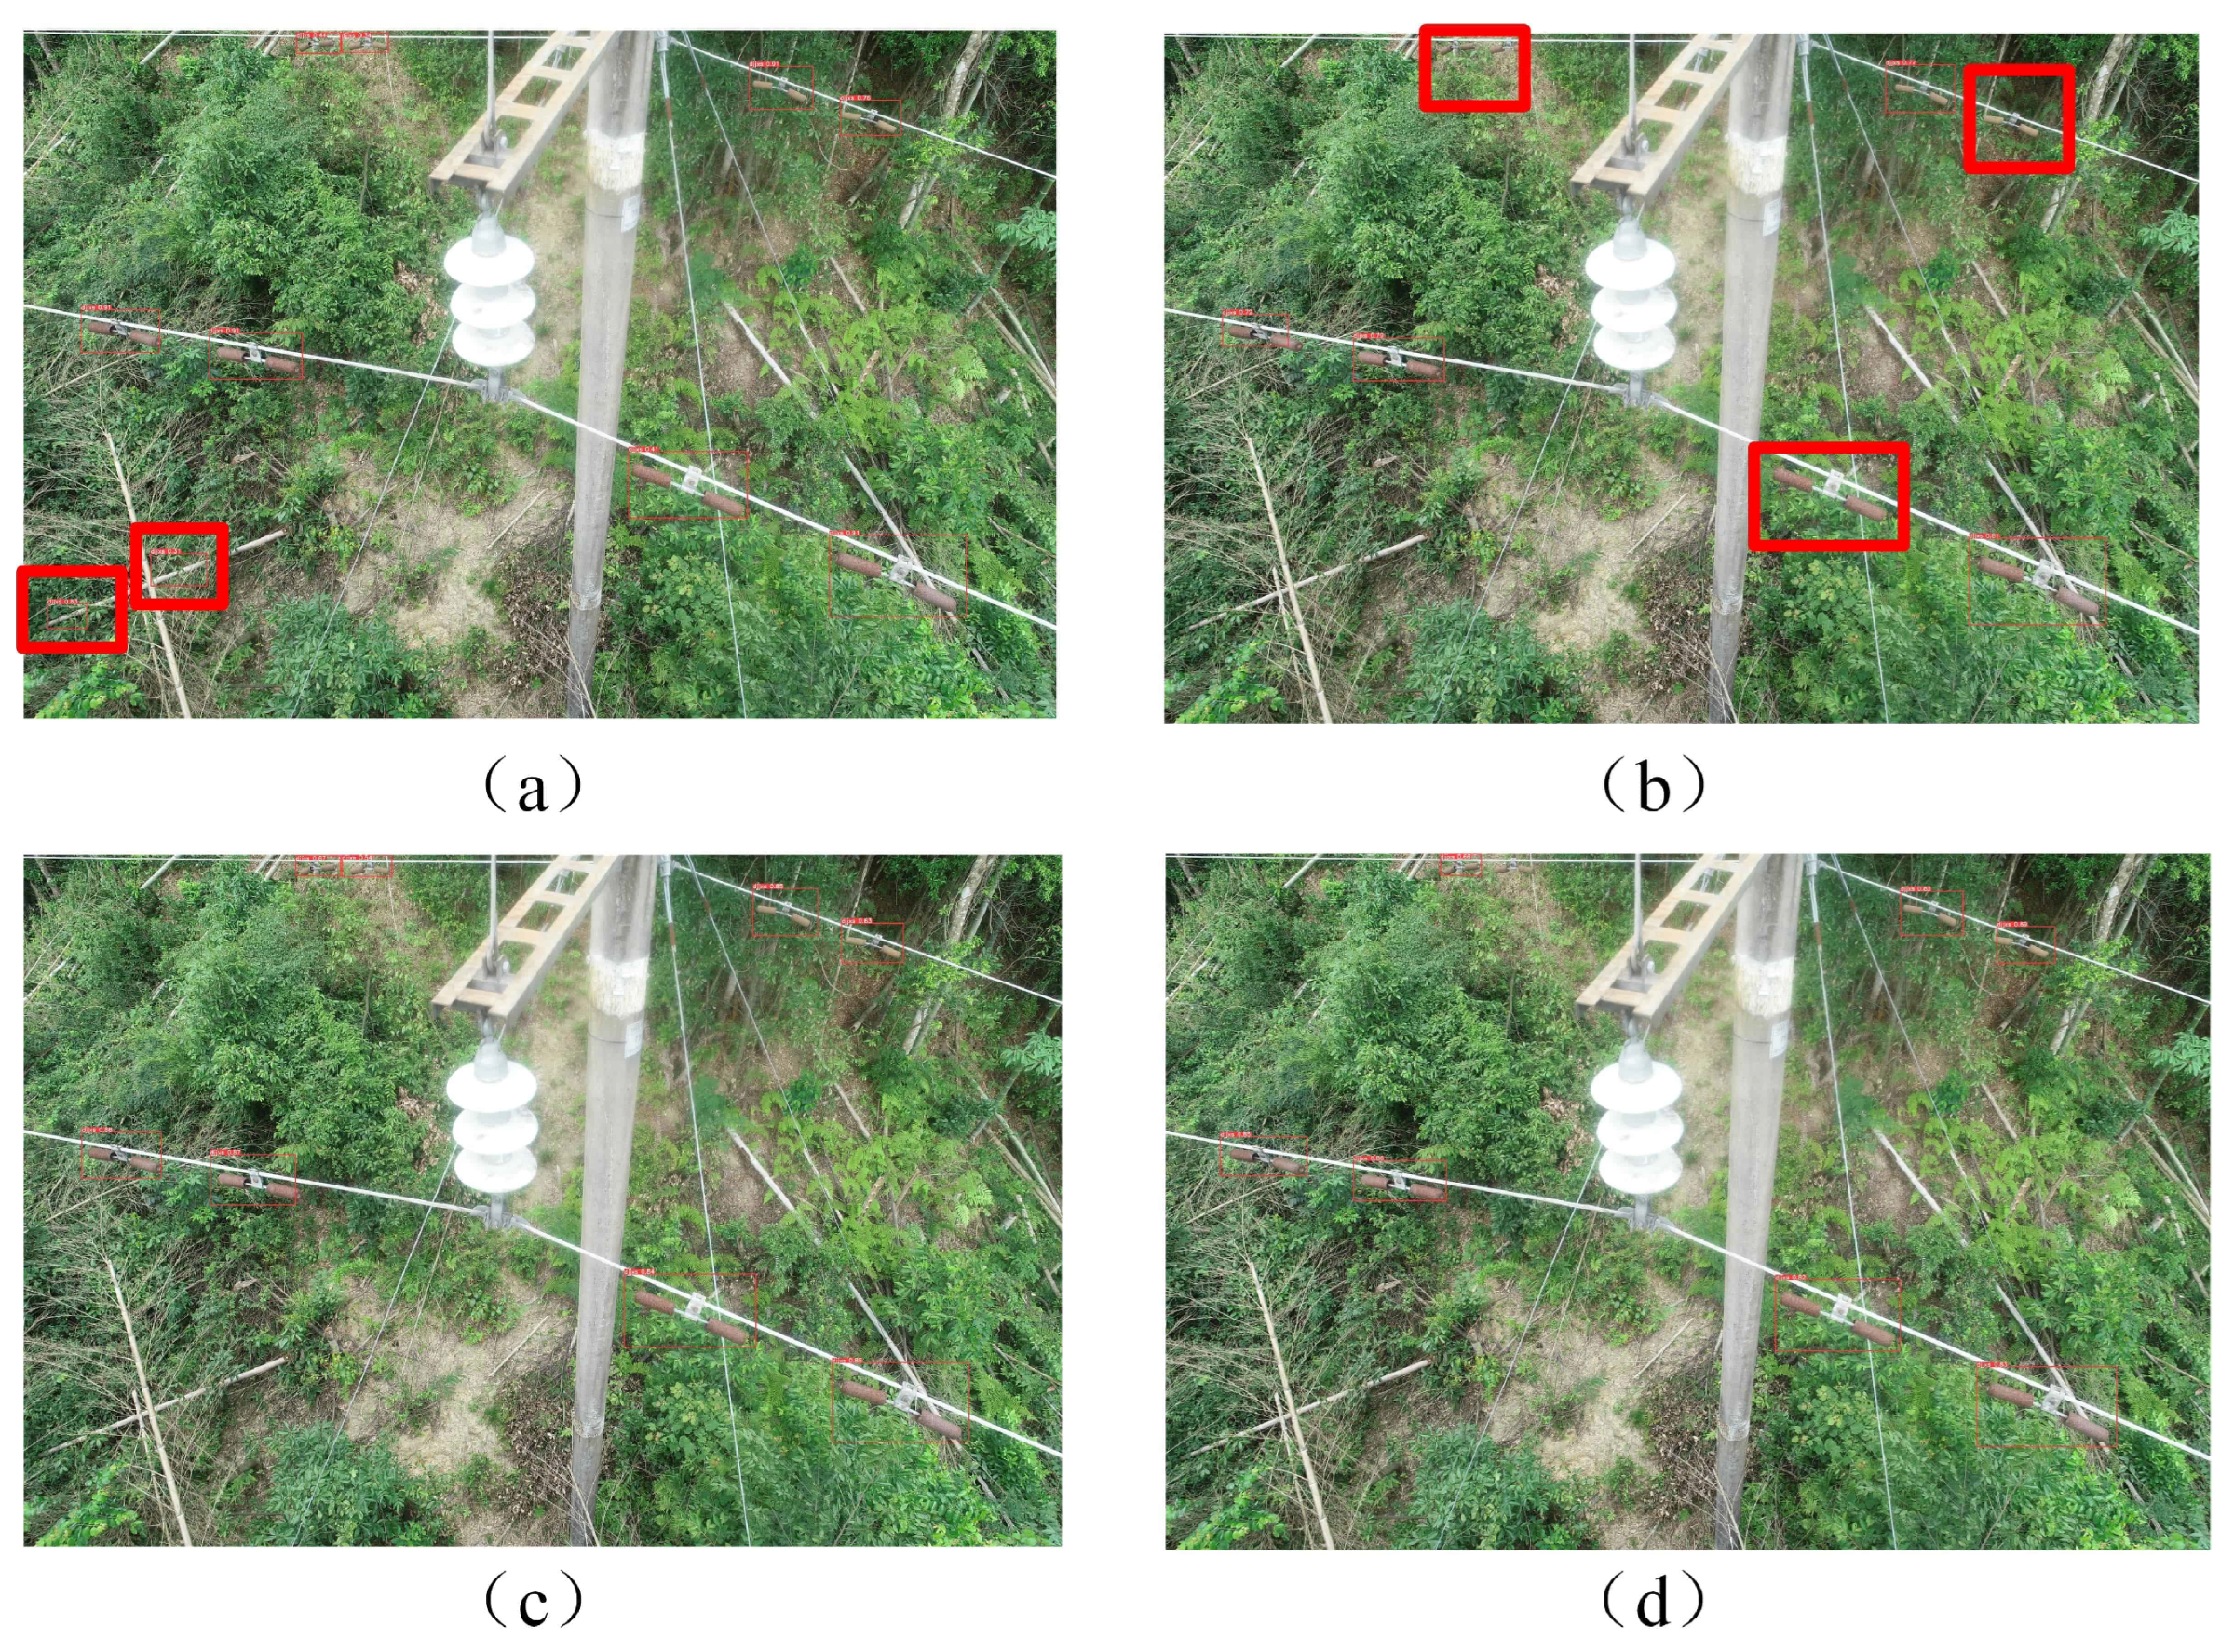
The data used in this paper are the images of transmission line faults taken by UAV in the south China. Taking the example of corroded fittings on transmission lines, as shown in Figure 9, the UAV inspection process faces the following challenges: (1) Due to factors like direct sunlight and weather conditions, the collected images of the objects may be blurry, as illustrated in Figure 9a. (2) Transmission lines in outdoor environments introduce complexities in the background of the images, leading to various interferences and obstructions on the target objects, such as trees, buildings, and iron frames, as depicted in Figure 9b,c. As a result, the structure of the corroded fittings is incomplete. (3) Inconsistencies in the UAV’s inspection distance and angles cause variations in the sizes of the target objects in the images, resulting in numerous small target objects, as shown in Figure 9d. Due to these challenges, the detection results suffer from serious false detection and missed detection.

4.2. Dataset Processing

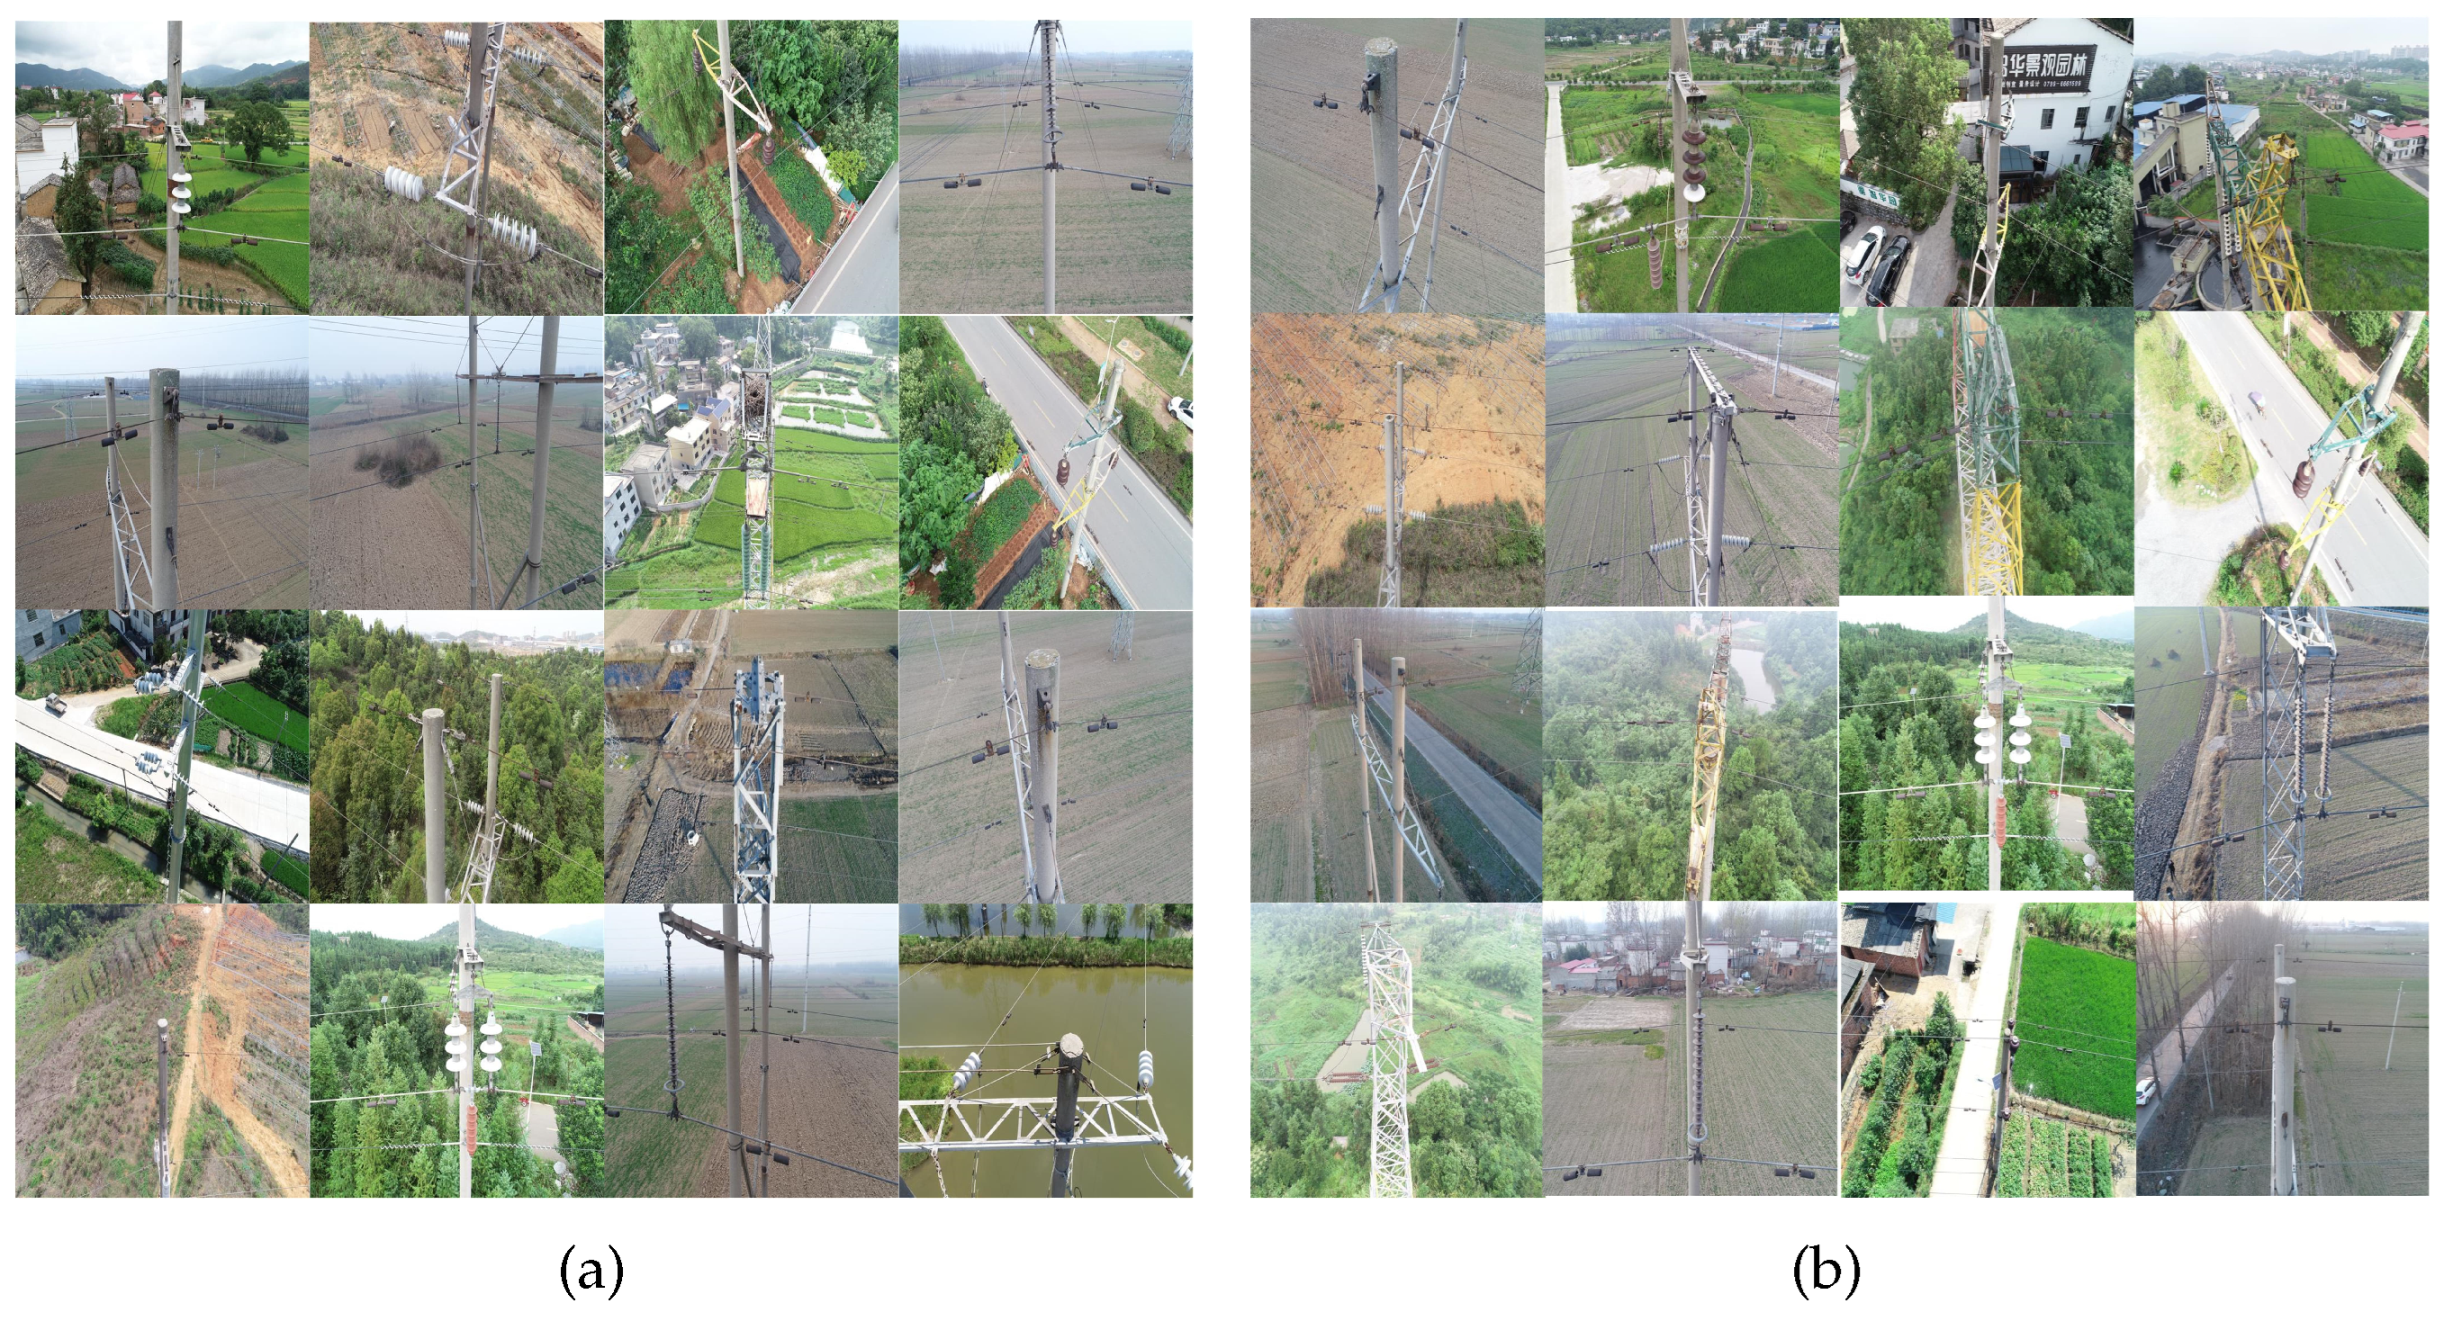
In this experiment, a total of 350 images of corroded fittings were collected to create a UAV inspection dataset. Data augmentation techniques are employed to increase its quantity and enhance its diversity. Various operations are randomly employed to simulate the potential issues that could arise during the process of capturing images using UAV, such as brightness adjustments, adding noise, translation, rotation, mirroring, and introducing occlusions. The effect with data augmentation is shown in Figure 10.
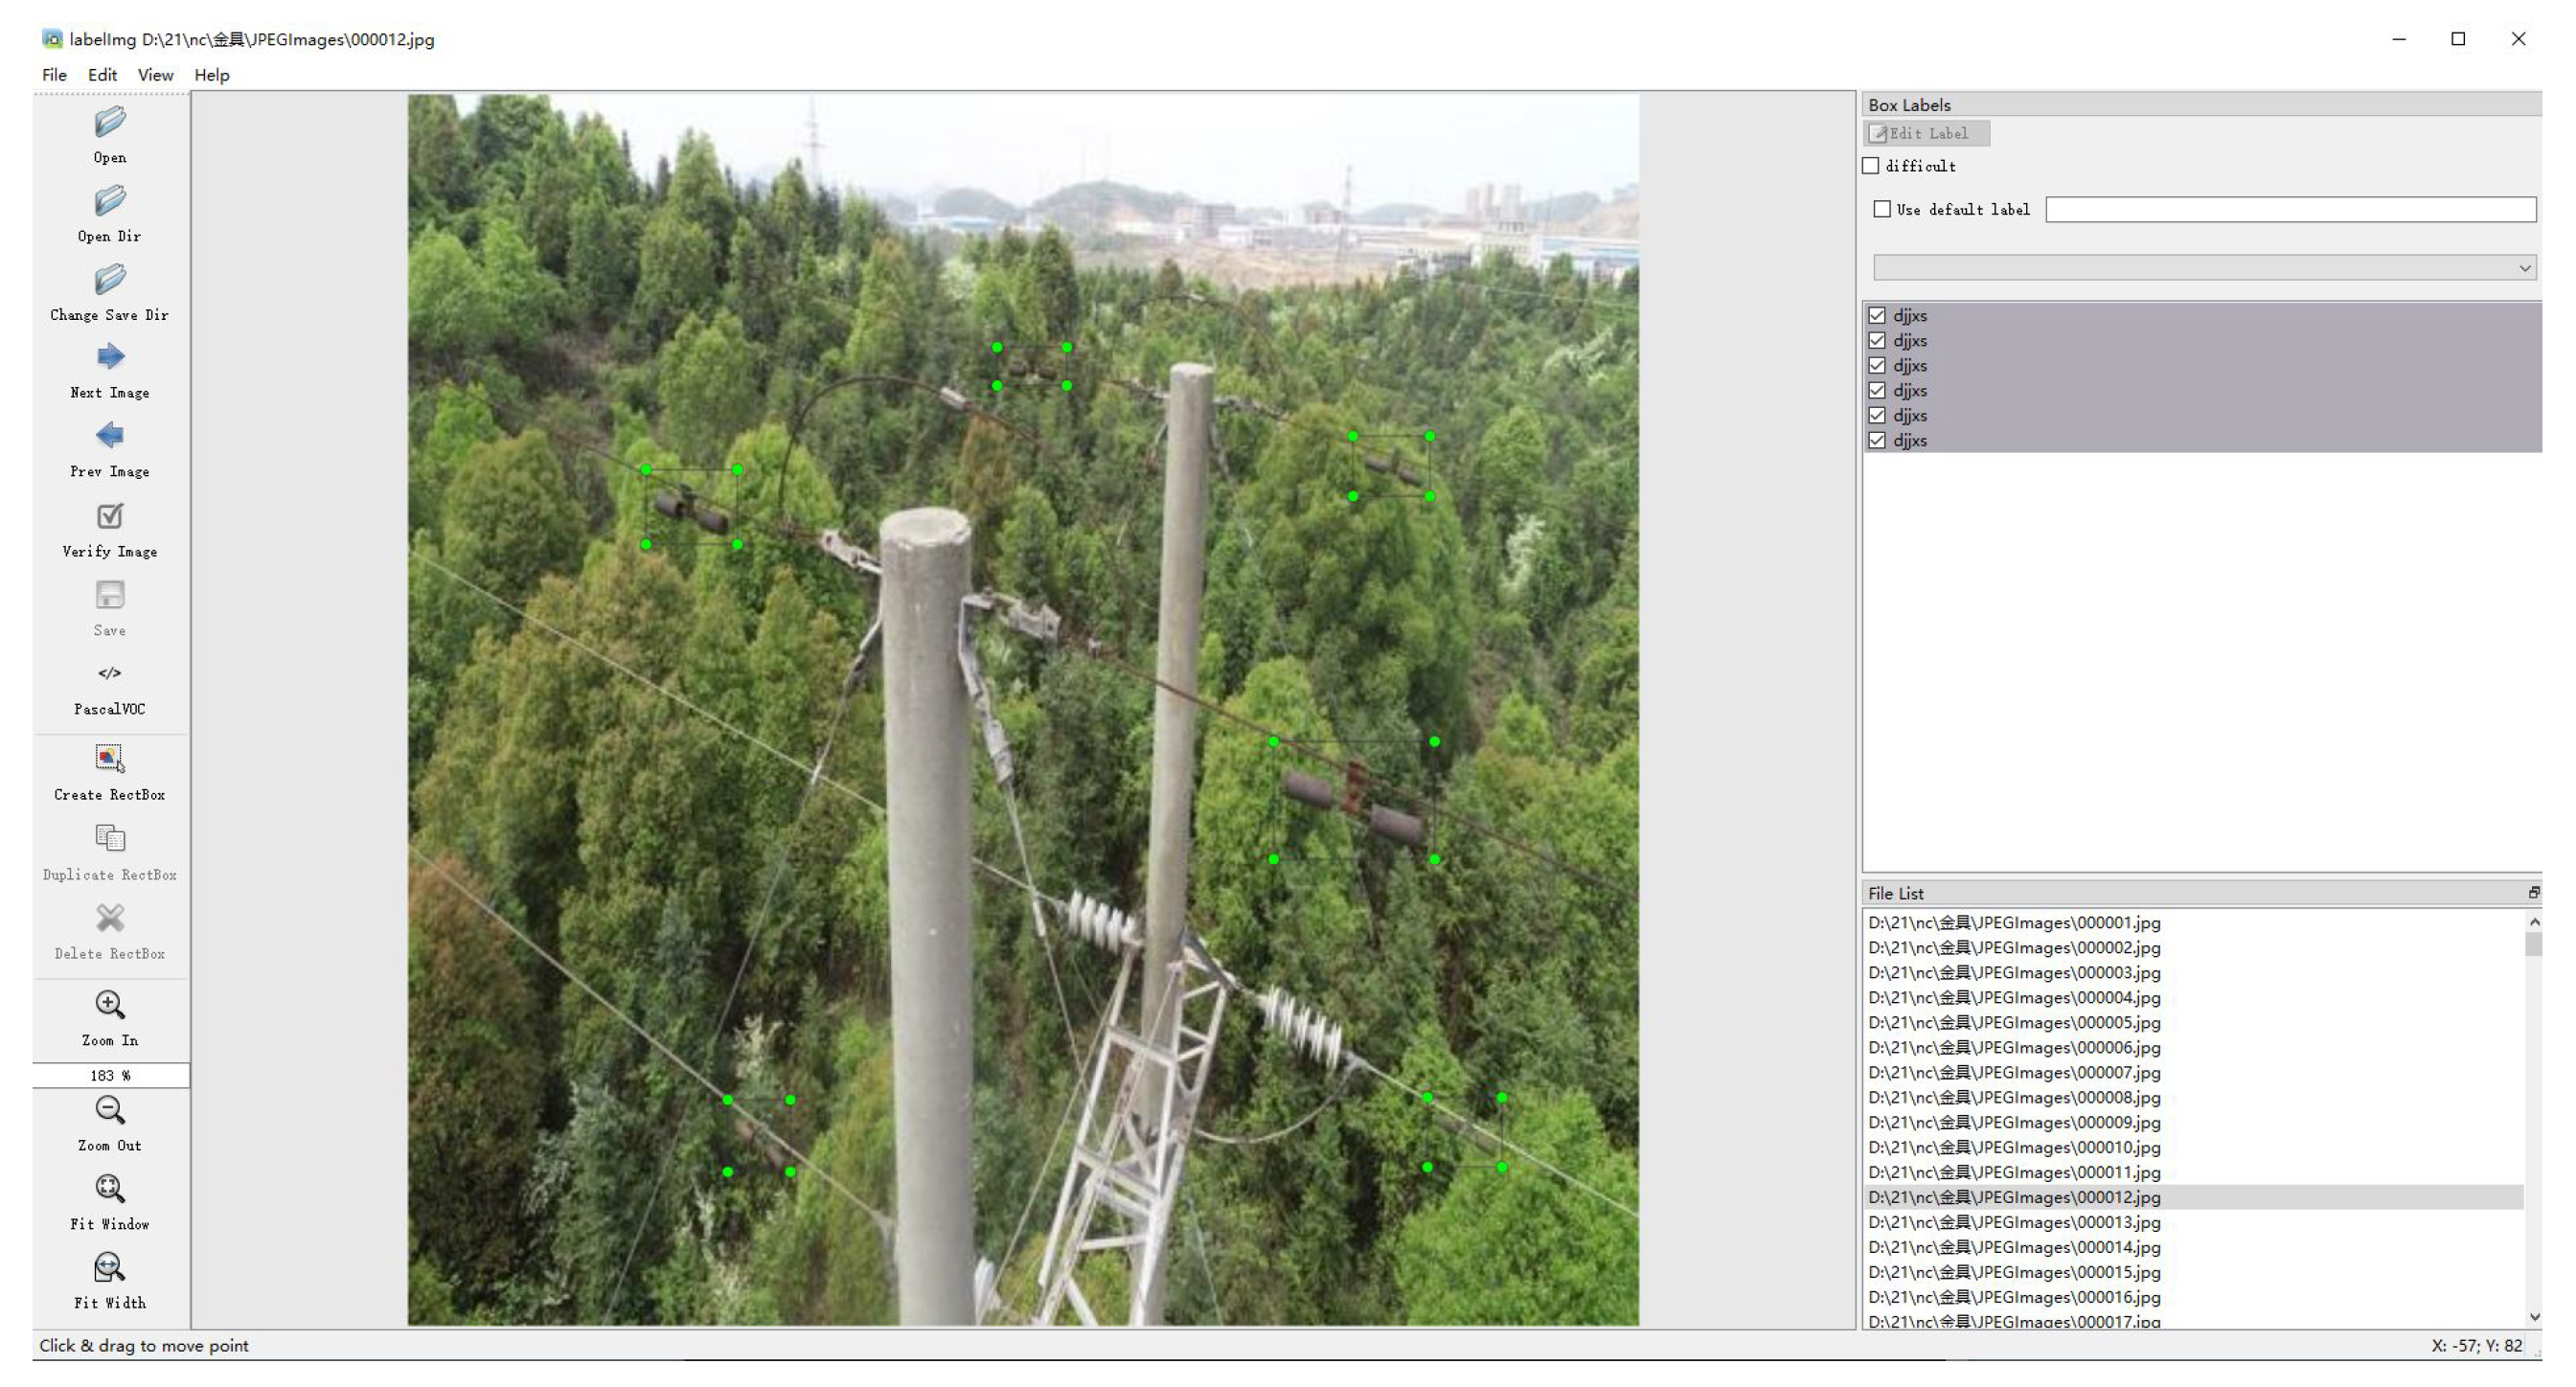
It should be noted that regarding the guarantee of the quality of the presented data, we mainly ensure the accuracy of annotation through two core methods: professional experience-assisted positioning and small-sample fine annotation. First, we used knowledge from power line maintenance experts to guide target localization. Before labeling, experienced engineers helped estimate the expected size and visible area of hardware in images—based on real-world dimensions, drone camera parameters, and typical shooting distances. Second, with only 350 original images, we were able to perform careful, manual labeling. Engineers and algorithm developers worked together. All 350 images were cross-checked for quality before any data augmentation, ensuring high-quality training data. The dataset is expanded to 3500 images through data augmentation. Then it is divided into a training set, validation set, and testing set according to the ratio of 8:1:1. The training set consists of 2800 images, the testing set has 350 images, and the validation set has 350 images. To train the image object detection model based on deep learning, the image data is labeled using LabelImg, as depicted in Figure 11. The labels are saved in XML format and contained information about the classification and position of the target objects. Finally, the dataset is converted to the VOC dataset format for training.

4.3. Evaluation Criteria

The performance of an image object detection model can be evaluated using Precision, Recall, and average precision (AP), as follows. Moreover, by obtaining the Recall and Precision at different confidence thresholds, a precision-recall curve (P-R curve) can be generated, with Recall on the x-axis and Precision on the y-axis. The area under the curve represents the average precision value.
P r e c i s i o n = T P T P + F P
R e c a l l = T P T P + F N
A P = 0 1 p ( r ) d r

4.4. Experimental Results of the Teacher Model

4.4.1. Ablation Experiment

To verify the effectiveness of each module of the teacher model constructed in this paper, an ablation experiment is conducted to provide validation. We design experiments to introduce DenseNet and SPSA mechanism into the YOLOv5 respectively. The experimental results are shown in Table 2 and Figure 12. For the parameter selection of DenseNet, the growth rate was set to 32, a choice that balances the capture of fine-grained corrosion features and computational efficiency; the convolution kernel size uniformly adopted 3 × 3, which is optimal for extracting local structural features of corroded fittings while preserving spatial resolution, avoiding the blurred local feature representation caused by larger 5 × 5 kernels and the insufficient structural information capture from smaller 1 × 1 kernels. For SPSA, the neighborhood range around the central pixel was set to 3 × 3, as this window effectively captures the adjacent pixel correlations that define rust’s texture.SPSA is specifically designed for detecting small, corroded fittings in UAV images and differs from standard attention in three key ways: (1) It focuses on a 3 × 3 local neighborhood instead of global context, capturing fine-grained corrosion textures often missed by standard attention; (2) It dynamically weights neighbors by spatial distance, better preserving structural integrity in fragmented or occluded rust areas; (3) It is highly efficient—using a local window and 1 × 1 projection, it adds only 3% parameters, reduces computational complexity. Given that multi-head self-attention incurs O(n2) complexity with sequence length n, which is impractical for edge devices, we believe that a direct comparison is unnecessary.
Through experimental results, it is found that both DenseNet and SPSA mechanism can improve the average accuracy of fitting detection, while the average accuracy value is higher than that of classical YOLOv5, increasing by 1.26% and 2.29% respectively. Through dense connections, DenseNet fully transfers the fine-grained texture features of the corroded hardware from shallow layers to deep layers, providing a discriminative feature foundation for SPSA to focus on. Furthermore, SPSA, through local attention filtering, can accurately locate key areas of small, occluded hardware from the rich features transferred by DenseNet, filtering out background noise such as trees and lines. The two achieve synergy, from complete feature preservation to effective area focus. Our teacher model gets the highest average accuracy improvement, which is 3.79% higher than classical YOLOv5. By adding DenseNet in the feature extraction stage, the detection model fuses more feature information to obtain richer semantic and detailed information. In the feature fusion stage, SPSA is added to enhance the utilization of its own structured feature information and to improve the feature extraction capability as well. Thus, the detection model can obtain more detailed texture and structural feature information of the target object, which is helpful to improve the detection performance. Meanwhile, it can enhance the robustness of the detection model. The effectiveness of the teacher model in enhancing feature extraction in the process of image object detection is verified.

4.4.2. Visualized Results

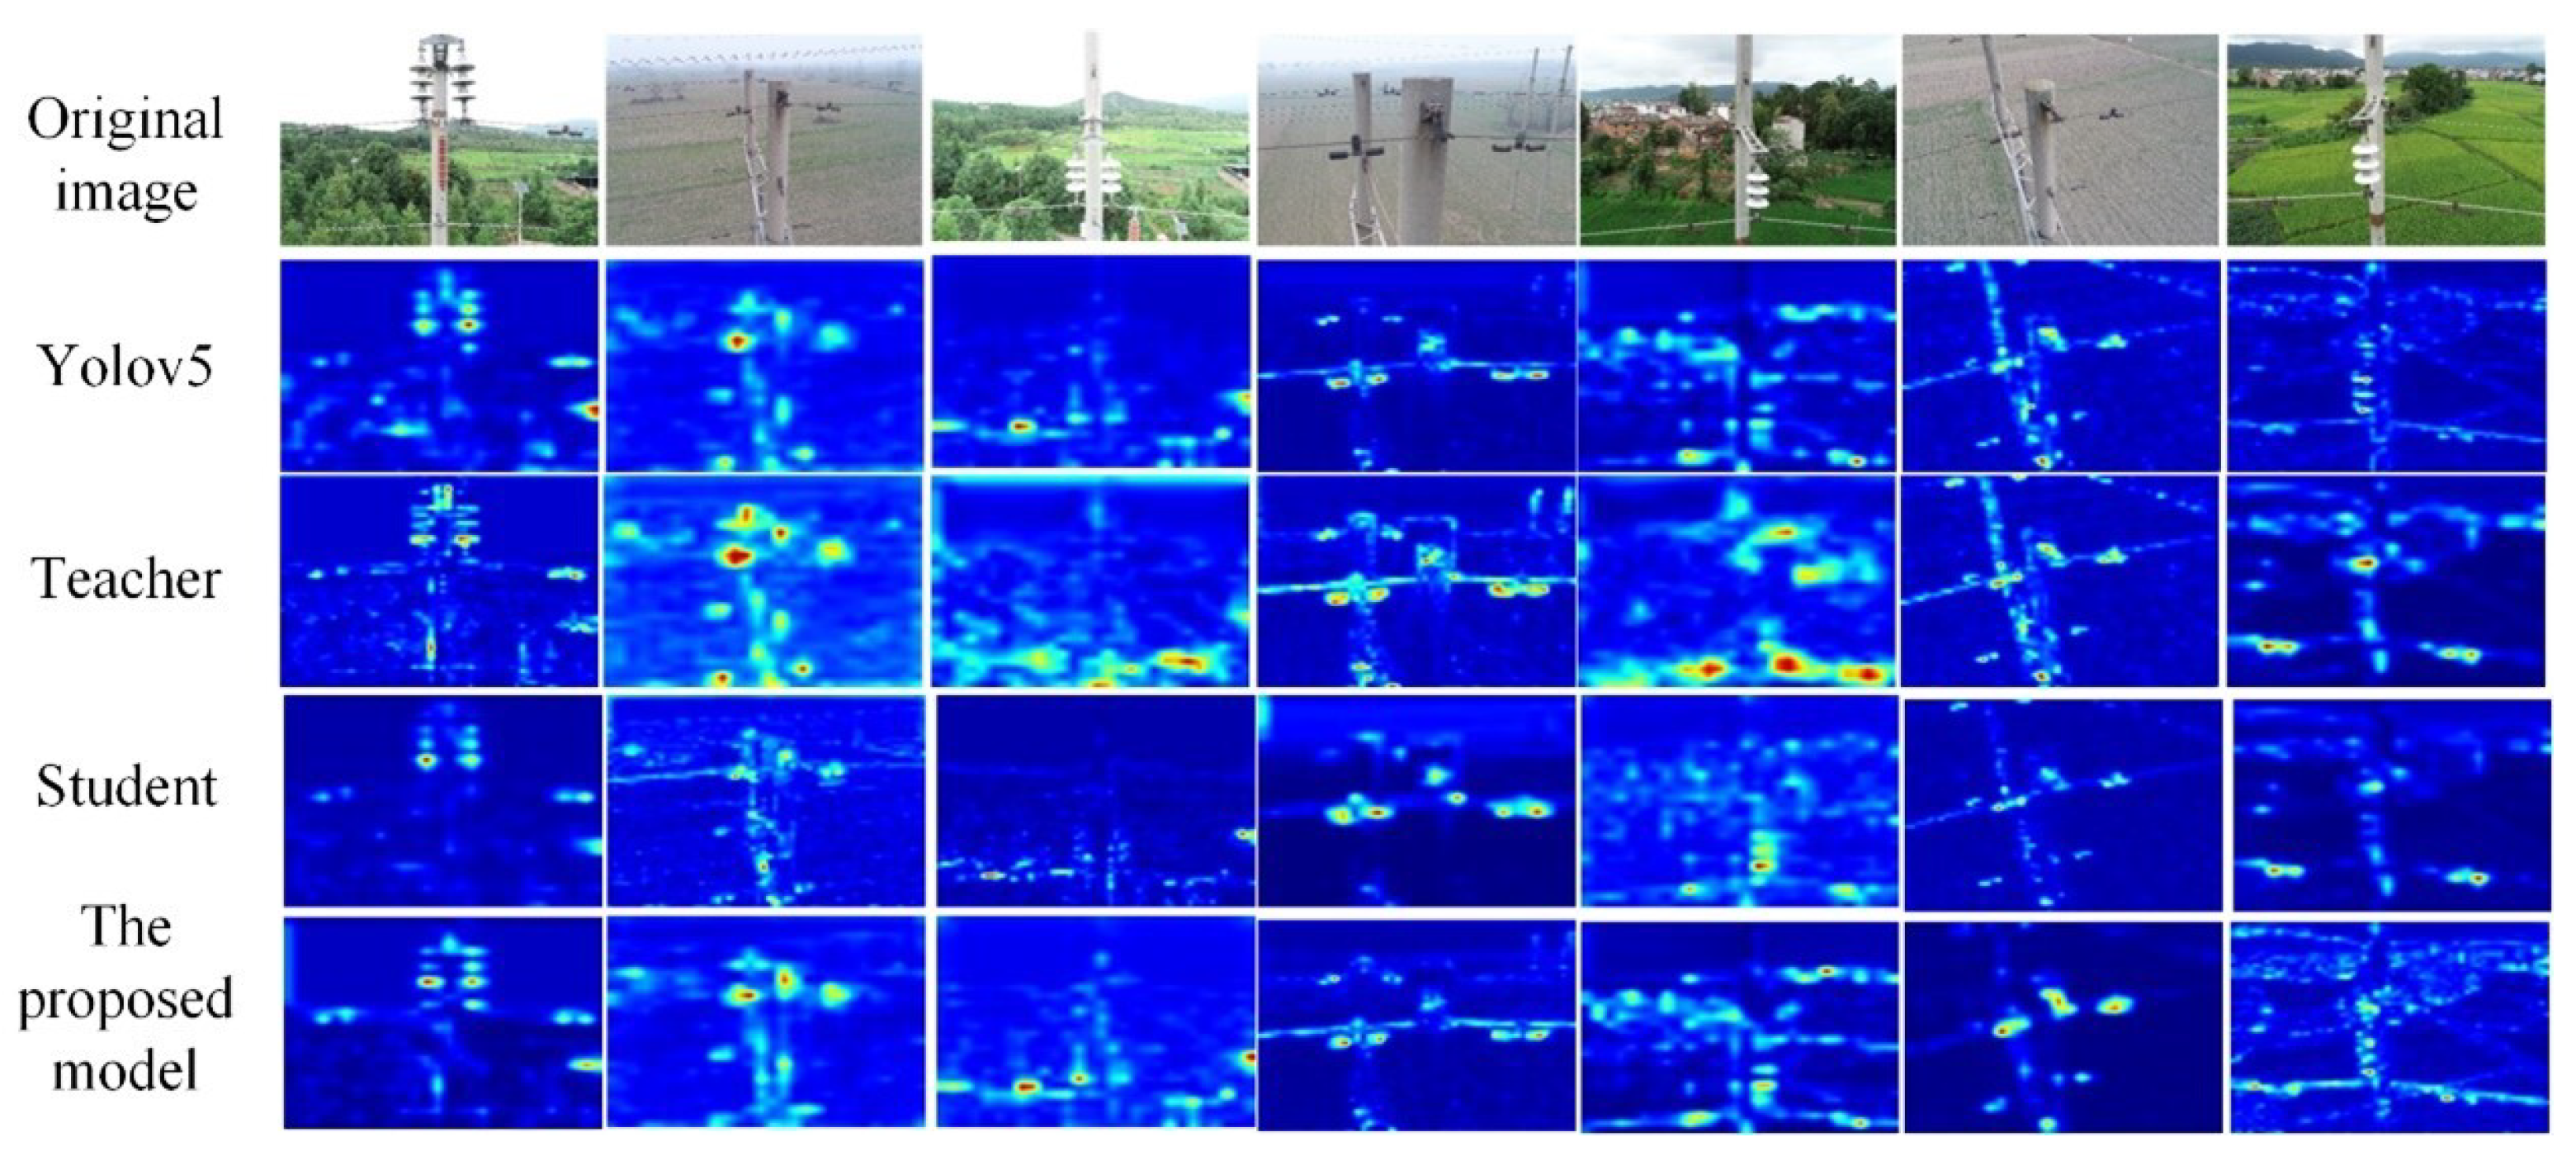
In order to visually validate the effectiveness of the proposed teacher model, a comparative analysis is conducted by visualizing the intermediate feature maps and heatmaps of both YOLOv5 and the teacher model. Figure 13 and Figure 14 present the SPSA feature maps comparison and heatmaps comparison respectively. In YOLOv5, the heatmap is a visual representation of the model’s probability distribution for object locations and categories. It generates the probability of object existence and category for each grid point through multi-scale SPSA feature maps, where peak points correspond to object centers. Combined with predefined anchor boxes and post-processing algorithms, it can quickly locate and filter redundant candidate boxes, enabling efficient object detection. By analyzing the results of visualized intermediate SPSA feature maps, it can be intuitively observed that the teacher model constructed in our paper exhibits more prominent features of the target objects, with a clear distinction from the background. It also possesses stronger semantic details and structured feature information. The experiment results validate that the teacher model (constructed in this study) can effectively integrate low-level and high-level feature information, enhancing feature representation and improving semantic detail features and structured feature information. This integration reduces the interference from complex background environments, thereby improving the robustness and accuracy of the image object detection model. From the heatmap experiment results, it can be intuitively found that the teacher model in our paper pays more attention to the target object, and also pays attention to more information near the target object, which strengthens the utilization of the structural feature information. This also proves that the teacher model can enhance the feature extraction ability of the image object detection model, and be concerned about the information that is conducive to the detection of the target object, which can make full use of information, reduce the influence of complex background environment and occlusion interference, thereby improve the accuracy and robustness of image object detection model.
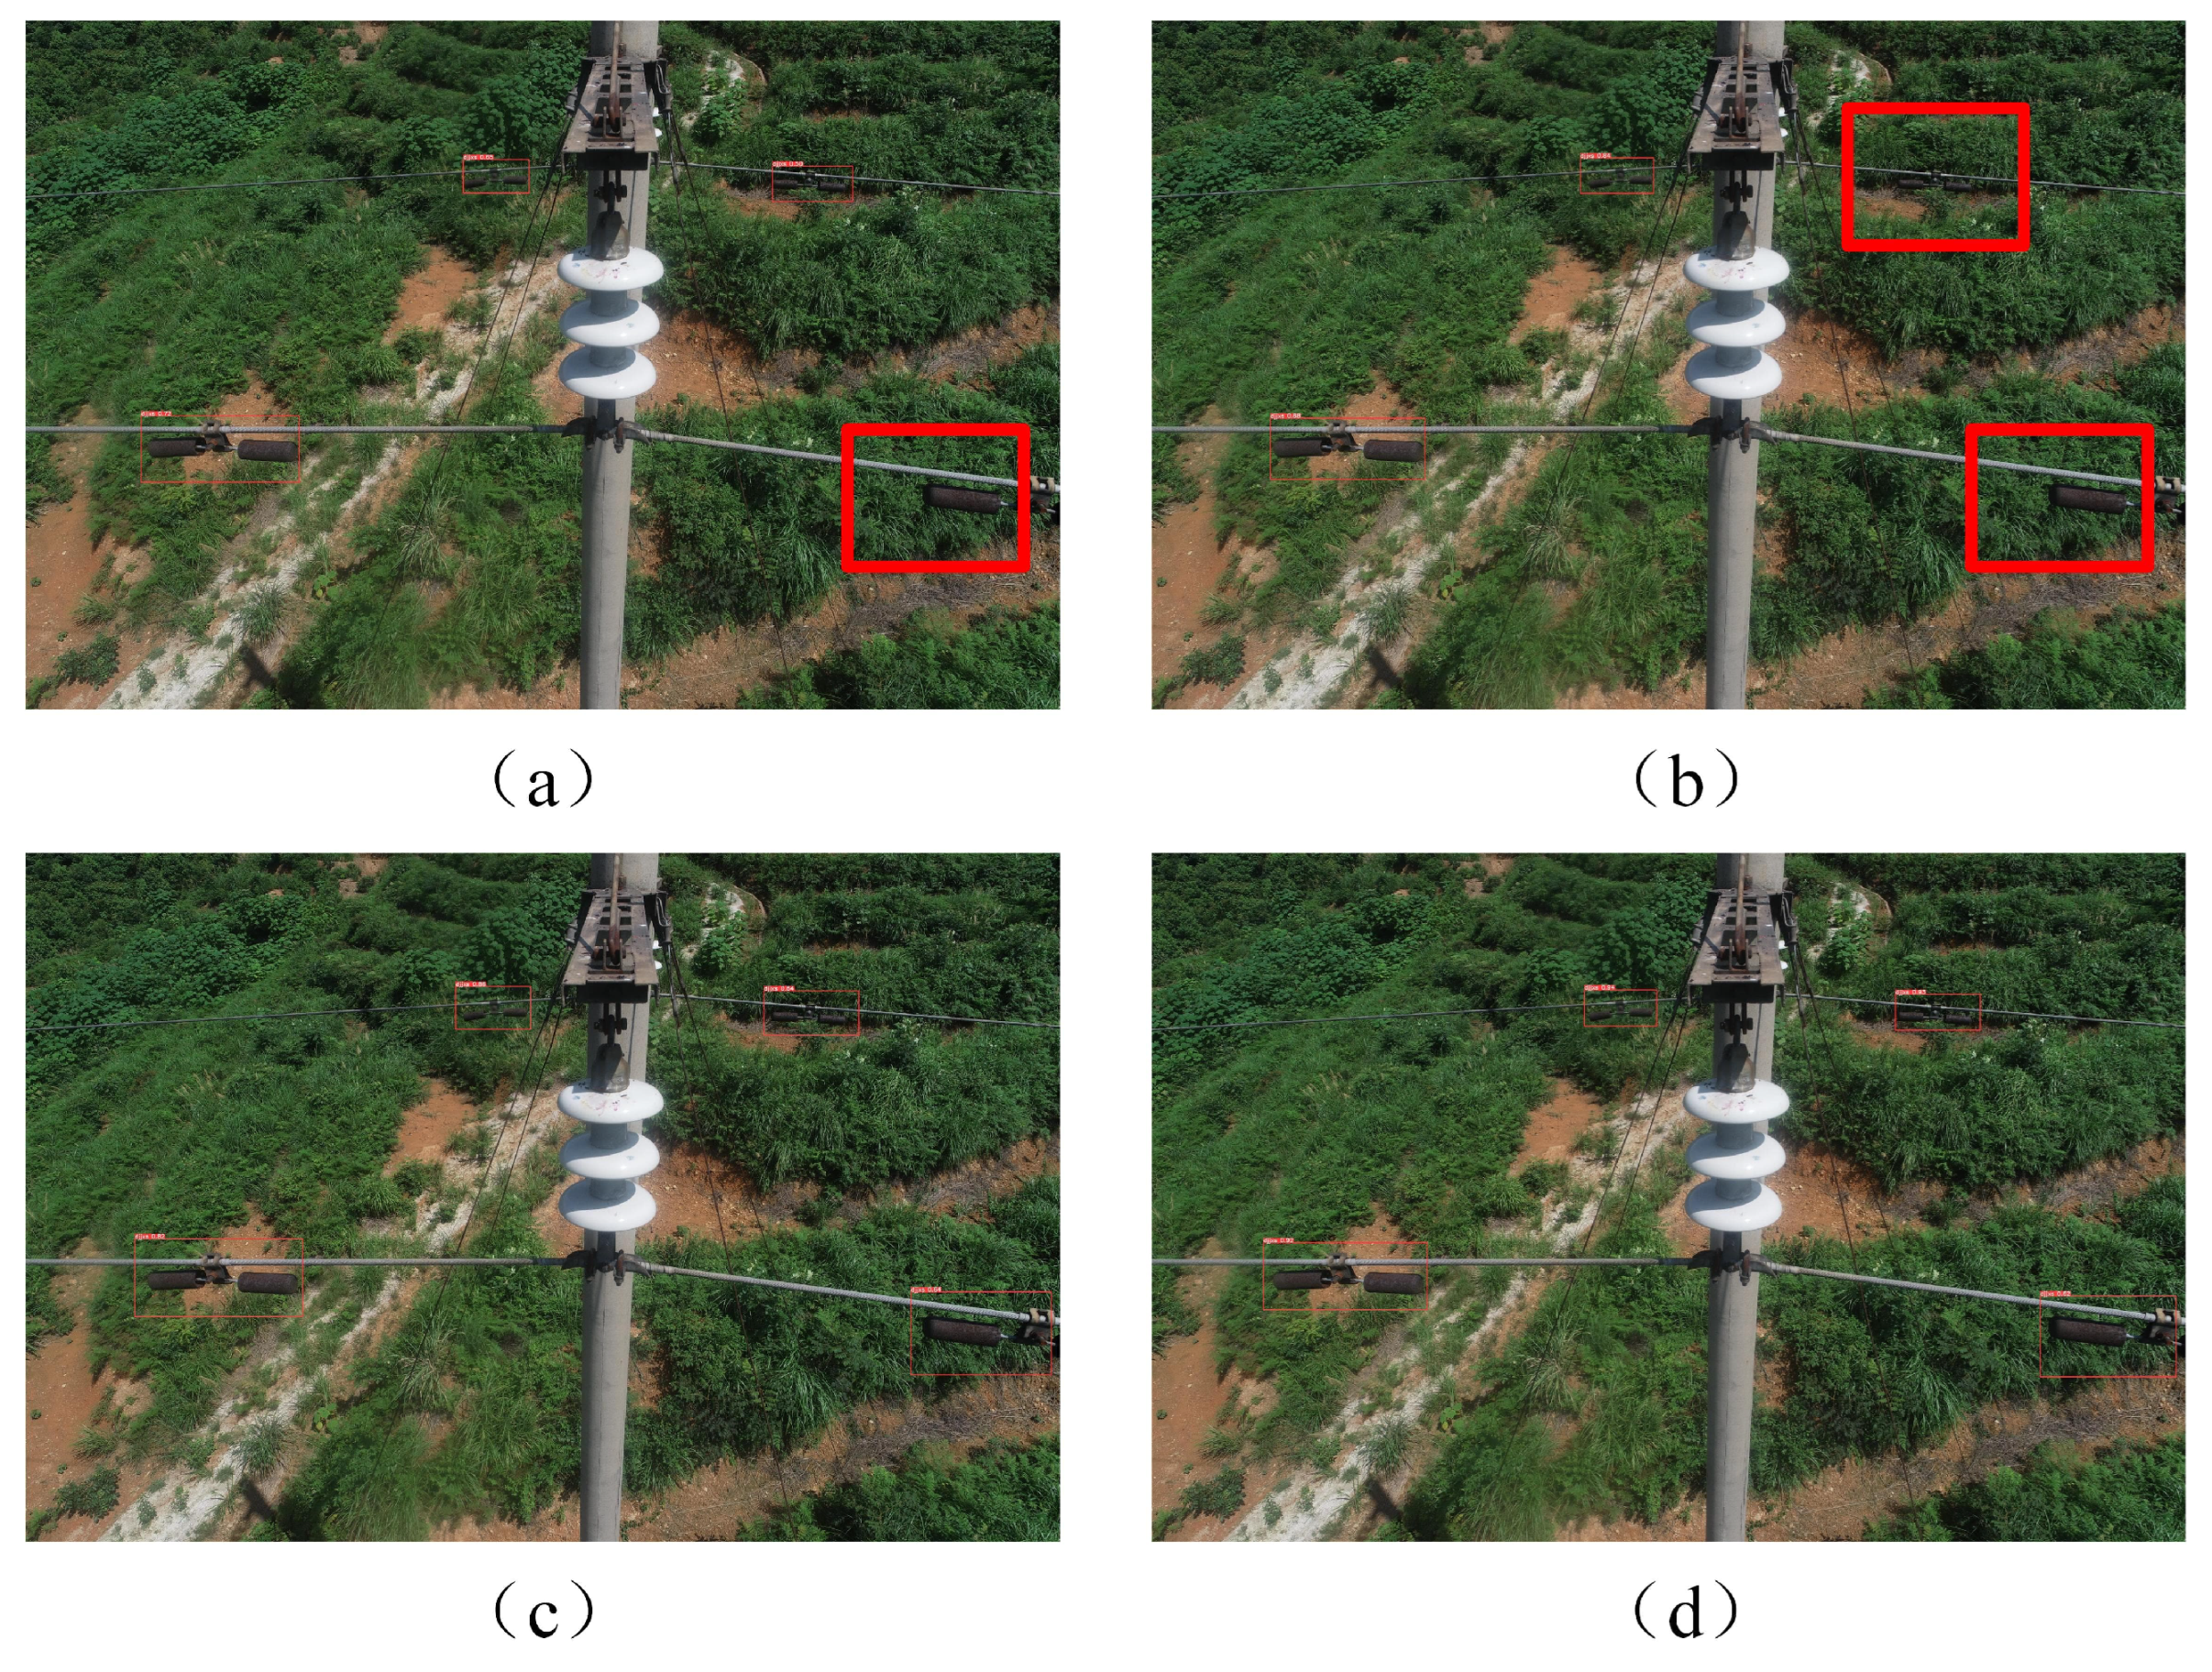
By using the YOLOv5 image object detection model and the teacher model constructed in this article, the transmission line fitting images monitored by UAV were detected, and the detection results are shown in Figure 15. The results can indicate that when the background environment in the detected image is complex, the target object is indistinguishable from the background due to its similar color. The YOLOv5 image object detection results exhibited issues of missed detections, as shown in Figure 15a. The teacher model, however, addressed the problem of missed detections in the detection results, as shown in Figure 15b. Additionally, when the detected images contained objects with similar structures to the target object, making correct discrimination difficult, the YOLOv5 image object detection results exhibited false detections, as shown in Figure 15c. The teacher model solves the problem of false detections in the detection results, as shown in Figure 15d. Furthermore, in cases where the detected image suffered from occlusions due to the image capture angle of UAV, resulting in incomplete target object structures, the YOLOv5 image object detection results show missed detections, as illustrated in Figure 15e. The teacher model solves the issue of missed detections caused by occlusions, as shown in Figure 15f. This suggests that the teacher model constructed in our paper can effectively address the issues of false detections, missed detections, and occlusions in the YOLOv5 detection results. The teacher model is capable of extracting rich semantic and structural feature information, enhancing the utilization of feature information, reducing false detections and missed detections in image object detection results, and improving the robustness and accuracy of image object detection models.

4.4.3. Comparative Experiments

We introduce the classical image object detection models for comparison, to demonstrate the effectiveness of the teacher model. The dataset in this paper is used to conduct experiments on classical image object detection models, such as two-stage image object detection model Faster R-CNN and one-stage models SSD, YOLOv3, YOLOv4, YOLOv5, YOLOv8n, EfficientDet [33], YOLOv11 [16] and PP-YOLO [19]. The experimental results are presented in Table 3 and Figure 16. The experimental results show that the SSD image object detection model has poor experimental results in the dataset. It can be attributed to the presence of numerous small defective objects in the dataset. Different feature layers of the SSD image object detection model are responsible for detecting target objects of different sizes, while the detection of smaller defective objects being reliant on lower-level features maps. The cluttered lower-level features in this dataset make the objects less prominent and introduce significant interference. Consequently, the average precision of the SSD image object detection model is the lowest. On the dataset used in this paper, Faster R-CNN, YOLOv3, and YOLOv4 have similar average precision values. The teacher model constructed in our paper demonstrates a significantly higher average precision value compared to other models, reaching a maximum of 95.82%. Its recall rate also outperforms other classical image object detection models. The precision of the teacher model is only slightly lower than that of the two-stage image object detection model, Faster R-CNN, with a difference of 0.54%. By comparing with classical models, the effectiveness of the proposed method in this chapter is further validated, as it enhances the accuracy and robustness of the image object detection models. Although the general-purpose detection methods, such as YOLOv8n and EfficientDet, mainly focus on improving accuracy and efficiency across diverse object categories, they are not specifically designed for such challenging and specialized scenarios in this study, meaning that the target objects, i.e., rusted metal fittings, have unclear structures. The objects are often incomplete or missing parts. The size also varies significantly, with many small targets present. When these general models are directly applied to our task without any modifications, their performance measured in terms of precision and recall was naturally lower than our method. The proposed method achieves higher accuracy because it employs non-maximum suppression based on IoU to filter candidate boxes. This approach effectively suppresses redundant detection boxes while retaining more accurately localized true target boxes, thereby improving the overall detection performance.

4.5. Experimental Results of Knowledge Distillation

4.5.1. Comparative Experiments

To validate the effectiveness of the proposed teacher model for distillation training of the student model, we conducted distillation experiments with different distillation temperature values, using the same dataset and experimental setup. The experimental results are presented in Table 4, where an additional evaluation metric of detection time is included. We set six distillation temperature gradients ranging from 10 to 60 °C, maintaining all other experimental conditions identical, including the dataset, training rounds, and optimizer. We systematically tested the core performance metrics of the student model at different temperatures. The results are as follows: When T 40 °C, the model AP gradually increases with increasing temperature. This is because moderately increasing the temperature allows the teacher model to convey richer soft label information, helping the student model better learn the subtle features of corroded metal fittings. However, when T > 40 °C, the AP begins to decline significantly. This is because excessively high temperatures dilute the effective feature signal, making it difficult for the student model to distinguish between metal fittings and background noise, and even leading to the problem of overfitting the soft labels.
By analyzing the experiment results, it can be observed that as the distillation temperature value increases, the average precision also increases. However, when the temperature value exceeds 40, the average precision starts to decrease as the temperature increases. The trend indicates that the positive impact of the teacher model on training the student model. However, when the distillation temperature value exceeds a certain threshold, it diminishes the effectiveness of the teacher model. Our analysis suggests that this is because the student model, being smaller in size, is unable to fully capture all the knowledge imparted by the teacher model. Therefore, it is essential to set an appropriate distillation temperature value to enhance the efficacy of knowledge distillation.
Basic IoU methods rely solely on target overlap, which can easily misclassify overlapping adjacent hardware as the same target in occluded scenarios, resulting in low recall and precision. GIoU and DIoU, while incorporating minimum bounding box enclosed area and center point distance optimization, respectively, fail to fully account for the loss of target edge information caused by occlusion: GIoU’s focus on enclosing area ignores fine-grained shape differences, and DIoU’s center distance term cannot distinguish between occluded and non-occluded targets with similar center positions but distorted shapes. This limits their adaptability to densely occluded scenarios. DIoU-NMS improves performance by optimizing the overlapping box filtering logic, but still struggles to accurately distinguish target boundaries in occluded areas due to the lack of explicit shape constraints.
Considering the common object occlusion problem in corrosion hardware inspection scenarios, the EIoU-NMS proposed in this paper addresses these limitations through its dual-term optimization. To further clarify its mechanism in handling occlusions, the formula is:
EIoU - NMS = IoU λ 1 · ( x p x g ) 2 + ( y p y g ) 2 D λ 2 · w p w g h p h g
where IoU represents the intersection over union of the predicted box ( B p ) and ground truth ( B g ), the second term quantifies the normalized center distance between B p and B g , and the third term measures the aspect ratio mismatch between the two boxes. λ 1 and λ 2 are weight coefficients to balance the contributions of positional and shape features. The center distance term ensures that even partially occluded targets whose centers may deviate slightly from ground truth are not prematurely suppressed. Meanwhile, the aspect ratio term effectively captures the residual edge information of hardware under occlusion, for example, when a bolt head is partially occluded, its remaining visible edges preserve the intrinsic aspect ratio, which EIoU-NMS leverages to distinguish it from adjacent nuts. This enables accurate definition of the target’s actual range, reducing misjudgment and missed detection caused by occlusion.
To further verify the performance of the proposed EIoU-NMS in the corroded fitting detection task, we additionally supplemented it with mainstream IoU series methods such as IoU, GIoU, DIoU, and DIoU-NMS. All experiments were conducted based on the same lightweight model framework and test set environment. The core evaluation metric was the AP value. The specific comparison results are shown in Table 5.
Considering the common object occlusion problem in corrosion hardware inspection scenarios, the data in Table 5 clearly demonstrates the performance advantages of our proposed EIoU-NMS. Basic IoU methods rely solely on target overlap, which can easily misclassify overlapping adjacent hardware as the same target in occluded scenarios, resulting in low recall and precision. GIoU and DIoU, while incorporating minimum bounding box enclosed area and center point distance optimization, respectively, fail to fully account for the loss of target edge information caused by occlusion, limiting their adaptability to densely occluded scenarios. DIoU-NMS improves performance by optimizing the overlapping box filtering logic, but still struggles to accurately distinguish target boundaries in occluded areas. The EIoU-NMS proposed in this paper incorporates edge distance features into its design, which can effectively capture the residual edge information of hardware under occlusion, accurately define the actual range of the target, and reduce the problems of misjudgment and missed detection caused by occlusion. Therefore, it significantly outperforms other IoU series methods in the three core indicators of Recall 90.08%, Precision 89.38%, and AP 95.82%, making it more suitable for the occlusion scenarios required in corrosion hardware detection.
The distillation loss weight λ D is used to balance detection loss and distillation loss in Equations (11)–(13). To verify the impact of the distillation loss weight λ D on model performance, we fixed the distillation temperature at 40 °C to 0.2, 0.4, 0.6, 0.8, 1.0, 1.2, and 1.4 respectively, and then evaluated the model’s Recall, Precision, and AP on the same test set. The experimental results are shown in Table 6.
The experimental results show that when λ D < 1.0 , as λ D increases, the model Recall, Precision and AP all gradually improve. The reason is that when the distillation loss weight is insufficient, the student model cannot fully absorb the guidance knowledge of the teacher model, resulting in limited performance. When λ D = 1.0 , the three indicators of the model reach the best. At this time, the detection loss and distillation loss achieve the optimal balance, which not only avoids the insufficient performance caused by too weak distillation knowledge, but also prevents the excessive distillation knowledge from interfering with the student model’s autonomous learning ability. When λ D > 1.0 , the indicators show a downward trend. Because the excessively high distillation loss weight makes the student model overly dependent on the teacher model output, ignoring the supervision information of the true label, resulting in a decrease in generalization capability.
In the process of UAV intelligent inspection of power transmission lines, a lightweight image object detection model is required. To further validate the effectiveness of the proposed method, we set the distillation temperature value to 40, and conduct comparative experiments on the dataset provided in our paper. Existing adaptive distillation frameworks [34] can indeed perform detection quite well, but for the task type in this paper, i.e., recognizing rusted metal fittings with small size in UAV field of view and often being occluded, this technique will inevitably bring additional computational costs, which is crucial for UAV deployment.To further verify the effectiveness of the proposed method, we introduce a representative object detection method [35] for comparison. This method was designed for blur-aware object detection by first generating a synthetic blurred dataset and then employing a teacher-student network with shared parameters to conduct self-guided knowledge distillation. Then we believe that this method is applicable to the metal-fitting detection problem.
The experimental results are presented in Table 7 and Figure 17. The results demonstrate that employing knowledge distillation training significantly enhances the model’s performance, with an average precision improvement of 5.85%, recall rate improvement of 6.94%, and accuracy improvement of 3.83%. Moreover, the model size remains consistent with the student model, being only one-fourth the size of the teacher model, resulting in faster detection speed. It validates the effectiveness of the proposed method in this paper.
Somewhat unexpectedly, as shown in Table 7, the proposed method still achieves significant improvements in recall and precision than the self-guided knowledge distillation method [35] whose detection speed is nearly doubled. Meanwhile, the model size of the proposed method is reduced from 32.1 MB to 10.5 MB. This comparison fully demonstrates that, through the synergistic optimization of lightweight network design and high-precision knowledge selection mechanism, the proposed method not only enhances robustness and accuracy in detecting objects within blurred images, but also substantially improves inference efficiency and deployability, making it better suited for resource-constrained edge computing scenarios. Through knowledge distillation training, the knowledge from the teacher model can be transferred to the student model, thereby improving the performance of the student model while maintaining its size. As a result, a robust lightweight image object detection model is obtained.

4.5.2. Visualized Results

For the purpose of visual analysis on the impact of the teacher model on the student model during the distillation training process, the heatmaps are depicted as shown in Figure 18. It can be observed from the heatmaps that the utilization of knowledge distillation training method can enhance the performance of the student model by means of knowledge transfer from the teacher model, resulting in an increased contribution to object detection.
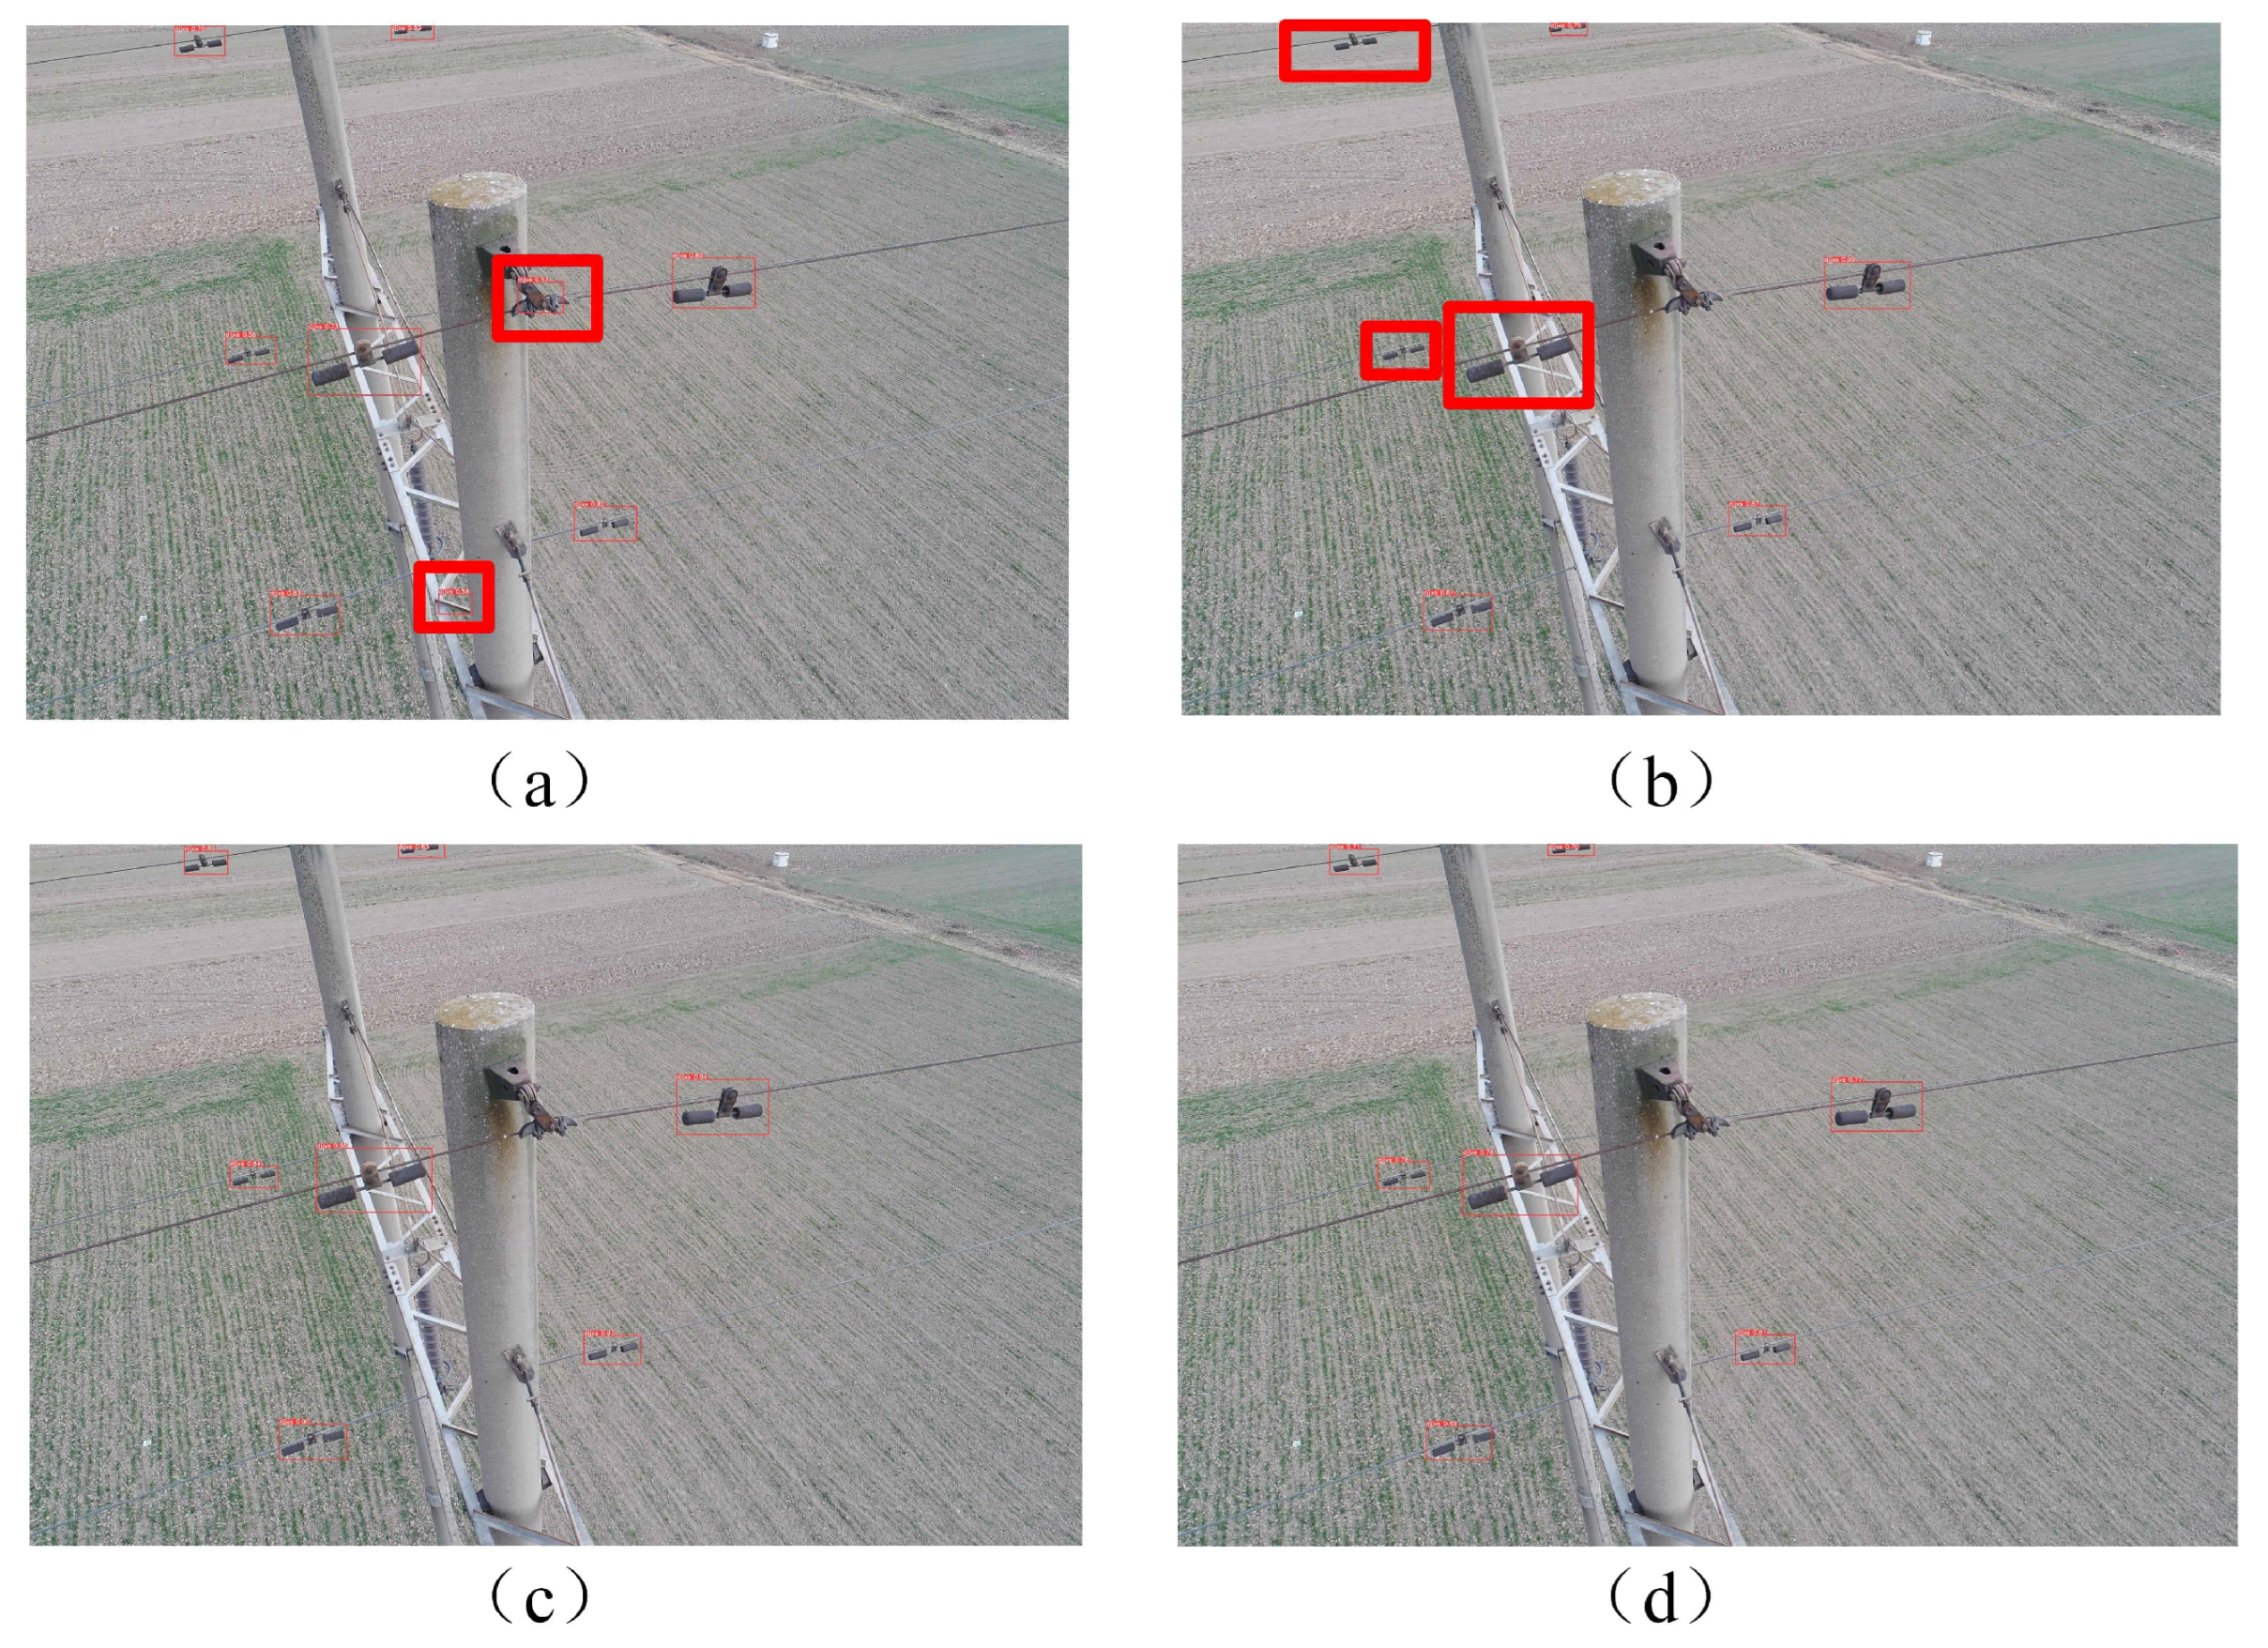
The images acquired from the UAV are subjected to detection using an image object detection model, and the corresponding results are illustrated in Figure 19, Figure 20, Figure 21 and Figure 22. The subfigures (a–d) correspond to the detection results of YOLOv5, the student model, the teacher model and the proposed approach, respectively. From the detection results, it can be visually observed that the teacher model achieves a higher accuracy in detection. The student model exhibits instances of false detections and missed detections. Using the knowledge distillation training approach, our method improves the occurrences of false detections and missed detections in the results. As shown in Figure 19, the detection results of the student model exhibit a fusion between the rusted fitting target and the background, due to their similar color and less prominent features, which makes them difficult to detect. Consequently, there are instances of missed detections. However, our proposed method successfully detects previously missed corroded fittings. Figure 20 shows a scenario in whichh the corrosionof thef the fittings is partially obscured during the UAV inspection process, attributable to the angle of image capture. Consequently, the student model exhibits instances of missed detections of these targets, accompanied by inaccuracies in localizing the bounding boxes. However, the proposed method not only detects these previously missed rusted fittings but also enhances the accuracy of the bounding box localization, thereby enabling more precise detection. Figure 21 presents an image characterized by a complex background environment and substantial interference, resulting in missed detections of the target in the results of the student model. Furthermore, the YOLOv5 image detection model also exhibits instances of false detections. Nevertheless, our method effectively detects the previously missed corroded fittings in the image. Figure 22 demonstrates a scenario where the corroded fittings intersect with the iron frame, creating a complex structure that poses challenges for the student model’s detection. As a consequence, there are instances of missed detections, including small target objects. Nonetheless, our proposed method effectively detects the previously missed corroded fittings in the image. The detection results validate that the efficacy of the proposed method in enhancing the performance of the student image object detection model. It effectively improves both the accuracy and speed of the image object detection model while maintaining robustness and lightweight characteristics.
To validate the significant differences in false positive rate (FPR) and false negative rate (FNR) between the proposed model and the classical YOLOv5 model, this study employs a rigorous experimental design and a statistical testing workflow. First, both models were independently trained for 20 epochs on the same target dataset. After each training session, five full-scale tests were performed on the test set, resulting in data sets of 100 samples for both FPR and FNR. During the statistical analysis phase, normality was assessed using the Shapiro–Wilk test, and quantile–quantile plots (Q-Q plot) were also drawn to visually verify the Gaussian distribution characteristics of the data. If the data satisfied the normality assumption (p > 0.05), a paired sample t-test was performed with a significance level of α = 0.05, using a two-tailed test to determine mean differences. If the data did not meet normality, logarithmic or square root transformations were applied before re-test. The results of a paired-sample t-test that compares the Yolov5 model and the proposed method are listed in Figure 23, Table 8 and Table 9.
As shown in Figure 23, the data points approximately lie along the straight line, confirming the normality assumption. From Table 8 and Table 9, Yolov5 has a mean value with 0.162 in terms of FPR, while the proposed method shows a lower FPR of 0.085. In terms of FNR, YOLOv5 records 0.125, while the proposed method achieves a lower FNR of 0.072. The p values for FPR and FNR are 0.0184 and 0.0196 respectively. For the FPR paired differences, the Shapiro–Wilk test yielded a statistic W = 0.982 with p = 0.236 . For the FNR paired differences, the Shapiro–Wilk test statistic was W = 0.978 with p = 0.154 . These p values are less than the typical significance level of 0.05, indicating that there are statistically significant differences in both FPR and FNR between the two models. Thus, the proposed method demonstrates superior performance in reducing both false positives and false negatives compared to YOLOv5.

4.5.3. Computational Cost Evaluation

The teacher model in the proposed method mainly consists of convolution operation and pixel-level attention mechanism. The computational complexity of standard convolution operation can be approximately represented by Equation (18). After introducing pixel attention mechanism, the overall complexity can be expressed by Equation (19) [36].
F L O P s 1 = C i n × C o u t × K 2 × H × W
F L O P s 2 = C i n × C o u t × K 2 × H × W + H × W × C i n × N
where, C i n and C o u t denote the number of input and output channels, respectively. K is the size of convolution kernel, H and W are the height and width of the input feature map, while N signifies the number of heads of the attention mechanism. Although the pixel-level attention mechanism enhances the model’s ability to extract features, it significantly increases the computational cost, which is not conducive to deployment on edge devices. That is why we employ a knowledge distillation method to maintain the lightweight recognition of the student model.
In the student model, MobileNetV3 is used to replace the feature extraction part of YOLOv5. Compared with the original feature extractor, MobileNetV3 significantly reduces the number of parameters through depthwise separable convolutions. The computational complexity of the depthwise separable convolutions can be approximately represented by Equation (20).
F L O P s 3 = C i n × K 2 × H × W + C i n × C o u t × H × W
From Equations (19) and (20), it can be seen that the depthwise separable convolution reduces the complexity of standard convolutions from O ( C i n × C o u t × K 2 ) to O ( C i n × K 2 + C o u t ) .
The empirical evaluation is conducted on our actual UAV platform. Due to commercial confidentiality, we will not disclose the specific hardware configuration parameters here. Since only student model is deployed at the platform, the cost evaluation is mainly carried out for the student model. Here we compare the proposed method with the classical YOLOv5 that uses CSPDarknet53 as student model. The YOLOv5s model with CSPDarknet53 gets its memory footprint approximately 14.5 MB, while the proposed method with MobileNetV3 gets the memory footprint reduced to 2.7 MB. The parameter number is significantly reduced by over 80%. Therefore, the lightweight characteristics of MobileNetV3 make it highly suitable for deployment on resource-constrained edge devices. Its low parameter count and FLOPs enable the model to run efficiently on low-power devices while maintaining high detection accuracy.
5. Conclusions

As an essential aspect of UAV-based intelligent inspection for transmission lines, the performance of image object detection models based on deep learning is of paramount importance. This paper addresses the problem of detecting corroded metal fittings in transmission line images, focusing on the construction of a robust lightweight image object detection model. By considering the practical characteristics of UAV image data, this paper develops an image object detection model deployable on UAV terminals, aiming to enhance the robustness of fitting detection results and reduce model complexity for improved accuracy in challenging scenarios.
The proposed model consists of teacher model training and student model training stages. Experimental verification shows that the teacher model effectively reduces false detection and missed detection in the detection results, enhancing the robustness and performance of fitting detection with high accuracy. The results demonstrate that employing knowledge distillation training significantly enhances the model’s performance, with an average precision improvement of 5.85%, recall rate improvement of 6.94%, and accuracy improvement of 3.83% compared to YoloV5. The model size remains consistent with the student model, being only one-fourth the size of the teacher model, resulting in faster detection speed. These results demonstrate that the model balances detection precision, efficiency, and deployability effectively.
The proposed model exhibits high performance and can be easily deployed on mobile intelligent terminal devices, which offers a feasible solution for UAV-based intelligent inspection of transmission lines. Its capability to address real-world challenges in power system inspections highlights its practical significance for industrial applications.

Author Contributions

Y.T.: Writing—original draft, Writing—review & editing, Data curation, Supervision. W.Z.: Investigation, Writing—original draft. Z.L.: Conceptualization, Writing—original draft. J.L.: Writing—original draft, Data curation. W.M.: Conceptualization, Writing—review & editing. All authors have read and agreed to the published version of the manuscript.

Funding

This work was supported by National Natural Science Foundation of China under Grant 62472146.

Data Availability Statement

Data are contained within the article.

Conflicts of Interest

Authors Yangyang Tian, Weijian Zhang and Zhe Li were employed by the company State Grid Henan Electric Power Research Institute and State Grid Henan Electric Power Company. The remaining authors declare that the research was conducted in the absence of any commercial or financial relationships that could be construed as a potential conflict of interest.

References

  1. Dongyue, G.; Zhang, J.; Bo, Y.; Yi, L. Multi-modal intelligent situation awareness in real-time air traffic control: Control intent understanding and flight trajectory prediction. Chin. J. Aeronaut. 2025, 38, 103376. [Google Scholar]
  2. Xiang, D.; Ying, C.; Dai, L. A Novel Approach to Trajectory Situation Awareness Using Multi-modal Deep Learning Models. In Proceedings of the International Conference on Cognitive Computation and Systems, Urumqi, China, 14–15 October 2023; Springer: Berlin/Heidelberg, Germany, 2023; pp. 224–232. [Google Scholar]
  3. Horita, H. Optimizing Runtime Business Processes with Fair Workload Distribution. J. Compr. Bus. Adm. Res. 2025, 2, 162–173. [Google Scholar] [CrossRef]
  4. Chan, R.H.; Ho, C.W.; Nikolova, M. Salt-and-pepper noise removal by median-type noise detectors and detail-preserving regularization. IEEE Trans. Image Process. 2005, 14, 1479–1485. [Google Scholar] [CrossRef]
  5. KaewTraKulPong, P.; Bowden, R. An improved adaptive background mixture model for real-time tracking with shadow detection. In Video-Based Surveillance Systems: Computer Vision and Distributed Processing; Springer: Boston, MA, USA, 2002; pp. 135–144. [Google Scholar]
  6. Godbehere, A.B.; Goldberg, K. Algorithms for visual tracking of visitors under variable-lighting conditions for a responsive audio art installation. In Controls and Art: Inquiries at the Intersection of the Subjective and the Objective; Springer: Berlin/Heidelberg, Germany, 2014; pp. 181–204. [Google Scholar]
  7. Canny, J. A computational approach to edge detection. IEEE Trans. Pattern Anal. Mach. Intell. 1986, 6, 679–698. [Google Scholar] [CrossRef]
  8. Duda, R.O.; Hart, P.E. Use of the Hough transformation to detect lines and curves in pictures. Commun. ACM 1972, 15, 11–15. [Google Scholar] [CrossRef]
  9. Von Gioi, R.G.; Jakubowicz, J.; Morel, J.M.; Randall, G. LSD: A fast line segment detector with a false detection control. IEEE Trans. Pattern Anal. Mach. Intell. 2008, 32, 722–732. [Google Scholar] [CrossRef] [PubMed]
  10. Ren, S.; He, K.; Girshick, R.; Sun, J. Faster R-CNN: Towards real-time object detection with region proposal networks. IEEE Trans. Pattern Anal. Mach. Intell. 2017, 39, 1137–1149. [Google Scholar] [CrossRef]
  11. Ji, Z.; Liao, Y.; Zheng, L.; Wu, L.; Yu, M.; Feng, Y. An assembled detector based on geometrical constraint for power component recognition. Sensors 2019, 19, 3517. [Google Scholar] [CrossRef]
  12. Chen, W.; Li, Y.; Zhao, Z. Transmission line vibration damper detection using deep neural networks based on UAV remote sensing image. Sensors 2022, 22, 1892. [Google Scholar] [CrossRef]
  13. Ji, C.L.; Yu, T.; Gao, P.; Wang, F.; Yuan, R.Y. YOLO-TLA: An efficient and lightweight small object detection model based on YOLOv5. J. Real-Time Image Process. 2024, 21, 141. [Google Scholar] [CrossRef]
  14. Deng, W.; Feng, J.; Zhao, H. Autonomous path planning via sand cat swarm optimization with multi-strategy mechanism for unmanned aerial vehicles in dynamic environment. IEEE Internet Things J. 2025, 12, 26003–26013. [Google Scholar] [CrossRef]
  15. Betti, A.; Tucci, M. YOLO-S: A lightweight and accurate YOLO-like network for small target detection in aerial imagery. Sensors 2023, 23, 1865. [Google Scholar] [CrossRef]
  16. Wang, D.; Tan, J.; Wang, H.; Kong, L.; Zhang, C.; Pan, D.; Li, T.; Liu, J. SDS-YOLO: An improved vibratory position detection algorithm based on YOLOv11. Measurement 2025, 244, 116518. [Google Scholar] [CrossRef]
  17. Wei, W.; Yan, H.; Zheng, J.; Rao, Y. YOLOv11-based multi-task learning for enhanced bone fracture detection and classification in X-ray images. J. Radiat. Res. Appl. Sci. 2025, 28, 101309. [Google Scholar] [CrossRef]
  18. Xie, S.; Zhou, M.; Wang, C.; Huang, S. CSPPartial-YOLO: A lightweight YOLO-based method for typical objects detection in remote sensing images. IEEE J. Sel. Top. Appl. Earth Obs. Remote Sens. 2023, 17, 388–399. [Google Scholar] [CrossRef]
  19. Akdoğan, C.; Özer, T.; Oğuz, Y. PP-YOLO: Deep learning based detection model to detect apple and cherry trees in orchard based on Histogram and Wavelet preprocessing techniques. Comput. Electron. Agric. 2025, 232, 110052. [Google Scholar] [CrossRef]
  20. Jobaer, S.; Tang, X.-s.; Zhang, Y.; Li, G.; Ahmed, F. A novel knowledge distillation framework for enhancing small object detection in blurry environments with unmanned aerial vehicle-assisted images. Complex Intell. Syst. 2025, 11, 63. [Google Scholar] [CrossRef]
  21. Zhang, H.; Liu, L.; Huang, Y.; Lei, X.; Tong, L.; Wen, B. InstKD: Towards Lightweight 3D Object Detection With Instance-Aware Knowledge Distillation. IEEE Trans. Intell. Veh. 2024. Early Access. [Google Scholar] [CrossRef]
  22. Li, M.; Liang, X.; Hu, Q.; Lin, Y.-e.; Xia, C. Multi-scale feature fusion with knowledge distillation for object detection in aerial imagery. Eng. Appl. Artif. Intell. 2025, 158, 111518. [Google Scholar] [CrossRef]
  23. Dong, S.; Wang, P.; Abbas, K. A survey on deep learning and its applications. Comput. Sci. Rev. 2021, 40, 100379. [Google Scholar] [CrossRef]
  24. Girshick, R.; Donahue, J.; Darrell, T.; Malik, J. Rich feature hierarchies for accurate object detection and semantic segmentation. In Proceedings of the IEEE Conference on Computer Vision and Pattern Recognition, Columbus, OH, USA, 23–28 June 2014; pp. 580–587. [Google Scholar]
  25. Girshick, R. Fast r-cnn. In Proceedings of the IEEE International Conference on Computer Vision, Santiago, Chile, 7–13 December 2015; pp. 1440–1448. [Google Scholar]
  26. Redmon, J.; Farhadi, A. Yolov3: An incremental improvement. arXiv 2018, arXiv:1804.02767. [Google Scholar] [CrossRef]
  27. Bochkovskiy, A.; Wang, C.Y.; Liao, H.Y.M. Yolov4: Optimal speed and accuracy of object detection. arXiv 2020, arXiv:2004.10934. [Google Scholar] [CrossRef]
  28. Liu, W.; Anguelov, D.; Erhan, D.; Szegedy, C.; Reed, S.; Fu, C.Y.; Berg, A.C. Ssd: Single shot multibox detector. In Proceedings of the Computer Vision–ECCV 2016: 14th European Conference, Amsterdam, The Netherlands, 11–14 October 2016; Proceedings, Part I 14. Springer: Berlin/Heidelberg, Germany, 2016; pp. 21–37. [Google Scholar]
  29. Li, X.; Hu, Y.; Jie, Y.; Zhao, C.; Zhang, Z. Dual-frequency lidar for compressed sensing 3D imaging based on all-phase fast fourier transform. J. Opt. Photonics Res. 2024, 1, 74–81. [Google Scholar] [CrossRef]
  30. Wang, H.; Zhang, G.; Cao, H.; Hu, K.; Wang, Q.; Deng, Y.; Gao, J.; Tang, Y. Geometry-Aware 3D Point Cloud Learning for Precise Cutting-Point Detection in Unstructured Field Environments. J. Field Robot. 2025, 42, 3063–3076. [Google Scholar] [CrossRef]
  31. Vaswani, A.; Ramachandran, P.; Srinivas, A.; Parmar, N.; Hechtman, B.; Shlens, J. Scaling local self-attention for parameter efficient visual backbones. In Proceedings of the IEEE/CVF Conference on Computer Vision and Pattern Recognition, Nashville, TN, USA, 20–25 June 2021; pp. 12894–12904. [Google Scholar]
  32. Hassani, A.; Walton, S.; Li, J.; Li, S.; Shi, H. Neighborhood attention transformer. In Proceedings of the IEEE/CVF Conference on Computer Vision and Pattern Recognition, Vancouver, BC, Canada, 17–24 June 2023; pp. 6185–6194. [Google Scholar]
  33. Tan, M.; Pang, R.; Le, Q.V. Efficientdet: Scalable and efficient object detection. In Proceedings of the IEEE/CVF Conference on Computer Vision and Pattern Recognition, Seattle, WA, USA, 13–19 June 2020; pp. 10781–10790. [Google Scholar]
  34. Chennupati, S.; Kamani, M.M.; Cheng, Z.; Chen, L. Adaptive distillation: Aggregating knowledge from multiple paths for efficient distillation. arXiv 2021, arXiv:2110.09674. [Google Scholar] [CrossRef]
  35. Cho, S.J.; Kim, S.W.; Jung, S.W.; Ko, S.J. Blur-Robust Object Detection Using Feature-Level Deblurring via Self-Guided Knowledge Distillation. IEEE Access 2022, 10, 79491–79501. [Google Scholar] [CrossRef]
  36. Liu, K.; Wang, J.; Zhang, K.; Chen, M.; Zhao, H.; Liao, J. A lightweight recognition method for rice growth period based on improved YOLOv5s. Sensors 2023, 23, 6738. [Google Scholar] [CrossRef]
Figure 1. Example of rusted fitting detected in this paper, where the subfigures (a,b) are just some image samples.
Electronics 14 04362 g001
Figure 2. Flowchart of YOLOv5 image target detection model.
Electronics 14 04362 g002
Figure 3. Flowchart of the proposed model.
Electronics 14 04362 g003
Figure 4. Flowchart of the teacher model.
Electronics 14 04362 g004
Figure 5. Comparison diagram of ResNet and DenseNet, where (a) is for ResNet and (b) is for DenseNet.
Electronics 14 04362 g005
Figure 6. Structural diagram of the self-attention mechanism.
Electronics 14 04362 g006
Figure 7. Positional relationship between the central pixel and nearby pixels.
Electronics 14 04362 g007
Figure 8. Flowchart of the student model.
Electronics 14 04362 g008
Figure 9. Sample diagram of experimental data of corroded fittings, where (a) is an overview diagram, (b) is the sample with complex background, (c) is the partially obscured sample, (d) is the samples with small size.
Electronics 14 04362 g009
Figure 10. Schematic diagram after data augmentation, where (ad) are the four samples for illustration).
Electronics 14 04362 g010
Figure 11. Schematic diagram of data annotation example, where the Chinese word in the figure means “metal fittings”. Please understand that this figure is the real software interface we used.
Electronics 14 04362 g011
Figure 12. P-R curve of ablation experiment.
Electronics 14 04362 g012
Figure 13. SPSA Feature maps of the proposed method and Yolov5.
Electronics 14 04362 g013
Figure 14. Heat maps of the proposed method and Yolov5.
Electronics 14 04362 g014
Figure 15. Detection results for comparison, where (a,c,e) are the results of the classical YOLOv5 model, while (b,d,f) are the results of the proposed model. For comparison, the subfigures (a,b) are for missed detection, (c,d) are for false detection, (e,f) present detection performance under occlusion.
Electronics 14 04362 g015
Figure 16. P-R curves by the six detection models.
Electronics 14 04362 g016
Figure 17. P-R curve of distillation experiment.
Electronics 14 04362 g017
Figure 18. Heatmaps of detection results by different models for comparison.
Electronics 14 04362 g018
Figure 19. Examples of detection results with complex background, the subfigures (ad) correspond to the detection results of YOLOv5, the student model, the teacher model and the proposed approach, respectively.
Electronics 14 04362 g019
Figure 20. Examples of detection results with partially-obscured fittings, the subfigures (ad) correspond to the detection results of YOLOv5, the student model, the teacher model and the proposed approach, respectively.
Electronics 14 04362 g020
Figure 21. Examples of detection results with complex background environment and substantial interference, the subfigures (ad) correspond to the detection results of YOLOv5, the student model, the teacher model and the proposed approach, respectively.
Electronics 14 04362 g021
Figure 22. Examples of detection results with the corroded fittings intersected with iron frame, the subfigures (ad) correspond to the detection results of YOLOv5, the student model, the teacher model and the proposed approach, respectively.
Electronics 14 04362 g022
Figure 23. The quantile–quantile plot of FPR and FNR data. The red circles and blue squares represent FPR data and FNR data, respectively.
Electronics 14 04362 g023
Table 1. Structure of MobileNetV3 used in this paper.
InputOperatorExp SizeOutSEs
2242 × 3Conv2d, 3 × 3-16-2
1122 × 16Bneck, 3 × 31616+2
562 × 16Bneck, 3 × 37224-2
2822 × 24Bneck, 3 × 38824-1
282 × 24Bneck, 5 × 59640+2
142 × 40Bneck, 5 × 524040+1
142 × 40Bneck, 5 × 512048+1
142 × 48Bneck, 5 × 514448+1
142 × 48Bneck, 5 × 528896+2
72 × 96Bneck, 5 × 557696+1
72 × 96Conv2d, 1 × 1-576+1
72 × 576Pool, 7 × 7---1
12 × 576Conv2d, 1 × 1, NBN-1024-1
12 × 1024Conv2d, 1 × 1, NBN-k-1
Table 2. Results of ablation experiment.
ModelDenseNetSPSARecall/%Precision/%AP/%
YOLOv5NoNo89.3187.9692.03
YOLOv5YesNo87.7891.2393.29
YOLOv5NoYes89.1391.3994.32
Teacher model++90.0889.3895.82
Table 3. Comparative results of all 10 detection models. The mean value and standard deviation of five repeated trials are reported here. The bold texts indicate the optimal value.
Detection ModelsRecall/%Precision/%AP/%
Faster R-CNN86.46 ± 2.2389.92 ± 2.3686.95 ± 3.21
SSD76.28 ± 2.1262.35 ± 1.5675.05 ± 2.18
YOLOv375.94 ± 3.7781.03 ± 2.1384.14 ± 3.21
YOLOv473.77 ± 1.1983.62 ± 3.7186.50 ± 1.64
YOLOv589.31 ± 0.8687.96 ± 1.8192.03 ± 1.89
YOLOv8n89.03 ± 1.7886.63 ± 3.7493.12 ± 1.33
EfficientDet87.45 ± 3.2387.76 ± 2.6492.98 ± 2.86
YOLOv1188.31 ± 3.8688.96 ± 2.2193.17 ± 0.86
PP-YOLO90.31 ± 1.6890.23 ± 0.9394.03 ± 3.32
Proposed model90.08 ± 2.4989.38 ± 3.2995.82 ± 0.62
Table 4. Experimental results of distillation at different temperature values. The bold texts indicate the optimal value.
Distillation Temperature ValuesRecall/%Precision/%AP/%Detection Time/s
1086.2684.3188.060.018
2087.7984.5588.390.017
3080.9287.5989.230.016
4083.9788.6990.040.016
5083.2085.1587.940.018
6083.9384.6187.180.018
Table 5. Performance comparison of different IoU series methods.
MethodRecall (%)Precision (%)AP (%)
IoU82.1580.4288.36
GIoU84.3283.1790.15
DIoU86.5985.7392.48
DIoU-NMS88.2487.5194.05
EIoU-NMS90.0889.3895.82
Table 6. Comparison of model performance under different values of λ D .
MethodRecall (%)Precision (%)AP (%)
0.284.1585.3288.76
0.486.3987.1589.58
0.688.2488.0390.72
0.889.1788.9692.35
1.090.0889.3895.82
1.288.7387.6593.16
1.486.5185.2990.24
Table 7. Comparison experiments of knowledge distillation. The bold texts indicate the best value.
Detection ModelRecall/%Precision/%AP/%Detection
Time/s
Model
Size/MB
Self-guided distillation [35] 88.11 85.64 91.20 0.031 32.1
YOLOv589.3187.9692.030.02942.6
Teacher model83.9788.6990.040.03142.3
Student model77.0384.8684.190.01810.5
Our approach90.0889.3895.820.01610.5
Table 8. Results of paired-sample t-test on FPR. The bold texts indicate the best value.
ModelFPRt-Valuedf95% CIp-Value
Yolov50.162 ± 0.12t = 4.2119[0.052, 0.092]0.0184
The proposed Method0.085 ± 0.08
Table 9. Results of paired-sample t-test on FNR. The bold texts indicate the best value.
ModelFNRt-Valuedf95% CIp-Value
Yolov50.125 ± 0.15t = 3.9819[0.038, 0.072]0.0196
The proposed Method0.072 ± 0.06
Disclaimer/Publisher’s Note: The statements, opinions and data contained in all publications are solely those of the individual author(s) and contributor(s) and not of MDPI and/or the editor(s). MDPI and/or the editor(s) disclaim responsibility for any injury to people or property resulting from any ideas, methods, instructions or products referred to in the content.