Abstract
In the source location of underground explosions, the phase non-consistency among sensors can cause significant errors in the extraction of the time difference in the arrival of seismic waves, seriously affecting the accuracy of source location. To address the above-mentioned problem, this paper proposes a phase compensation method based on the Multi-strategy Quantum behaved Particle Swarm Optimization (MQPSO) algorithm. First, this method calibrates the phases of vibration sensors to obtain the phase differences among sensors. Second, it uses the MQPSO intelligent optimization algorithm to correct the phase differences among vibration sensors. Finally, simulations and field tests are carried out for verification. The experimental results show that after adopting the phase compensation method with MQPSO, the range of phase differences in sensors is reduced by an average of 91% compared with the uncompensated state. This fully verifies that the phase compensation method of MQPSO can effectively complete the phase consistency calibration of sensors, providing important support for the source location of underground explosions.
1. Introduction
The phase consistency among sensors is crucial for obtaining vibration field data in the distributed source location [1]. Phase errors can affect the extraction of the time difference in the arrival of vibration waves, thus influencing the positioning accuracy. Specifically, in the underground explosion source location depicted in Figure 1 [2], sensors are deployed with varying degrees of coupling to the soil. This variation leads to changes in their phase–frequency characteristics. As a result, significant phase characteristic deviations occur among the sensors. These deviations ultimately introduce phase errors into the detection results, thereby affecting the positioning accuracy. Consequently, compensating for the phase errors among sensors is necessary.
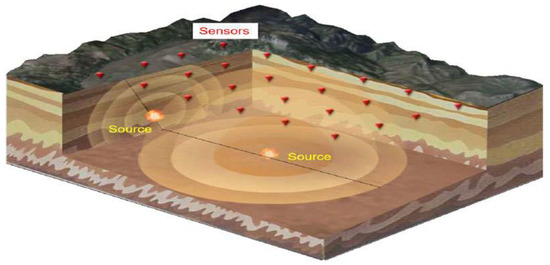
Figure 1.
Schematic diagram of shallow underground source positioning.
At present, the main method to reduce the phase errors among sensors is the addition of additional compensation algorithms in the data processing stage at the sensor’s backend [3]. These algorithms enhance the dynamic characteristics of sensors through signal analysis and parameter optimization and correct the existing phase errors. Regarding the construction of the compensation link, scholars have proposed dynamic compensation methods such as neural network algorithms [4,5,6], signal-processing-based algorithms [3,7,8,9,10,11,12], and intelligent optimization algorithms [13,14,15,16,17,18,19,20]. Neural network algorithms are generally designed for scenarios with static, low-speed, or specific slow-response sensors. Relying on large-scale labeled data, they have long training cycles and poor real-time performance and thus cannot cope with the instantaneous dynamic changes in explosion vibration signals. Signal processing-based algorithms have slow convergence and high complexity due to iterative optimization or traversal calculations. They cannot meet the real-time requirements of explosion vibration detection. Moreover, their ability to correct strongly coupled phase deviations is limited, and they are not adaptable to the multi-channel deployment environment underground.
For the above-mentioned problems, intelligent optimization algorithms have significant advantages. With an efficient global optimization mechanism, this approach can quickly optimize phase compensation parameters and adapt to scenarios with phase errors in multi-variable coupling. Igel et al. [13] proposed a variant of the Covariance Matrix Adaptation Evolution Strategy (CMA-ES) for Multi-Objective Optimization (MOO). Hebbal et al. [14] proposed a Multi-Objective Bayesian Optimization algorithm based on Deep Gaussian Processes to jointly model the objective function. Zhou et al. [15] proposed the Double Regression-based Particle Swarm Optimization (DR-PSO) algorithm. First, it obtains a rough value of the Capacitive Voltage Transformer (CVT) error through double regression and then uses the Particle Swarm Optimization (PSO) to optimize the weights of multiple disturbance factors to achieve precise compensation. The algorithms demonstrate the potential of intelligent optimization algorithms in compensating for multi-variable coupling errors. However, it also has the problem of being prone to becoming trapped in local optima. When dealing with particle-swarm parameters, the traditional particle-swarm optimization algorithm is likely to experience optimization stagnation due to insufficient particle diversity and thus cannot accurately adapt to the dynamic changes in phase deviations. To address this, inspired by the concepts of quantum mechanics and PSO, Fang et al. [16] proposed the Quantum behaved Particle Swarm Optimization (QPSO) algorithm as a variant of PSO, which has better global search capabilities. Although it performs better than PSO, in the complex structure of underground explosions, it suffers from problems such as slow convergence speed and premature convergence [17]. Agrawal et al. [18] proposed the enhanced Quantum behaved Particle Swarm Optimization (e-QPSO) algorithm. This algorithm improves the optimization performance through three improvements: introducing the parameter to linearly adjust the weights of and , designing the parameter to dynamically allocate the probabilities of exploration and exploitation, and re-initializing some of the worst-performing particles. However, there are several issues with the e-QPSO algorithm. Firstly, the parameter adjustment does not adapt to the characteristics of underground explosion vibration signals. Secondly, the re-initialization mechanism has difficulty responding to dynamic phase deviations. Thirdly, it does not involve multi-sensor synchronous dynamic compensation. Thus, the algorithm is not applicable to the scenario of underground explosion source location and cannot achieve the phase consistency calibration of vibration sensors.
In the process of shallow underground source location, problems such as low precision in extracting the time difference in arrival of seismic waves and poor real-time performance occur due to the phase errors among vibration sensors. This paper proposes a phase compensation method based on the Multi-strategy Quantum behaved Particle Swarm Optimization (MQPSO) algorithm. This method is an improvement based on QPSO [21]. It introduces the Circle chaotic mapping sequence [22] to initialize the population and adopts a nonlinear shrink-expansion coefficient update strategy. The specific process is as follows: First, the phases of vibration sensors are calibrated to obtain the phase differences among sensors. Second, the MQPSO intelligent optimization algorithm is used to correct the phase differences among vibration sensors. Finally, simulations and field tests are carried out for verification.
2. Vibration Sensor Phase Compensation Method
Regarding the phase error problem of sensors, intelligent optimization algorithms have significant advantages. Multiple sensors can be pre-calibrated to improve the poor phase consistency among sensors. However, this approach is prone to becoming trapped in local optimal solutions. Therefore, this paper proposes a phase compensation method based on MQPSO. This method can retain more particle swarm information, enhance particle diversity, and improve the search efficiency and accuracy. In this way, it can avoid the guidance of the single optimal individual to the population and reduce the possibility of becoming trapped in local optima. The principle is illustrated in Figure 2.

Figure 2.
Schematic diagram of the phase compensation filtering principle.
Measure the same physical quantity using a reference sensor and an uncalibrated sensor to obtain their respective response signals and . Apply phase compensation filtering to the response signal obtained from the uncalibrated sensor to obtain the compensated signal . Compare the compensated signal with the response signal from the reference sensor. Use the MQPSO intelligent optimization algorithm to correct the filter coefficients, thereby aligning the phase response of the uncalibrated sensor with that of the reference sensor.
2.1. Design of Phase Compensation Filter
In this paper, the all-pass filter [23] is selected as the phase compensation filter model. The coefficients of its numerator and denominator polynomials are in an inverted relationship. This filter allows signals of all frequency bands to pass through. It can correct the phase without changing the amplitude of the signal. By connecting the all-pass filter in series behind the sensor and optimizing the filter coefficients through an intelligent optimization algorithm, the phase consistency of the sensor can be effectively improved, and the dynamic performance of the vibration sensor can be enhanced. The N-dimensional system function of the all-pass filter is shown in Equation (1).
Among them, is the filter coefficient. This formula represents a one-dimensional all-pass filter, and its implementation principle is shown in Figure 3.
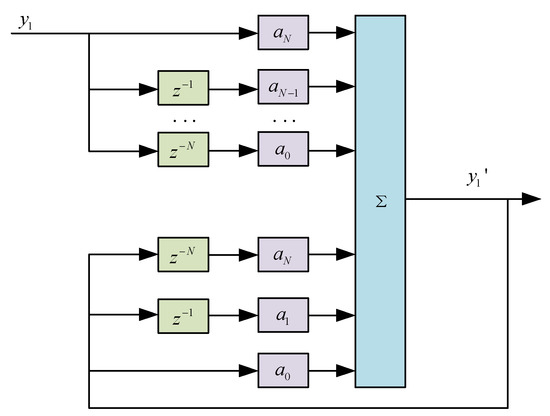
Figure 3.
Schematic diagram of all-pass filter implementation.
2.2. Optimization of Filter Coefficients
2.2.1. Principles of the MQPSO Algorithm
The Quantum behaved Particle Swarm Optimization (QPSO) algorithm [21] is an optimization algorithm that is more likely to converge to the global optimal solution. It is proposed on the basis of the Particle Swarm Optimization algorithm by integrating the basic principles of particle motion in quantum mechanics. The QPSO algorithm takes into account the local optimal and global optimal position information of each particle’s current position to update the particle’s position. In the space, the position of a particle is obtained by calculating the probability density of the particle’s appearance through the Schrödinger equation. During particle movement, the -dimensional position function of the jth particle at the tth iteration is as follows:
Among them, is the local attractor of the jth particle in the dth dimension, is the characteristic length of the potential well, and is a random number in [0, 1]. The expressions for the local attractor and the characteristic length are shown in Equations (3) and (4).
Among them, and are random numbers between 0 and 1, represents the local optimal position of the particle swarm, represents the global optimal value of the particle swarm, is the contraction/expansion coefficient, and represents the average value of the global extrema of all particles. The expressions for the contraction/expansion coefficient and the average value of the average optimal position [24] are shown in Equations (5) and (6).
In this context, denotes the number of iterations of the QPSO algorithm, with and ; represents the number of particles in the particle swarm. Substituting Equations (3)–(6) into Equation (2), we obtain the evolution formula for particles in the QPSO algorithm as follows:
Particles update their positions according to Equation (7), and previous particle movements no longer affect the next position update, resulting in better randomness and higher collective intelligence.
In theory, the QPSO intelligent optimization algorithm can find the optimal solution. But the QPSO algorithm has problems such as slow convergence speed and premature convergence in practical applications [17]. There are two reasons for this problem: First, the particle swarm is initialized with a random distribution. This may lead to an uneven distribution of particles, ultimately resulting in a local optimum. Second, the value of changes linearly. That is, throughout the search process, both the search speed and the search accuracy remain unchanged. This can cause problems such as premature convergence of the algorithm or low efficiency.
Therefore, this paper proposes the MQPSO algorithm, which makes the following improvements based on QPSO: 1. Introduce the Circle chaotic mapping sequence [22] to initialize the population. 2. Use a nonlinear contraction/expansion coefficient update strategy.
- 1.
- Circle Chaotic Mapping for Population Initialization
Chaos, which has developed from nonlinear systems, obtains a random-like motion state through deterministic equations. Currently, it is an effective optimization tool, featuring ergodicity, non-periodicity, and sensitivity to initial values. During the optimization process, a chaotic map can replace the pseudo-random number generator. Therefore, to address the above-mentioned problems, this paper adopts the Circle chaotic mapping method to generate the initial particle swarm. The definition formula for the Circle chaotic mapping method is as follows:
In this case, is the remainder function, and is the value of the th mapping. Assuming there are 50 particles, the initial population generated by the Circle chaotic mapping shown in Figure 4b is more uniformly distributed compared to the traditional initial population method shown in Figure 4a. This feature enables it to retain more information and enhance particle diversity, thus providing a solid foundation for the subsequent optimization operations of the algorithm.
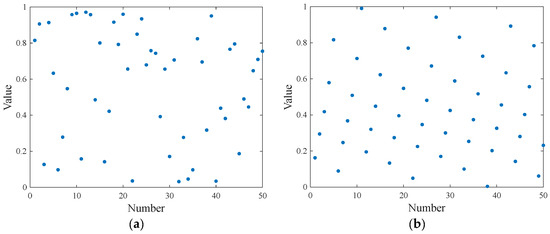
Figure 4.
Particle swarm initialization. (a) Traditional population initialization. (b) Circle chaotic mapping population initialization.
- 2.
- Nonlinear Contraction/expansion Coefficient β
The contraction/expansion coefficient determines the search radius of the algorithm. This paper adopts a nonlinear descent strategy to dynamically update the contraction/expansion coefficient. In the early stages of the search, the value is kept large to enable rapid global search and quickly locate the approximate position of the optimal solution. Then, the value of is reduced to perform a precise search for the optimal solution within a small range, thereby improving both search efficiency and accuracy. The new formula of is as follows:
Among them, , ; represents the current iteration count, and represents the maximum iteration count.
Set the iteration count to 500 and plot the contraction/expansion coefficient curves for the two algorithms, as shown in Figure 5. It can be seen that at the beginning of the algorithm, the value of is large, which is conducive to the global region search. As the algorithm runs, the value of gradually decreases, which is more conducive to precise search within a small range and makes it easier to obtain the optimal solution.
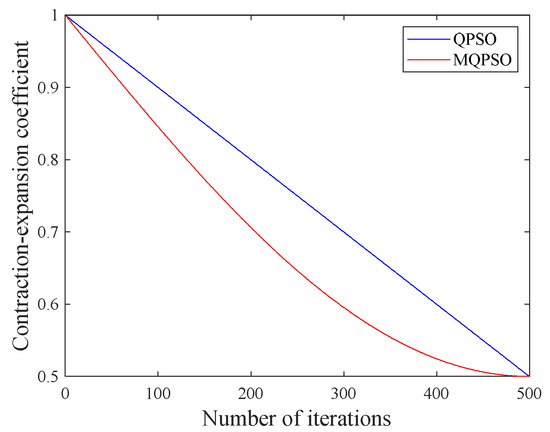
Figure 5.
Change in contraction and expansion coefficient.
2.2.2. Coefficient Optimization Steps Based on MQPSO
According to the characteristics of the MQPSO intelligent optimization algorithm, the fitness function is used to evaluate the quality of the current position of particles. The construction of the fitness function plays a crucial role in solving the phase compensation digital filter coefficients. In this paper, the mean square error of the phase difference in the vibration sensor is selected as the fitness function [25], as shown in Equation (10).
Among these, represents the maximum response frequency of the sensor, represents the signal frequency, denotes the phase of the compensated signal, and denotes the phase of the reference signal. The mean square error (MSE) of the phase difference between the vibration sensors is used as the evaluation metric to assess the performance of the phase compensation filter. By optimizing this fitness function, the optimal filter coefficients can be obtained, thereby achieving accurate compensation of the vibration sensor phase. After the algorithm ends, the position of the particle with the minimum fitness value during the entire operation period is the optimal solution obtained by the algorithm, that is, the finally obtained coefficients of the phase compensation filter.
The MQPSO intelligent optimization algorithm is used to optimize the coefficients of the phase compensation filter. The specific algorithm steps are as follows:
Step 1: Initialize the parameters of the particle swarm. We calculated the fitness values by taking the average of three calculations for different numbers of iterations and particle-swarm sizes and also calculated the fitness values by taking the average of fifty calculations for different filter orders. The results are shown in Figure 6. For the MQPSO algorithm, the number of iterations is set to 500, the number of particles is set to 50, and the order of the phase compensation filter is set to 17, which means the dimension of the particles is 17.
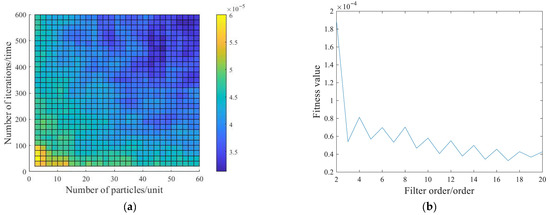
Figure 6.
Fitness values of different particle-swarm parameters. (a) Fitness values for different numbers of iterations and different particle-swarm sizes. (b) Fitness values for different filter orders.
Step 2: Initialize the particle positions. Initialize the population according to the Circle chaotic mapping and take it as the first-generation particles.
Step 3: Calculate the fitness value of each initial particle according to the objective function Equation (10), and select the particle with the minimum fitness value as the optimal position in the current particle swarm.
Step 4: Update the position of each particle through Equation (7). Judge the fitness value of the global optimum of the current particle swarm, and take the position with the minimum fitness as the current global optimum.
Step 5: When the number of iterations has not been reached, continue to update the particle positions according to Equation (7).
Step 6: When the number of iterations reaches the maximum value, or when the fitness value is less than 4 × 10⁻⁵ and the change in the optimal solution for 50 consecutive iterations is less than 10−8, the result with the minimum fitness value is output as the phase compensation filter coefficients. If the requirements are not met, the number of iterations is increased.
The flow chart of the optimization steps is shown in Figure 7.
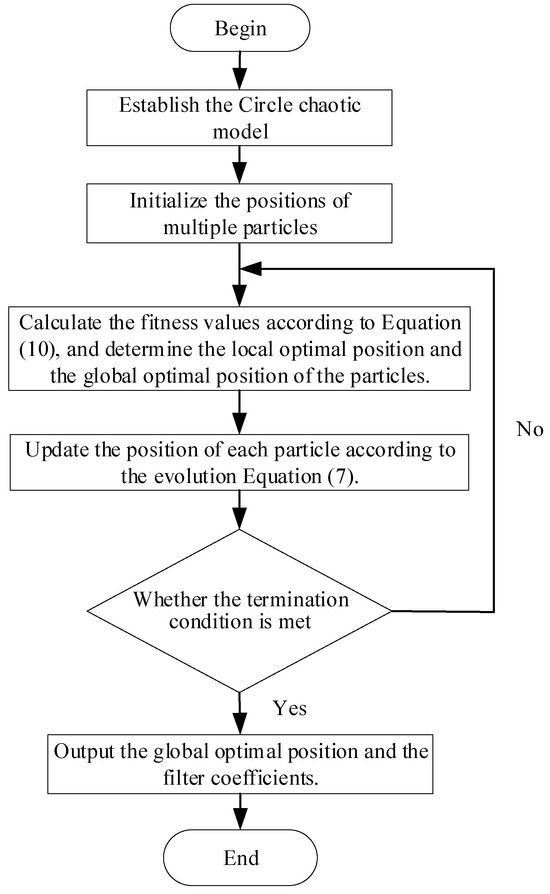
Figure 7.
Optimization steps of phase compensation filter coefficient.
3. Experiments and Results
3.1. System Simulation
3.1.1. Sensor Phase Calibration
We selected the LIS344ALH sensor produced by STMicroelectronics (Geneva, Switzerland). This sensor can collect three-axis acceleration information. Its maximum measurement range supports ±6 g, the sensitivity can reach 220 mV/g, and it has a bandwidth of 1.8 kHz.
The excitation signal of the vibration table was set as a sine signal with a frequency range from 20 Hz to 2000 Hz, and the driving acceleration is set to 9.807 m/s2. Phase calibration was carried out on the same axial direction of eight sensors, S1~S8, respectively. The original phase–frequency characteristics of the sensors are obtained as shown in Figure 8.
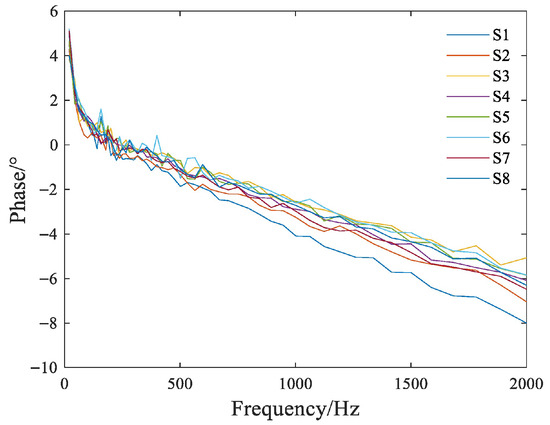
Figure 8.
Original phase–frequency characteristics of each sensor.
All sensors exhibit a phenomenon of low-frequency positive phase and high-frequency negative phase. Using sensor 1 as a reference, the relative phase differences in each sensor are obtained in Figure 9.
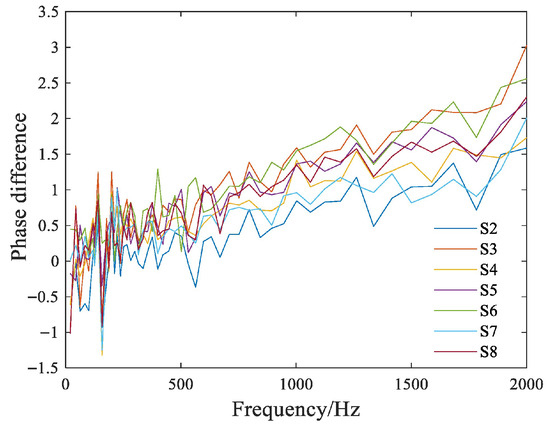
Figure 9.
Relative phase differences among sensors.
As shown in the figure, the overall trend of the phase difference change in each sensor is relatively similar. The higher the frequency of the collected signal, the larger the phase difference, which can reach up to 3°.
3.1.2. Optimization of Phase Compensation Filter Coefficients
The number of iterations for both the QPSO and MQPSO algorithms is set to 500, the number of particles is set to 50, and the order of the phase compensation filter is set to 17, which means the dimension of the particles is 17. The optimization models based on the QPSO and MQPSO algorithms are run on the MATLAB R2021a platform. After the iteration is completed, taking Sensor 2 as an example, the fitness curve is shown in Figure 10.
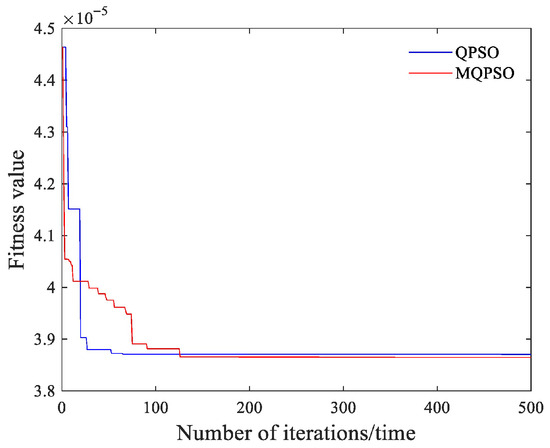
Figure 10.
Fitness curve of sensor 2 particles.
It can be seen that the fitness values of both the QPSO algorithm and the MQPSO algorithm decrease rapidly in the early stage of operation. They become trapped in local optima around 30 iterations. Around 50 iterations, the fitness curves tend to flatten out, indicating that the algorithms have basically converged at this point. However, when the number of iterations of the MQPSO is around 50, the particles are conducting local searches to seek better positions. As a result, the fitness curve shows a slow downward trend, and finally, a smaller fitness function value is obtained. This indicates that its solution has a higher precision for phase compensation. The coefficients of the phase compensation filter obtained according to the MQPSO algorithm are shown in Table 1.

Table 1.
Coefficients of the phase compensation filter obtained by MQPSO.
Based on the filter coefficients obtained from the QPSO and MQPSO algorithms, phase compensation is carried out on the calibrated data. After compensation, the phase differences between each sensor’s phase and the phase of Sensor 1 are shown in Figure 11. By comparing with the sensor phase differences before compensation, it can be seen that both the QPSO and MQPSO algorithms can perform phase compensation on the sensors. The QPSO algorithm can compensate the sensor phase differences within ±0.06°. The phase compensation effect is relatively uniform across the entire pass band. The phase compensation effect of the MQPSO algorithm is comparable to that of the QPSO below 200 Hz. Above 200 Hz, the phase compensation effect of the MQPSO algorithm is better than that of the QPSO. It can compensate the phase differences within ±0.02°, indicating that the MQPSO algorithm has a higher phase compensation accuracy.
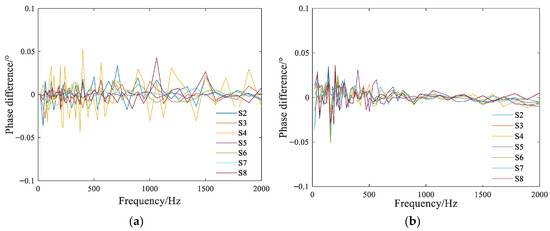
Figure 11.
Phase difference after compensation. (a) QPSO; (b) MQPSO.
3.1.3. Analysis of MQPSO Components
In order to verify the effectiveness of the Circle chaotic mapping sequence and the nonlinear contraction/expansion coefficient update strategy in the MQPSO algorithm, we conducted ablation experiments on these two parts, respectively. Specifically, we used the MQPSO version with only the Circle chaotic mapping sequence retained (MQPSO-C) and the MQPSO version with only the nonlinear contraction/expansion coefficient update strategy retained (MQPSO-n) for phase compensation. Subsequently, we compared the experimental results in these two cases with the phase compensation results of the QPSO algorithm and the complete MQPSO algorithm. Through this comparison, we obtained the phase–frequency characteristics after phase compensation of the QPSO, MQPSO-C, MQPSO-n, and the complete MQPSO algorithms. The specific results are shown in Figure 12. By comparing the four phase–frequency characteristic diagrams, it can be seen that the compensation effects of the two parts of MQPSO are both superior to those of QPSO. Among them, the compensation effect of MQPSO-C is more significant, but the compensation time is not significantly shortened. The compensation effect of MQPSO-n is slightly inferior, yet the computational efficiency is significantly improved. This indicates that the two parts of MQPSO both have an optimizing effect on QPSO. The complete MQPSO has the best phase compensation effect, and its compensation time is nearly halved compared with that of QPSO, which can be controlled within 2 min or even shorter. Therefore, the phase compensation method based on the MQPSO algorithm can effectively achieve the phase consistency calibration of vibration sensors.
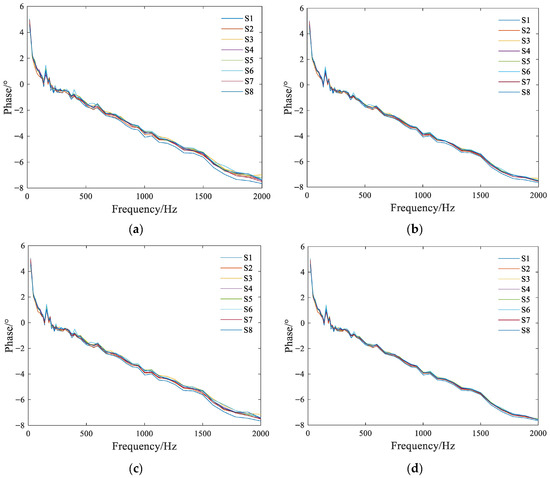
Figure 12.
Compensated phase frequency characteristics of eight sensors. (a) QPSO; (b) MQPSO-C; (c) MQPSO-n; (d) Complete MQPSO.
3.1.4. Statistical Analysis
To determine the practicality and stability of the MQPSO algorithm, we conducted a statistical analysis of the phase differences in sensors using the MQPSO algorithm, the QPSO algorithm, and typical optimization algorithms such as the Covariance Matrix Adaptation Evolution Strategy (CMA-ES) and Bayesian Optimization. We performed 30 independent experiments with randomly generated initial parameters. Then, we performed a paired-samples t-test using the phase difference values of sensors 2 to 8 relative to sensor 1 as the evaluation index. First, we calculated the phase difference values for each experiment. Then, we calculated the differences between the phase difference values of the other three algorithms and those of the MQPSO algorithm, respectively, obtaining a difference sequence. Next, we calculated the mean and sample standard deviation of the difference sequence, and we calculated the t-statistic based on this data. Finally, we looked up the p-value to determine significance (). The calculation results of the mean and standard deviation of the phase differences for each algorithm, as well as the results of the t-test, are shown in Table 2. It can be seen that the mean differences in the three comparison combinations are positive, the t-statistics are all much larger than the critical value of 2.045, and the p-values are all much smaller than the significance critical value of 0.05. Therefore, the MQPSO algorithm shows significant advantages in phase difference compensation.

Table 2.
Results of statistical analysis of phase differences between MQPSO algorithm and other algorithms.
3.2. Field Test
We designed a field experiment to verify the effectiveness of the phase compensation module of MQPSO in the detection hardware system. First, acceleration sensors were used to acquire vibration signals. Then, the collection and phase compensation of these vibration signals were completed on the Data Acquisition device. Finally, the vibration signals were transmitted to the PC side, where they were analyzed using the MATLAB simulation platform. The detailed performance information of the detection hardware system is shown in Table 3. The layout is shown in Figure 13. Among them, numbers 1~4 are equipped with the MQPSO phase compensation module, while numbers 5~8, serving as the control group, are not. All sensors are located 5 m from the epicenter. Arranged according to the schematic diagram, the X-axis points toward the source, the Y-axis is perpendicular to the X-axis and points east, and the Z-axis is perpendicular to the ground plane and points upward. A3 kg TNT charge was used as the source, buried at a depth of 1.5 m. The sensors were buried below the ground surface and covered with soil, as shown in Figure 14.

Table 3.
The performance information of the detection hardware system.
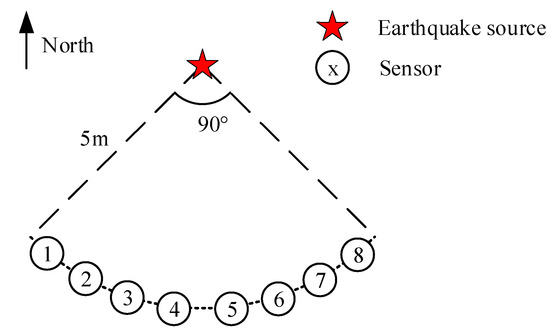
Figure 13.
Layout diagram.

Figure 14.
Photographs of the experimental site. (a) Bombing point pit; (b) sensor; (c) the Data Acquisition device; (d) Installation site; (e) detonation.
After installation, the equipment is activated and waits for triggering. Explosives are detonated to obtain data, and the eight sensor modules transmit data back as shown in Figure 15. Compare the time domain waveforms of the eight sensors, as shown in Figure 16. From the time domain comparison, it can be seen that the initial arrival and main peaks of the signals collected by the eight sensors are basically consistent. The peak values of the waveforms collected by each sensor are shown in Table 4.
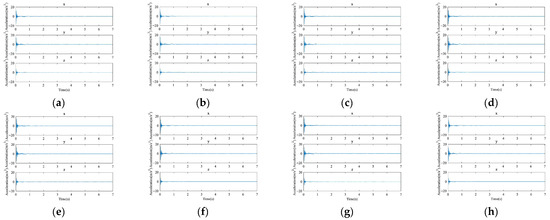
Figure 15.
Sensor waveform diagram. (a–h) Sensors 1~8.

Figure 16.
Time domain diagram of multiple sensor overlays. (a) X-axis; (b) Y-axis; (c) Z-axis.

Table 4.
Peak values of waveforms collected by each sensor.
It can be seen that the peak values of the four sensors equipped with the MQPSO phase compensation module have a relatively small difference, while the peak values of the four sensors without phase compensation are more scattered. Taking the S1 sensor as a reference, the cross-correlation [26] between each sensor and the S1 sensor was calculated, and the results are shown in Figure 17. It can be seen that the cross-correlation coefficients between sensors 2 to 4 and sensor 1 are high, above 95%, while those between sensors 5 to 8 and sensor 1 are significantly lower, especially along the Z-axis, which demonstrates the effectiveness of the phase compensation module.

Figure 17.
Cross-correlation coefficients between each sensor and sensor 1. (a) X-axis; (b) Y-axis; (c) Z-axis.
Comparing the amplitude-frequency curves of the eight sensors, as shown in Figure 18. From the frequency domain comparison, it can be seen that the signals collected by the eight sensors are within the same frequency band, mainly concentrated within 200 Hz, with the dominant frequencies of the signals on each axis being 85, 90, and 48 Hz, respectively. The time domain waveforms corresponding to the dominant frequencies of the signals collected by each sensor are extracted, as shown in Figure 19. At this time, the phase values of each axis of the signals collected by the eight sensors are shown in Table 5. Based on the phase values in the table, calculate the phase differences in each axis of sensors S1~S4 equipped with the MQPSO phase compensation module and those of sensors S5~S8 without the module. As shown in Table 6 and Table 7.

Figure 18.
Superimposed spectrum of various sensors. (a) X-axis; (b) Y-axis; (c) Z-axis.

Figure 19.
Time-domain waveform of the dominant frequency extraction. (a) X-axis; (b) Y-axis; (c) Z-axis.

Table 5.
Phase of each axis for each channel at dominant frequency.

Table 6.
The phase differences in each axis of sensors S1~S4 equipped with the MQPSO phase compensation module.

Table 7.
The phase differences in each axis of sensors S5~S8 not equipped with the MQPSO phase compensation module.
The maximum value of the phase differences in each axis of the sensors is simply referred to as the maximum phase difference. From Table 6 and Table 7, it can be obtained that the maximum phase differences in the three axes of S1~S4 equipped with the MQPSO phase compensation module are 0.1387°, 0.1257°, and 0.7822°, respectively, while those of S5~S8 not equipped with the module are 0.8789°, 1.8005°, and 9.1631°, respectively. The maximum phase difference in the sensors equipped with the phase compensation module is on average 91% lower than that of those without the module. This indicates that the phase compensation method based on MQPSO designed in this paper can effectively complete the phase consistency calibration of the sensors.
The QPSO algorithm is compared with the MQPSO algorithm. According to the above-mentioned test procedure, test the sensors equipped with the phase compensation module of QPSO. The phase differences in each axis of sensors S1~S4 equipped with the phase compensation module of QPSO are shown in Table 8. It can be seen that the maximum phase differences in the three axes of S1~S4 equipped with the QPSO phase compensation module are 0.1453°, 0.1364°, and 0.8175°, respectively. When compared with the maximum phase differences in the three axes of S1~S4 equipped with the MQPSO phase compensation module, the values of the maximum phase differences equipped with QPSO are larger. Meanwhile, we calculated the average values of the phase differences for the cases equipped with MQPSO and QPSO in Table 6 and Table 8, respectively. The average values of the three-axis phase differences for the cases equipped with MQPSO are 0.0694, 0.0629, and 0.3917, respectively. While the average values of the three-axis phase differences for the cases equipped with QPSO are 0.0762, 0.0700, and 0.4017, respectively. It can be clearly seen that the values of the three-axis phase differences for the cases equipped with MQPSO are smaller than those equipped with QPSO. Therefore, the phase compensation method based on MQPSO has a higher accuracy.

Table 8.
The phase differences in each axis of sensors S1~S4 equipped with the QPSO phase compensation module.
To verify the stability of the MQPSO algorithm in field experiments, we conducted a total of six independent field tests. The sensor positions were randomly deployed, and the initial parameters were randomly generated. The calculated mean and standard deviation of the phase difference for sensors equipped with MQPSO were 0.1244° ± 0.1792°, those for sensors equipped with QPSO were 0.1915° ± 0.2367°, and for sensors without any phase compensation were 1.8023° ± 2.8570°. After performing the t-test, the p-values were 0.0015 and 0.0001, respectively. Since the p-values of the two comparisons were both less than the significance critical value of 0.05, it proves the effectiveness of the phase compensation method based on MQPSO.
We carried out underground seismic source location using sensors equipped with QPSO-based and MQPSO-based phase compensation and compared them with sensors without such phase compensation. As shown in Figure 13, the coordinate of the seismic source is (0, 0, −1.5) with the unit of m. We evaluated the seismic source location error each time using the Root Mean Square Error (), and then calculated the average value. The results are shown in Table 9. It can be seen that the phase compensation method based on MQPSO can improve the accuracy of underground seismic source location, and its effect is better than that of QPSO.

Table 9.
Average error evaluation of RMSE for underground seismic source location.
4. Discussion
The phase compensation method based on MQPSO has great potential in improving the accuracy and efficiency of underground explosion source location, thus having a broad application prospect. In mineral exploration, it can provide accurate phase compensation for multi-sensor systems, helping to more precisely locate ore veins, improving exploration effectiveness, and saving costs. Regarding geological disaster early warning, by means of this technology, precise capture and analysis of underground vibration signals can be achieved. This enables earlier detection of abnormal geological structures, gaining time for early warnings of disasters such as earthquakes and landslides, and reducing disaster losses. In the national defense field, this method can improve the accuracy of detecting underground explosion targets, facilitating the rapid location of explosion points and providing support for national defense decision-making and operations. In addition, in underground cultural relic detection, without damaging cultural relics, this technology can determine the location and distribution of cultural relics through precise analysis of vibration signals, providing a basis for cultural relic protection and archeological research. These applications demonstrate the significant value and potential of the phase compensation method based on MQPSO in multiple fields. However, this method still has drawbacks. First, we need to denoise the signal and then perform phase compensation on the denoised signal. Therefore, under higher noise levels or in the presence of sensor malfunctions, the effect of sensor phase compensation may decline. Moreover, the phase compensation effect for dozens of sensors is still satisfactory. However, when it comes to calibrating the phase of a larger sensor array, the processing may be too slow due to excessive computing time, or the phase compensation effect may be unsatisfactory due to a small number of iterations. We need to conduct further in-depth research on these issues in the future.
5. Conclusions
This paper takes the underground explosion source location as the application background. In view of the phase errors among multiple sensors and the demand for phase compensation, a phase compensation method based on MQPSO is proposed. Experimental results show that after equipping this phase compensation method, the maximum phase difference in the sensors is on average reduced by 91% compared with the uncompensated state. This fully verifies that this method can efficiently achieve the phase consistency calibration of multiple sensors. Therefore, this achievement can provide important support for the high-precision location of underground explosion sources.
Author Contributions
Conceptualization, F.C., R.L., W.L., Y.T. and J.L.; methodology, F.C., R.L. and J.L.; validation, F.C. and R.L.; investigation, F.C. and R.L.; writing, F.C. and R.L. All authors have read and agreed to the published version of the manuscript.
Funding
This research is supported in part by the Central Support for Local Projects under Grant No. YDZJSX2024D031, in part by the Central Support for Local Projects under Grant No. YDZJSX2025D033, in part by the Teaching Reform and Innovation Project of Higher Education Institutions in Shanxi Province under Grant No. J20240889, and in part by the Teaching Reform Project of Postgraduate Education in Shanxi Province under Grant No. 1101053214.
Data Availability Statement
The data presented in this study are available on request from the corresponding author.
Conflicts of Interest
The authors declare no conflicts of interest.
References
- Li, J.; Zhao, F.; Wang, X.; Cao, F.; Han, X. The Underground Explosion Point Measurement Method Based on High-Precision Location of Energy Focus. IEEE Access 2020, 8, 165989–166002. [Google Scholar] [CrossRef]
- Li, F.; Qin, Y.; Song, W. Waveform Inversion-Assisted Distributed Reverse Time Migration for Microseismic Location. IEEE J. Sel. Top. Appl. Earth Obs. Remote Sens. 2019, 12, 1327–1332. [Google Scholar] [CrossRef]
- Jin, Y.; Chen, X.; Huang, S.; Chen, Z.; Li, J.; Hao, W. Dynamic Calibration Method of Multichannel Amplitude and Phase Consistency in Meteor Radar. Remote Sens. 2025, 17, 331. [Google Scholar] [CrossRef]
- Guan, J.; Li, J.; Yang, X.; Chen, X.; Xi, J. Error Compensation for Phase Retrieval in Deflectometry Based on Deep Learning. Meas. Sci. Technol. 2022, 34, 25009. [Google Scholar] [CrossRef]
- Hong, H.; Zhou, M.; Zhu, Y.; Zhang, X.; Xi, W.; Chen, L. High-Precision Grating Projection 3-D Measurement Method Based on Multifrequency Phases for Printed Circuit Board Inspection. IEEE Sens. J. 2024, 24, 33260–33267. [Google Scholar] [CrossRef]
- Roj, J. Correction of Dynamic Errors of a Gas Sensor Based on a Parametric Method and a Neural Network Technique. Sensors 2016, 16, 1267. [Google Scholar] [CrossRef] [PubMed]
- Chen, Y.; Xu, G.; Jiang, M.; Zhang, H. Robust Phase Error Correction and Coherent Processing for Automotive TDMA-MIMO Radar. In Proceedings of the 2022 Photonics & Electromagnetics Research Symposium (PIERS), Hangzhou, China, 25–27 April 2022; pp. 617–623. [Google Scholar] [CrossRef]
- He, Y.; Fan, Y.; Tan, U.-X. Multiple Order Fourier Linear Combiner: Estimating Phase Shift for Real-Time Vibration Compensation. IEEE Sens. J. 2022, 22, 14284–14293. [Google Scholar] [CrossRef]
- Zhang, Y.; Zhu, X.; Zhao, B.; Lu, C. The Phase Error Analysis and Compensation of Mruav-Sar. In Proceedings of the IGARSS 2020–2020 IEEE International Geoscience and Remote Sensing Symposium, Waikoloa, HI, USA, 26 September–2 October 2020; pp. 2121–2124. [Google Scholar] [CrossRef]
- Meng, Z.; Yang, J.; Guo, X.; Hu, M. Phase Compensation Sensor for Ranging Consistency in Inter-Satellite Links of Navigation Constellation. Sensors 2017, 17, 461. [Google Scholar] [CrossRef] [PubMed]
- Nikitenko, A.N.; Plotnikov, M.Y.; Volkov, A.V.; Mekhrengin, M.V.; Kireenkov, A.Y. PGC-Atan Demodulation Scheme with the Carrier Phase Delay Compensation for Fiber-Optic Interferometric Sensors. IEEE Sens. J. 2018, 18, 1985–1992. [Google Scholar] [CrossRef]
- Xue, Y.; Lu, Z.; Wang, X. A Two-Channel Amplitude and Phase Consistency Calibration Algorithm for in-Situ Measurement System of Electromagnetic Radiation Characteristics. In Proceedings of the 2024 14th International Symposium on Antennas, Propagation and EM Theory (ISAPE), Hefei, China, 23–26 October 2024; pp. 1–4. [Google Scholar] [CrossRef]
- Igel, C.; Hansen, N.; Roth, S. Covariance Matrix Adaptation for Multi-Objective Optimization. Evol. Comput. 2007, 15, 1–28. [Google Scholar] [CrossRef] [PubMed]
- Hebbal, A.; Balesdent, M.; Brevault, L.; Melab, N.; Talbi, E.-G. Deep Gaussian Process for Multi-Objective Bayesian Optimization. Optim. Eng. 2023, 24, 1809–1848. [Google Scholar] [CrossRef]
- Zhou, F.; Yu, J.; Zhao, P.; Yue, C.; Liang, S.; Li, H. CVT Measurement Error Correction by Double Regression-Based Particle Swarm Optimization Compensation Algorithm. Energy Rep. 2021, 7, 191–200. [Google Scholar] [CrossRef]
- Fang, W.; Sun, J.; Xu, W.; Liu, J. FIR Digital Filters Design Based on Quantum-Behaved Particle Swarm Optimization. In Proceedings of the First International Conference on Innovative Computing, Information and Control—Volume I (ICICIC’06), Beijing, China, 30 August–1 September 2006; Volume 1, pp. 615–619. [Google Scholar] [CrossRef]
- Wang, B.; Zhang, Z.; Song, Y.; Chen, M.; Chu, Y. Application of Quantum Particle Swarm Optimization for task scheduling in Device-Edge-Cloud Cooperative Computing. Eng. Appl. Artif. Intell. 2023, 126, 107020. [Google Scholar] [CrossRef]
- Agrawal, R.K.; Kaur, B.; Agarwal, P. Quantum inspired Particle Swarm Optimization with guided exploration for function optimization. Appl. Soft Comput. 2021, 102, 107122. [Google Scholar] [CrossRef]
- Wu, X.; Deng, F.; Chen, Z. RFID 3D-LANDMARC Localization Algorithm Based on Quantum Particle Swarm Optimization. Electronics 2018, 7, 19. [Google Scholar] [CrossRef]
- Wu, D.; Wang, L.; Li, J. An Energy Focusing-Based Scanning and Localization Method for Shallow Underground Explosive Sources. Electronics 2023, 12, 3825. [Google Scholar] [CrossRef]
- Sun, J.; Wu, X.; Palade, V.; Fang, W.; Lai, C.-H.; Xu, W. Convergence Analysis and Improvements of Quantum-Behaved Particle Swarm Optimization. Inf. Sci. 2012, 193, 81–103. [Google Scholar] [CrossRef]
- Li, W.; Yang, J.; Shao, P. Circle Chaotic Search-Based Butterfly Optimization Algorithm. In Advances in Swarm Intelligence; Tan, Y., Shi, Y., Eds.; Springer Nature: Singapore, 2024; pp. 122–132. [Google Scholar] [CrossRef]
- Zhao, W.; Tian, S.; Chen, H.; Xiao, Y.; Wu, Q.; Liu, K. Design of An All-Pass Phase Compensation Filter Based on Modified Genetic Algorithm in FI-DAC. In Proceedings of the 2022 IEEE AUTOTESTCON, National Harbor, MD, USA, 29 August–1 September 2022; pp. 1–7. [Google Scholar] [CrossRef]
- Sun, J.; Xu, W.; Feng, B. A Global Search Strategy of Quantum-Behaved Particle Swarm Optimization. In Proceedings of the IEEE Conference on Cybernetics and Intelligent Systems, Singapore, 1–3 December 2004; Volume 1, pp. 111–116. [Google Scholar] [CrossRef]
- Urbanek, T.; Prokopova, Z.; Silhavy, R.; Vesela, V. Prediction Accuracy Measurements as a Fitness Function for Software Effort Estimation. SpringerPlus 2015, 4, 778. [Google Scholar] [CrossRef] [PubMed]
- Liang, H.; Gao, Y.; Li, H.; Huang, S.; Chen, M.; Wang, B. Pipeline Leakage Detection Based on Secondary Phase Transform Cross-Correlation. Sensors 2023, 23, 1572. [Google Scholar] [CrossRef] [PubMed]
Disclaimer/Publisher’s Note: The statements, opinions and data contained in all publications are solely those of the individual author(s) and contributor(s) and not of MDPI and/or the editor(s). MDPI and/or the editor(s) disclaim responsibility for any injury to people or property resulting from any ideas, methods, instructions or products referred to in the content. |
© 2025 by the authors. Licensee MDPI, Basel, Switzerland. This article is an open access article distributed under the terms and conditions of the Creative Commons Attribution (CC BY) license (https://creativecommons.org/licenses/by/4.0/).