Abstract
The transportation sector is undergoing a rapid energy transition. Electric Vehicles (EVs) are gradually replacing conventional ones in many different sectors, but battery management still represents a critical limitation of this process. Consequently, research in this area is expanding, aiming to develop solutions that enhance performance while minimizing environmental impact. This study addresses the application of Machine Learning (ML) techniques to estimate the battery State of Charge (SoC) for a full-electric bus fleet operating public service. The methodology is built based on the available driving data disclosed from the fleet monitoring system. The ML methods are assessed starting from model-based (MB) observers assumed as reference and performances are compared upon this basis. The datasets are retrieved from a public repository or derived from real cases, particularly referring to an electric bus fleet operating for an urban public service. The most critical limitation is the absence of the electrical input data coming from the battery, typically required by model-based approaches. Despite this, the proposed ML model achieved sufficient accuracy levels (RMSE < 0.3%) comparable to those of traditional observers. These outcomes demonstrate the potential of data-driven approaches to provide scalable and more straightforward tools for battery monitoring.
1. Introduction
The recent issue regarding global pollution has led the transportation industry to explore innovative technologies to increase sustainability. Concerns are motivated by the 20% of annual CO2 emissions by this sector, with almost 94% of vehicles involved in the sector relying on petrol fuels [1,2]. In this context, Electric Vehicles (EVs) emerge as one of the most widely adopted alternatives, thanks to electric drives, which offer several benefits compared to traditional Internal Combustion Engines (ICEs) such as energy efficiency and regenerative braking [3]. To mitigate pollution, Hybrid Electric Vehicles (HEVs) and Battery Electric Vehicles (BEVs) have increasingly been adopted as alternative means of transportation capable of reducing global emissions. Within the private sector, sales of HEVs and BEVs increased by +26.5% and +34.5%, respectively, in 2023, compared to the previous year [4]. Regarding the public transport sector, several Italian cities—including Milan and Turin—are gradually converting their entire urban bus fleet to Electric Vehicles [5,6]. In the road freight sector, although several companies manufacture fully electric trucks, their widespread adoption remains limited due to range constraints and lack of a dedicated charging infrastructure. However, EVs still face significant drawbacks, mainly related to the battery, the most critical component. A key issue lies in the environmental footprint of battery production, which involves energy-intensive processes mainly related to the mining of raw materials. These practices contribute notably to pollution and raise critical questions about the long-term sustainability of mass battery manufacturing. Furthermore, the current state of battery technology limits the overall performance of EVs. Common challenges include limited driving range, high charging times and non-negligible battery weight [7]. As a result, ongoing research efforts are focusing on multiple aspects of batteries to be developed, with the aim of boosting efficiency, reliability, and sustainability. One major limiting factor is the charging infrastructure. Researchers and stakeholders are cooperating to increase the accessibility of charging stations and refine charging methods to reduce wait times. To address this issue, many studies are exploring solutions such as dynamic wireless charging, which aims to extend the driving range while reducing or eliminating charging time [8]. Inductive charging has emerged as a promising leading technology, addressing many of the drawbacks associated with conductive charging: by enclosing all electronics, it reduces metallic corrosion and enhances safety by eliminating the need to plug and unplug high-voltage connectors [9]. In particular, this procedure allows batteries to be charged during driving, thus extending the range [10,11]. In parallel, advancements in battery chemistry are being investigated to enhance energy density and minimize both size and weight. Lithium-based batteries have replaced older technologies due to their superior characteristics in durability [12]. However, several emerging battery technologies, though still in an early stage, are showing promising potential. Equally important is battery management. A rapid and accurate estimation of key parameters is essential for maximizing energy utilization, decreasing maintenance needs, and preventing or anticipating failures [13]. These efforts collectively contribute to improved performance and longer battery lifespan [14].
One of the most critical aspects when dealing with batteries is the estimation of the State of Charge (SoC) [15]. The process is accurate through measuring electrical quantities such as voltage and currents. However, in some cases, these quantities may not be monitored in real time and the estimation must be carried out in different ways. For what concerns the remote management of a full-electric vehicle fleet, the SoC must be estimated at the end of the daily service in absence of electrical data and based on kinematics and driving data only. This paper aims to present and discuss different methodologies to estimate the SoC of Li-ion batteries applied to an electric bus fleet operating public transportation service. The available dataset extracted from real operations constitutes both the basis of this work and also a limitation in the number of variables disclosed. To overcome this gap, this research implemented both traditional model-based (MB) algorithms and different Machine Learning (ML) techniques to provide a solid benchmark for the assessment of the outcome. In the first phase, a publicly released experimental electrical dataset was exploited to assess the results produced by MB observers. In the second phase, the ML algorithms are evaluated as trained on real-world data collected from the real bus fleet itself. Strengths of the presented research can be summarized as follows:
- The capability of MB observers to provide a reliable outcome with reduced margins of error is positively evaluated if reduced complexity in the descriptive part is targeted.
- The ML techniques are considered for their versatility and fast adaptability to produce output results.
- The MB observer is then selected as a benchmark to evaluate the performances of different ML algorithms selected and tested.
Conversely, limitations of this study are represented by the following:
- The lack of detailed electrical quantities in the real-world dataset extracted represents the weakest aspect for a robust outcome in ML algorithms.
- Assumptions on the theoretical charging–discharging cycles—the so-called of the battery—and the driving data being aggregated for different drivers operating on each line.
- The clusterization of data for each line, based on the different topographic characteristics of the routes.
- Several ML techniques were affected by overfitting, decreasing the performances of the final estimation of the result.
This paper introduces the methodology adopted to deal with the topic in Section 2, with a deep insight into the different methods selected. An MB algorithm is built up to constitute the reference case, starting from a public electric dataset. In parallel, different ML algorithms are compared based on the actual dataset available. Adjustments were needed to correct the estimated outcome from ML algorithms, while the results from real datasets are discussed in Section 3.
2. Methodology
The presented research focuses on improving the SoC estimation of Li-ion batteries, specifically applied to an electric bus fleet. The need for a reliable SoC estimation is motivated by maintenance scheduling, which must comply with strict constraints on the residual battery life. The SoC represents the amount of energy currently stored and available in a battery. Unlike directly measurable quantities such as voltage and current, the SoC cannot be determined by direct observation; therefore, suitable techniques are required to evaluate it accurately [16]. These methods can be classified as follows:
- Direct measurement approach: The simplest technique, which relies on easily accessible signals such as voltage or current, is very sensitive to external disturbances and is generally reliable only under controlled experimental conditions [14,17].
- Model-based (MB) techniques: As the most commonly used methods, they depend on detailed mathematical models capturing the non-linear behavior of the battery. In particular, they can be classified based on the type of model involved:
- –
- Electro-chemical, which involves the model of electro-chemical processes or electro-thermal coupling in realizing discharging currents [18,19].
- –
- Equivalent Circuit Model (ECM), which implements a simplified electrical circuit model to deploy the electrical characteristics of the battery [20,21].
Although very effective, they are quite limited by the complexity of the models involved (often electro-chemical) and the need for numerous parameters to be determined [22,23,24]. - Machine Learning (ML) methods: Recently, these methods have gained interest due to their ease of implementation and adaptability, being capable of identifying complex non-linear patterns from historical data, without the need for explicit physical modeling [25,26,27].
This work involved the implementation and evaluation of both traditional MB algorithms and different ML models, tested with a experimental dataset to provide a solid benchmark for assessing the performance of the estimation. Two different experimental datasets were selected:
- The electrical dataset exploited for MB observers in the first phase, constituted by the incremental current open-circuit voltage (OCV) test, the Dynamic Stress Test (DST) and the Federal Urban Driving Schedule (FUDS) provided by the Center for Advanced Life Cycle Engineering (CALCE, University of Maryland, USA) [28].
- A real-world dataset composed by operative quantities related to the normal service operations collected from the bus fleet in a given time window.
2.1. Implementation of Traditional Methods
In order to choose a useful MB observer, an experimental study conducted by Zou et al. has been considered [29]. It compares four methods for SoC estimation:
- The Luenberger observer [22];
- The Kalman filter [30];
- The Proportional–Integral (PI) observer [31];
- The sliding-mode observer [32].
These algorithms are implemented and tested on a 20Ah EIG Li-ion battery, modeled using a first-order RC equivalent circuit (a Thevenin model). To assess their performance, the Urban Dynamometer Driving Schedule (UDDS) current profile, representing the power demand of an EV during a standardized driving cycle, is exploited. The evaluation focuses on three key aspects:
- (a)
- Estimation accuracy;
- (b)
- Rise time;
- (c)
- Computational costs.
The results show that all four methods are capable of estimating the SoC and correcting initial estimation errors. For this last aspect, both the sliding-mode and Luenberger observers demonstrate high sensitivity to external disturbances [33]. Moreover, the sliding-mode observer exhibits a wider dispersion of errors, while the remaining three approaches yield more concentrated distributions. Notably, the PI and Luenberger observers depict error distributions with peaks higher than 0.5 at zero value, indicating a high level of accuracy in most of their estimations.
Rising time is defined as the time required for the estimation to reach convergence to the true SoC value. This reflects the responsiveness of each algorithm, with the PI observer performing best for the lowest rising time [34].
Regarding computational efficiency, an important consideration for real-time EV applications, the Luenberger and sliding-mode observers prove to be the most efficient, followed by the PI observer. Taking into account the relevance of disturbance sensitivity in EV contexts, the Kalman filter and the PI observer emerge as the most suitable solutions [35]. Due to its better error distribution, faster response, and low computational cost, the PI observer is selected in this research as a reference model to benchmark with the most promising ML-based estimation method.
The PI observer shows rapid and accurate convergence in the estimated SoC value to its true value: this allows the use of a first-order RC model within the PI observer to effectively represent the dynamic behavior of the battery [36]. As depicted in Figure 1, the equivalent circuit consists of a voltage source dependent on the SoC value (), representing the OCV of the battery, a series resistor () and an RC circuit formed by a parallel resistor () and a parallel capacitor (). The electrical parameters related to the equivalent circuit were estimated through an iterative process involving the Least Square Regression method (LSQR) implemented in MATLAB R2024a. After we retrieved all the necessary data, a mathematical model of the battery was implemented in Simulink. A PI controller block was added and tuned using pidTuner, a built-in MATLAB function. Figure 2 represents the final model implemented in Simulink.
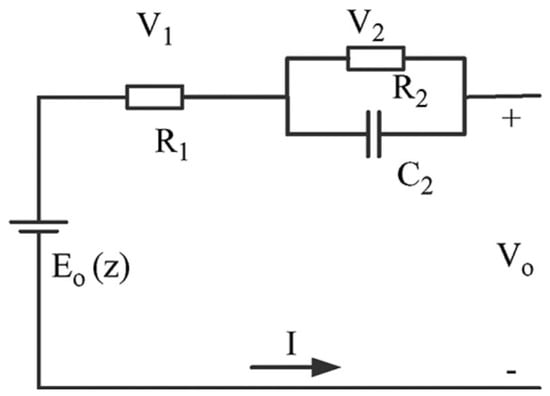
Figure 1.
Battery equivalent electric circuit model (ECM).
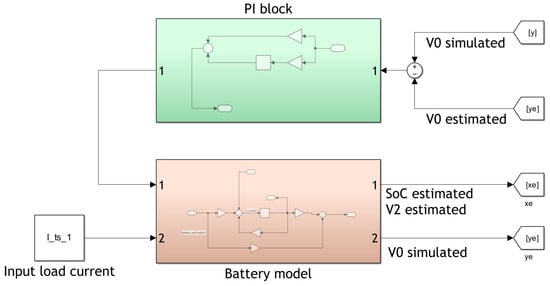
Figure 2.
Simulink model of the PI observer.
To minimize error build-up during the estimation process, an anti-windup feedback loop was introduced with an experimental coefficient. This was obtained through an iterative tuning process during experimental tests. In particular, different adjustments were performed until an optimal coefficient was identified, ensuring a good compromise between fast response and limited overshoot. After the definition of all necessary parameters and the construction of the curve representing the relationship between the OCV and SoC, the implemented model was tested with two main datasets, the incremental current OCV test and the DST, both performed on a 2Ah LiNiMnCo/Graphite battery [28]. For determining the OCV-SoC curves, the incremental current OCV test was exploited: about ten reference points were collected at three different temperatures during the relaxation pauses in order to measure the OCV related to the actual SoC both when charging the battery and when discharging it. The measurements were interpolated and averaged to obtain a single relationship curve. Figure 3 illustrates the different curves obtained for specific temperature values.
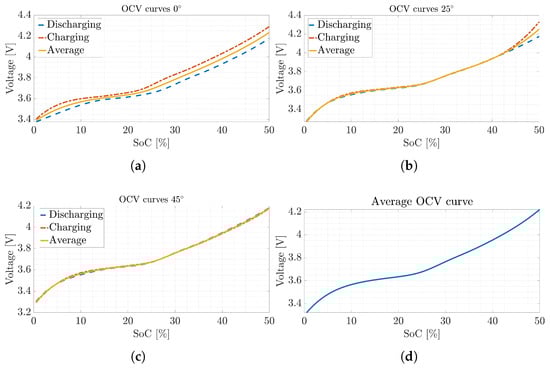
Figure 3.
OCV-SoC curves for 0 °C (a), 25 °C (b), 45 °C (c) and averaged (d).
Both datasets include various measured parameters such as the following:
- Time in [s];
- Load current in [A];
- Battery voltage in [V];
- External temperature in [°C];
- State of Charge (SoC) in [%].
The incremental current OCV test involves repeated flows of charging–discharging pulsed currents, while the the DST involves cycling the battery at different , as defined in (1),
where I is the load current measured in [A] and is the battery capacity in [Ah]. The two applied profiles differ significantly both in amplitude and nature of the stress induced. In addition, the experimental data were collected under completely different environmental conditions: the OCV test was conducted at 0 °C, while the DST was performed at 45 °C. Despite these contrasting scenarios, the difference between the estimated and actual SoC remains minimal in both cases, with a maximum deviation of less than 0.5%.
2.2. Implementation of Machine Learning Methods
Following the development of the PI observer, an alternative approach based on ML algorithms was investigated for SoC estimation. As aforementioned, training and validation phases were initially implemented for the experimental dataset, the DST and the Federal Urban Driving Schedule (FUDS), both performed at 0 °C, 25 °C and 45 °C on a 2Ah LiNiMnCo/Graphite battery [28]. The parameters contained in these datasets are organized as follows:
- Predictors, such as
- –
- Time in [s];
- –
- Load current in [A];
- –
- Battery voltage in [V],
- –
- Environmental temperature in [°C].
- A response variable (SoC).
The training and validation processes were carried out using MATLAB’s built-in Regression Learner tool. The preliminary evaluation was carried out using various machine learning models and hyperparameter settings. Decision Trees, Ensemble Trees, and Neural Networks showed the best performance for this type of training and were therefore chosen as the primary methods for further evaluation to efficiently generate results. The tunable hyperparameters included
- For the Decision Tree models, the minimum leaf size and the surrogate decision splits.
- For the Ensemble Tree models, the minimum leaf size, the number of learners and, specifically for the Ensemble Boosted Tree, the learning rate.
- For the Neural Network models, the number of fully connected layers, the size of the layers and the activation function.
Model performances were assessed according to the Root Mean Square Error (RMSE), which quantifies the average deviation between predicted and actual values; lower RMSE values (ideally tending to zero) indicate higher prediction accuracy [37]. Figure 4 illustrates the model’s accuracy obtained through training with the DST dataset after an optimization process, whose model numbers are delineated according to Table 1: as can be seen, model 2.17, representing the Ensemble Bagged Tree method, obtained the lowest RMSE value. Table 2, Table 3 and Table 4 collect the different configurations adopted for each ML algorithm, respectively.
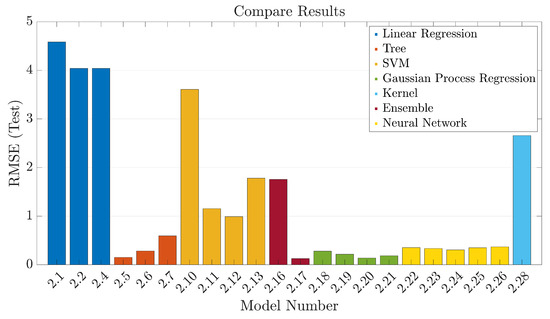
Figure 4.
Regression Learner model accuracy (DST).

Table 1.
Types of ML models tested.
Table 2.
Hyperparameter selection for Decision Tree models.
Table 3.
Hyperparameter selection for Ensemble Tree models.
Table 4.
Hyperparameter selection for Neural Network models.
As Figure 5 testifies, a maximum deviation of 0.6% is observed, making these results comparable to those produced by the PI observer. Similarly, the FUDS dataset also yielded very good results, with the Ensemble Bagged Tree model demonstrating the highest level of accuracy. Decision Trees, Ensemble Methods, and Neural Networks exhibited the highest levels of accuracy during the preliminary training. As a result, these algorithms were selected as the most suitable candidates for further evaluation to provide fast results.
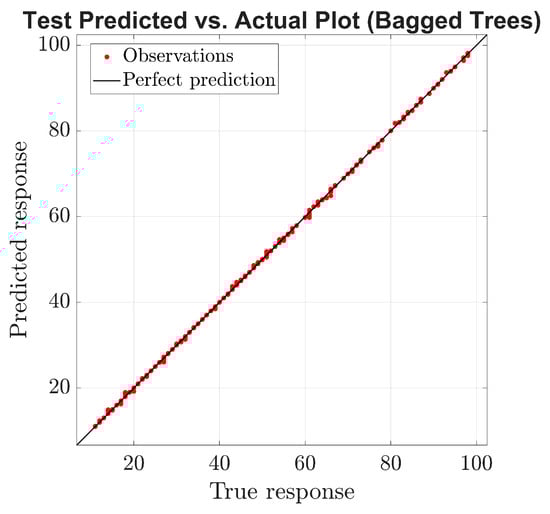
Figure 5.
Prediction plot Ensemble Bagged Tree method (DST).
Once the effectiveness of the ML model trained on electrical data was confirmed, the next step is represented by the development of algorithms designed to be trained on a real-world dataset. In this case, the original dataset of an electric bus fleet was acquired during the public service periods and composed only by
- Time in [s],
- Vehicle speed in [km/h] and
- Instantaneous SoC.
The bus fleet consisted of 13 EVs, categorized into two size groups:
- Small-sized buses: 8-m long vehicles each equipped with a 268.7 kWh battery pack;
- Medium-sized buses: 10-m long vehicles each equipped with a 383.4 kWh battery pack.
Although the fleet operates on seven different routes, the analysis focused on three specific lines. These were selected based on their high passenger volumes served and the distinctive topography of each route. To ensure data consistency and comparability, separate training datasets were prepared for each bus category. Each dataset was divided into allocating 50% of the samples for training and validation and the remaining 50% for testing. Moreover, the cross-validation technique was exploited. Due to the limited number of available input variables, model accuracy was enhanced through an iterative optimization process, involving both parameter tuning and dataset pre-processing. This helped to identify the most effective configuration for each model.
2.2.1. Whole Dataset
The initial stage of the analysis involved the training of several ML models using unprocessed data collected among all scheduled daily operations for each bus route. As noted earlier, the only input features available here were vehicle speed and the elapsed time since the acquisition started. Each bus line was imported individually into MATLAB, allowing the models to be trained separately for each specific route. This is due to the different topography of each line. Figure 6 displays the prediction performance for line L01C. Due to the large volume of data, the training phase proved to be computationally demanding, and in some cases, Neural Network models were unable to complete the process. A similar issue arose with line L02C operated by medium-sized vehicles, while better training results were obtained for lines L02C and L79B operated by small-sized vehicles. Although the current results are not highly accurate, they establish a foundation on which further model improvements can be built through future refinements.
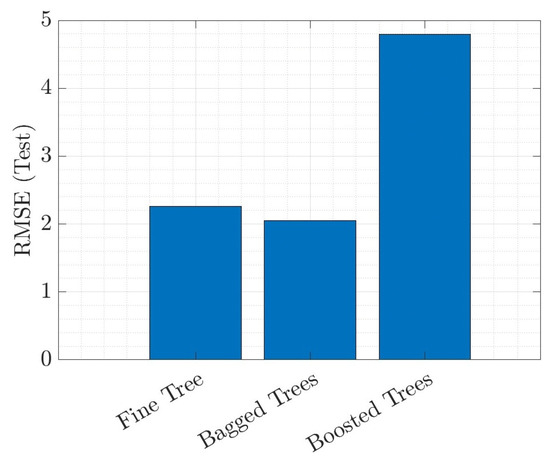
Figure 6.
Regression Learner model accuracy (L01C).
The most important challenge encountered when working with the full dataset was its significant size (≈), which often led to a slow training time or, in some cases, to the complete failure of the learning process. In addition, the relatively low training accuracy was partly attributed to the granularity of the SoC values, which resulted in statistical imbalances throughout the training phase. To overcome these limitations, a data pre-processing stage was introduced with the goal of reducing the dataset size and improving quality. Electric buses often remain idle for prolonged periods, leading to the generation of large volumes of redundant data at zero speed. To eliminate this inefficiency, all corresponding records were excluded from the dataset. A statistical analysis was then performed to assess the effects of this cleaning step. SoC values were rounded to the nearest integer and grouped into discrete “classes.” The total duration associated with each class was calculated to observe the distribution. As illustrated in Figure 7, the initial distribution was highly irregular, with numerous sharp peaks. After removing zero-speed data, the class distribution became significantly more uniform and balanced. This cleaning process also resulted in a considerable reduction in the size of data, enabling a faster and more effective training phase of ML models. The refined dataset was subsequently used to train and evaluate various ML algorithms.
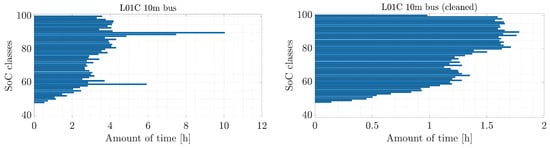
Figure 7.
Original dataset distribution—cleaned dataset distribution.
Given the unsatisfactory levels of accuracy achieved for certain bus lines, a different strategy was investigated—i.e., isolating data corresponding to individual operational days. In this setting, the ML models were trained and validated using measurements from a single selected day service, while the testing phase relied on data from a different day. Although this method yielded very high validation accuracies, the test results were worse than the validation ones. This outcome is a clear manifestation of overfitting—i.e., the model adapts exceptionally well to the specific patterns of one working day but struggles to generalize when exposed to unseen data from another day. The results of two representative tests conducted with this approach are reported in Table 5.
Table 5.
Best accuracy summary.
Various strategies were tested in an effort to mitigate this overfitting issue:
- (a)
- The first step involved a cleaned dataset with a more homogeneous data distribution; however, this did not produce any notable improvements in accuracy.
- (b)
- Next, the number of cross-validation folds within the Regression Learner was increased in an attempt to strengthen the model’s generalization capability, but the results remained essentially unchanged.
- (c)
- Lastly, testing subsets that incorporated data from multiple working days were assembled, but this approach also failed to produce any meaningful improvement.
Since none of these steps produced the intended outcome, this approach was ultimately discarded.
2.2.2. Whole Dataset with Additional Information
Although the previous adjustments led to some improvement, the overall model performances were still far from being optimal. To further improve predictive accuracy, additional variables were incorporated into the complete dataset. Specifically, the instantaneous acceleration profile of each vehicle was numerically derived. This choice was driven by the observation that acceleration dynamics can have a considerable impact on energy absorption and, hence, on the battery’s SoC. The acceleration profile was computed for each subset of route and integrated into the cleaned dataset as an additional predictor. This enriched dataset was then used for model training in the Regression Learner. The inclusion of this feature strengthened the link between the predictors and the targeted variable and resulted in a consistent, albeit modest, improvement in accuracy across all routes considered, as reported in Table 6.
Table 6.
Best testing accuracy summary [RMSE].
Another set of features incorporated into the dataset regarded historical weather conditions. For each operating day, the corresponding meteorological records from historical databases were consulted and extracted [38]. In particular, the daily average ambient temperature and wind speed were obtained and appended to the set of predictors to enhance the training of the ML models. The final group of input variables now includes
- Elapsed time [s];
- Vehicle speed [km/h];
- Vehicle acceleration [m/s2];
- Mean external ambient temperature [°C];
- Mean wind speed [km/h].
With these parameters, the RMSE values for all lines dropped to near-zero levels, demonstrating both the high accuracy of the predictions and the strong generalization capability of the developed approach.
Throughout the analysis, the Ensemble Bagged Tree approach consistently delivered the highest performance, as testified by Figure 8, which illustrates the progression of the accuracy obtained during the various optimization stages. All routes gained substantial accuracy gains, with the most pronounced improvements observed for those lines initially featured by lower scores. Furthermore, the results reveal that the optimization not only increased accuracy but also reduced variability among the lines, leading to more uniform outcomes. Although the final RMSE values were particularly low, the prediction plots in Figure 9 indicate a maximum deviation of 0.6%, apart from a limited number of outliers. The application of such methods on the clustered dataset according to different bus lines is reported in Figure 10, with the corresponding numerical values summarized in Table 6.
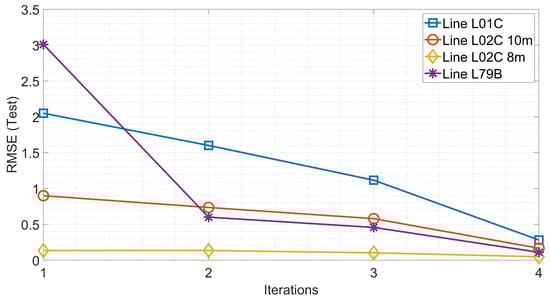
Figure 8.
Best accuracy value for each optimization step.
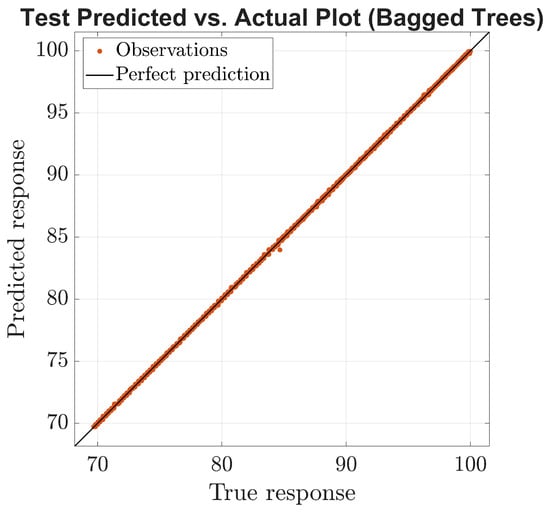
Figure 9.
Prediction plot for Ensemble Bagged Tree method (L02C 8m buses).
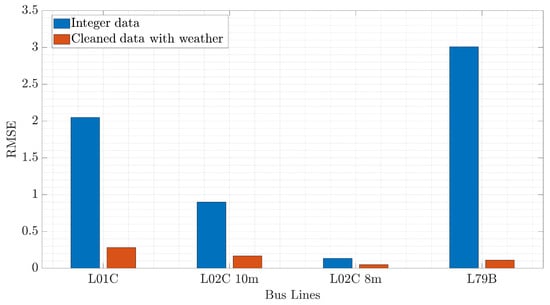
Figure 10.
Performance comparison between original dataset and adjusted dataset with predictors.
3. Discussion
The results allowed us to study the response of the ML algorithms for battery SoC estimation. The proposed methods were validated on a real-world dataset collected from an electric bus fleet deployed for public service, providing a practical application framework for model development. One of the main challenges in applying ML to this dataset was the limited set of available predictors. It must be remarked that the dataset used already decoupled the driver-related contribution from the auxiliary loads. Therefore, the predictors used always refer to quantities directly related to vehicular motion. Despite this outstanding aspect, the strongest limitation is represented by the electrical signals for the battery output unavailable. These signals—i.e., battery voltage and current—were not disclosed by the manufacturer nor read by the fleet monitoring software. Hence, new estimators, such as the acceleration profile, had to be computed to somehow associate the service to the load level of the battery. This additional predictor showed an improvement in the ability of ML algorithms to perform the estimation.
Further iterative refinements of the models led to notable improvements in predictive accuracy. Although the maximum estimation error exceeded the RMSE values, the results remained comparable to those obtained with the reference PI observer, as testified in Table 6. Furthermore, ML algorithms were able to capture the relationship between bus speed and battery discharge trends, demonstrating their ability to identify underlying correlations without relying on a physical model. After new predictors were added in the adjustment phase, the final performances of the ML algorithm improved to levels comparable to Physics-Informed ML techniques [39]. The reduced values of RMSE < 0.3% for each bus line considered show that the selected algorithm can be reliable in producing the correct SoC estimation. It must be recalled that in [39], the starting dataset included electrical quantities related to the battery such as voltage, current and cell temperature, data here unavailable. The ANN method was neglected here due to the increase in RMSE when compared to other methods as highlighted by [40], where the performance of ANNs related to RMSE was higher than other ML algorithms such as the Long Short-Term Memory Recurrent Neural Network (LSTM-RNN): this is mainly associated with their different architectures based on a feedforward (ANN) rather than a feedback loop (as for LSTM-RNN) for SoC estimation. The promising outcome of the estimation process presented can also be extended to the evaluation of the Remaining Useful Life (RUL) of the battery, which represents a critical aspect for both the operational planning and economic sustainability of public transport systems [41]. In fact, the most expensive maintenance operation for EVs is battery replacement, although maintenance burdens are drastically reduced compared to the corresponding ICE vehicles. An accurate and reliable discharge profile obtained through ML models is valuable for analyzing the actual operating conditions, which can then be extrapolated and projected into the future to estimate the RUL with satisfying accuracy [42]. This estimation provides insights into the projected duration over which a battery can continue to deliver an acceptable performance before reaching an early end-of-life threshold. The outcomes of this analysis indicate that the current operating conditions of the buses are consistent with the expected RUL targets, suggesting that the fleet is being used in a manner that does not accelerate premature battery wear. However, the starting framework of the dataset leads us to set some considerations regarding the estimation process and accuracy:
- (a)
- The unavailability of electrical quantities during the observation period can influence the quality of the outcome. In fact, the prediction of RUL is necessarily based on kinematic quantities only (elapsed time, speed, acceleration and environmental data), given the availability of disclosed data. This limits the field from which the prediction is assessed.
- (b)
- The lack of electrical data also leads us to discard non-linearities of battery cells, which are considerable during normal transportation activity [16]. As a matter of fact, the energy is discharged differently when the SoC is higher than 90% and lower than 30%. Between these threshold values, the behavior of the battery can be assumed as linear. This phenomenon also impacts the battery’s own efficiency in providing a current through electrochemical processes.
- (c)
- In addition, the missing information about the passenger load onboard is a strong limitation for understanding the load level that the driver is requesting of the battery for public service deployment. The different topography of each line route must also be considered, since a flat path requires less energy to displace the same EV than a steep route. In this wake, the dataset was clustered based on the different line served, as reported by Table 6.
- (d)
- The driving data are here considered in an aggregated way. This means that the driver shift is neglected. This simplification step is questionable because each driver can adopt a different driving style, with more or less energy requested to the battery.
- (e)
- The real charging–discharging cycle can significantly impact battery performances, aging and degradation phenomena [43]. Given the lack of data as aforementioned, the C-rate was defined analytically based on the maximum rated power for the motor (representing the most demanding discharging condition) and for the charging spot (assuming an overnight constant-power charging operation). Both maximum conditions reach C-rate values below 0.9. However, the real motor power demand due to slope, payload due to onboard passengers and the driving style can be different from this assumption, therefore leading to instantaneous values of C-rate sensibly far from the threshold value computed [44,45].
- (f)
- All exposed considerations can play a non-negligible role in enhancing the aging mechanism of battery cells, leading to the early degradation of performance [46]. The assumptions made here thus lead to the potential overestimation of RUL for the whole fleet, with the lack of detailed data.
This finding has practical implications: transport operators can be more confident in their scheduling and replacement strategies, reducing unexpected down-times and avoiding premature investments in new battery packs. In addition, the results highlighted that the observed driving cycles, environmental conditions, and charging practices fall within a safe operational window, supporting the long-term sustainability of the transition towards electric public transport. However, different driving styles can influence variable energy consumption along the same line, whose impact on the battery degradation must be considered for maintenance scheduling and RUL estimation. Moreover, the integration of RUL estimation into fleet management opens opportunities for predictive maintenance strategies.
4. Conclusions
This paper presented how different methodologies can be exploited to estimate State of Charge (SoC) applied to a full-electric vehicle fleet. While traditional model-based (MB) observers continue to demonstrate strong reliability and accuracy, they rely heavily on the availability of detailed physical models and precise knowledge of system parameters, such as internal resistance, capacity, and thermal behavior. This increases model complexity, which is translated into computational burden, and makes them less adaptable in practical scenarios where such parameters are not always accessible or can vary significantly due to aging, environmental conditions, or manufacturing variability. Moreover, the calibration process for observers can be time-consuming and resource-intensive, which limits their scalability when applied to large and heterogeneous vehicle fleets. Machine Learning (ML) approaches, on the other hand, present a more scalable and flexible alternative for battery monitoring, as they can directly learn patterns and relationships from data without requiring the explicit modeling of the underlying electrochemical processes. This data-driven nature makes them particularly suitable for real-world transport systems, where variability in driving cycles, operational conditions, and battery health states is inherent. However, when dealing with a strongly reduced availability of data, these methods can lead to reliable predictions but with an overestimation of the real outcome. Several limitations and assumptions were discussed for the effects on the prediction, especially regarding efforts in improving the quality of the dataset. After several adjustments, the proposed ML model achieved sufficient accuracy levels with RMSE < 0.3%, comparable to performances shown by traditional observers. Despite the great variety of ML algorithms that can better fit with the case considered, this emphasizes that a detailed dataset is mandatory to increase the validity of the outcome. Additionally, ML methods can be updated or retrained as new data becomes available, allowing them to adapt dynamically to evolving conditions and extend their applicability over the lifetime of the fleet. As a future development, based on the results obtained, these methods can be extended to predict the Remaining Useful Life (RUL) of batteries equipping a full-electric bus fleet to predict whether the actual operations are compliant with the maintenance constraints, thus preventing early battery replacement.
Author Contributions
Conceptualization, S.V. and A.D.M.; methodology, S.V. and A.D.M.; software, S.V.; validation, S.V., A.D.M. and M.L.; formal analysis, S.V.; investigation, S.V.; resources, A.D.M. and M.L.; data curation, S.V. and A.D.M.; writing—original draft preparation, S.V. and A.D.M.; writing—review and editing, A.D.M.; visualization, S.V.; supervision, M.L.; project administration, M.L.; funding acquisition, M.L. All authors have read and agreed to the published version of the manuscript.
Funding
This research was funded in part by the Centro Nazionale per Mobilitá Sostenibile (MOST)—Sustainable Mobility Center and in part by the European Union Next-Generation EU (Piano Nazionale di Ripresa e Resilienza (PNRR)—Missione 4 Componente 2, Investimento 1.4—D.D. 1033 17/06/2022) under Grant number CN00000023.
Informed Consent Statement
Not applicable.
Data Availability Statement
The datasets presented in this article are not readily available because the data are part of an ongoing study or due to technical limitations.
Conflicts of Interest
The authors declare no conflicts of interest.
References
- International Energy Agency. Global EV Outlook 2024: Moving Towards Increased Affordability; OECD Publishing: Paris, France, 2024. [Google Scholar]
- International Energy Agency. Global EV Outlook 2025: Expanding Sales in Diverse Markets; OECD Publishing: Paris, France, 2025. [Google Scholar]
- Mavlonov, J.; Ruzimov, S.; Tonoli, A.; Amati, N.; Mukhitdinov, A. Sensitivity Analysis of Electric Energy Consumption in Battery Electric Vehicles with Different Electric Motors. World Electr. Veh. J. 2023, 14, 36. [Google Scholar] [CrossRef]
- Unione Nazionale Rappresentanti Autoveicoli Esteri. Statistical Data of Vehicle Enrollment. 2024. Available online: https://unrae.it/files/AnnualReportUNRAE_2024_68628e8314caf.pdf (accessed on 20 October 2025).
- Azienda Trasporti Milanesi, S.p.A. Relazione Annuale Integrata 2023. 2024. Available online: https://www.atm.it/it/IlGruppo/Financial_information/Documents/relazione%20Annuale%20Integrata%20Gruppo%20ATM%202023.pdf (accessed on 20 October 2025).
- X, E. Torino, in Collina il Bus è Elettrico con GTT, Cavourese ed Enel X. 2024. Available online: https://www.enelx.com/it/it/comunicati-stampa/2023/04/nuovi-bus-elettrici-torino (accessed on 17 February 2025).
- Sanguesa, J.A.; Torres-Sanz, V.; Garrido, P.; Martinez, F.J.; Marquez-Barja, J.M. A review on electric vehicles: Technologies and challenges. Smart Cities 2021, 4, 372–404. [Google Scholar] [CrossRef]
- Siemens Mobility. e-Highway—Electrification of Road Freight Transport. 2023. Available online: https://assets.new.siemens.com/siemens/assets/api/uuid:760942b4-5661-43c1-b9f8-079741d12e6e/smo-Factsheet-Road-Freight-Transport-eHighway.pdf (accessed on 20 October 2025).
- Colombo, C.G.; Ota, R.; Longo, M. Optimized Electric Vehicles Wireless Charging: Applicative Models for Supporting Decision Makers. IEEE Open J. Veh. Technol. 2025, 6, 897–911. [Google Scholar] [CrossRef]
- Enge, P.; Enge, N.; Zoepf, S. Electric Vehicle Engineering, 2nd ed.; McGraw Hill: New York, NY, USA, 2021. [Google Scholar]
- A35 BreBeMi-Aleatica. Comunicato Stampa—Arena del Futuro: La Ricarica ad Induzione Pronta a Sviluppi Commerciali, 2022. Available online: https://www.brebemi.it/wp-content/uploads/2022/06/Comunicato_ERS_100622.pdf (accessed on 20 October 2025).
- Kumar, R.R.; Bharatiraja, C.; Udhayakumar, K.; Devakirubakaran, S.; Sekar, S.; Mihet-Popa, L. Advances in batteries, battery modeling, battery management system, battery thermal management, SOC, SOH, and charge/discharge characteristics in EV applications. IEEE Access 2023, 11, 105761–105809. [Google Scholar] [CrossRef]
- Saqli, K.; Bouchareb, H.; M’sirdi, K.N.; Naamane, A.; Oudghiri, M. Electric and Thermal Model of Li-ion battery pack with cylindrical components. In Proceedings of the 2020 5th International Conference on Renewable Energies for Developing Countries (REDEC), Marrakech, Morocco, 29–30 June 2020; IEEE: Piscataway, NJ, USA, 2020; pp. 1–6. [Google Scholar]
- Zhou, W.; Zheng, Y.; Pan, Z.; Lu, Q. Review on the battery model and SOC estimation method. Processes 2021, 9, 1685. [Google Scholar] [CrossRef]
- Hu, J.; Hu, J.; Lin, H.; Li, X.; Jiang, C.; Qiu, X.; Li, W. State-of-charge estimation for battery management system using optimized support vector machine for regression. J. Power Sources 2014, 269, 682–693. [Google Scholar] [CrossRef]
- Park, S.J.; Song, Y.W.; Kang, B.S.; Kim, W.J.; Choi, Y.J.; Kim, C.; Hong, Y.S. Depth of discharge characteristics and control strategy to optimize electric vehicle battery life. J. Energy Storage 2023, 59, 106477. [Google Scholar] [CrossRef]
- Xiong, R.; Cao, J.; Yu, Q.; He, H.; Sun, F. Critical review on the battery state of charge estimation methods for electric vehicles. IEEE Access 2017, 6, 1832–1843. [Google Scholar] [CrossRef]
- Clemente, A.; Cecilia, A.; Costa-Castelló, R. SOC and diffusion rate estimation in redox flow batteries: An I&I-based high-gain observer approach. In Proceedings of the 2021 European Control Conference (ECC), Virtual, 29 June–2 July 2021; pp. 1640–1644. [Google Scholar] [CrossRef]
- Bouchareb, H.; Saqli, K.; M’Sirdi, N.K.; Oudghiri, M. Observer Design for SOC Estimation of Li-ion Batteries Based on Electro-Thermal Coupled Model. In Proceedings of the 2021 9th International Renewable and Sustainable Energy Conference (IRSEC), Virtual, 23–27 November 2021; pp. 1–6. [Google Scholar] [CrossRef]
- Saeed, M.; Khalatbarisoltani, A.; Deng, Z.; Liu, W.; Altaf, F.; Lu, S.; Hu, X. Comparative Analysis of Control Observer-Based Methods for State Estimation of Lithium-Ion Batteries in Practical Scenarios. IEEE/ASME Trans. Mechatronics 2024, 30, 1–13. [Google Scholar] [CrossRef]
- Gholizadeh, M.; Yazdizadeh, A.; Rahmati, M.; Aliabadi, A. SOC estimation for a lithium-ion battery by designing a nonlinear observer based on an equivalent circuit model. In Proceedings of the 2017 IEEE 15th International Conference on Industrial Informatics (INDIN), Emden, Germany, 24–26 July 2017; pp. 628–632. [Google Scholar] [CrossRef]
- Hu, X.; Sun, F.; Zou, Y. Estimation of state of charge of a lithium-ion battery pack for electric vehicles using an adaptive Luenberger observer. Energies 2010, 3, 1586–1603. [Google Scholar] [CrossRef]
- Lagraoui, M.; Doubabi, S.; Rachid, A. SOC estimation of Lithium-ion battery using Kalman filter and Luenberger observer: A comparative study. In Proceedings of the 2014 International renewable and sustainable energy conference (IRSEC), Ouarzazate, Morocco, 17–19 October 2014; IEEE: Piscataway, NJ, USA, 2014; pp. 636–641. [Google Scholar]
- Wei, J.; Dong, G.; Chen, Z. On-board adaptive model for state of charge estimation of lithium-ion batteries based on Kalman filter with proportional integral-based error adjustment. J. Power Sources 2017, 365, 308–319. [Google Scholar] [CrossRef]
- Korkmaz, M. SoC estimation of lithium-ion batteries based on machine learning techniques: A filtered approach. J. Energy Storage 2023, 72, 108268. [Google Scholar] [CrossRef]
- Chandran, V.; Patil, C.K.; Karthick, A.; Ganeshaperumal, D.; Rahim, R.; Ghosh, A. State of charge estimation of lithium-ion battery for electric vehicles using machine learning algorithms. World Electr. Veh. J. 2021, 12, 38. [Google Scholar] [CrossRef]
- Liu, F.; Liu, T.; Fu, Y. An improved SoC estimation algorithm based on artificial neural network. In Proceedings of the 2015 8th International Symposium on Computational Intelligence and Design (ISCID), Hangzhou, China, 12–13 December 2015; IEEE: Piscataway, NJ, USA, 2015; Volume 2, pp. 152–155. [Google Scholar]
- Center for Advanced Life Cycle Engineering CALCE Battery Data. 2016. Available online: https://calce.umd.edu/battery-data (accessed on 1 March 2025).
- Zou, Z.; Xu, J.; Mi, C.; Cao, B.; Chen, Z. Evaluation of model based state of charge estimation methods for lithium-ion batteries. Energies 2014, 7, 5065–5082. [Google Scholar] [CrossRef]
- Huang, H.; Zhang, Z.; Guo, C.; Ge, L. SOC Estimation of Lithium Battery Based on Extended Kalman Filter Optimized by Recurrent Neural Network. In Proceedings of the 2022 China International Conference on Electricity Distribution (CICED), Changsha, China, 7–8 September 2022; IEEE: Piscataway, NJ, USA, 2022; pp. 41–46. [Google Scholar]
- Hussein, A.A.; Salih, S.S.; Ghasm, Y.G. Implementation of proportional-integral-observer techniques for load frequency control of power system. Procedia Comput. Sci. 2017, 109, 754–762. [Google Scholar] [CrossRef]
- Kim, I.S. The novel state of charge estimation method for lithium battery using sliding mode observer. J. Power Sources 2006, 163, 584–590. [Google Scholar] [CrossRef]
- Chaoui, H.; Sicard, P. Accurate state of charge (SOC) estimation for batteries using a reduced-order observer. In Proceedings of the 2011 IEEE International Conference on Industrial Technology, Auburn, AL, USA, 14–16 March 2011; pp. 39–43. [Google Scholar] [CrossRef]
- Xu, J.; Mi, C.C.; Cao, B.; Deng, J.; Chen, Z.; Li, S. The state of charge estimation of lithium-ion batteries based on a proportional-integral observer. IEEE Trans. Veh. Technol. 2013, 63, 1614–1621. [Google Scholar] [CrossRef]
- Baccouche, I.; Jemmali, S.; Manai, B.; Omar, N.; Essoukri Ben Amara, N. Improved OCV model of a Li-ion NMC battery for online SOC estimation using the extended Kalman filter. Energies 2017, 10, 764. [Google Scholar] [CrossRef]
- Zhao, T.; Jiang, J.; Zhang, C.; Zheng, L.; Wen, F. Error analysis of SOC estimation based on PI observer. In Proceedings of the 2014 IEEE Conference and Expo Transportation Electrification Asia-Pacific (ITEC Asia-Pacific), Beijing, China, 31 August–3 September 2014; pp. 1–5. [Google Scholar] [CrossRef]
- Matlab, M. Machine Learning—Matlab Tools. 2025. Available online: https://it.mathworks.com/solutions/machine-learning.html (accessed on 22 March 2025).
- iLMeteo s.r.l. Archivio Meteo Storico. 2025. Available online: https://www.ilmeteo.it/portale/archivio-meteo (accessed on 14 April 2025).
- Jawaad, H.M.; Saeed, M.; Malik, A.N.; Khalatbarisoltani, A.; Elahi, H.; Khan, U.S. Physics-Informed Machine Learning for State of Charge Estimation of Lithium-Ion Batteries. In Proceedings of the 2024 International Conference on Robotics and Automation in Industry (ICRAI), Nagoya, Japan, 19–21 December 2024; pp. 1–6. [Google Scholar] [CrossRef]
- Cheng Lam, D.H.; Seng Lim, Y.; Hau, L.C.; Wong, J. Long Short-Term Memory Recurrent Neural Network for Estimating State of Charge of Energy Storage System for Grid Services. In Proceedings of the 2022 4th International Conference on Smart Power & Internet Energy Systems (SPIES), Beijing, China, 27–30 October 2022; pp. 1887–1894. [Google Scholar] [CrossRef]
- Reza, M.; Mannan, M.; Mansor, M.; Ker, P.J.; Mahlia, T.I.; Hannan, M. Recent advancement of remaining useful life prediction of lithium-ion battery in electric vehicle applications: A review of modelling mechanisms, network configurations, factors, and outstanding issues. Energy Rep. 2024, 11, 4824–4848. [Google Scholar] [CrossRef]
- Rauf, H.; Khalid, M.; Arshad, N. Machine learning in state of health and remaining useful life estimation: Theoretical and technological development in battery degradation modelling. Renew. Sustain. Energy Rev. 2022, 156, 111903. [Google Scholar] [CrossRef]
- Saxena, S.; Xing, Y.; Kwon, D.; Pecht, M. Accelerated degradation model for C-rate loading of lithium-ion batteries. Int. J. Electr. Power Energy Syst. 2019, 107, 438–445. [Google Scholar] [CrossRef]
- Qu, J.; Jiang, Z.; Zhang, J. Investigation on lithium-ion battery degradation induced by combined effect of current rate and operating temperature during fast charging. J. Energy Storage 2022, 52, 104811. [Google Scholar] [CrossRef]
- Yüksek, G.; Alkaya, A. Effect of the Depth of Discharge and C-Rate on Battery Degradation and Cycle Life. In Proceedings of the 2023 14th International Conference on Electrical and Electronics Engineering (ELECO), Bursa, Turkey, 30 November–2 December 2023; IEEE: Piscataway, NJ, USA, 2023; pp. 1–5. [Google Scholar]
- Guo, Z.; Chen, Z. Aging property for LiFePO4/graphite cell with different temperature and DODs. Russ. J. Electrochem. 2016, 52, 546–554. [Google Scholar] [CrossRef]


Disclaimer/Publisher’s Note: The statements, opinions and data contained in all publications are solely those of the individual author(s) and contributor(s) and not of MDPI and/or the editor(s). MDPI and/or the editor(s) disclaim responsibility for any injury to people or property resulting from any ideas, methods, instructions or products referred to in the content. |
© 2025 by the authors. Licensee MDPI, Basel, Switzerland. This article is an open access article distributed under the terms and conditions of the Creative Commons Attribution (CC BY) license (https://creativecommons.org/licenses/by/4.0/).