1. Introduction
With the large-scale integration of renewable energy, the operating conditions and control characteristics of power systems are undergoing profound changes. Traditional power systems rely on large synchronous generators to provide rotational inertia and primary frequency control, thereby maintaining frequency stability in the presence of disturbances [
1]. However, power-electronics–interfaced resources such as wind power, photovoltaic generation, and energy storage are gradually replacing a portion of synchronous units, markedly reducing system inertia and introducing new challenges to frequency stability [
2,
3]. In islanded microgrids in particular, limited system capacity, insufficient reserves, and the strong variability in renewable outputs [
4] make frequency security issues especially acute, highlighting an urgent need for comprehensive assessments that jointly consider reliability and frequency characteristics [
5].
Current microgrid reliability studies predominantly employ simulation-based and analytical approaches. Analytical methods, which typically rely on computing failure (state) transition rates, cannot provide reliability indices that explicitly depend on system frequency and time. In fact, the post-disturbance frequency recovery of an islanded microgrid is highly contingent on the frequency-regulation performance and control characteristics of its constituent units; if the frequency deviation exceeds preset thresholds, it may trigger under-frequency load shedding or even system tripping. Traditional static reliability indices thus struggle to fully represent the security level of a microgrid during dynamic operation. In addition, the stochastic nature introduced by renewable energy resources must be addressed—accounting for forced outages and random power outputs—while the state of charge of energy storage systems exhibits pronounced temporal dependence. Consequently, the sequential Monte Carlo method is better suited to contemporary microgrid reliability assessment, albeit at the cost of substantial computational time.
In recent years, extensive research has been conducted on microgrid reliability, frequency security, and renewable energy variability. Reference [
6] employs a Markov process to model the output uncertainty of wind power and energy storage, analyzing its effect on supply reliability; however, it does not account for post-disturbance frequency excursions. Regarding frequency stability, ref. [
7] introduces a reliability assessment framework based on a system frequency response model, which correlates unit failure and repair rates with frequency deviations to enable integrated frequency-reliability evaluation. Nonetheless, the case studies in [
7] adopt piecewise correction methods that are unsuitable for complex time-sequential simulations. References [
8,
9] propose frequency-security metrics such as the number of under-frequency events, their duration, and the probability of low-frequency recovery. These approaches, however, rely on analytical approximations or static simulations and fail to adequately represent the dynamic operational constraints of microgrids. Reference [
10] applies sequential Monte Carlo simulation to model the temporal processes of unit failure and repair, incorporating real-world wind speed and load time series. Despite this, it only considers power fluctuations from renewable resources and overlooks the feedback effect of frequency on unit reliability. Reference [
11] proposes a stochastic method for risk aversion based on weather routing, which provides a new idea for multi-energy co-optimization. However, the method mainly focuses on the operational optimization level, lacks an in-depth analysis of the system dynamic characteristics, especially the frequency stability, and does not consider the feedback effect of frequency fluctuation on equipment reliability. Reference [
12] proposed an N-1 assessment framework for the integrated electric-gas system considering the information physical dependence, which reveals the coupling relationship between the energy system and the information system. However, the study focused on static safety assessment and failed to react to the dynamic response process of the system under perturbation.
The main contribution of this paper is the development of an equipment reliability model considering frequency variations and the proposal of a sequential Monte Carlo simulation method that introduces a frequency response model of the system, which overcomes the limitations of traditional static assessment methods. On the basis of this, this paper presents a comprehensive reliability assessment approach for islanded microgrids that incorporates frequency-dependent effects. An integrated SFR model is developed, encompassing diesel generators, gas turbines, energy storage systems, and wind turbines. A frequency-adaptive adjustment mechanism for unit failure and repair rates is introduced, along with an under-frequency load-shedding strategy. On this basis, the sequential Monte Carlo method is employed to simulate long-term operational scenarios, simultaneously capturing stochastic unit outages, repairs, and fluctuations in renewable generation and load. The proposed framework evaluates both supply reliability and frequency security under various operating conditions, generating a set of corresponding reliability and frequency-security indices. Results demonstrate that the operational reliability of islanded microgrids is closely coupled with frequency regulation measures. The impact of system frequency on unit failure rates proves non-negligible in reliability assessments, offering theoretical insights and methodological support for subsequent system planning and operational optimization.
2. SFR Model of Islanded Microgrid
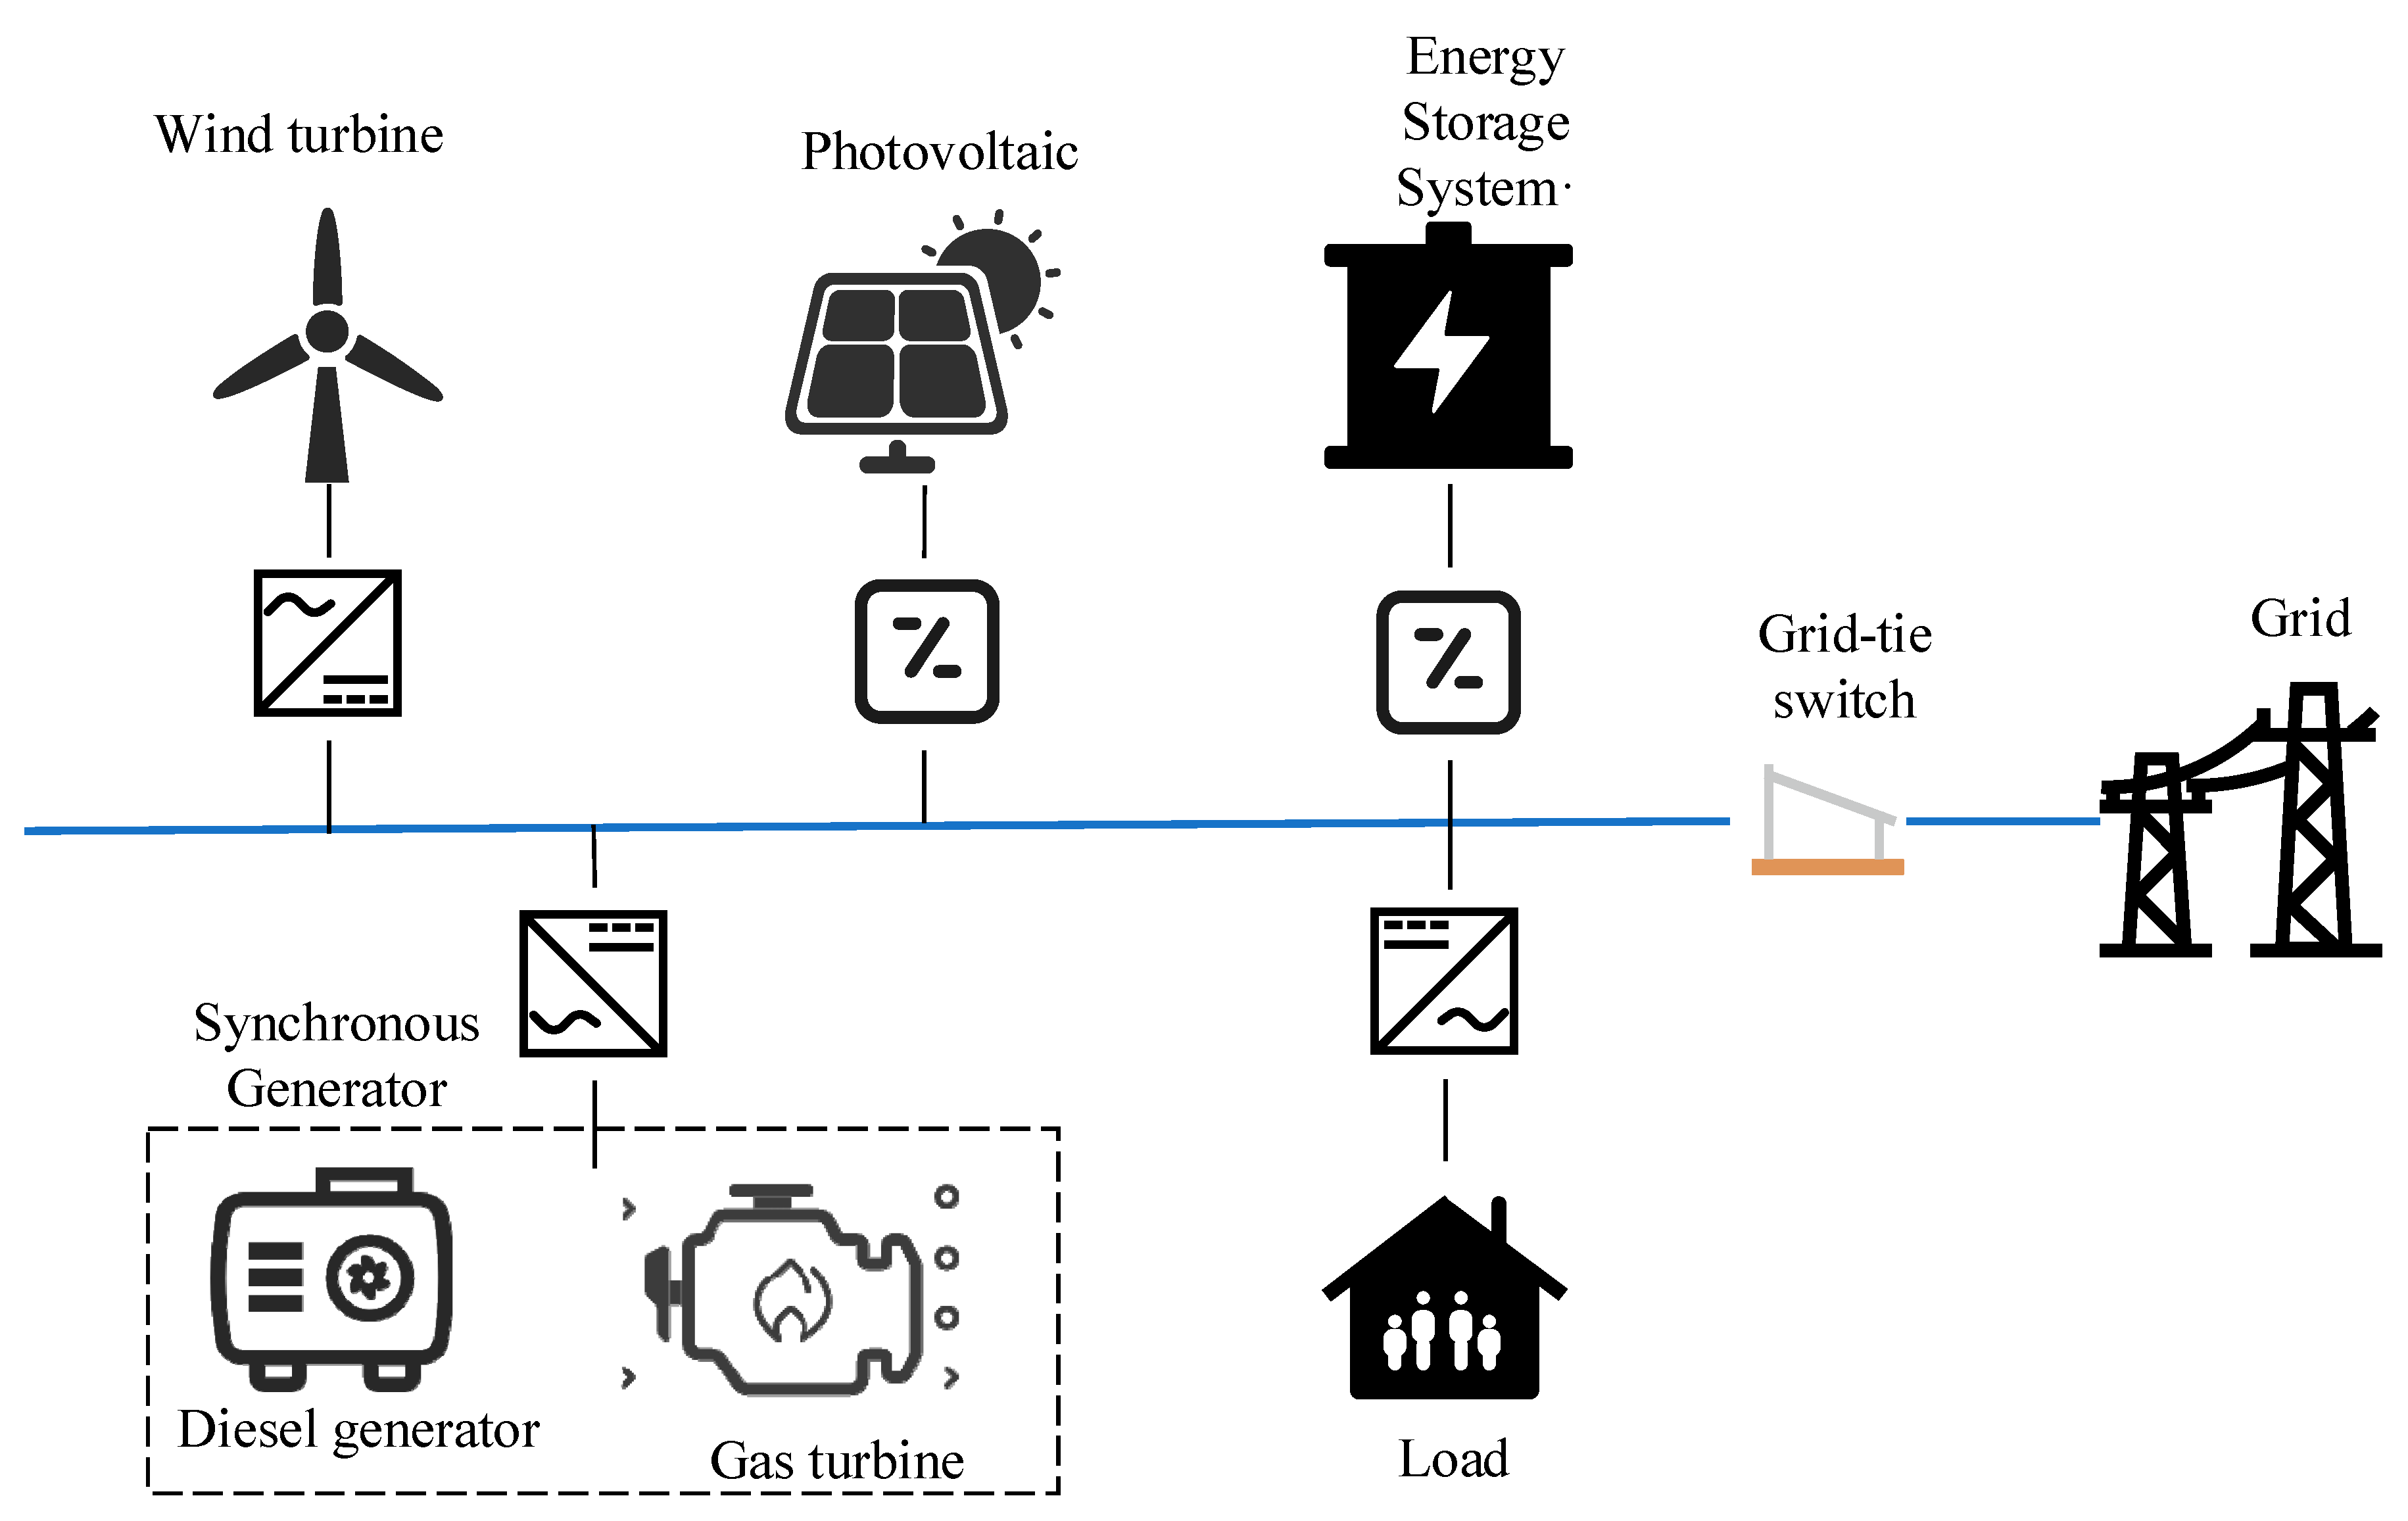
The frequency behavior of a microgrid depends on the types of sources and loads it comprises. Synchronous generator units exhibit pronounced frequency-droop characteristics and load regulation effects, whereas the frequency behavior of converter-interfaced sources is determined by their control models. Therefore, clarifying the characteristics of each type of source within the microgrid is a prerequisite for reliability studies. In this section, we first establish an islanded microgrid system frequency response model that includes both synchronous generator units and converter-interfaced sources. The synchronous units consist of diesel generators and gas turbines, while the converter-interfaced sources include an energy storage system and wind turbine generators. A typical microgrid system architecture is shown in
Figure 1.
2.1. Diesel Generator/Gas Turbine
Diesel generators and gas turbines are typical rotating synchronous generation sources in microgrids. Their operation relies on fossil fuels, and the fuel supply is generally assumed to be sufficiently ample. The rotor speed of these units operates at synchronous speed; when the external active power demand increases, the unit’s active power output rises. In the unit’s control model, this is reflected as an increase in electromagnetic torque, which causes a drop in rotor speed. The governor system then increases the mechanical torque in response to the sensed speed decrease to raise the unit speed; once the mechanical and electromagnetic torques are rebalanced, the speed—and hence the frequency—stabilizes.
The frequency dynamics of diesel generators and gas turbines are jointly determined by rotor inertia and primary frequency control. The diesel generator is modeled using a first-order prime-mover model, as in Equation (1) [
13].
where
S denotes the unit (rated) capacity; R is the primary frequency-droop coefficient;
is the governor time constant, characterizing the dynamic response speed of the diesel governor; and
is the prime-mover time constant, representing the dynamic lag due to diesel-engine combustion and the inertia of mechanical output.
For typical small- to medium-sized diesel generators, the dynamic response is relatively fast but constrained by the mechanical subsystem and combustion dynamics. In accordance with IEEE interconnection performance requirements for distributed resources, their ramp rate does not exceed 20% p.u./min.
The gas turbine is modeled using the GGOV1 model, as in Equation (2) [
14].
where
is the combustor time constant, describing the lag of the working gas along the combustion path;
is the inertia-coupling time constant, reflecting the lead behavior induced by the air/fuel-gas dynamics within the turbine; and
is the turbine mechanical time constant, representing the inertial lag associated with the gas turbine’s mechanical energy conversion process.
For gas-turbine generator units, power ramp-up is constrained by combustion stability and thermal stress, and the ramp rate does not exceed 10% p.u./min.
2.2. Wind-Driven Generator
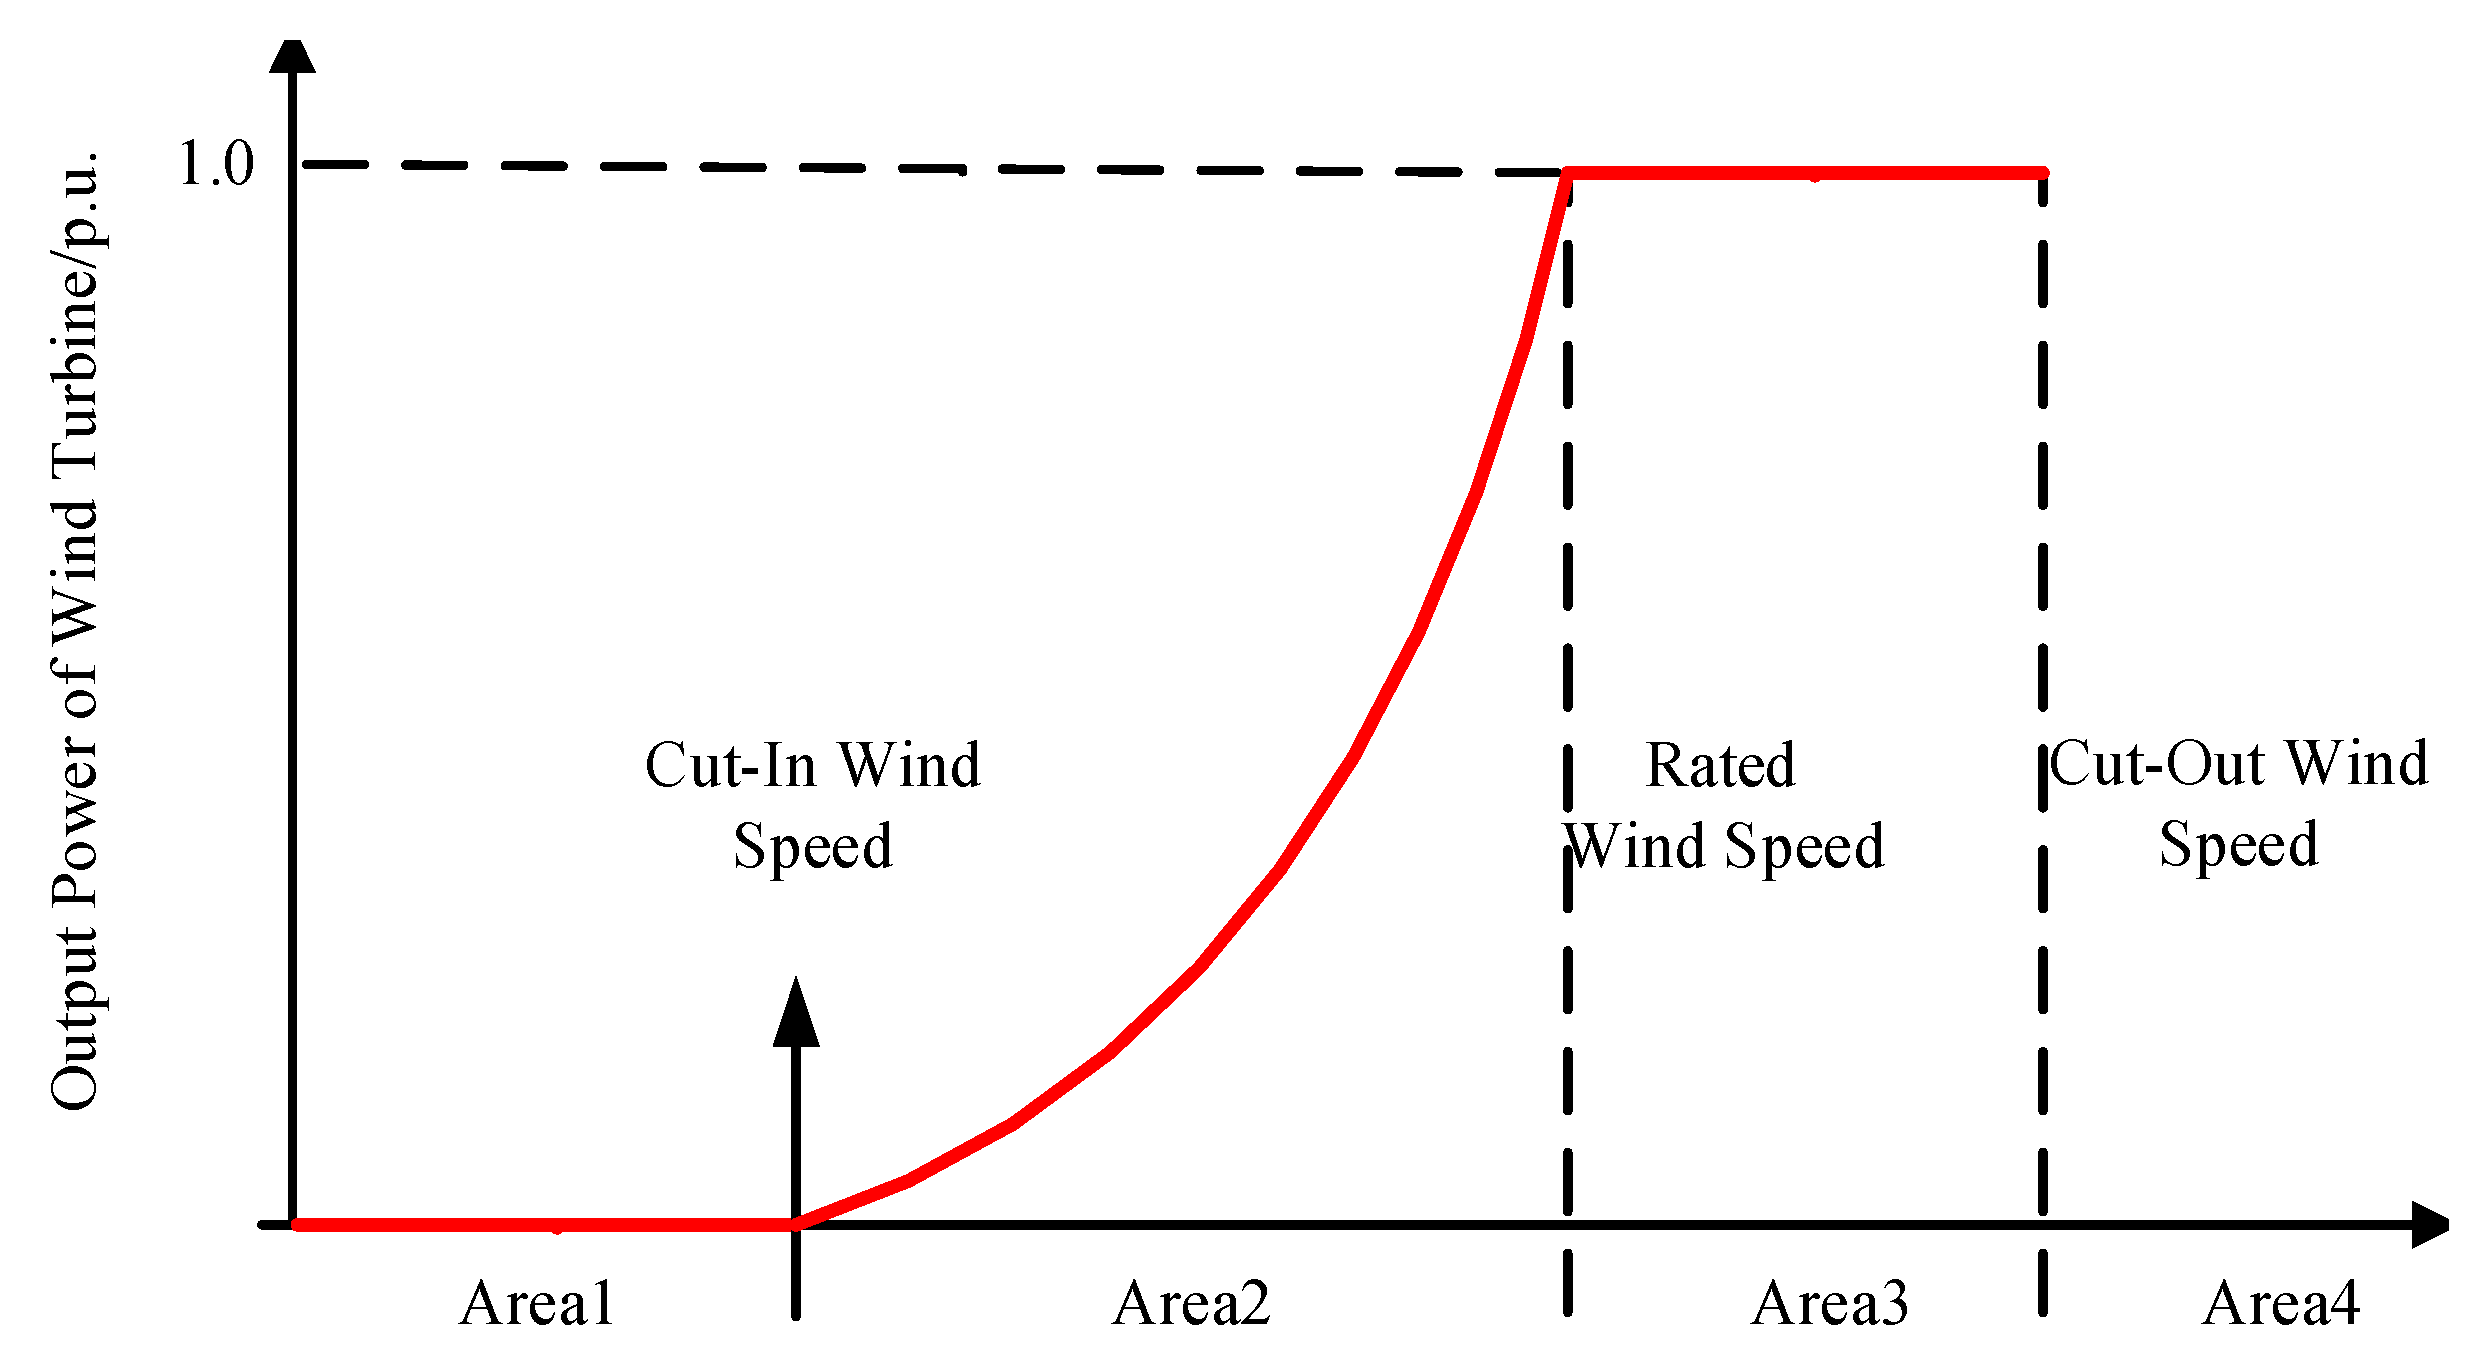
This study employs a doubly fed induction generator wind turbine for simulation. The turbine’s output power is strongly correlated with wind speed. Depending on the ambient wind speed, the DFIG operates in four regions, as shown in
Figure 2: when the wind speed is below the cut-in threshold, the turbine remains shut down; once the wind speed reaches the cut-in speed, the turbine starts and operates under maximum power point tracking, maintaining the power coefficient Cp at its maximum; in the constant-power region, the generator torque is limited to its rated value and the blade pitch angle is adjusted to reduce Cp so as to deliver the rated power; when the wind speed exceeds the cut-out threshold, the turbine is shut down to avoid faults.
The wind turbine generator mathematical model comprises the aerodynamic model, drivetrain model, generator power control model, and pitch-angle control model. The aerodynamic power captured by the rotor from the wind is calculated as follows:
where
,
,
,
,
, and
denote the air density, rotor radius, power coefficient, tip-speed ratio, pitch angle, and wind speed, respectively.
The power coefficient
is a function of
and
; a commonly used empirical fitting formula is given by [
15]:
In the equation, is the intermediate variable, and is the blade rotational speed. Equations (3)–(6) constitutes the aerodynamic model for fan blades.
Current wind turbine drivetrain models include single-mass, two-mass, three-mass, and six-mass representations. In this study, a two-mass drivetrain model is adopted, and the governing equations are given by:
In the equation, represents the rotor inertia, represents the generator inertia, represents the equivalent inertia of the wind turbine, represents the generator rotational speed, represents the mechanical torque, represents the main shaft torque, represents the electromagnetic torque, represents the transmission chain torque, represents the main shaft elasticity coefficient, represents the main shaft viscous friction coefficient, and represents the gearbox transmission ratio. Equations (5)–(9) constitute the motion model of the wind turbine rotor.
When wind turbines participate in frequency regulation, control strategies include droop control, virtual inertia control, and combined inertia control. This study adopts the combined inertia control, and the frequency-regulation power of each turbine is given by:
In the equation, represents the system frequency deviation, and denote the primary frequency regulation coefficients of the wind turbine generator.
The output of wind turbines is controlled by converters, enabling rapid response. However, due to potential mechanical shocks causing fatigue loads and mechanical impacts, their ramping speed typically does not exceed 20% p.u./min.
2.3. Energy Storage System
Given that the storage capacity in microgrids is constrained by power electronic hardware, the energy storage system in this study is assumed to provide inertial response only. Virtual inertia control enables the ESS to emulate the inertial behavior of synchronous generators, thereby increasing the system inertia time constant, reducing the rate of change in frequency, and slowing the deterioration of frequency following disturbances. A derivative-based control law is employed to operate the ESS and deliver virtual inertia support, as shown in
Figure 3.
A deadband prevents the energy storage system from responding to small frequency deviations. A low-pass filter is also applied to remove noise from the frequency-derivative signal, as derivative control is highly sensitive to noise. The per-unit output PIR is limited to ±1 p.u. The power injected into the grid by the ESS under virtual inertia control can be calculated as:
where
is the virtual inertia response coefficient of the energy storage system,
and
are the filter time constants.
The ESS output is likewise controlled by power converters and therefore responds rapidly; its ramp rate can reach up to 100% p.u./min.
2.4. Microgrid SFR Model
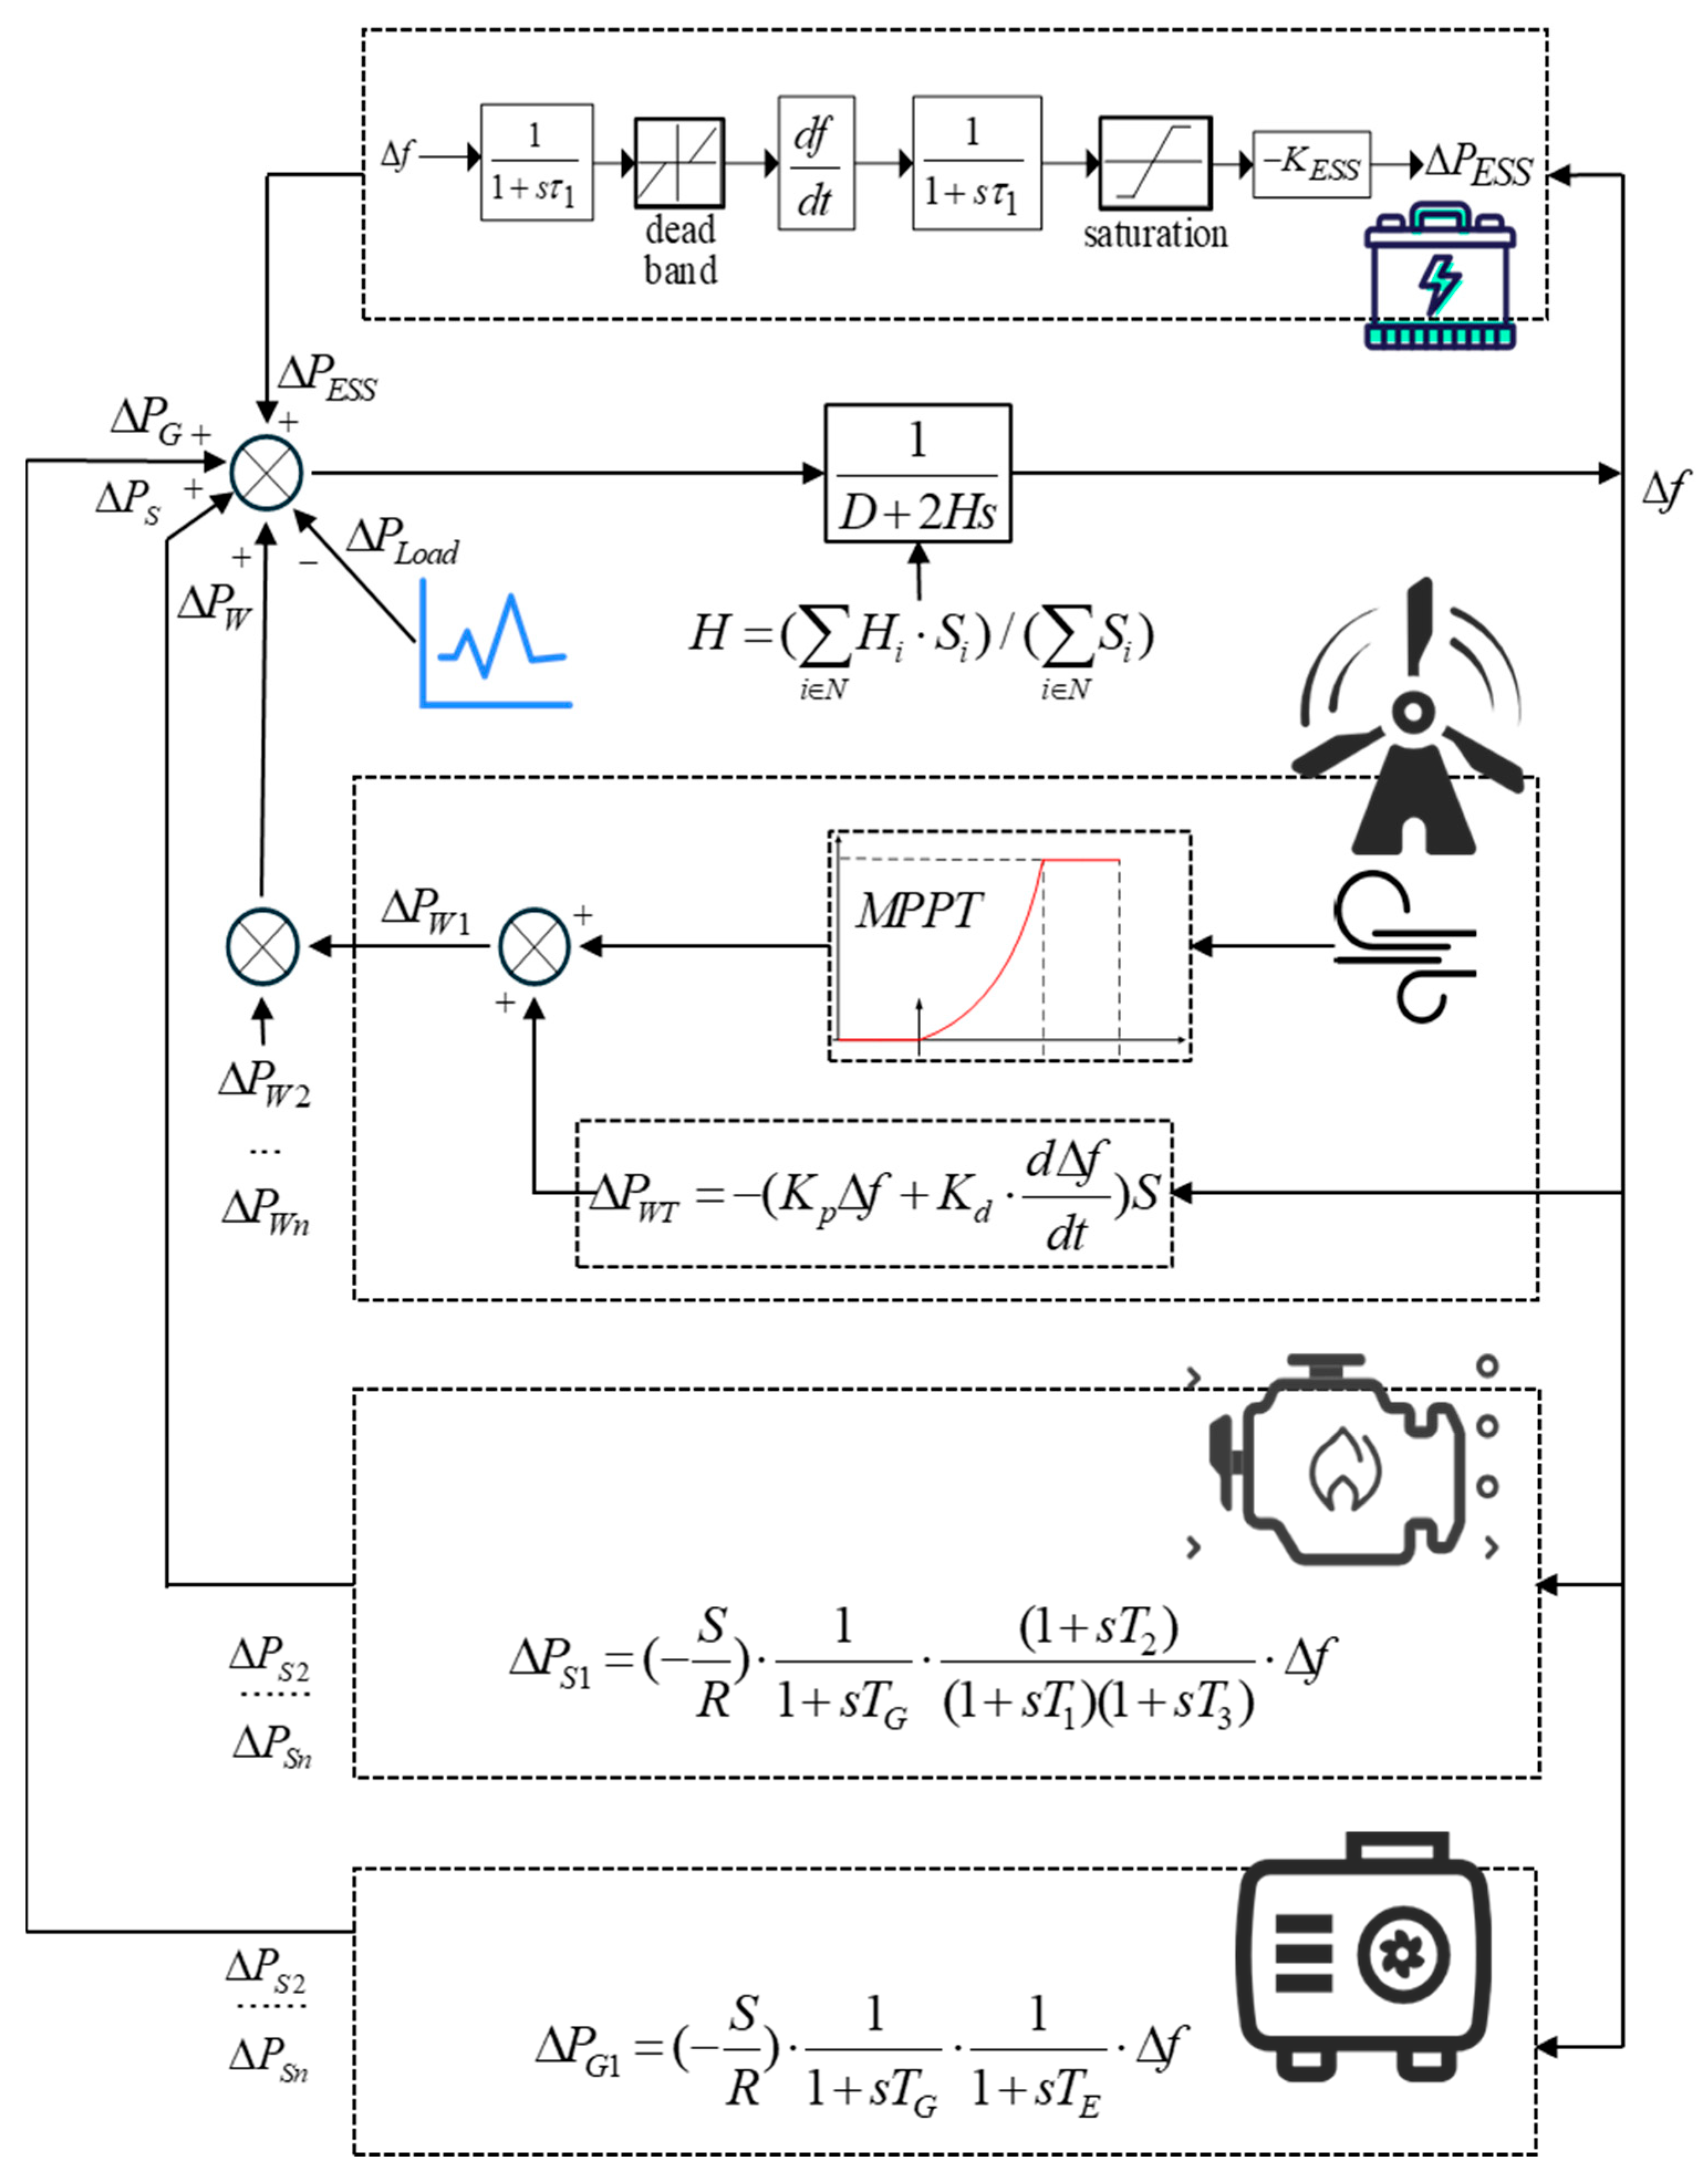
By integrating the above component models of the diesel generator, steam-turbine generator, wind turbine generator, and energy storage system, this paper constructs a frequency-control model for islanded operation, as illustrated in
Figure 4.
When a power imbalance causes a frequency deviation in the microgrid, each component adjusts its output to prevent excessive deviations. The system’s equivalent inertia constant is computed as a capacity-weighted combination of the inertia time constants of the synchronous generators in service, as given by the corresponding formula.
where
denotes the set of synchronous generating units operating normally at the current time,
represents the inertia time constant of the normally operating synchronous generating unit i, and
denotes the rated capacity of the normally operating synchronous generating unit i.
3. Assessment Method of Reliability
3.1. Correction of Unit Maintenance Failure Rate Considering Frequency Deviation
The ESS tracks the grid frequency via the inverter’s phase-locked loop (PLL). When frequency deviations become large, the control effort and switching stress increase, which may trigger overcurrent/overtemperature protection but seldom causes immediate failures. The impact of frequency deviations on the ESS primarily manifests as lifetime degradation; therefore, in this study the ESS failure rate is assumed to be independent of frequency. Likewise, wind turbine generators (WTGs) are decoupled from the microgrid through power converters and typically only invoke power-limiting or shutdown protections under large frequency excursions; hence, the WTG failure rate is also assumed frequency-independent. In other words, for converter-interfaced units such as WTGs and ESSs, we assume frequency-independent failure rates in view of their decoupling characteristics.
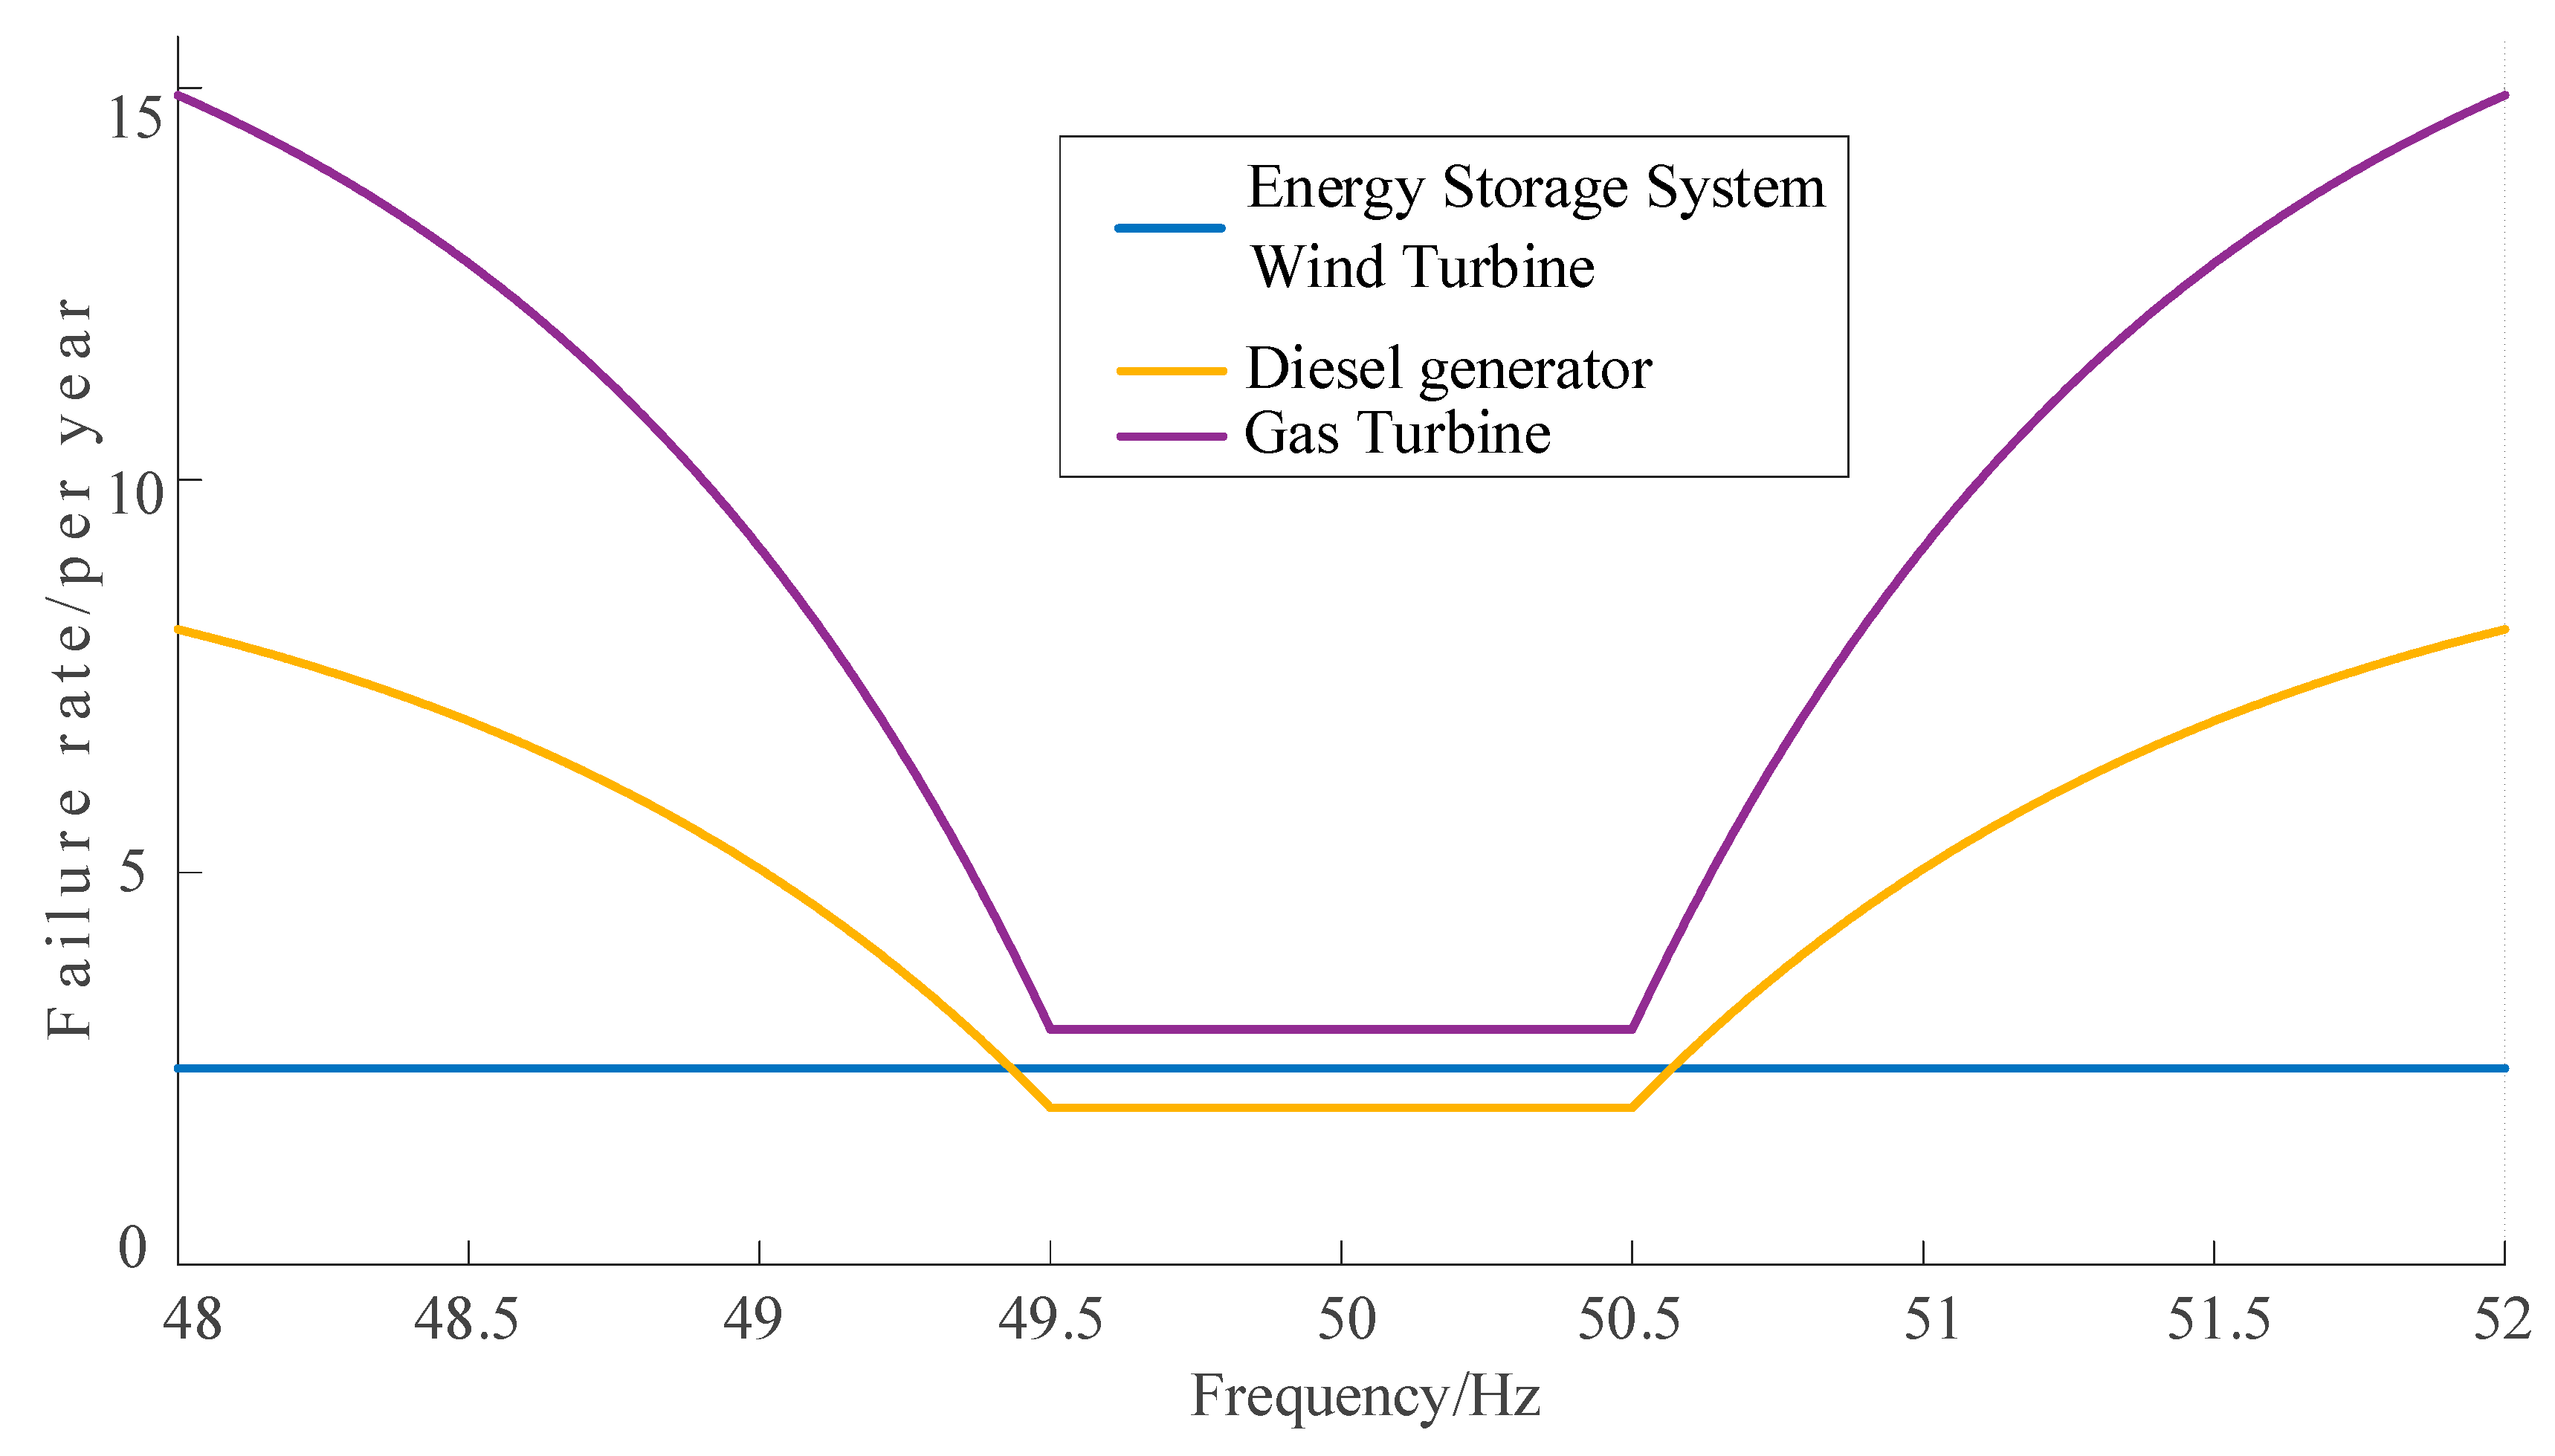
By contrast, the rotors of synchronous machines such as diesel generators and gas turbines are directly coupled to the microgrid. Frequency deviations translate into speed deviations, which in turn elevate the risk of mechanical stress, torque oscillations, and inadequate cooling, among other failure mechanisms. Following the frequency-excursion classes and tiered multipliers for failure rates reported by [
16], we construct a continuous frequency-dependent function for the failure rate of each unit type to enable failure-rate correction, with the correction given by the corresponding formula.
where
is the failure rate multiplier,
is the frequency deviation limit multiplier,
is the shape parameter,
is the frequency health dead zone, and
is the base failure rate. The setting of
is based on the frequency tolerance criterion for synchronous generating sets, which indicates that the risk of equipment failure may increase to
times the base value in case of frequency deviation. The shape parameter
is the rate at which the failure rate grows with frequency deviation from the deadband
, indicating the increase in risk as the frequency crosses the limit. The deadband
is typically set to 0.5 Hz, indicating that frequency fluctuations within this range are considered normal operating conditions and do not increase the risk of equipment failure. The failure rate frequency curve is shown in
Figure 5 and characteristic data used in this paper are shown in
Table 1.
Under standard assumptions, unit failures are considered memoryless; consequently, the operating time and outage time can be sampled accordingly, with the sampling formulas given as follows:
TTF denotes the time-to-failure, TTR represents the time-to-repair, and R is a random number between 0 and 1 obtained through sampling. Considering the temporal characteristics of failure rates, repairs do not occur precisely after TTR elapses following a failure. This paper introduces safety thresholds and repair thresholds, which involve performing temporal integration on failure rates and repair rates, triggering a switch when the threshold is reached.
3.2. Load Shedding Strategy
In islanded microgrids, limited inertia and reserve margins mean that relying solely on generator-provided frequency regulation to suppress the maximum rate of change in frequency (RoCoF) and frequency deviations may be insufficient to maintain stability and security. To confine contingencies within a controllable range, prevent frequency collapse, and preserve system stability, load shedding offers a rapid and effective measure. By shedding load, the probability of frequency limit violations can be substantially reduced, converting unavoidable supply interruptions into controllable, staged load curtailments.
This study adopts a staged under-frequency load shedding scheme. Multiple frequency trigger thresholds are set so that load shedding proceeds in several stages, acting sequentially according to the severity of the frequency decline. In addition, intentional delays are configured to effectively avoid nuisance operations caused by motor starting, cold-load pickup, and similar effects. The parameters of the staged UFLS scheme are given in
Table 2.
In addition to configuring the staged under-frequency load shedding scheme, a load restoration strategy must be defined. Hysteresis-like, frequency-based staged actions are required to prevent oscillations caused by repeated shedding and restoration near certain frequency thresholds. The parameter settings for the restoration of shed load are listed in
Table 3.
3.3. System Reliability Parameter
(1) Expected Energy Not Supplied(EENS)
Expected Energy Not Supplied (EENS) is an index used to characterize the risk of supply loss. When the microgrid frequency falls below the preset UFLS trigger thresholds and the corresponding intentional delays have elapsed, load curtailment is initiated. The EENS is calculated as:
Here, represents the load reduction ratio, denotes the load value, and indicates the load reduction duration.
(2) Expected Indirect Energy Not Supplied (EIENS)
EIENS is used to characterize the power imbalance that arises during the frequency control process. Notably, this imbalance is not directly manifested as load curtailment; rather, it is reflected in the system’s frequency dynamics, where such imbalances directly induce frequency fluctuations. The EIENS is computed as follows:
(3) Expected Number of Under-Frequency events (ENUF)
ENUF quantifies the expected annual number of under-frequency events. In this study, we tally the occurrences of the five under-frequency event categories defined earlier, each satisfying the UFLS staging thresholds and duration requirements.
(4) Expected Under Frequency Duration, EUFD
The microgrid frequency may deviate from the normal range and remain within a low-frequency band for a period of time until generator output is ramped up or load is reduced to restore the frequency to the normal range. The frequency will then gradually return to its nominal value through frequency-regulation actions on both the supply and demand sides. The Expected Under-Frequency Duration denotes the expected duration for which the frequency remains below its normal value, and is calculated as:
3.4. Sequential Monte Carlo Method
Given the pronounced temporal characteristics of wind turbines and energy storage systems, this study employs the sequential Monte Carlo (SMC) method to approximate the long-term reliability statistics of an islanded microgrid. Advancing continuously along the time axis, SMC yields time-sequential information that better captures the microgrid’s frequency dynamics. It faithfully represents the coupling among unit state evolution, load fluctuations, and frequency dynamics, and it naturally accommodates frequency-dependent failure-rate correction, health-window constraints, and staged under-frequency load shedding (UFLS). Compared with non-sequential methods, SMC provides the event order and the system’s dynamic response, aligning more closely with the actual operating characteristics of islanded microgrids.
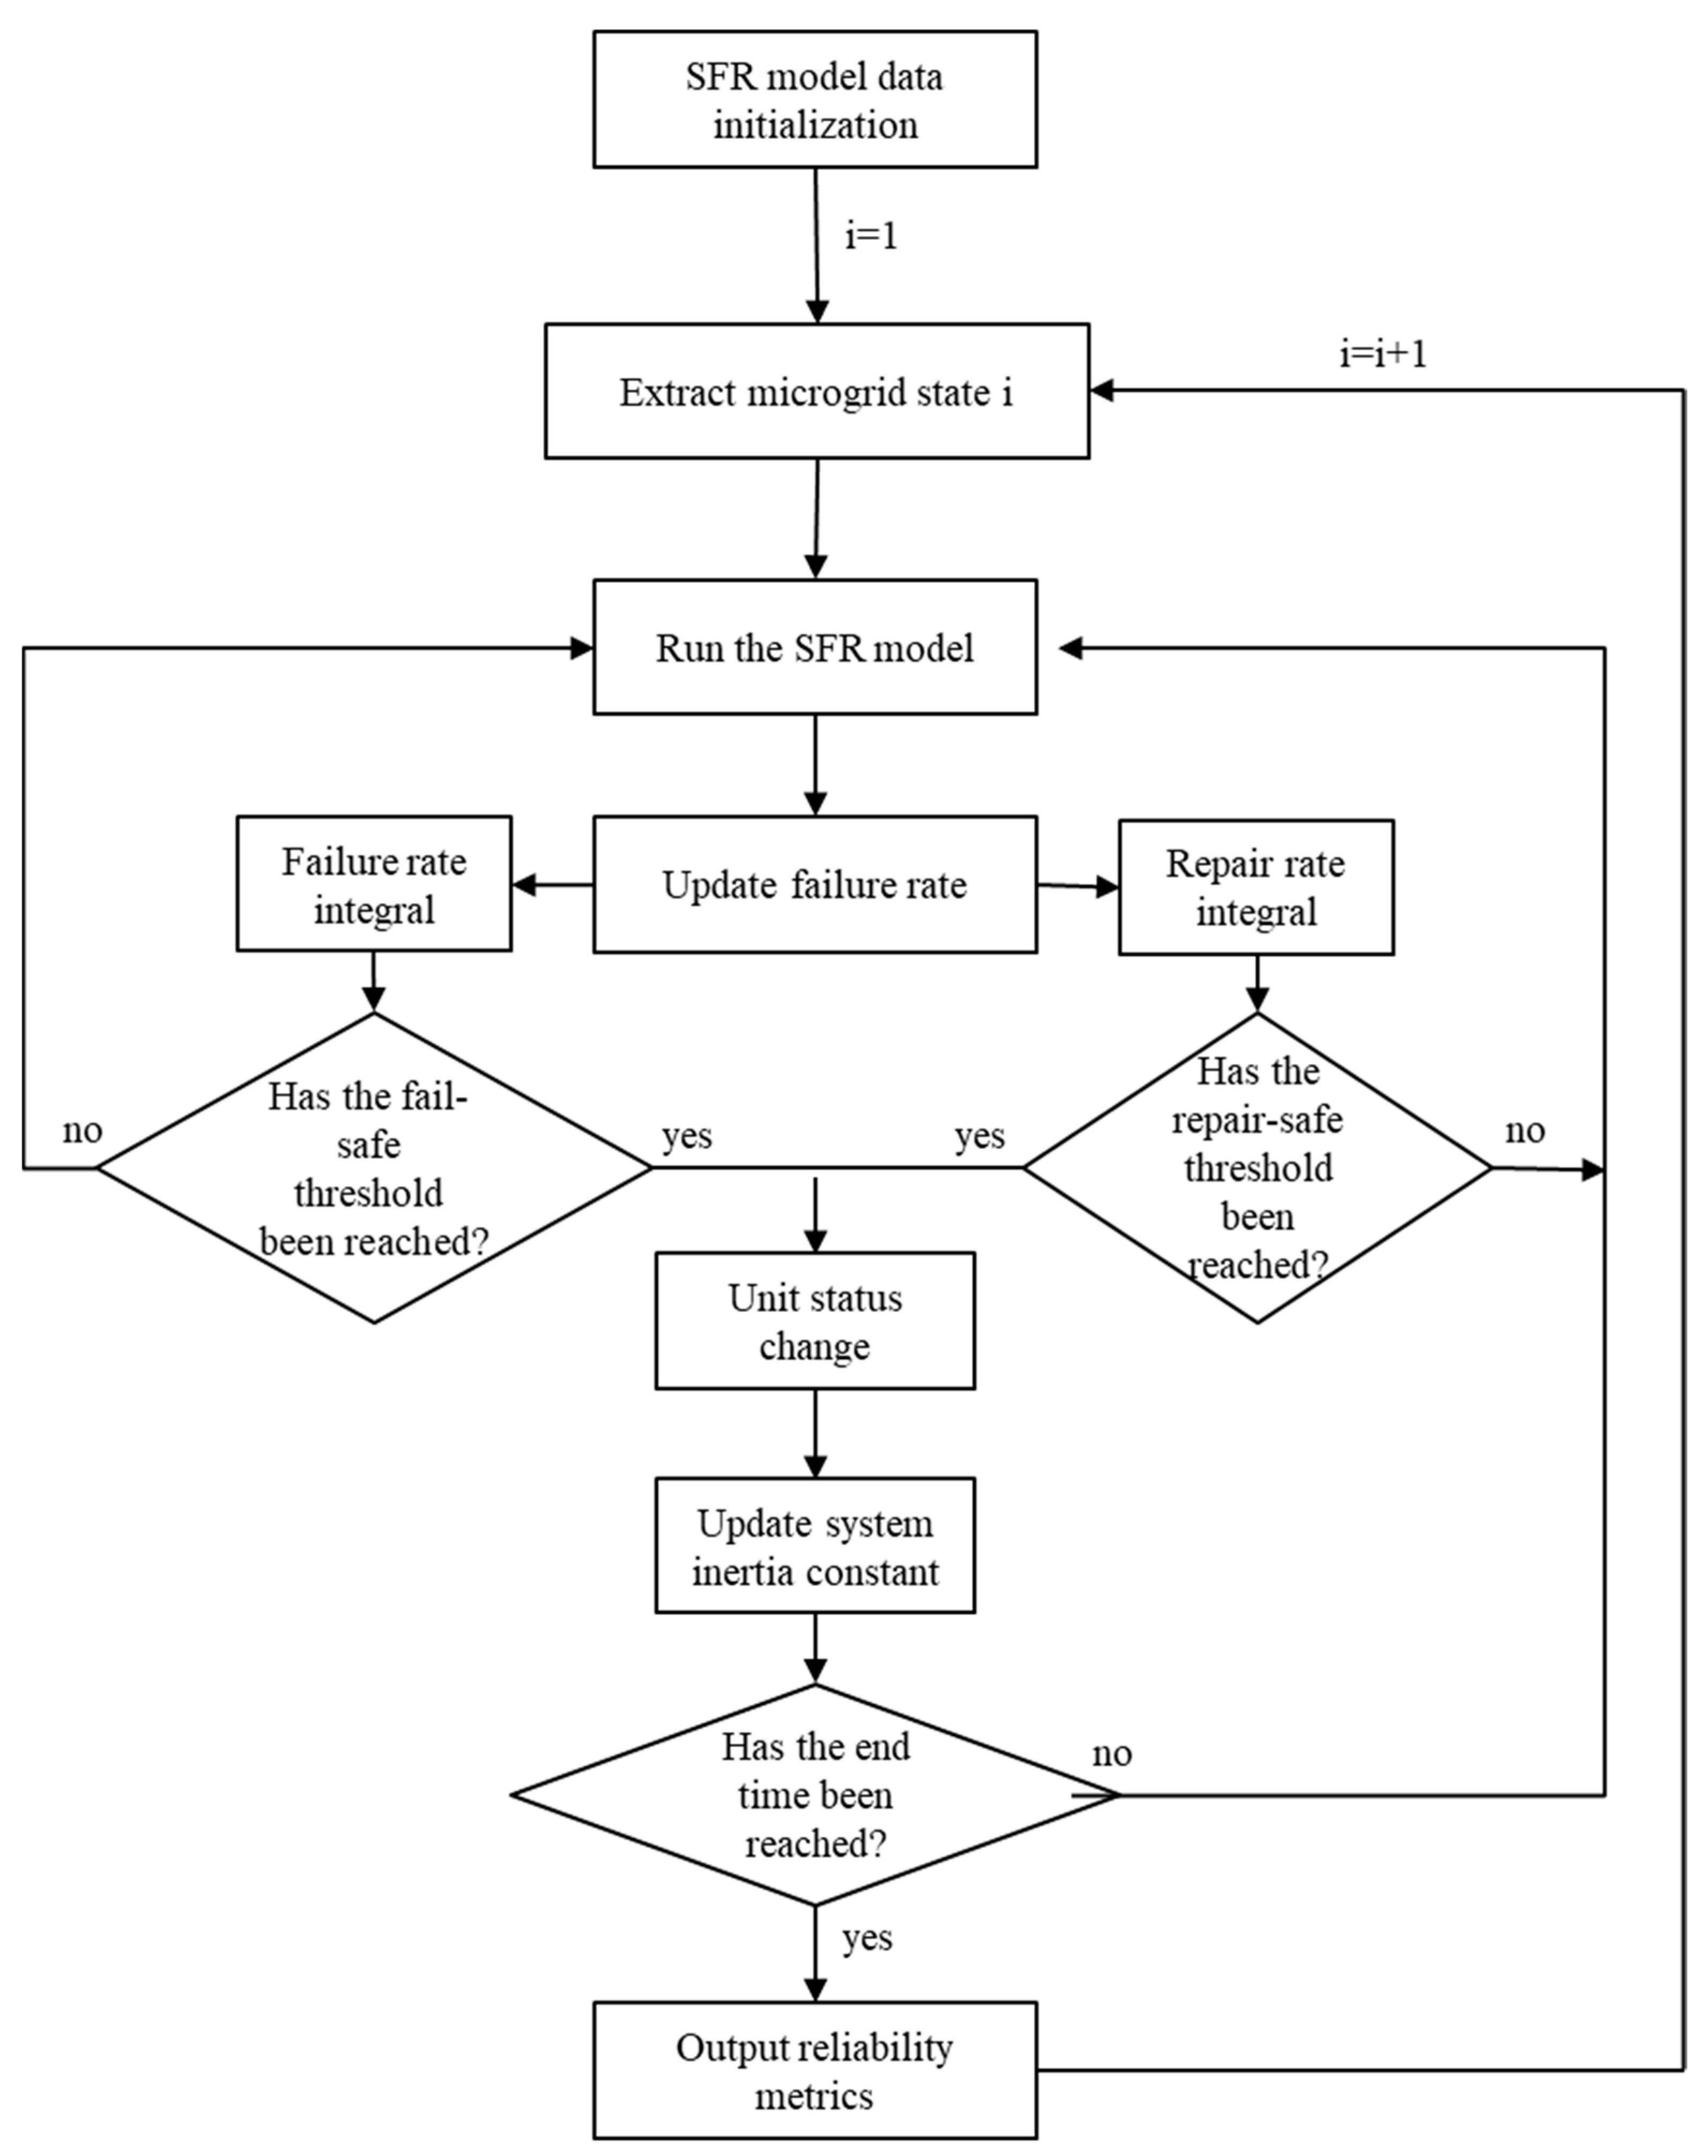
The SMC procedure adopted in this paper is as follows:
Initialization: set up unit reliability data, unit control parameters, wind-speed data, and load data.
Enumerate microgrid state i, with i = 1 at the start: for each unit, randomly generate its initial status. If the unit is up, additionally sample its residual time to failure; if it is down, sample its residual time to repair.
Update the microgrid’s equivalent inertia constant based on the set of units currently in outage.
Run the SFR model: compute each unit’s output in real time from the frequency information and correct each unit’s failure rate accordingly. If the frequency falls below the UFLS thresholds and the intentional delay is exceeded, automatically shed the corresponding proportion of load.
Unit state transitions: for each unit in normal operation, perform time integration of its failure rate and determine whether it enters the failed state. When the accumulated hazard reaches the pre-sampled cumulative hazard threshold, the unit fails; sample the repair time and reduce its output to zero subject to the ramp/power limits applicable at the outage instant. For units in outage, when the sampled repair time elapses, return the unit to service and pre-sample the next cumulative hazard threshold for the subsequent failure event.
Index tallying: output the reliability and frequency-security indices proposed in
Section 2.3.
The overall workflow is illustrated in
Figure 6.
4. Case Study
Based on the SFR model established above, we conduct simulation studies. The model includes three diesel generators and one gas turbine with capacities of 10 MW, 10 MW, 5 MW, and 5 MW, respectively. Their failure rates (failures/year) are set to 2, 2, 2.5, and 3, and their repair rates (repairs/year) are 20, 20, 20, and 30, respectively. In addition, four identical wind turbine generators (WTGs) and one energy storage system (ESS) are included; each WTG has a capacity of 2.5 MW and the ESS is 5 MW. The WTG and ESS failure rates (failures/year) are set to 4 and 2.5, and the corresponding repair rates (repairs/year) are 35 and 40. Load data are taken from EnergyPlus annual load profiles for the New Jersey climate zone (USA), and wind-speed data are from the NREL Flatirons Campus.
4.1. Validation of the SFR Model
To verify the correctness and effectiveness of the proposed SFR model, a 90,000 s time-domain simulation is performed for the islanded microgrid configured above. In this subsection, both failure and repair rates are increased by a factor of 100 to accentuate the impact of unit state transitions.
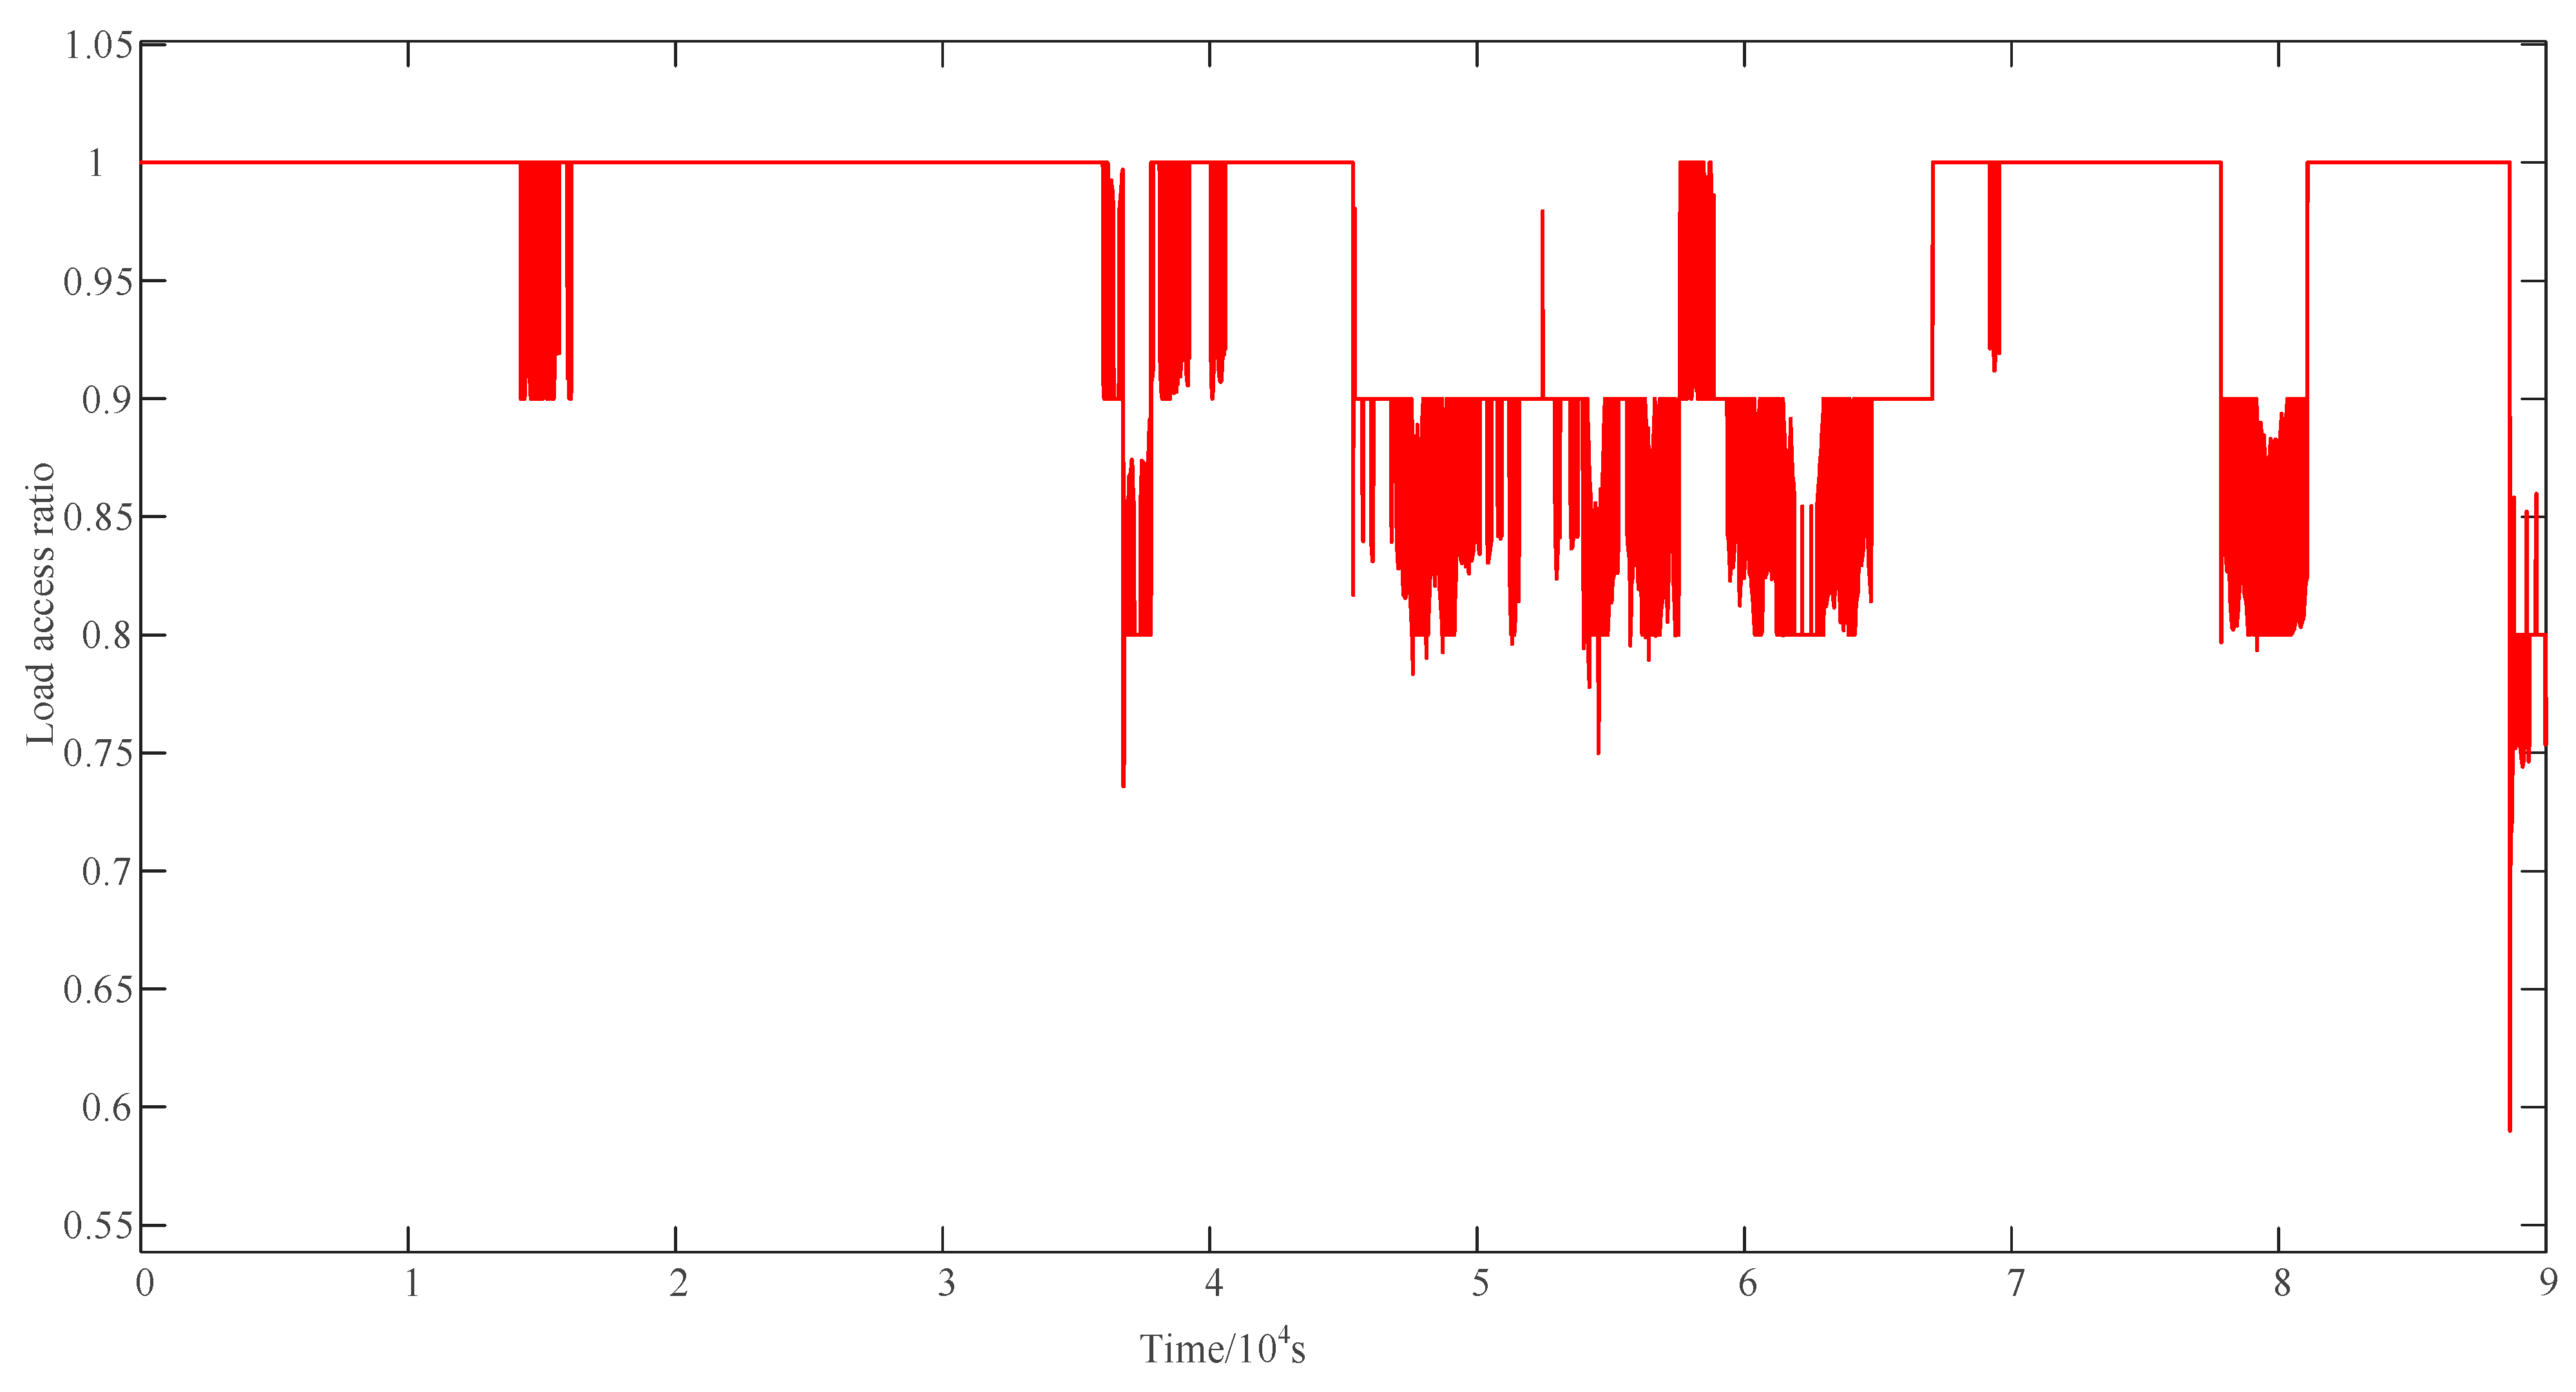
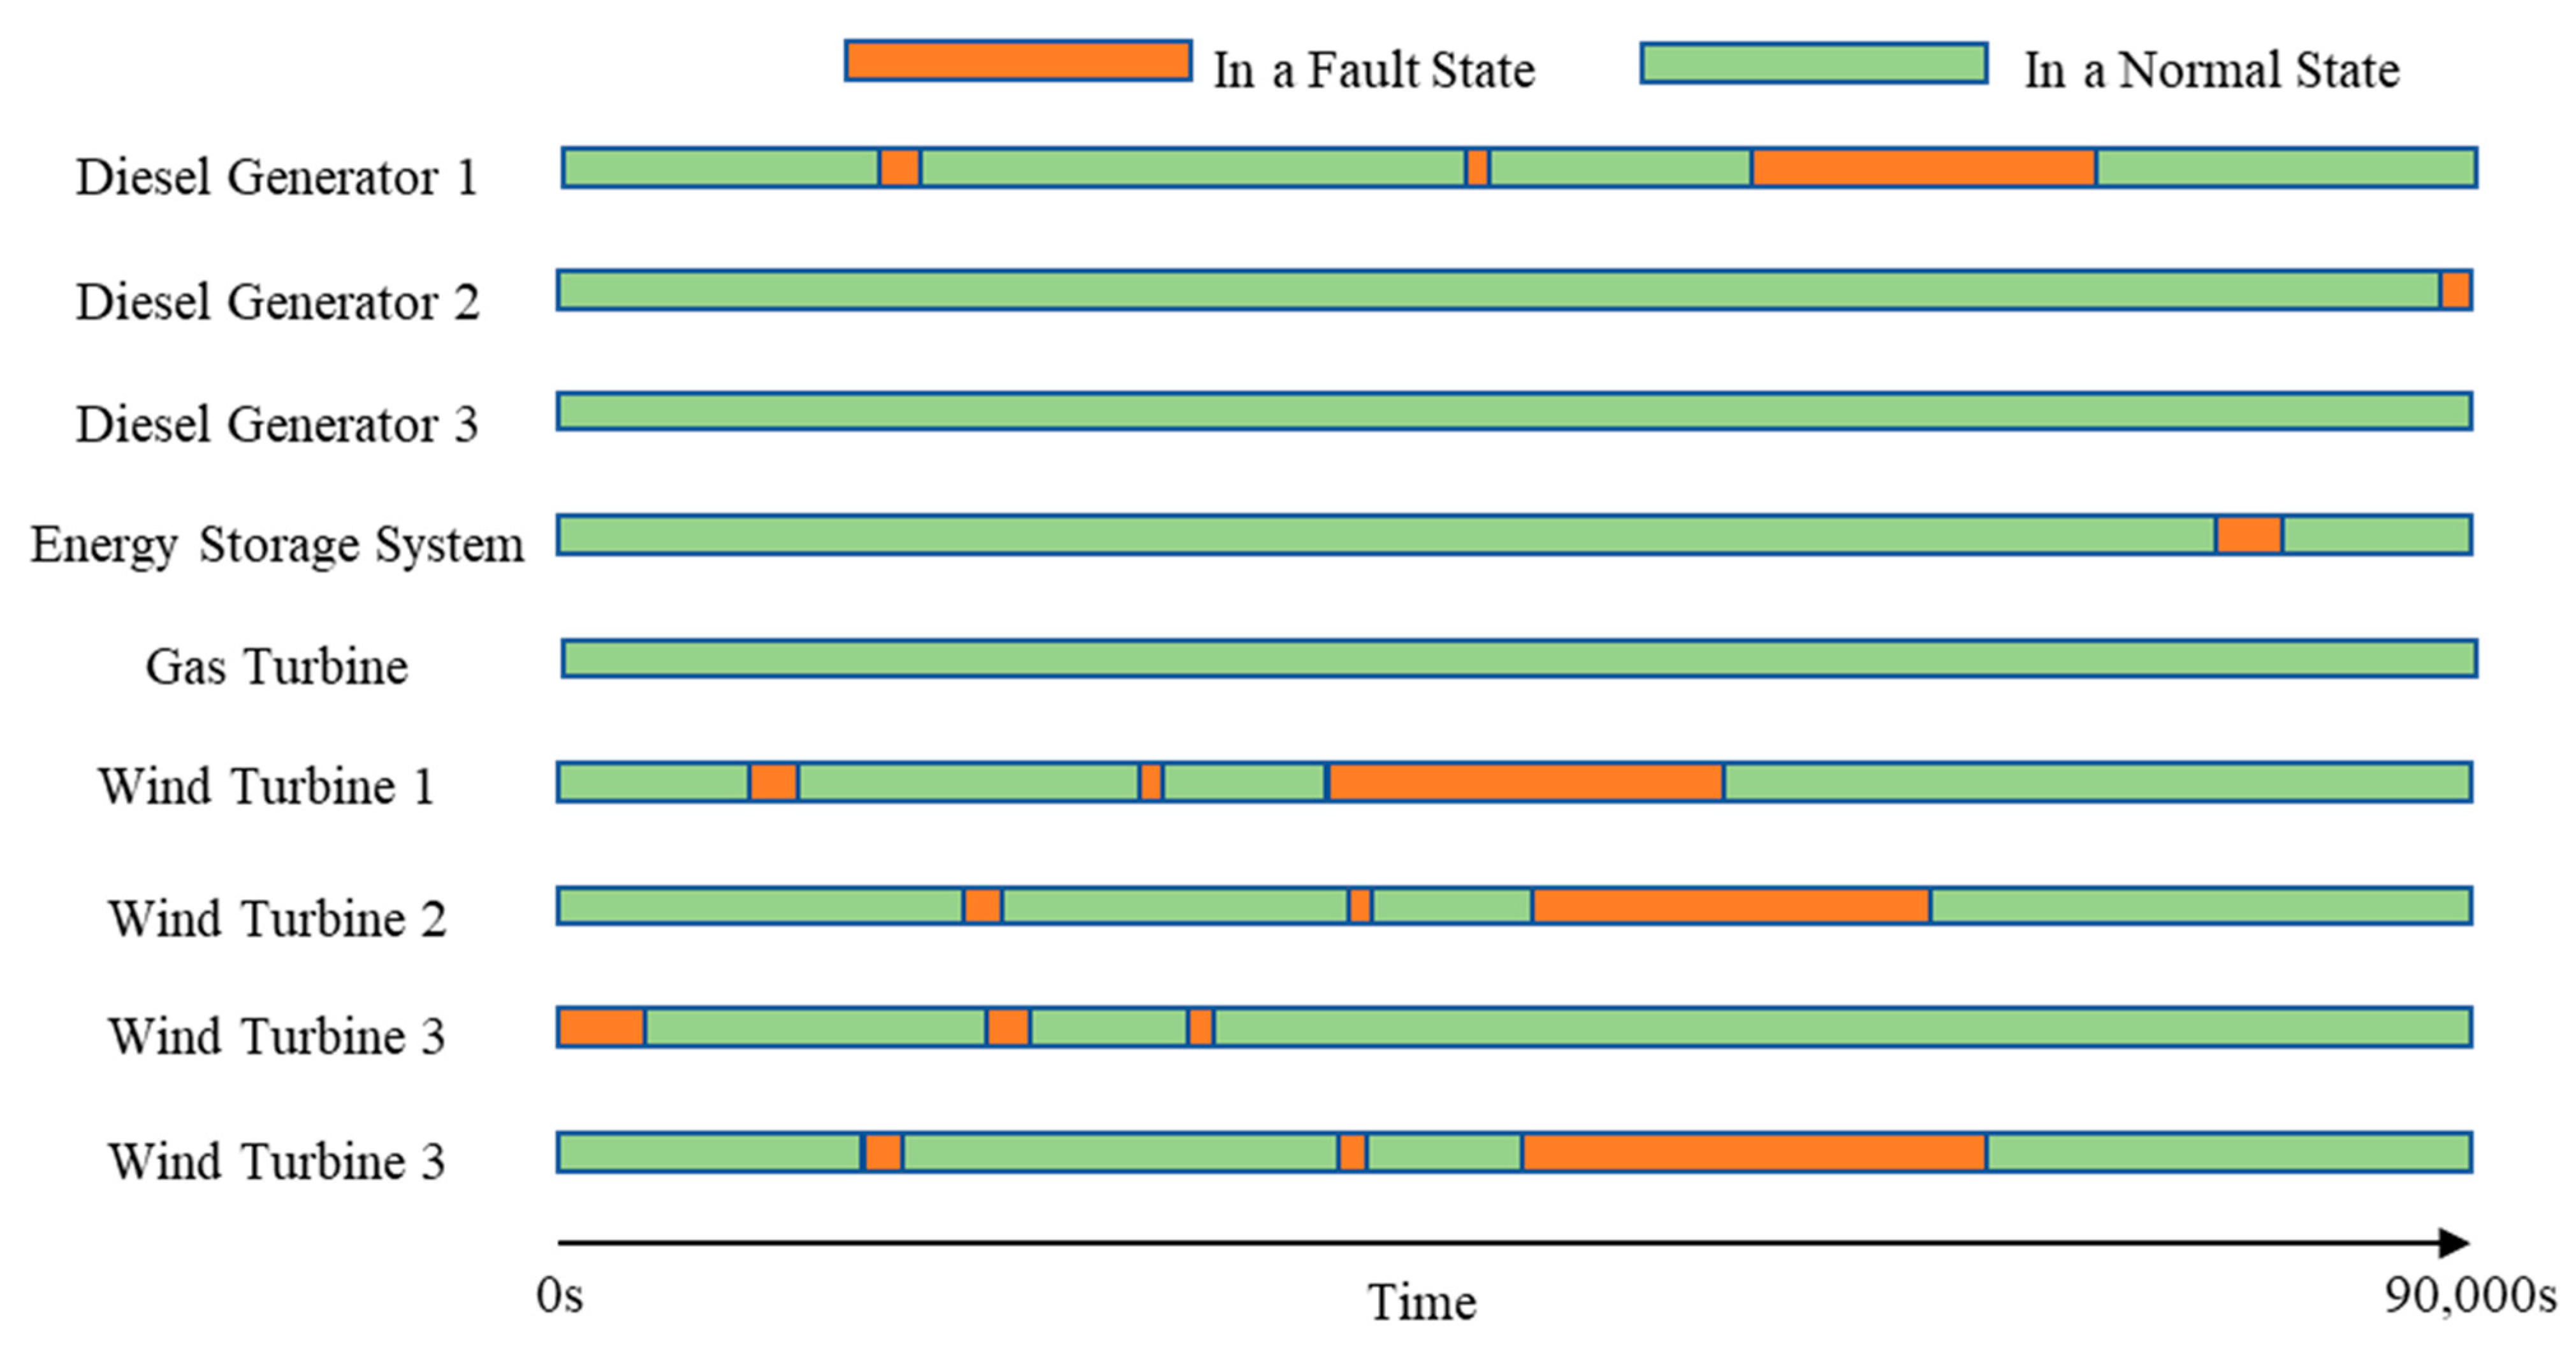
Figure 7,
Figure 8 and
Figure 9, respectively, present the simulated microgrid frequency, the fraction of load connected, and the operating states of the units.
4.1.1. Impact of a Single Synchronous Unit Outage
Around 15,000 s, Diesel Generator 1 trips. As it is the primary source in the microgrid, its outage causes a steep frequency drop and imposes supply pressure, leading to frequency oscillations within 49–49.5 Hz. The served-load fraction is controlled to remain above 90%. After a brief repair, Diesel Generator 1 returns to service and the frequency stabilizes. Around 58,000 s, although the load has decreased and the frequency begins to rise to about 49.5 Hz, the microgrid attempts to restore 100% load; however, Diesel Generator 1 remains in a prolonged outage. Not until after 65,000 s, when the load declines to a level supportable by the remaining units, does the microgrid frequency return to the normal range. In addition, Diesel Generator 2 fails around 88,000 s, driving the frequency down to nearly 47 Hz for a period—an extremely hazardous range for an islanded microgrid—which forces the load to be curtailed to its minimum connection level.
4.1.2. Impact of WTG/ESS Outage
During 45,000–58,000 s, 10–20% of the load is shed for an extended period, with the frequency confined to 48.5–49 Hz. In this interval, three WTGs are out of service, so renewable output is limited, while the nominally required load is 27–33 MW—exceeding the maximum output of the diesel generators and gas turbine. The lack of supplemental renewable power prevents the microgrid from actively restoring frequency to the normal range. For most of the time, WTG output can supplement that of synchronous units; however, during load peaks, when the synchronous units are at their limits and WTGs cannot supply the excess demand, the microgrid must shed load to ensure security. After 65,000 s, an ESS failure leads to a low-frequency event around 80,000 s, similar to the case of WTG outages.
The long-term simulation above demonstrates that the SFR model can accurately capture the dynamic impact of different types of unit faults and recovery processes on system frequency. Single-unit failure causes short-term frequency fluctuations and triggers UFLS; multiple-unit failures lead to prolonged low-frequency operation; and energy storage withdrawal results in rapid loss of system support capability, triggering more severe low-frequency events. These results align with theoretical expectations, demonstrating the validity and effectiveness of the established SFR model. This provides a reliable modeling foundation for subsequent reliability assessments based on sequential Monte Carlo methods.
4.2. Sequential Monte Carlo Results
In this section, building on the SFR model and Monte Carlo framework established above, we perform sequential Monte Carlo simulations of the system scenarios to analyze the impact of frequency deviations on generator (unit) reliability parameters, thereby demonstrating the necessity of incorporating frequency dynamics into reliability assessment.
All simulations in this study were performed on a personal workstation equipped with an Intel Ultra7-265K CPU and an NVIDIA Ultra W OC 5060Ti 16 GB GPU, running MATLAB/Simulink R2024a. Owing to the time-sequential nature of the method, parallelization is limited and the runtime mainly depends on CPU performance. Under this configuration, a single annual simulation (one full Monte Carlo sample path) required about 7–8 min. To achieve statistically convergent reliability indices, 1000 Monte Carlo trials were executed, leading to a total runtime of approximately 120 h.
The simulations compare two cases—one that accounts for the influence of frequency on unit failure rates and one that does not—with the results summarized in
Table 4.
The comparison results show that the traditional static assessment method shows optimistic bias in all reliability indicators, which is mainly due to the fact that the static method fails to reflect the frequency dynamic process triggered by the power imbalance and ignores the resulting triggered ENUF and its duration EUFD; and the static method does not take into account the aggravating effect of frequency fluctuations on the synchronous generator failure rate, thus underestimating the real failure of the system under perturbation risk under disturbance.
With respect to EENS and EIENS, the values are significantly higher when frequency effects are considered than when they are ignored. This indicates that frequency deviations not only lead directly to load shedding but also indirectly increase the expected energy not supplied by exacerbating the failure rates of synchronous machines, thereby causing the supply risk to be underestimated if frequency is neglected.
For the ENUF and EUFD indices, both the expected number and the duration of under-frequency events at each stage increase when frequency effects are included. For example, the first-stage metrics ENUF1 and EUFD1 rise markedly, showing that low-frequency load-shedding actions are triggered more frequently and persist longer under frequency disturbances. This underscores the critical role of energy storage and conventional units in frequency regulation and further indicates that omitting frequency effects in reliability assessment will fail to capture the true severity of under-frequency events.
Examining the distribution of staged load shedding, the lower levels (UFLS-1 and UFLS-2) have the highest trigger probabilities, while higher levels (UFLS-4 and UFLS-5) are relatively rare. This aligns with operational practice: most disturbances can be mitigated by low-level shedding, whereas only severe contingencies trigger high-level shedding.
Therefore, neglecting the influence of frequency on unit failure rates directly leads to an overestimation of microgrid reliability and introduces substantial bias into judgments of long-term operational reliability.
5. Conclusions
Targeting the low inertia and strong renewable output variability of islanded microgrids, this paper proposes a sequential Monte Carlo reliability assessment method integrated with a system frequency response model. An integrated SFR model comprising diesel generators, a gas turbine, an energy storage system, and wind turbine generators is established, and frequency-dependent corrections to unit failure and repair rates are introduced together with an under-frequency load-shedding strategy. In this way, reliability indices and frequency-security indices are jointly evaluated.
Simulation results show that if the influence of frequency on unit failure rates is ignored, indices such as EENS, the number of under-frequency events, and their durations will all be underestimated, leading to an overly optimistic reliability assessment. Incorporating frequency-dependent corrections more accurately reflects the potential threats posed by frequency fluctuations to microgrid operation. Compared with traditional static methods, the proposed approach can produce not only conventional reliability indices such as EENS and LOLP, but also dynamic frequency indices including ENUF, EUFD, and the low-frequency recovery probability, thus offering higher practical value.
In summary, the proposed method provides a more comprehensive reliability analysis tool for the planning, design, and operational scheduling of islanded microgrids. Future work may further integrate multi-energy complementary operation strategies, demand-side response, and comparative analyses of different control schemes to enhance the reliability and frequency-security assessment framework under high renewable penetration.
Author Contributions
Conceptualization, Y.Z. and Q.Y.; methodology, X.Y. and J.S.; software, S.H. and D.L.; validation, L.G., W.Z. and Z.W.; formal analysis, Y.Z. and J.S.; investigation, H.S. and X.C.; resources, Q.Y.; data curation, Y.Z.; writing—original draft preparation, S.H., M.G. and L.G.; writing—review and editing, X.Y. and D.L.; visualization, Z.W.; supervision, Q.Y.; project administration, H.S.; funding acquisition, Y.Z. All authors have read and agreed to the published version of the manuscript.
Funding
This project is supported by the State Grid R&D Program of China (kjgw2024-008).
Data Availability Statement
The datasets used and analyzed during this current study are available from the corresponding author on reasonable request.
Conflicts of Interest
Author Yu Zhang, Jinyue Shi, Shicheng Huang, Liang Geng, Zexiong Wang and Hao Sun were employed by the company Shijiazhuang Power Supply Company, State Grid Hebei Electric Power Co., Ltd. The remaining authors declare that the research was conducted in the absence of any commercial or financial relationships that could be construed as a potential conflict of interest.
References
- Kundur, P.; Balu, N.J.; Lauby, M.G. Power System Stability and Control; McGraw-Hill: New York, NY, USA, 1994. [Google Scholar]
- Panteli, M.; Mancarella, P. Influence of extreme weather and climate change on the resilience of power systems: Impacts and possible mitigation strategies. Electr. Power Syst. Res. 2015, 127, 259–270. [Google Scholar] [CrossRef]
- Viral, R.; Khatod, D.K. Optimal planning of distributed generation systems in distribution system: A review. Renew. Sustain. Energy Rev. 2012, 16, 5146–5165. [Google Scholar] [CrossRef]
- Olivares, D.E.; Mehrizi-Sani, A.; Etemadi, A.H.; Canizares, C.A.; Iravani, R.; Kazerani, M.; Hajimiragha, A.H.; Gomis-Bellmunt, O.; Saeedifard, M.; Palma-Behnke, R.; et al. Trends in Microgrid Control. IEEE Trans. Smart Grid 2014, 5, 1905–1919. [Google Scholar] [CrossRef]
- Billinton, R.; Allan, R.N. Reliability Evaluation of Power Systems, 1st ed.; Springer: Berlin/Heidelberg, Germany, 1996. [Google Scholar]
- Adefarati, T.; Bansal, R. Reliability and economic assessment of a microgrid power system with the integration of renewable energy resources. Appl. Energy 2017, 206, 911–933. [Google Scholar] [CrossRef]
- Zhao, Y.; Xie, K.; Shao, C.; Lin, C.; Shahidehpour, M.; Tai, H.-M.; Hu, B.; Du, X. Integrated Assessment of the Reliability and Frequency Deviation Risks in Power Systems Considering the Frequency Regulation of DFIG-Based Wind Turbines. IEEE Trans. Sustain. Energy 2023, 14, 2308–2326. [Google Scholar] [CrossRef]
- Chu, Z.; Zhang, N.; Teng, F. Frequency-Constrained Resilient Scheduling of Microgrid: A Distributionally Robust Approach. IEEE Trans. Smart Grid 2021, 12, 4914–4925. [Google Scholar] [CrossRef]
- Guo, J.; Zhao, T.; Liu, W.; Zhang, J. Reliability Modeling and Assessment of Isolated Microgrid Considering Influences of Frequency Control. IEEE Access 2019, 7, 50362–50371. [Google Scholar] [CrossRef]
- Fei, Z.; Zou, Y.; Hua, W.; Banda, O.V.; Guerrero, J.M.; Li, Z. Weather Routing Based Multi-Energy Ship Microgrid Operation Under Diverse Uncertainties: A Risk-Averse Stochastic Approach. IEEE Trans. Smart Grid 2025. Early Access. [Google Scholar] [CrossRef]
- Zhang, S.; Zhang, X.; Zhang, R.; Gu, W.; Cao, G. N-1 Evaluation of Integrated Electricity and Gas System Considering Cyber-Physical Interdependence. IEEE Trans. Smart Grid 2025, 16, 3728–3742. [Google Scholar] [CrossRef]
- Nargeszar, A.; Ghaedi, A.; Nafar, M.; Simab, M. Reliability evaluation of the renewable energy-based microgrids considering resource variation. IET Renew. Power Gener. 2023, 17, 507–527. [Google Scholar] [CrossRef]
- Rocabert, J.; Luna, A.; Blaabjerg, F.; Rodríguez, P. Control of Power Converters in AC Microgrids. IEEE Trans. Power Electron. 2012, 27, 4734–4749. [Google Scholar] [CrossRef]
- Zamani, M.A.; Yazdani, A.; Sidhu, T.S. A Control Strategy for Enhanced Operation of Inverter-Based Microgrids Under Transient Disturbances and Network Faults. IEEE Trans. Power Deliv. 2012, 27, 1737–1747. [Google Scholar] [CrossRef]
- Lin, J.; Yang, X.; Niu, S.; Yu, H.; Zhong, J.; Jian, L. Inflatable Savonius wind turbine with rapid deployment and retrieval capability: Structure design and performance investigation. Energy Convers. Manag. 2024, 310, 118480. [Google Scholar] [CrossRef]
- Xue, S.; Yang, Z.; Yin, Z.; Yu, F.; Wang, Z. The Frequency Regulation Scheme of a Wind Turbine Generator Based on Variable Tracking Operation. Electronics 2024, 13, 2575. [Google Scholar] [CrossRef]
| Disclaimer/Publisher’s Note: The statements, opinions and data contained in all publications are solely those of the individual author(s) and contributor(s) and not of MDPI and/or the editor(s). MDPI and/or the editor(s) disclaim responsibility for any injury to people or property resulting from any ideas, methods, instructions or products referred to in the content. |
© 2025 by the authors. Licensee MDPI, Basel, Switzerland. This article is an open access article distributed under the terms and conditions of the Creative Commons Attribution (CC BY) license (https://creativecommons.org/licenses/by/4.0/).
