Article

KG-FLoc: Knowledge Graph-Enhanced Fault Localization in Secondary Circuits via Relation-Aware Graph Neural Networks

State Grid Henan Economic Research Institute, Zhengzhou 450052, China
*
Author to whom correspondence should be addressed.
Electronics 2025, 14(20), 4006; https://doi.org/10.3390/electronics14204006 (registering DOI)
Submission received: 14 August 2025 / Revised: 29 September 2025 / Accepted: 1 October 2025 / Published: 13 October 2025

Abstract

This paper introduces KG-FLoc, a knowledge graph-enhanced framework for secondary circuit fault localization in intelligent substations. The proposed KG-FLoc innovatively formalizes secondary components (e.g., circuit breakers, disconnectors) as graph nodes and their multi-dimensional relationships (e.g., electrical connections, control logic) as edges, constructing the first comprehensive knowledge graph (KG) to structurally and operationally model secondary circuits. By reframing fault localization as a knowledge graph link prediction task, KG-FLoc identifies missing or abnormal connections (edges) as fault indicators. To address dynamic topologies and sparse fault samples, KG-FLoc integrates two core innovations: (1) a relation-aware gated unit (RGU) that dynamically regulates information flow through adaptive gating mechanisms, and (2) a hierarchical graph isomorphism network (GIN) architecture for multi-scale feature extraction. Evaluated on real-world datasets from 110 kV/220 kV substations, KG-FLoc achieves 97.2% accuracy in single-fault scenarios and 93.9% accuracy in triple-fault scenarios, surpassing SVM, RF, MLP, and standard GNN baselines by 12.4–31.6%. Beyond enhancing substation reliability, KG-FLoc establishes a knowledge-aware paradigm for fault diagnosis in industrial systems, enabling precise reasoning over complex interdependencies.

1. Introduction

In the operation of secondary equipment in intelligent substations, quickly and accurately locating secondary circuit faults is crucial for ensuring the overall safety and reliability of the power grid. In 2023, the investment scale of China’s domestic smart substation industry was approximately 14.33 billion yuan, with a year-on-year growth of 8%. Among this, substation equipment accounted for 55.62%, substation monitoring and operation & maintenance accounted for 4.12%, and substation construction projects and others accounted for 40.27%. Meanwhile, knowledge graph (KG) and link prediction technologies have demonstrated exceptional capabilities in capturing node relationships and mining potential connections in complex networks. Secondary circuit fault location is akin to a process of identifying “missing edges” in a graph structure. Specifically, components such as circuit breakers, disconnectors, and measuring devices in secondary circuits can be regarded as graph nodes, while alarm signals and communication messages before and after faults correspond to relationships between nodes. When a relationship fails or becomes abnormal, it manifests as a “missing edge” that needs to be predicted or completed in the knowledge graph [1,2,3,4].
Based on this similarity, we map the fault location problem to a knowledge graph link prediction problem, thereby leveraging the advantages of graph neural networks in high-order relationship modeling and feature extraction to improve the accuracy and generalization ability of fault diagnosis. As illustrated in Figure 1, the secondary circuit fault localization problem can be formally mapped to a knowledge graph link prediction task. For example, the query (IB2234B, Gocb0_Link_Failure, ?) aims to predict the missing receiver (tail entity) caused by a link failure.
In traditional operation and maintenance of secondary systems, fault diagnosis highly relies on technicians’ manual analysis of messages and alarm information, making it difficult to cope with complex scenarios involving diverse equipment types and dynamic changes in network topology [5,6,7]. Existing methods based on Petri nets or enumeration tables also have limitations in model construction and fault scenario coverage [2,8]. To address the issues of limited dimensions and insufficient positioning accuracy, scholars have proposed various artificial intelligence solutions: ensemble learning for state evaluation [9], semantic modeling for loop identification [10], and deep belief networks for feature extraction [11,12]. However, most of these solutions do not fully consider the impact of system topology changes on the model and have a high dependency on large-scale samples for training. Additionally, although fault tree methods that combine expert experience with data-driven approaches enhance credibility, they still struggle to achieve precise positioning in scenarios with dense or overlapping alarms [6,13].
Inspired by the concept of “prompt-based knowledge graph foundation models for general contextual reasoning” [14], this paper innovatively integrates secondary circuit fault location with knowledge graph link prediction and introduces the prompt learning mechanism of large pre-trained language models. By constructing a secondary circuit knowledge graph and designing a relation-aware gated unit (RGU) and a multilayer graph isomorphism network (GIN) message-passing module, efficient discrimination and intelligent reasoning about fault types and locations are achieved, particularly demonstrating excellent generalization capabilities in scenarios with scarce historical samples or novel faults. The main contributions of this paper are as follows:
(1)
Our work establishes a principled integration of knowledge graph technology with secondary circuit fault localization. Secondary components such as circuit breakers, disconnectors, and measuring devices are abstracted as nodes in the graph, while various relationships such as electrical connections, control logic, and information flow channels are used as edges between nodes.
(2)
When graph neural networks process circuit data, accurately capturing local and global features is of great significance. To this end, the method designs a relation-aware gated unit (RGU) module, which finely regulates information flow through the gating mechanisms of forget gates, input gates, and output gates.
(3)
The message-passing mechanism has a significant impact on the performance of GNNs in circuit fault detection. This method adopts an N-layer GIN neural network structure to design the message-passing mechanism, which can more efficiently capture graph structure information and make more comprehensive use of graph prompt information during training and inference.

2. Related Work

From the perspective of graph theory, a knowledge graph is a labeled directed graph. In it, entities in the real world (such as people and objects) correspond to “nodes” in graph theory, while associations between entities (such as “belongs to” and “invented by”) correspond to “directed edges”—the direction of the edges indicates the direction of the relationships. Some nodes and edges also have attached attribute labels (e.g., the node “apple” is labeled “fruit”, and the edge “produce” is labeled “time”), forming an attributed graph structure. Essentially an extension of “weighted graphs” in graph theory, it allows mining potential associations between entities via graph theory methods like node degree and path analysis.

2.1. The Limitations of Traditional Fault Detection Methods

Most traditional secondary circuit fault detection methods rely on rule-based modeling and manual experience judgment, such as analysis methods based on fault trees or Petri nets [15]. The fault tree method can establish mapping relationships between alarms and faults, but it is difficult to achieve accurate positioning when a large number of overlapping alarms occur simultaneously in the network. Although GOOSE message diagnosis based on Petri nets can formally describe communication logic, it requires a heavy workload for model construction, lacks flexible scalability, and is difficult to cope with frequent topological changes in secondary systems [16].
Some studies use time-series statistical process control (SPC) and seasonal autoregressive integrated moving average model (SARIMA) models to monitor switching processes, which can preliminarily identify abnormal behaviors. However, they have poor adaptability to atypical fault modes and require repeated tuning of multiple threshold parameters, making it difficult to meet the high-reliability requirements of intelligent substations [17]. In addition, online detection using infrared or thermal imaging technologies can non-destructively monitor temperature changes on equipment surfaces, but can only capture representative features and cannot reflect internal communication links or logical faults in the system [18]. Traditional methods mainly have the following three shortcomings:
(1)
Single information dimension: Reliance on single fault features (such as temperature, alarm sequences, or network connectivity) leads to weak integration capabilities for multi-source and multi-dimensional fault information.
(2)
Manual modeling dependency: Formal models (fault trees, Petri nets, enumeration methods, etc.) require significant manual intervention, resulting in high maintenance costs and difficulty in quickly adapting to topological changes.
(3)
Limited generalization ability: Statistical or rule-based methods have poor generalization to new faults and data-scarce scenarios and struggle to handle concurrent multi-point faults.

2.2. Research Progress of Graph Neural Networks in Secondary Circuit Detection

To address the limitations of traditional methods, an increasing number of studies have begun to introduce GNNs into secondary circuit fault diagnosis to fully leverage the system’s topological structure and multi-source feature information.
Early works mostly used deep belief networks (DBNs) or convolutional neural networks (CNNs) for feature extraction of fault states, achieving certain results but failing to explicitly model the graph structural relationships between devices and relying heavily on large-scale substation-wide data [19]. Subsequently, scholars started using GNNs to model secondary circuit graphs. For example, a fault diagnosis method for secondary devices based on graph attention networks (GATs) captures interaction features between key devices through an attention mechanism between nodes, improving the accuracy and robustness of fault identification [1]. Other studies have applied long short-term memory networks (LSTMs) to single-zone fault diagnosis, but they similarly suffer from issues such as focusing only on local zones and requiring large sample sizes [20].
Recently, multiple studies have proposed transforming secondary circuit fault location problems into graph classification tasks: first constructing a graph database model of the secondary circuit, then generating fault subgraphs based on fault features, and finally using GNNs for node classification or graph classification to achieve precise positioning. For instance, a study published used GNNs to model secondary circuit faults in intelligent substations and improved fault location accuracy through a binary cross-entropy optimization strategy [2]. Similarly, research in [1] has demonstrated that GNNs possess significant advantages in extracting fault information from secondary circuits under different network structures, effectively overcoming the dependence of traditional deep learning models on global data.
Additionally, scholars have explored fusing GNNs with other technologies to enhance model performance. In distributed energy resource integration scenarios, for example, spatial-temporal recurrent GNNs (STR-GNNs) have been used to simultaneously capture node temporal and topological features, significantly improving the generalization ability and real-time performance of fault detection and location [21]. Further research has combined knowledge graphs with GNNs, enhancing the model’s reasoning capabilities in data-scarce or novel fault scenarios through semantic-level association supplementation [10].

3. Proposed Methodology

Inspired by the link prediction problem of knowledge graphs, this paper proposes a relation-aware gated neural network method for secondary circuit fault detection. By designing a representation update module with relation-aware prompts (RPRU) and an N-layer GIN architecture [22], KG-FLoc effectively captures the structural associations and logical relationships in the secondary circuit knowledge graph to achieve precise prediction of secondary circuit faults. Experiments on benchmark datasets validate the effectiveness and performance advantages of the method in complex secondary circuit scenarios.
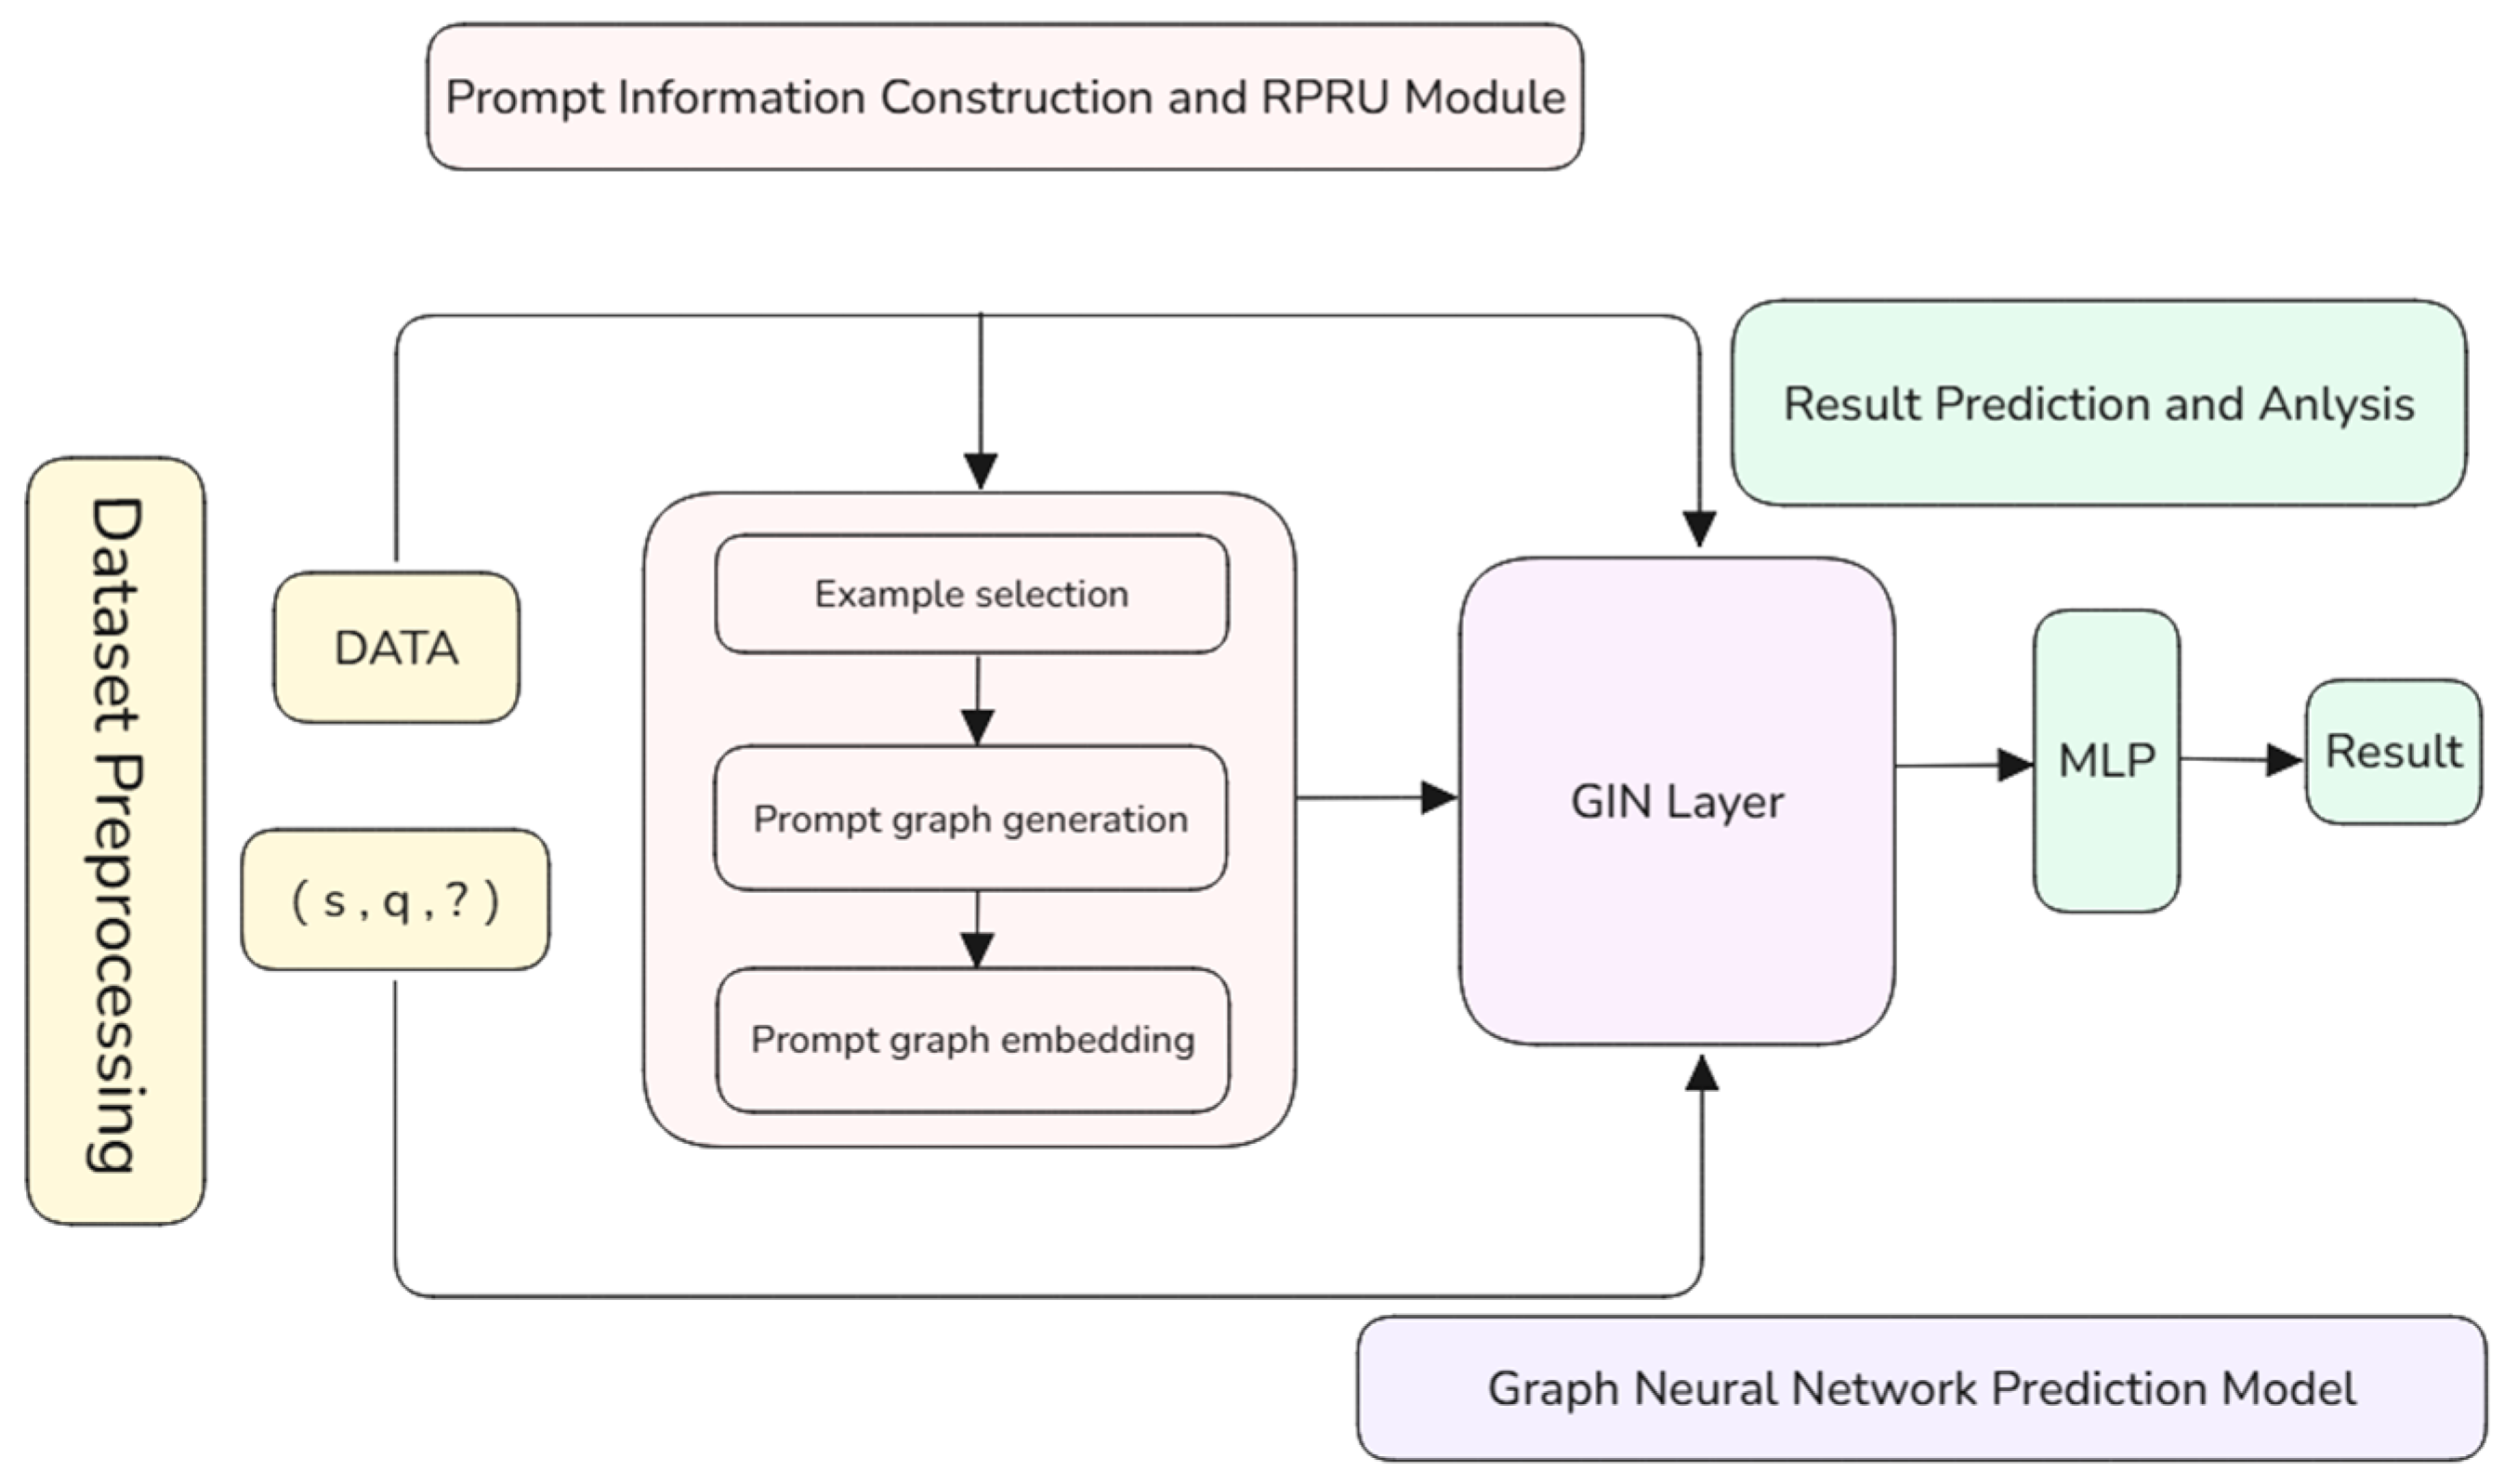
Figure 2 presents the overall architecture of the proposed KG-FLoc. The framework comprises four stages:
(1)
Dataset preprocessing, where raw telemetry, remote control, and remote signaling data are integrated into a unified graph structure;
(2)
Prompt information construction, which selects context-aware examples (e.g., historical fault patterns) and generates prompt graphs to guide model reasoning;
(3)
Graph neural network development, featuring an N-layer GIN with RGU modules to capture local-global dependencies;
(4)
Result prediction, where fault probabilities are computed via inner-product scoring between node embeddings and a learnable weight matrix.

3.1. Dataset Preprocessing

In the research and practice of circuit fault detection, the loading and processing of datasets is a crucial link. This dataset integrates data from three key aspects, namely remote signaling data, telemetry data, and remote-control data, which can comprehensively and meticulously reflect the operation status of the substation circuit system, real-time monitoring data, and operational control commands.
To make more effective use of these data, we integrate the data and build a graph structure based on the physical connections and logical relationships of the circuits. Specifically, we take circuit components as nodes in the diagram, and these components are the basic components of the circuit system. The connection relationship between components (e.g., electrical connection, control relationship) is used as an edge, and the existence of an edge reflects the interaction and correlation between the components. For example, in a remote signaling table, switches at different intervals and information about the association of switches, as well as the control signals for these components in the remote-control table, can be used to determine how and how the edges are connected and how they are connected. In order to ensure the consistency and correlation of data, we use the dot number as the unique identification of the node and associate the information about the same component in different tables through the dot number, and finally form a graph data structure that comprehensively reflects the running status of the circuit. This graph data structure will provide strong support for subsequent circuit fault detection, analysis, and optimization.

3.2. Prompt Information Construction and RPRU Module

In the process of using graph neural networks for circuit fault detection, we need to construct effective prompt information and process it through the RPRU module. The specific operation is to randomly select example circuit connection situations from the training dataset based on specific connection types. The circuit components involved in the examples and their adjacent components constitute the component context, while the connection paths between the components form the connection context. The component context and the connection context together make up the context information of the example. Based on this context information, a prompt graph is generated, and then the embedding representation of the prompt graph is obtained through an L-layer message—passing neural network that includes the RPRU module. This process specifically consists of three parts: example selection, prompt graph generation, and prompt graph embedding.

3.2.1. Example Selection

Based on the loaded circuit system data, according to the queried fault-related connection types (such as specific connection situations under a certain fault mode), find all the connection situations in the circuit connection set D = h , r , t h E , r R , t E that conform to this connection type. In the found connection set, remove the connection situations where the starting components or the ending components are the same. Then, randomly select n connection situations and add them to the example set S, satisfying S D   a n d   i , j 1 , | S | , ( h i , t i ) ( h j , t j ) . Here, D is the circuit connection set; ( h i , t i ) represents the starting component and the ending component corresponding to the i-th connection situation, respectively; and |S| represents the length of the set S of connection situations.

3.2.2. Prompt Graph Generation

Based on the example set S, a prompt graph is generated for each example according to the context information of the example connection situations, and the prompt graph G p = E p , R p , D is constructed. Here, Dis the circuit connection set; E p is the component set; and R p is the connection type set. In the topological structure representation of the heterogeneous graph, the elements in the component set E p correspond to the graph components, and the elements in the connection type set R p correspond to the graph edges. Two adjacent components are represented by a component pair, such as (u, v). Each example connection situation in the example set S consists of a starting component h, an ending component t, and the connection type between them.
For the example connection situation (h, r, t), the constructed prompt graph includes the adjacent components of its starting component h and ending component t, as well as the k-hop connection paths between them, where k is a hyperparameter representing the maximum length of the path from component h to t. The adjacent components of h and t and the components included in their k-hop connection paths are used to construct the component set E p , and the connection types between adjacent components and the connection types in the k-hop connection paths are extracted to form the connection type set R p .

3.2.3. Prompt Graph Embedding

First, initialize the vector representations of components e E p and connection types r R p in the prompt graph. Define the embedding vector h q of the target query connection type (i.e., the fault-related connection type we are concerned about) as the target condition for model inference. Second, encode the prompt graph and perform message passing through an L-layer message-passing neural network containing the RPRU module.
During the message passing process, for the example connection situation (u, r, v) in the example set S, v serves as the central component, and u represents an adjacent component of v. The RPRU module is used to fuse the information of component u, connection type r, and query connection type q. Their vector representations are input into the RPRU module, respectively. The message-passing process is as follows:
h u v l = R P R U h u l , h r l , h q
where h u ( l ) is the embedding representation of the adjacent component u at the l-th layer, h r l is the embedding representation of the connection type r between components (u, v) at the l-th layer;   h u v ( l ) represents the feature information obtained from h u l , h r l , h q through the RPRU module.
The calculation formulas of the RPRU are as follows:
f = σ W f h u l , h r l , h q + b f
g = σ W g h u l , h r l , h q + b g
h ~ = t a n h W h ~ ( f h u l ) + ( h r l h q ) + b h ~
h u v l = 1 f h r l + f h ~
where f represents the forget gate, σ represents the Sigmoid activation function; h u l is the embedding representation of the adjacent component u at the l-th layer, h r l is the embedding representation of the connection type r between components (u, v) at the l-th layer, W * is the trainable weight matrix; b * represents the trainable bias term; h ~ represents the candidate hidden state, g represents the update gate; , represents the concatenation operation; represents the dot-product operation; t a n h represents the hyperbolic tangent function. The process of message passing is as follows:
m u v l = α q W m e s s a g e l h u v l
where m u v ( l ) is the message passed from the adjacent component u N ( v ) to component v, N v represents the set of adjacent components of the central component v; W m e s s a g e l is the learnable parameter matrix at the l-th layer; α q is an attention weight related to the connection type and the query connection type, representing the correlation between the connection type r and the query connection type q.
Aggregate all the messages from the adjacent components and update the representation of the central component v:
h v l + 1 = A g g r e g a t i o n u N v m u v l , h v l
h r l + 1 = f ^ h v l + 1
where h v l + 1 represents the representation of the central component v at the (l + 1)-th layer, h r l + 1 represents the representation of the connection type r at the (l + 1) -th layer; N ( v ) represents the set of adjacent components of the central component v, A g g r e g a t i o n is an aggregation function, and common aggregation functions include summation, averaging, or max-pooling; f ^ is a mapping function, usually a simple copy operation.
After completing L layers of message passing, concatenate the connection type representations h r 1 , h r 2 · · · h r L generated by each layer of message passing in sequence to form a comprehensive connection-type representation matrix H p as the embedding of the prompt graph.

3.3. Graph Neural Network Prediction Model

In the process of using graph neural networks for circuit fault detection, building a prediction model is a crucial step. First, we need to perform the initial embedding of the connection types in the circuit system dataset. Initialize the embeddings of all connection types r R in the circuit system dataset to the prompt graph embeddings obtained in the previous prompt information construction stage, that is, V r ( 0 ) = H p , where V r ( 0 ) represents the initial embedding of the connection type r.
When given a queried circuit connection situation, we set the initial representations of the nodes. The representation of the starting component is initialized to the representation of the connection type, that is, V e ( 0 ) = V r ( 0 ) , where   V e ( 0 ) represents the initial embedding of the starting component, while the other components are represented as zero vectors
The update of the component representation is as follows:
V e l = G I N V e l 1 , V r l , N e , N r
where V e ( l ) is the embedding representation of component e at the l-th layer, V r l is the embedding representation of the connection type r at the l-th layer, N ( e ) is the set of neighbors of component e, and N ( r ) is the set of connection types between component e and its neighbors.
After N layers of message passing, the final embedding representation V e ( N ) of the updated component is obtained.

3.4. Result Prediction and Analysis

After completing the message passing of the graph neural network, we assign scores to the candidate components based on the final representations of the updated components during the message passing of the circuit system data. Specifically, the score s c o r e q is calculated through a weight matrix.
In circuit fault prediction, for a given fault-related information pair { s , q , o |o N o }; where N o is the set of candidate components, which is composed of the neighboring components of component s. Through the previously constructed GIN graph neural network, we can obtain the embedding representation V e ( N ) of each candidate component in the set. Then, the inner product of the embedding representation of each candidate component and the weight matrix W s c o r e is taken as the score of the candidate component. The score calculation formula is as follows:
s c o r e q e = W s c o r e V e N
where s c o r e q e represents the score when the candidate’s answer is component e; W s c o r e represents a weight matrix; V e ( N ) is the embedding representation of component e after N layers of GIN message passing. The component with the highest score is taken as the answer to the fault-related information pair s , q , o , which is used to assist in determining the location or cause of the circuit fault, etc.

4. Experiments

4.1. Dataset and Experimental Setup

The IEC 61850 standard, consisting of 10 parts, specifies substation communication layering, object-oriented data modeling, communication services, etc., and adopts a system configuration language to facilitate the realization of automation. The graph database for this study was programmatically constructed by parsing the Substation Configuration Description (SCD) files from two anonymized, operational 110 kV/220 kV intelligent substations in Linyi City, Shandong Province, China. As the core of the IEC 61850 standard, the SCD file is an XML-based configuration that provides a comprehensive blueprint of the entire substation automation system. It specifies the system’s communication layering, object-oriented data modeling, and configures all Intelligent Electronic Devices (IEDs) and their communication relationships. Our methodology leverages this standardized engineering file to build a structured knowledge graph through an automated pipeline, detailed in the following subsections. The selection of these substations is grounded in their representativeness: Linyi City is a major load center within the North China Power Grid, and the sampled substations embody the mainstream architecture and device configurations (e.g., protection relays, merging units) typical for this voltage level in China, ensuring the methodological relevance and generalizability of our findings while adhering to data security protocols.

4.1.1. Graph Construction from SCD Files

The SCD file serves as the foundational source for extracting the graph structure. All <IED> elements (e.g., protection devices, circuit breakers, merging units) are mapped to graph nodes. Each node is assigned features including its device_type (one-hot encoded based on its LNodeType), port_status (derived from telemetry data to indicate message reception/flow anomalies), and alarm_signals (e.g., communication failure). The edges, representing multi-dimensional relationships, are rigorously extracted from specific SCD sections: (1) GOOSE Links are established by analyzing <GSEControl> blocks (senders) and <Inputs> sections (receivers), creating directed edges of type Publishes_GOOSE_To; (2) SV Links are similarly created from <SampledValueControl> blocks and their subscriptions, resulting in edges of type Publishes_SV_To; (3) physical connections are inferred from <ConnectedAP> and <Address> elements, forming undirected edges of type Physically_Connected_To to model the underlying fiber optic network. This process ensures the resulting knowledge graph is a faithful and semantically rich representation of the secondary circuit’s design-time configuration and operational state.

4.1.2. Fault Sampling and Dataset Composition

The fault scope of the experiment focuses on one bus bay, two main transformer bays, and two line bays. The secondary circuit faults are sampled under different network configurations for the 110 kV and 220 kV voltage levels. The fault types in the dataset encompass a wide range of issues, including internal faults occurring within different types of equipment, such as transformers, circuit breakers, and protection relays, which are caused by factors like electrical failures, insulation breakdowns, or mechanical malfunctions. Additionally, faults can arise from problems with fiber optic and optical ports, which may lead to communication breakdowns between devices due to improper connections or physical damage. Another category includes faults related to circuit boards, which could involve failures in control panels, signal boards, or other types of equipment due to component degradation or short circuits. Furthermore, errors in fiber optic connections between devices can occur, resulting in loss of data transfer or improper link setups. Lastly, configuration mistakes in the setup of communication or power links between different devices can lead to operational disruptions, where devices are unable to communicate or function correctly due to misconfigurations or faulty settings in the network links. As shown in Table A1 (Appendix A), there are 25 fault types in total.
The number of faults is set to one to three simultaneous faults. A total of 1250 single fault graphs, 900 double fault graphs, and 800 triple fault graphs are sampled, and these are combined to create the dataset. In the fault graph, each node represents a secondary device (e.g., protection relays, merging units, switches) that generates alarms related to direct faults (e.g., hardware failure) and indirect impacts (e.g., communication link failures causing message loss). Table 1 illustrates the properties of different fault compositions. In Table 1, the average number of nodes (i.e., #Average Nodes) refers to the average count of devices (nodes) affected in each fault sample, including both directly faulty devices and indirectly associated devices that trigger alarms due to network connectivity or communication status changes. Single fault graphs have an average of 3.91 nodes, which means that a single fault often affects 3–4 devices. For example, a fiber fault may directly impact connected devices (e.g., merging units) and indirectly trigger alarms in subscribed devices (e.g., protection relays). Multi-fault graphs (e.g., single + double + triple) possess higher node counts, reflecting the expanded propagation scope when multiple faults occur simultaneously.

4.2. Competing Models

The proposed KG-FLoc is compared with four baseline models: support vector machine (SVM) [23], random forest (RF) [24], multilayer perceptron (MLP) [25], and graph neural networks (GNN) [26]. SVM, RF, and MLP are mainly applicable to tabular data. Therefore, graph-structured inputs are transformed into tabular form via graph embedding techniques (e.g., Graph2Vec), and dimension reduction techniques (e.g., PCA) are also employed. To address varying node counts across different fault graphs and ensure consistent input dimensions across all models, the experiments implement zero-padding for featureless nodes in graph samples.
The hyperparameter range of SVM: kernel type {RBF, Linear}, regularization parameter C 0.1,1 , 10,100 , scale parameter γ 0.01,0.1 . The hyperparameter range of RF: number of decision trees (i.e., n estimators) 100,500 , max_depth 8,20 , min_samples_split 2,5 , 10 . The hyperparameter range of MLP: hidden layer size 256,512,1024 , number of layers 2 to 4, learning rate 0.001,0.01 . The hyperparameters of GNN include model depth (ranging from 1 to 3 layers), the range of channel sizes 64,128,256,512 , and aggregation strategies (such as add, mean, max, and GCN). The learning rate varies between 0.005 and 0.02, with batch sizes in the range of 32,64,128 . GNN updates node features via neighborhood aggregation and nonlinear transformation (e.g., ReLU). The hyperparameters for SVM and RF were selected through 5-fold cross-validation, while those for MLP and GNN were selected by the Optuna library [27]. After hyperparameter selection, the training process was divided into a training set and a test set according to the ratio of 4:1.
All experimental implementations were coded in Python 3.13.5. The baseline models—SVM and RF—were developed using the scikit-learn library, while the multilayer perceptron (MLP) was built with PyTorch 2.6.0. For graph-based models (GNN and KG-FLoc), we leveraged PyTorch Geometric (PyG) for graph operations, accelerated by Ninja compilation and configured via EasyDict. This setup fully exploits modern deep learning frameworks’ flexibility and computational efficiency.
Model training was conducted on an NVIDIA RTX A100 GPU (80 GB VRAM) (NVIDIA, Santa Clara, CA, USA) with 50 epochs of iterative learning. This configuration ensures comprehensive learning of latent data patterns while balancing computational costs, thereby enhancing generalization performance.

4.3. Performance Analysis

Performance is evaluated by taking the average accuracy of 10 independent trials for each model. The accuracy is the commonly used evaluation metric for fault location in the secondary circuit:
Accuracy = Number   of   positive   samples   with   correct   judgement Number   of   samples   judged   positive   by   the   model × 100 %
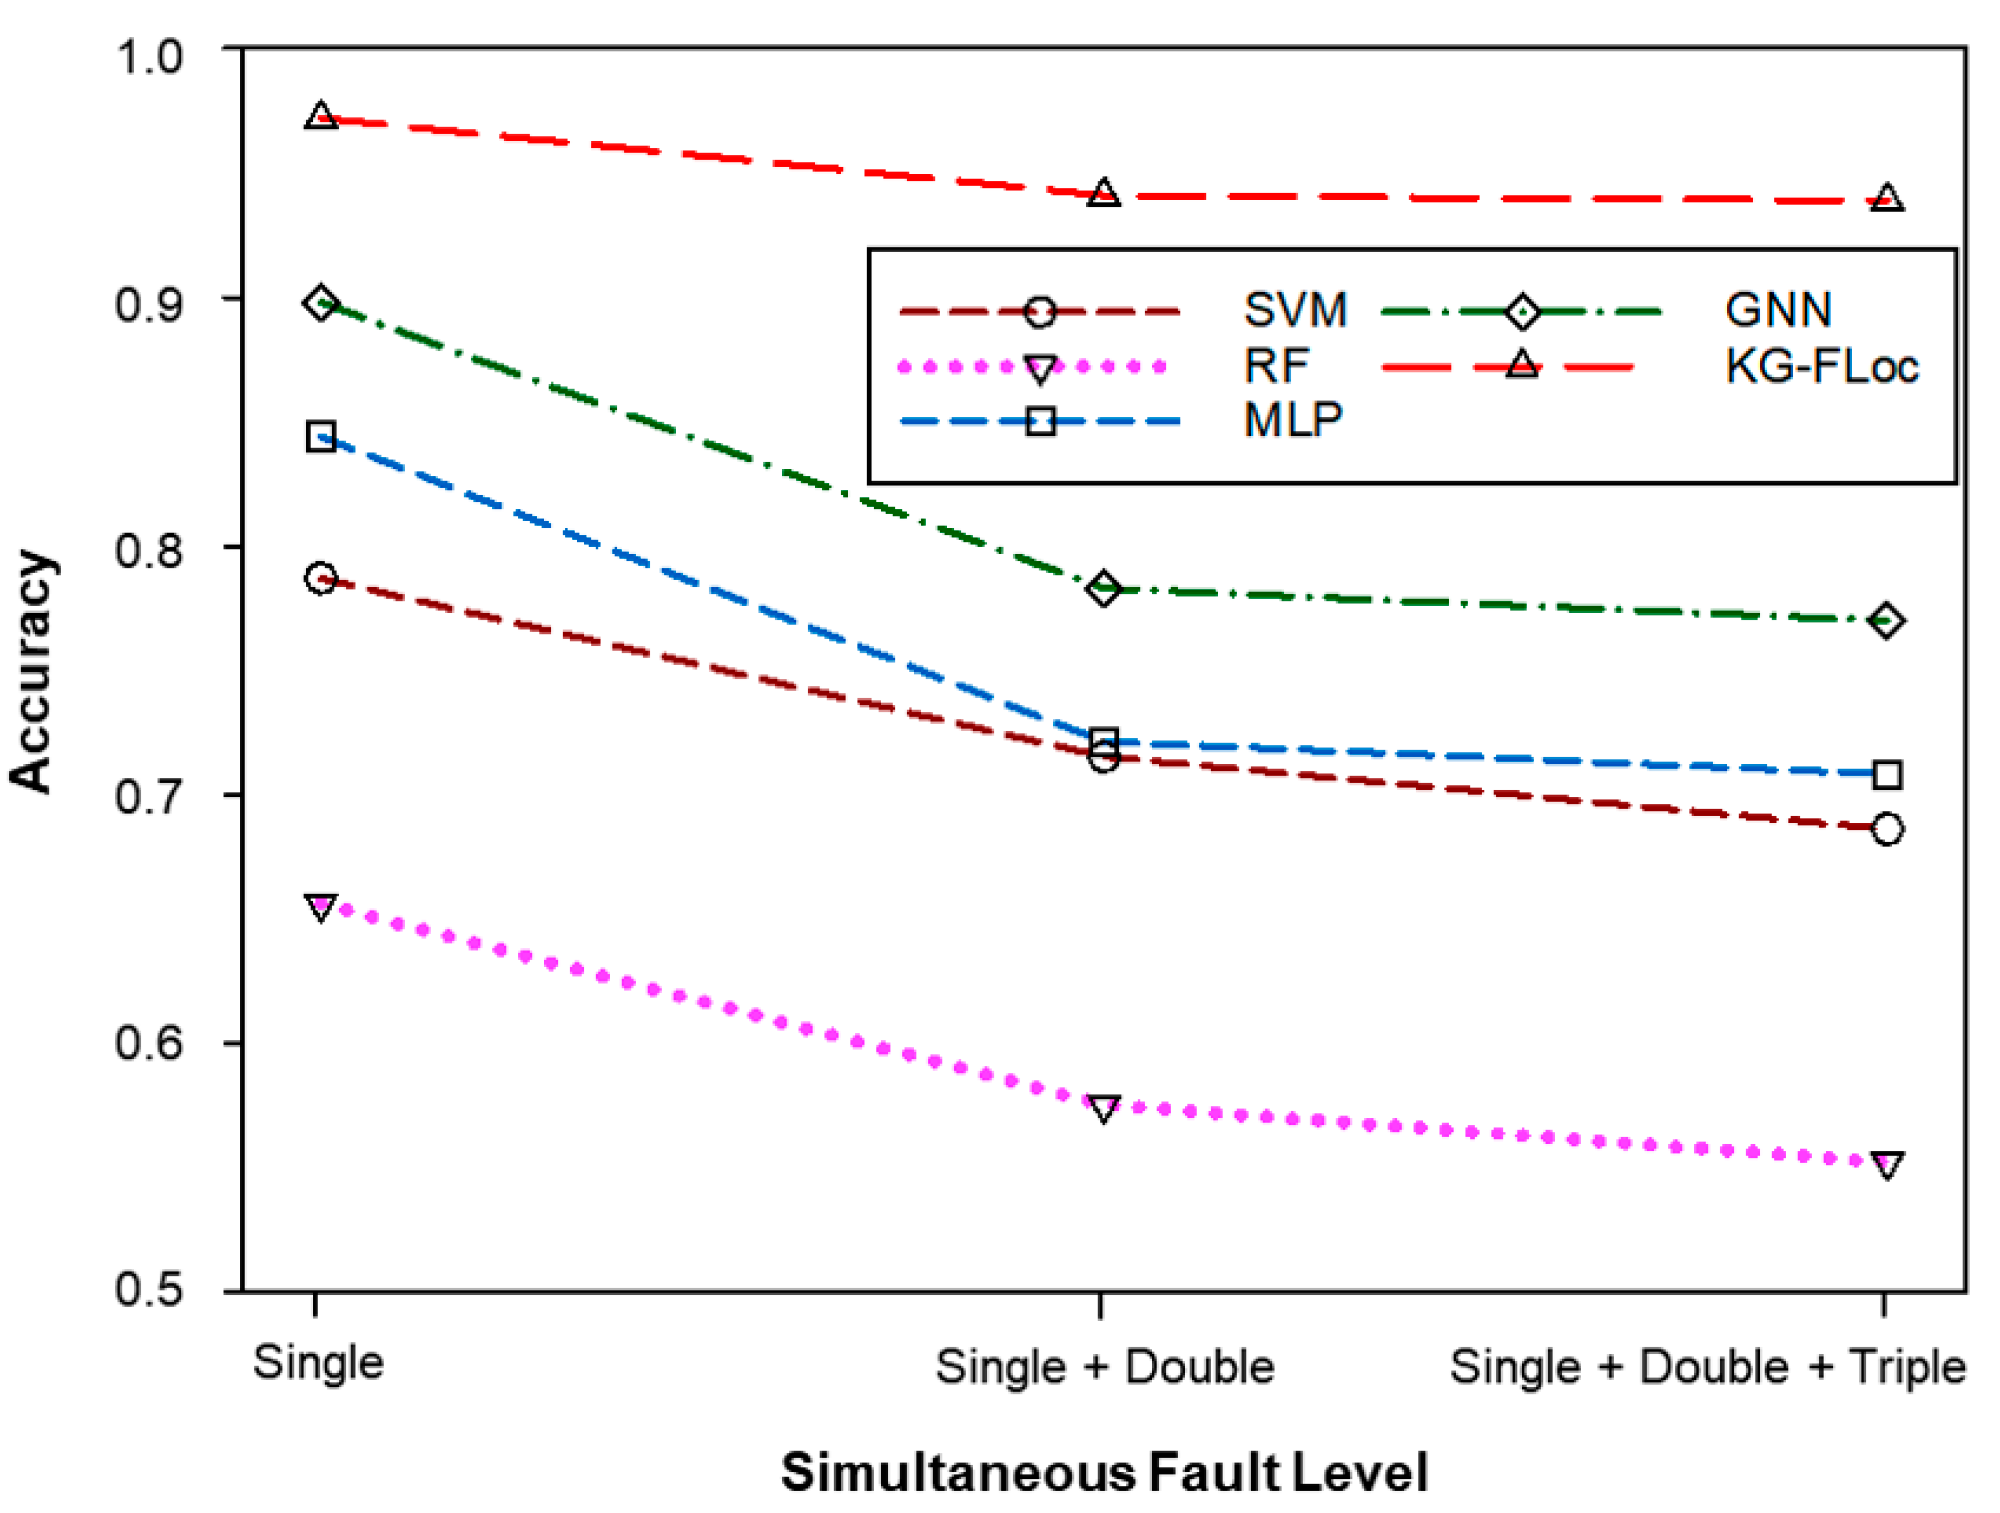
For samples with multiple faults, the accuracy is calculated only when all fault types are predicted correctly. Table 2 illustrates the accuracies (and their standard deviations of 10 independent trials) achieved by the proposed KG-FLoc and the other four baseline fault location models across different levels of simultaneous faults, where the highest score and lowest standard deviation (SD) are highlighted in bold. To facilitate comparison, Figure 3 and Figure 4 show the accuracy curve and the stability (in the form of standard deviation histograms) of all employed models across different levels of simultaneous faults, respectively.
As illustrated in Table 2, KG-FLoc consistently maintains the highest accuracy and lowest SD over different levels of simultaneous faults. As shown in Figure 3, the baselines, such as GNN, SVM, RF, and MLP, suffer from a significant performance decline when moving from single-fault to two-simultaneous-fault datasets, whereas KG-FLoc exhibits only a slight degradation in performance.
The proposed KG-FLoc framework introduces a logical reasoning mechanism that jointly exploits topological structures and semantic relationships, overcoming the limitations of conventional GNNs in handling complex interdependencies. This framework abstracts secondary components (such as circuit breakers, disconnectors, and measuring devices) as graph nodes and defines edges between nodes based on multi-dimensional relationships, including electrical connections, control logic, and information flow channels. This approach overcomes the limitation of traditional GNNs that isolate node feature processing without considering the complex logical correlations between components. By designing a relation-aware neuron RPRU module with gating mechanisms (forget gate, input gate, output gate), the model dynamically fine-tunes information flow to accurately capture both local component characteristics (e.g., device state parameters) and global topological dependencies (e.g., control logic constraints across circuits), thereby significantly enhancing the global consistency and detail precision of fault localization.
The observed model performances (Table 2) and their underlying trends (Figure 3) can be attributed to the following factors:
  • For single-fault datasets, the complexity of the involved nodes is limited, allowing general models to handle fault location tasks effectively under such scenarios.
  • When the double simultaneous fault dataset is introduced, multiple faults involve a greater number of nodes and significantly increase the inter-node correlation complexity. This results in higher confusion among different classes and a corresponding decrease in classification accuracy.
  • The relationships among nodes are primarily captured in the double simultaneous fault dataset; even with the introduction of a triple simultaneous fault dataset, the performance does not degrade significantly.
In addition, as shown in Figure 4, KG-FLoc and SVM demonstrate relatively strong stability compared with the other three baselines. Although GNN achieves higher accuracy than SVM, RF, and MLP, it tends to overfit specific patterns in the training graphs, resulting in unstable generalization to new graphs. Compared with traditional graph neural network methods that rely on simple message passing, this model constructs a hierarchical graph neural network architecture by integrating N-layer GIN into the message passing mechanism. This design preferentially utilizes graph prompt information (such as standardized control logic rules and historical fault modes) during training and inference, effectively shielding interference from irrelevant physical connection noise and transient measurement errors. The GIN-based mechanism filters uninformative edges while aggregating structural information of the system, ensuring that the model focuses on semantically meaningful logical relationships (such as control signal transmission paths and protection device coordination logic), thereby enhancing the stability of prediction results in complex operating scenarios. In summary, the experimental results confirm the superiority of KG-FLoc in terms of both accuracy and stability.
To provide a deeper analysis of the model’s performance beyond overall accuracy, we further evaluate KG-FLoc using the macro-average F1-score and examine the per-class error distribution via a normalized confusion matrix, as shown in Figure 5. The F1-score, being the harmonic mean of precision and recall, is particularly informative for multi-class fault diagnosis where the cost of misclassifying certain critical faults (e.g., protection relay failures) is high.
The macro-average F1-scores for KG-FLoc and the baseline models under the single-fault scenario are presented in Table 3. KG-FLoc achieves a macro-average F1-score of 0.965, significantly outperforming the best baseline (GNN) by over 7 percentage points. This indicates its superior capability to balance precision and recall across all 25 fault classes.
Analysis of the confusion matrix in Figure 5 reveals insightful patterns about the model’s error distribution. The strong diagonal concentration confirms high accuracy across most fault types, while specific confusion patterns between semantically similar faults (e.g., fiber optic cable vs. port failures) are clearly visible in the off-diagonal elements. For instance, a noticeable proportion of “Fiber Optic Cable Fault” (Class 9) instances are misclassified as “Fiber Optic Port Failure” (Class 8), as both disrupt communication links and generate highly similar symptom patterns. Similarly, some confusion exists between different protection relay faults (Classes 5, 13, 14) due to their overlapping manifestations in the alarm data. Nevertheless, the model demonstrates robust discrimination capability for the majority of fault types, with particularly high accuracy for critical faults like transformer and circuit breaker failures.

4.4. Ablation Study

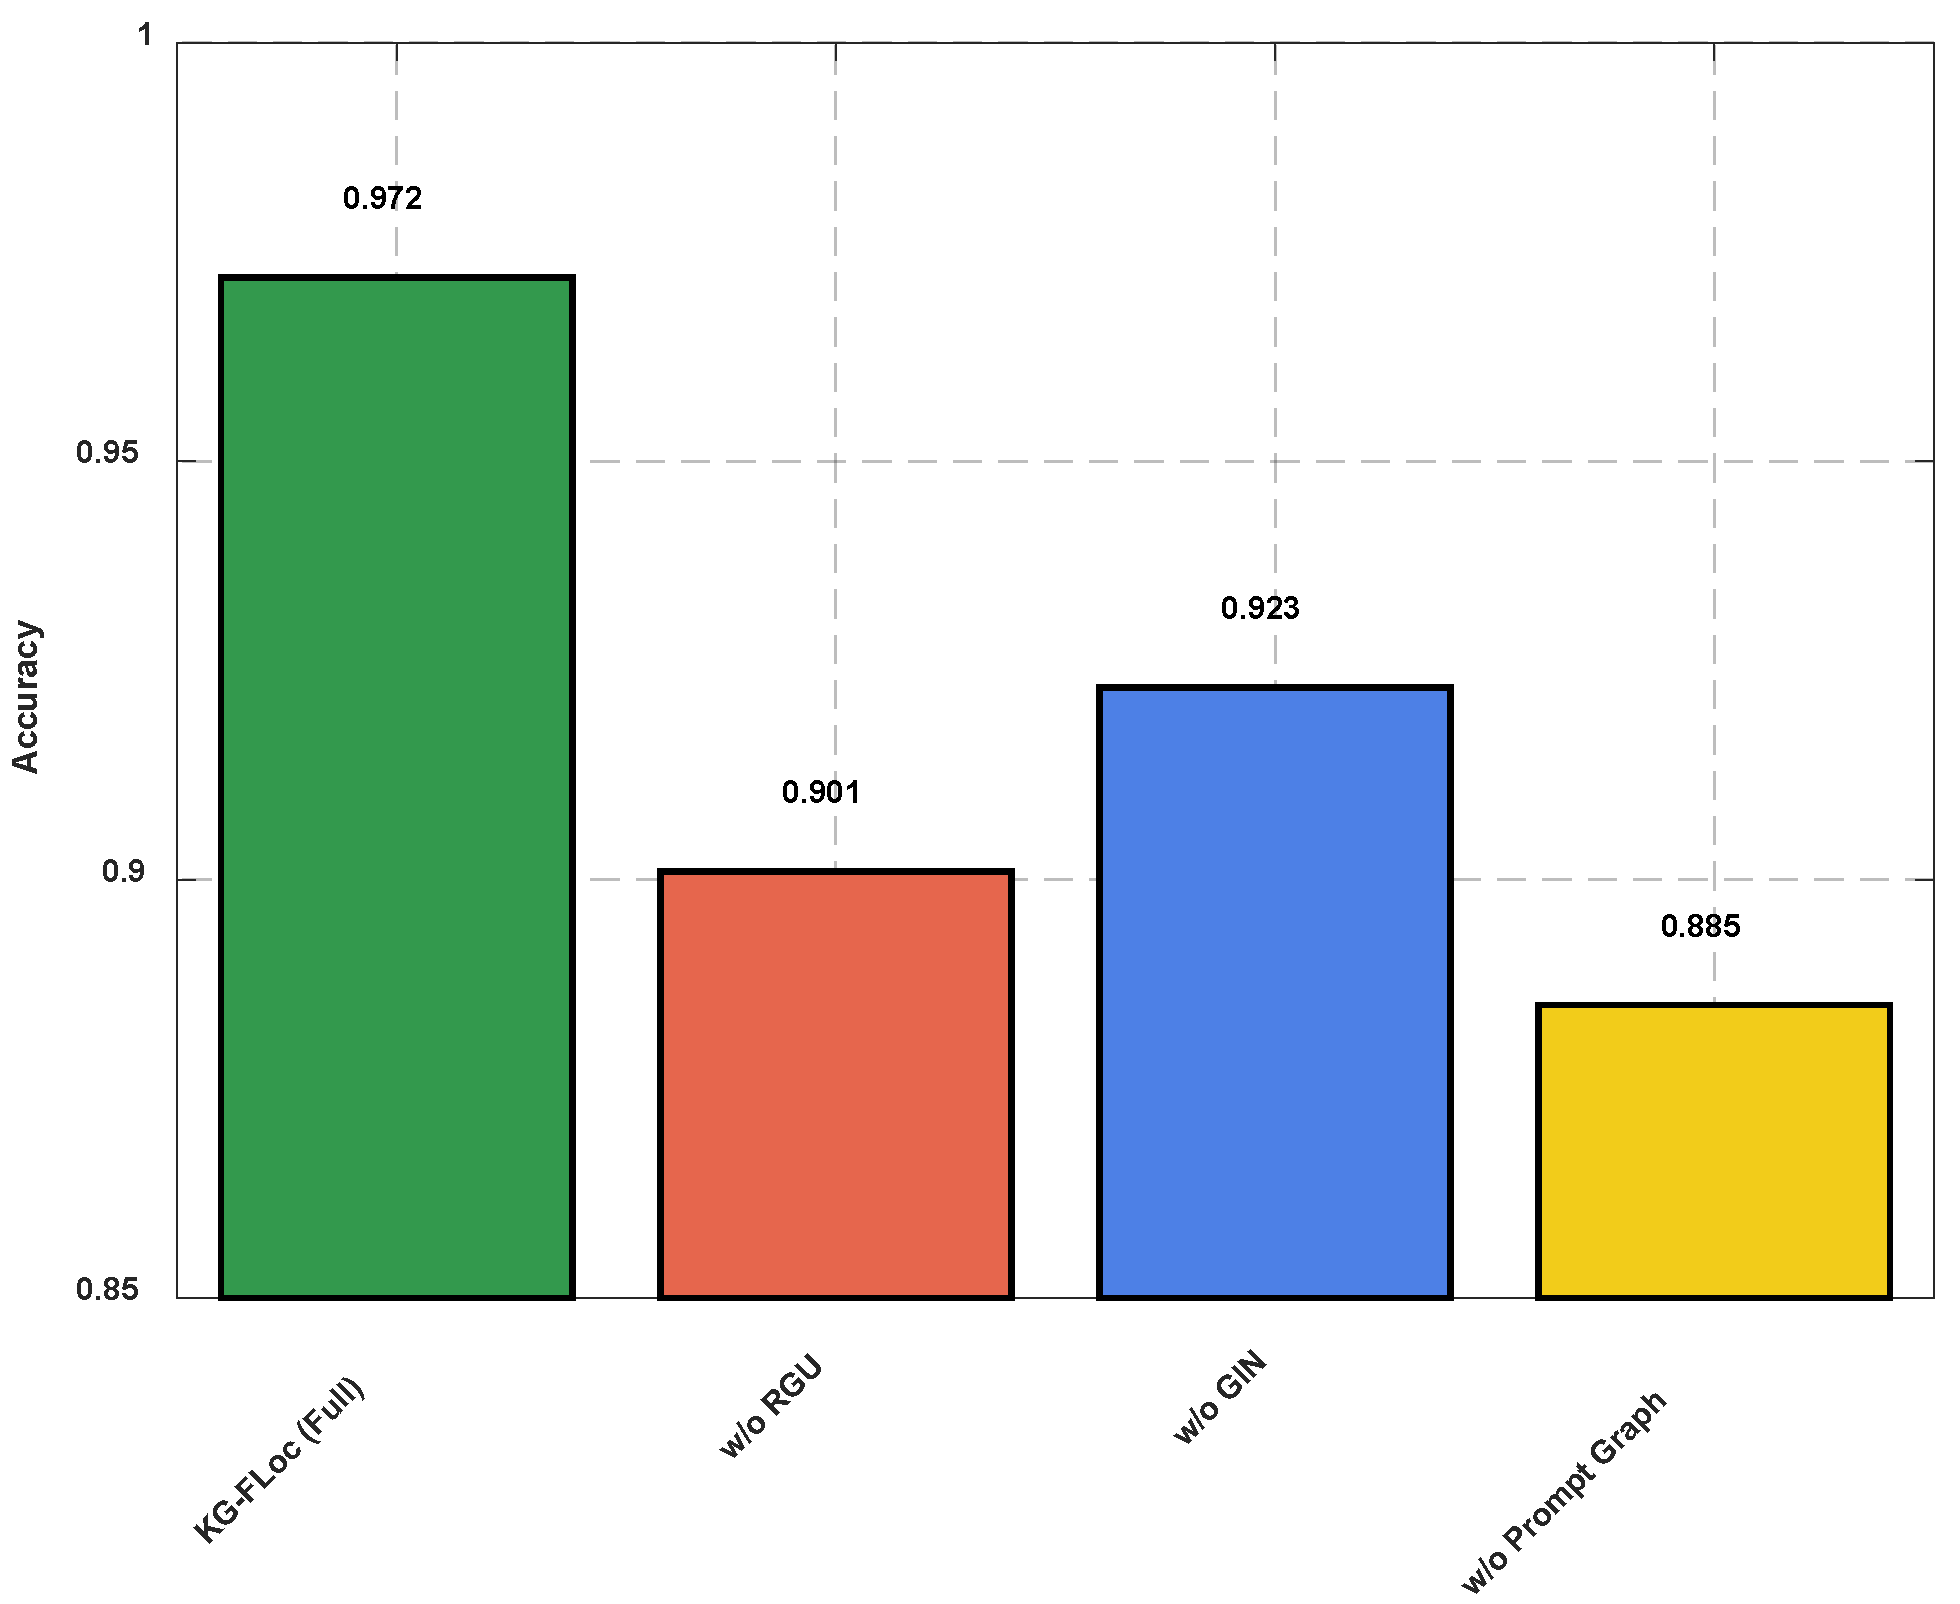
To further validate the effectiveness of the core components in KG-FLoc and quantitatively justify the high accuracy achieved, we conducted a comprehensive ablation study. The performance of the full KG-FLoc model was compared against three degraded variants: (1) w/o RGU: the relation-aware gated unit is replaced with a simple feature concatenation operation; (2) w/o GIN: the GIN backbone is replaced with a standard graph convolutional network (GCN); and (3) w/o Prompt Graph: the model is initialized randomly instead of using the knowledge-aware embeddings from the prompt graph. The results on the single-fault dataset are summarized in Table 4.
The results of our ablation study, presented in Table 3 and visually summarized in Figure 6, clearly demonstrate the critical contribution of each component to KG-FLoc’s overall performance. As shown, the full model achieves 97.2% accuracy, while removing any key component leads to significant performance degradation. The most substantial drop of 7.1% occurs when replacing the relation-aware gated unit (RGU) with simple concatenation, underscoring its critical role in dynamic information filtering. Substituting the GIN backbone with standard GCN causes a 4.9% decrease, confirming GIN’s superior capability in capturing hierarchical graph structures. Most notably, removing the prompt graph initialization results in the largest performance degradation of 8.7%, demonstrating that our knowledge-aware initialization provides an essential inductive bias that guides the model to learn more effectively from sparse fault data. These results collectively affirm that each proposed component is indispensable for achieving the state-of-the-art performance of KG-FLoc.
The performance of the full model (97.2% accuracy) reported in the ablation study (Table 4/Figure 6) was assessed by evaluating the complete KG-FLoc architecture under the identical training–testing split and experimental setup as described in the main experiments (Section 4.3). This ensures a fair and direct comparison with the ablated variants.

5. Conclusions

This paper presents KG-FLoc, a knowledge graph-enhanced framework for secondary circuit fault localization in intelligent substations. By reformulating fault diagnosis as a link prediction task in a multi-relational knowledge graph, and designing a relation-aware gated unit (RGU) with GIN-based message passing, KG-FLoc achieves 97.2% accuracy in single-fault scenarios and 93.9% accuracy in triple-fault scenarios, surpassing traditional rule-based methods and vanilla GNNs. The key innovations lie in (1) the first formalization of secondary circuits as a knowledge graph with semantic relationships, and (2) the dynamic feature fusion mechanism through RGU, which adaptively balances local device states and global topological dependencies. Future work will focus on three directions:
(1)
Online Adaptation: Developing incremental learning algorithms to handle dynamic topology changes in secondary circuits without retraining.
(2)
Knowledge-Large Model Synergy: Integrating pre-trained language models (e.g., GPT-4) to enhance contextual reasoning for rare fault patterns.
(3)
Edge Deployment: Optimizing KG-FLoc into a lightweight version deployable on substation edge devices, targeting latency < 10 ms per inference.
Meanwhile, we plan to explore verification issues across different regions and voltage levels for the next work and will also implement dynamic knowledge update and incremental learning in the task of quadratic circuit fault detection.

Author Contributions

Methodology, X.S. and X.Y.; Software, C.C., J.S. and W.X.; Validation, X.S., C.C., X.Y. and J.S.; Formal analysis, H.Q.; Investigation, W.X.; Resources, S.W.; Writing—original draft, C.C., X.Y. and H.Q.; Writing—review & editing, X.S.; Visualization, S.W.; Supervision, X.S. All authors have read and agreed to the published version of the manuscript.

Funding

This research received no external funding.

Data Availability Statement

The data presented in this study are available on request from the corresponding author.

Conflicts of Interest

The authors declare no conflict of interest.

Appendix A

Table A1. Fault type description.
IDFault TypeDescription
1Transformer FaultFaults occurring within the transformer, such as winding short circuits, insulation failures, or internal component damage that disrupt the transformer’s function.
2Circuit Breaker FaultFaults in the breaker mechanism, such as mechanical failure, improper operation, or electrical faults leading to arcing or improper isolation.
3Busbar FaultFaults within the busbar, which may include grounding issues or short circuits between busbar sections, causing disruptions in power flow.
4Disconnector FaultFaults within the disconnector (or isolator) that prevent proper isolation of sections during maintenance or failure to disconnect during operation.
5Protection Relay FaultMalfunction or failure of protection relays, leading to incorrect detection or response to faults in the system.
6Current Transformer (CT) FaultFailure of the current transformer, resulting from short circuits, saturation, or mechanical issues, affecting current measurement and protection functionality.
7Voltage Transformer (VT) FaultFaults in voltage transformers, including insulation failure, open circuits, or incorrect voltage scaling that disrupt system measurements.
8Fiber Optic Port FailureFailure in the fiber optic communication ports, either from internal device faults or connection issues, affecting data transmission between devices.
9Fiber Optic Cable FaultPhysical damage or misconnection in the fiber optic cables, leading to loss of communication or improper data transfer between devices.
10Board Fault (Control Panel)Faults in control panels or boards, including issues like component burnout, incorrect wiring, or malfunctioning digital or analog circuits affecting system control.
11Switchgear FaultFaults within switchgear, such as incorrect switching or failure in isolation between electrical sections, often due to mechanical wear or electrical malfunction.
12Power Capacitor FaultInternal issues within power capacitors, such as short circuits or dielectric failure, affecting reactive power compensation and voltage stability.
13Overvoltage Protection Relay FaultFault in the relay designed to protect against overvoltage conditions, potentially leading to false tripping or non-response during actual overvoltage conditions.
14Undervoltage Protection Relay FaultFailure of the undervoltage protection relay, which may not operate correctly under low voltage conditions, leading to potential system instability.
15Insulation FailureBreakdown of insulation materials in electrical components, leading to short circuits or leakage currents, posing a risk of further equipment damage.
16Overcurrent FaultFault caused by a current exceeding the rated capacity, often resulting in equipment damage due to excessive thermal or mechanical stress.
17Grounding FaultFaults due to improper grounding or loss of ground connection, leading to unsafe voltage levels and potential electrical shock hazards.
18Arc FlashA type of fault resulting in an electric arc flash, which can cause severe damage to electrical components and pose significant safety risks to personnel.
19Short Circuit between BusbarsA direct short circuit between two busbars, often leading to high fault currents and potential damage to circuit breakers and transformers.
20Transformer Oil LeakLeaks or spills of insulating oil in transformers, which can result in system contamination, overheating, and fire hazards.
21Switchgear Contact FaultFaults related to the contacts in switchgear, leading to improper closure or opening of circuits, affecting the overall reliability of the system.
22Misconnection between SubstationsFault caused by incorrect wiring or configuration between substations, leading to unexpected behavior or failure of the system’s operation.
23Overheating of EquipmentOccurs when electrical components such as transformers, cables, or circuit breakers exceed their rated operating temperature, resulting in thermal damage.
24Mechanical Fault in GeneratorFaults in the mechanical components of a generator, such as rotor imbalance or mechanical wear, leading to operational failures or inefficiency.
25Loss of SynchronizationOccurs when generators or electrical machines fail to remain synchronized, causing disruptions in power flow or potential damage to generators.

References

  1. Xiang, X.M.; Dong, X.C.; He, J.Q.; Zheng, Y.K.; Li, X.Y. A study on the fault location of secondary equipment in smart substation based on the graph attention network. Sensors 2023, 23, 9384. [Google Scholar] [CrossRef]
  2. Peng, Z.; Chen, G.; Zhang, J.; Liu, J.; Chen, J.; Wang, J. Method for locating secondary circuit faults in substations based on graph neural networks. Heliyon 2024, 10, e40042. [Google Scholar] [CrossRef] [PubMed]
  3. Chen, F.; Luo, J.; Wang, R.; Shi, Q.; Yang, J.; Wu, T. Research on fault diagnosis method of substation relay protection secondary circuit based on improved DS evidence theory. Measurement 2025, 256, 118232. [Google Scholar] [CrossRef]
  4. Kuang, H.; Yi, P.; Luo, Y.; Tan, J.; Yin, H.; Wei, S.; Wang, R. Research on Fault Diagnosis Method of Secondary Equipment in Intelligent Substation. J. Phys. Conf. Ser. 2022, 2260, 012020. [Google Scholar] [CrossRef]
  5. Shiping, E.; Zhang, H.; Liu, D.; Wang, Z.; Zhang, K.; Zhao, S.; Li, H. Fault Diagnosis of Secondary Equipment Based on Big Data of Smart Substation. In Proceedings of the 2022 4th Asia Energy and Electrical Engineering Symposium (AEEES), Chengdu, China, 25–27 March 2022; IEEE: Piscataway, NJ, USA, 2022; pp. 869–873. [Google Scholar]
  6. Wang, L.; Zheng, J.; Zhou, H.; Pei, Y.; Chang, Z.; Fan, C.; Lv, L. Research on Fault Diagnosis Methods for Secondary Circuits in Smart Substations. In Proceedings of the International Joint Conference on Energy, Electrical and Power Engineering, Singapore, 22–24 November 2024; Springer Nature Singapore: Singapore, 2024; pp. 494–502. [Google Scholar]
  7. Wang, J.; Jing, S.; Yao, Y.; Wang, K.; Li, B. A state evaluation and fault diagnosis strategy for substation relay protection system integrating multiple intelligent algorithms. J. Eng. 2024, 2024, e70013. [Google Scholar] [CrossRef]
  8. Tanaka, T.; Uezono, T.; Suenaga, K.; Hashimoto, M. In-Situ Hardware Error Detection Using Specification-Derived Petri Net Models and Behavior-Derived State Sequences. arXiv 2025, arXiv:2505.04108. [Google Scholar]
  9. Yan, Z.; Xu, F.; Tan, J.; Liu, H.; Liang, B. Reinforcement learning-based integrated active fault diagnosis and tracking control. ISA Trans. 2023, 132, 364–376. [Google Scholar] [CrossRef] [PubMed]
  10. Li, C.; Wang, B. A knowledge graph method towards power system fault diagnosis and classification. Electronics 2023, 12, 4808. [Google Scholar] [CrossRef]
  11. Ma, M.; Zhu, J. Interpretable Recurrent Variational State-Space Model for Fault Detection of Complex Systems Based on Multisensory Signals. Appl. Sci. 2024, 14, 3772. [Google Scholar] [CrossRef]
  12. Shen, J.; Yang, S.; Zhao, C.; Ren, X.; Zhao, P.; Yang, Y.; Han, Q.; Wu, S. FedLED: Label-free equipment fault diagnosis with vertical federated transfer learning. IEEE Trans. Instrum. Meas. 2024, 73, 1–10. [Google Scholar] [CrossRef]
  13. Wang, Z.; Zhang, Z.; Zhang, X.; Du, M.; Zhang, H.; Liu, B. Power system fault diagnosis method based on deep reinforcement learning. Energies 2022, 15, 7639. [Google Scholar] [CrossRef]
  14. Cui, Y.; Sun, Z.; Hu, W. A prompt-based knowledge graph foundation model for universal in-context reasoning. Adv. Neural Inf. Process. Syst. 2024, 37, 7095–7124. [Google Scholar]
  15. Zhou, H.; Huang, J.; Zhang, C. Petri net based fault diagnosis for GOOSE circuits of smart substation. South. Power Syst. Technol. 2017, 11, 49–56. [Google Scholar]
  16. Volkanovski, A.; Čepin, M.; Mavko, B. Application of the fault tree analysis for assessment of power system reliability. Reliab. Eng. Syst. Saf. 2009, 94, 1116–1127. [Google Scholar] [CrossRef]
  17. Fan, G.F.; Wei, X.; Li, Y.T.; Hong, W.C. Fault detection in switching process of a substation using the SARIMA–SPC model. Sci. Rep. 2020, 10, 11417. [Google Scholar] [CrossRef] [PubMed]
  18. Ullah, I.; Yang, F.; Khan, R.; Liu, L.; Yang, H.; Gao, B.; Sun, K. Predictive maintenance of power substation equipment by infrared thermography using a machine-learning approach. Energies 2017, 10, 1987. [Google Scholar] [CrossRef]
  19. Hong, J.; Kim, Y.H.; Nhung-Nguyen, H.; Kwon, J.; Lee, H. Deep-learning based fault events analysis in power systems. Energies 2022, 15, 5539. [Google Scholar] [CrossRef]
  20. Qiu, X.; Du, X. Fault Diagnosis of TE Process Using LSTM-RNN Neural Network and BP Model. In Proceedings of the 2021 IEEE 3rd International Conference on Civil Aviation Safety and Information Technology (ICCASIT), Weihai, China, 15–17 October 2021; IEEE: Piscataway, NJ, USA, 2021; pp. 670–673. [Google Scholar]
  21. Nguyen, B.L.; Vu, T.V.; Nguyen, T.T.; Panwar, M.; Hovsapian, R. Spatial-temporal recurrent graph neural networks for fault diagnostics in power distribution systems. IEEE Access 2023, 11, 46039–46050. [Google Scholar] [CrossRef]
  22. Xu, K.; Hu, W.; Leskovec, J.; Jegelka, S. How Powerful Are Graph Neural Networks? arXiv 2018, arXiv:1810.00826. [Google Scholar]
  23. Brusamarello, B.; Da Silva, J.C.C.; de Morais Sousa, K.; Guarneri, G.A. Bearing fault detection in three-phase induction motors using support vector machine and fiber Bragg grating. IEEE Sens. J. 2022, 23, 4413–4421. [Google Scholar] [CrossRef]
  24. Fezai, R.; Dhibi, K.; Mansouri, M.; Trabelsi, M.; Hajji, M.; Bouzrara, K.; Nounou, H.; Nounou, M. Effective random forest-based fault detection and diagnosis for wind energy conversion systems. IEEE Sens. J. 2020, 21, 6914–6921. [Google Scholar] [CrossRef]
  25. Tang, W.; Huang, G.; Li, G.; Yang, G.; Geng, X.X. Measurement Performance Improvement Method for Optically Pumped Magnetometer based on Multilayer Perceptron. IEEE Sens. J. 2024, 24, 38851–38860. [Google Scholar] [CrossRef]
  26. Wang, H.; Liu, Z.; Li, M.; Dai, X.; Wang, R.; Shi, L. A Gearbox Fault Diagnosis Method Based on Graph Neural Networks and Markov Transform Fields. IEEE Sens. J. 2024, 24, 25186–25196. [Google Scholar] [CrossRef]
  27. Akiba, T.; Sano, S.; Yanase, T.; Ohta, T.; Koyama, M. Optuna: A next-generation hyperparameter optimization framework. In Proceedings of the 25th ACM SIGKDD International Conference on Knowledge Discovery & Data Mining, Anchorage, AK, USA, 4–8 August 2019; ACM: New York, NY, USA, 2019; pp. 2623–2631. [Google Scholar]
Figure 1. Conversion of secondary circuit fault data into knowledge graph triplets: (Left) Raw data records device identifiers, link interruption types, and affected receivers. (Right) Triplets (h, r, t) are constructed, where missing edges (dashed red lines) represent faults to be predicted. Example query: (IB2234B, Gocb0_Link_Failure, ?).
Electronics 14 04006 g001
Figure 2. The overall architecture of the proposed KG-FLoc: First, preprocess the relevant dataset for subsequent operations. Then, construct the prompt information and use the RPRU module to update the representation based on the relationship-aware prompts. At the same time, develop a graph neural network prediction model using the N-layer graph isomorphism network (GIN) architecture to process the data. Finally, use the developed model to predict the results and then analyze the prediction results to evaluate the performance of fault prediction.
Electronics 14 04006 g002
Figure 3. Accuracy curve of fault location models across different levels of simultaneous faults.
Electronics 14 04006 g003
Figure 4. Accuracy standard deviation histogram of fault location models across different levels of simultaneous faults.
Electronics 14 04006 g004
Figure 5. Normalized confusion matrix for KG-FLoc (single-fault scenario). The matrix is normalized by true class (rows) to show recall rates. Diagonal elements represent correct classifications, while off-diagonal elements indicate misclassification patterns between the 25 fault types.
Electronics 14 04006 g005
Figure 6. Ablation study results: performance impact of removing individual components from KG-FLoc.
Electronics 14 04006 g006
Table 1. Different fault compositions.
Simultaneous#Graphs#Fault Classes#Average Node Count#Average Edges
Single1250253.913.28
Single + Double2150256.145.77
Single + Double + Triple2950257.787.45
Table 2. Accuracy of fault location models on different levels of simultaneous faults.
ModelLevel of Simultaneous Faults
SingleSingle + DoubleSingle + Double + Triple
SVM0.787 (±0.008)0.715 (±0.011)0.686 (±0.015)
RF0.656 (±0.032)0.575 (±0.044)0.552 (±0.048)
MLP0.844 (±0.025)0.721 (±0.052)0.708 (±0.065)
GNN0.898 (±0.024)0.783 (±0.055)0.770 (±0.076)
KG-FLoc0.972 (±0.007)0.941 (±0.011)0.939 (±0.014)
Table 3. Macro-average F1-score of fault location models on the single-fault scenario.
ModelMacro-Average F1-Score
SVM0.761
RF0.632
MLP0.821
GNN0.894
KG-FLoc0.965
Table 4. Results of the ablation study on the single-fault dataset.
Model VariantAccuracy
KG-FLoc (Full Model)97.2%
w/o RGU (Replaced with concatenation)90.1%
w/o GIN (Replaced with GCN)92.3%
w/o Prompt Graph (Random initialization)88.5%
Disclaimer/Publisher’s Note: The statements, opinions and data contained in all publications are solely those of the individual author(s) and contributor(s) and not of MDPI and/or the editor(s). MDPI and/or the editor(s) disclaim responsibility for any injury to people or property resulting from any ideas, methods, instructions or products referred to in the content.