1. Introduction
With the continuous advancement of digital transformation in the power industry, critical infrastructures such as the State Grid Corporation of China are increasingly adopting cloud-native architectures [
1,
2]. These transformations have enabled distributed deployment, elastic scaling, and high service availability across platforms that deliver power grid services—including customer billing, outage diagnostics, grid resource dispatching, and enterprise asset management. However, this architectural shift also introduces significant challenges for intelligent operation and maintenance (O&M): the scale of microservices expands rapidly, service dependencies grow more complex and interleaved, and runtime environments become dynamic and volatile [
3,
4]. In practice, the State Grid’s production cloud platform hosts over 10,000 microservice instances and produces terabytes of logs and metrics each day [
5]. Traditional rule-based monitoring and manual diagnosis approaches are no longer sufficient to meet real-time, scalable, and precise anomaly detection needs [
6].
Service performance anomaly detection, a foundational task in the AIOps pipeline, aims to identify system faults proactively, aiding in root cause localization and a timely response [
7,
8,
9]. With recent advances in deep learning, models such as LSTMs, autoencoders, and transformers have been adopted to analyze logs and time-series metrics [
10,
11]. However, such methods still suffer from three key limitations: (1) they are often centralized and computationally intensive, hindering scalability in large distributed environments [
12]; (2) they lack semantic reasoning and generalization for handling complex anomaly types [
13]; and (3) their opaque decisions limit interpretability, restricting adoption in mission-critical power grid operations [
14,
15].
Recent studies have begun exploring the use of large language models for anomaly detection in domains such as serverless computing and IoT [
16], demonstrating the ability of LLMs to generalize over previously unseen patterns and extract semantics from unstructured logs. However, these solutions are rarely integrated into industrial-scale multi-agent systems and often lack coordination, real-time guarantees, or deployment feasibility in regulated environments like energy systems.
To address the above challenges, this paper proposes a novel hierarchical framework called LEMAD (LLM-Empowered Multi-Agent System for Anomaly Detection). It combines distributed agents for data collection, stream analytics, and anomaly diagnosis with pre-trained LLMs (e.g., BERT, LLaMA, GPT4o [
17], DeepSeek-v3 [
18]) for semantic parsing and explainable output generation. The system operates as a layered architecture in which lower-layer agents handle domain-specific sensing (e.g., metric monitoring, log parsing), while an upper-layer coordinating agent aggregates multimodal signals for global anomaly inference and decision-making. Through the collaboration of LLMs and MAS, LEMAD bridges the gap between structured metrics and unstructured logs, enabling scalable, interpretable, and high-performance anomaly detection for power grid applications.
This work offers the following main contributions:
Hierarchical integration of LLMs and MAS: We are the first to embed pre-trained LLMs (e.g., BERT, LLaMA) into a distributed multi-agent system to enhance semantic log parsing and reasoning in real-time anomaly detection. Our architecture enables efficient coordination and parallel processing across agents under Kafka-based communication.
Multimodal anomaly analysis: We propose a fusion strategy that integrates log semantics, time-series predictions, template modeling, and contextual variable monitoring. The coordinating agent performs causal inference across modalities, enabling the accurate detection of composite anomalies such as cascading failures.
Industrial-grade deployment and validation: We deploy LEMAD in a production-scale cluster of the State Grid Corporation of China, processing real logs and metrics across four middleware platforms. Results show significant improvements in the F1-score compared to baseline models. The system supports explainable anomaly reports, root cause tracing, and real-time alerts, paving the way for scalable AIOps in critical infrastructure.
2. Related Works
In recent years, with the integration of cloud computing and smart grid technologies, system complexity has been increasing, posing significant challenges for traditional anomaly detection methods, which suffer from low accuracy, poor scalability, and limited interpretability [
19,
20]. As a result, researchers have explored various directions, including log anomaly detection [
21], collaborative diagnosis using multi-agent systems [
22], and the application of pre-trained language models in system monitoring [
23].
2.1. Log and Performance Anomaly Detection
Logs, as essential records of software system behaviors, have become a core information source for system monitoring and anomaly detection [
24]. Early research primarily relied on template matching and rule-based methods, such as regular expression-based and statistical rule-based anomaly alarms [
25]. However, these methods exhibited poor generalization and high maintenance costs. Subsequently, machine learning and deep learning methods for log anomaly detection emerged [
26], such as DeepLog [
27], which uses LSTM to learn log template sequence patterns; LogAnomaly [
28], which combines semantic vectors with statistical features; and Transformer-based methods like LogBERT and LogGPT, which better capture contextual semantics and sequence structures. Despite these advancements, such methods often face challenges in terms of deployment complexity, high computational resource requirements, and a lack of interpretability, making them difficult to apply directly to real-time large-scale power grid service environments [
29].
In the area of performance metric anomaly detection, researchers have explored time-series prediction models (e.g., ARIMA, Holt-Winters, LSTM) to model key metrics such as CPU, memory, and QPS [
30]. For example, Tadgan [
31] employs generative adversarial networks (GANs) to predict service behaviors and detect anomalies, while MTAD-GAT [
32] uses graph attention mechanisms to model interdependencies among multidimensional metrics. However, these approaches often focus solely on numerical metrics and struggle to integrate log semantics into a joint analysis [
33].
2.2. Applications of Multi-Agent Systems in System Monitoring
Multi-agent systems, characterized by their distributed, autonomous, and collaborative properties, have increasingly emerged as viable solutions for complex system O&M [
34]. In large-scale systems, MAS can facilitate local monitoring of different regions or subsystems and enable global collaborative decision-making through inter-agent cooperation [
35,
36]. For example, Hipel proposed a multi-layered agent architecture, where each node monitors local systems and synchronizes its status with a central agent via event-driven communication [
37]; further, Jain integrated game theory and reinforcement learning to enhance agent collaboration efficiency [
38]. MAS is particularly suitable for scenarios such as microservice management in cloud-native architectures and distributed monitoring at power grid edge nodes [
39], offering good scalability and fault tolerance [
40]. However, most current MAS studies focus on agent task division and communication mechanisms, while still relying on traditional methods for log semantic understanding and time-series modeling, lacking deep integration with modern LLM technologies [
41].
2.3. Large Language Models and Log Semantic Modeling
Recently, pre-trained language models (e.g., BERT [
42], GPT, RoBERTa) have demonstrated superior performance in log analysis. LogBERT [
43] was among the first to apply BERT for log template embedding and sequence modeling, improving anomaly detection accuracy. LogGPT [
44] leveraged GPT to predict the next log event, enabling context-aware anomaly detection; PromptLog [
45] proposed prompt learning to improve model generalization to unseen anomalies without requiring large-scale annotation.
In parallel, LLM-based anomaly detection has begun to gain traction in other domains. For instance, SIGFRID [
16] introduces an unsupervised platform-agnostic interference detection method in IoT automation rules using LLM embeddings to capture latent semantics and rule conflicts. Similarly, a recent study [
46] proposed an LLM-based framework for identifying misconfigurations in AWS serverless computing environments, leveraging the reasoning capabilities of language models to detect subtle anomalies in infrastructure-as-code scripts. These works demonstrate the growing applicability of LLMs beyond traditional log parsing, especially in handling complex, ambiguous, or previously unseen patterns.
Collectively, these methods highlight the potential of LLMs in understanding log semantics and uncovering implicit causal relationships, making them key technologies for enhancing the intelligence of anomaly detection. Nevertheless, existing LLM-based approaches generally rely on centralized processing architectures, lacking integration with MAS-based distributed mechanisms [
34]. Furthermore, high inference costs and latency hinder their application in real-time power grid monitoring scenarios.
2.4. Synthesis and Research Positioning
Despite significant progress in log analysis, metric modeling, and multi-agent monitoring, each of these approaches faces critical limitations when applied to real-world power grid environments.
Log-based analysis methods primarily focus on identifying anomalous patterns from service logs. However, they often struggle with adaptability to evolving log formats and fail to capture latent semantic correlations between events, leading to high false positives in dynamic service environments.
Metric-based modeling relies on numerical indicators such as response time or CPU usage, which are effective for threshold-based alerts but lack contextual awareness. These models are unable to explain why anomalies occur, as they ignore the semantic and temporal patterns embedded in service logs.
Multi-agent systems offer a promising decentralized approach for large-scale monitoring. However, most MAS frameworks emphasize coordination and scalability while overlooking deep semantic modeling. In particular, they rarely leverage the reasoning capabilities of large language models to understand complex service behaviors or correlate multimodal data sources.
In summary, although the individual lines of research—log analysis, metric modeling, and MAS-based monitoring—have achieved substantial results [
47], there remains a clear gap: the lack of an integrated framework that fuses their complementary strengths. Specifically, no existing solution effectively combines (i) the semantic interpretability of LLMs, (ii) the numerical precision of metric modeling, and (iii) the distributed responsiveness of MAS in a unified architecture [
48].
3. Methodology
To address the limitations of traditional centralized anomaly detection systems in large-scale power grid infrastructures, this study proposes LEMAD, a hierarchical LLM-empowered multi-agent architecture designed to achieve scalable, interpretable, and real-time service anomaly detection. The proposed methodology integrates modular agents with specialized roles into a cooperative framework that supports full-stack data sensing, intelligent analysis, and contextual diagnosis as shown in
Figure 1.
3.1. Overall Framework
To achieve high-precision, scalable, and interpretable anomaly detection in large-scale, cloud-native power grid infrastructures, we propose LEMAD, a hierarchical and modular architecture that integrates large language models with a multi-agent system. Instead of describing components in isolation, the framework adopts a closed-loop workflow—comprising data sensing, real-time analysis, in-depth diagnosis, and intelligent feedback—where each agent interacts asynchronously through Kafka-based message queues to collaboratively accomplish end-to-end service anomaly detection. The overall workflow is illustrated in
Figure 1.
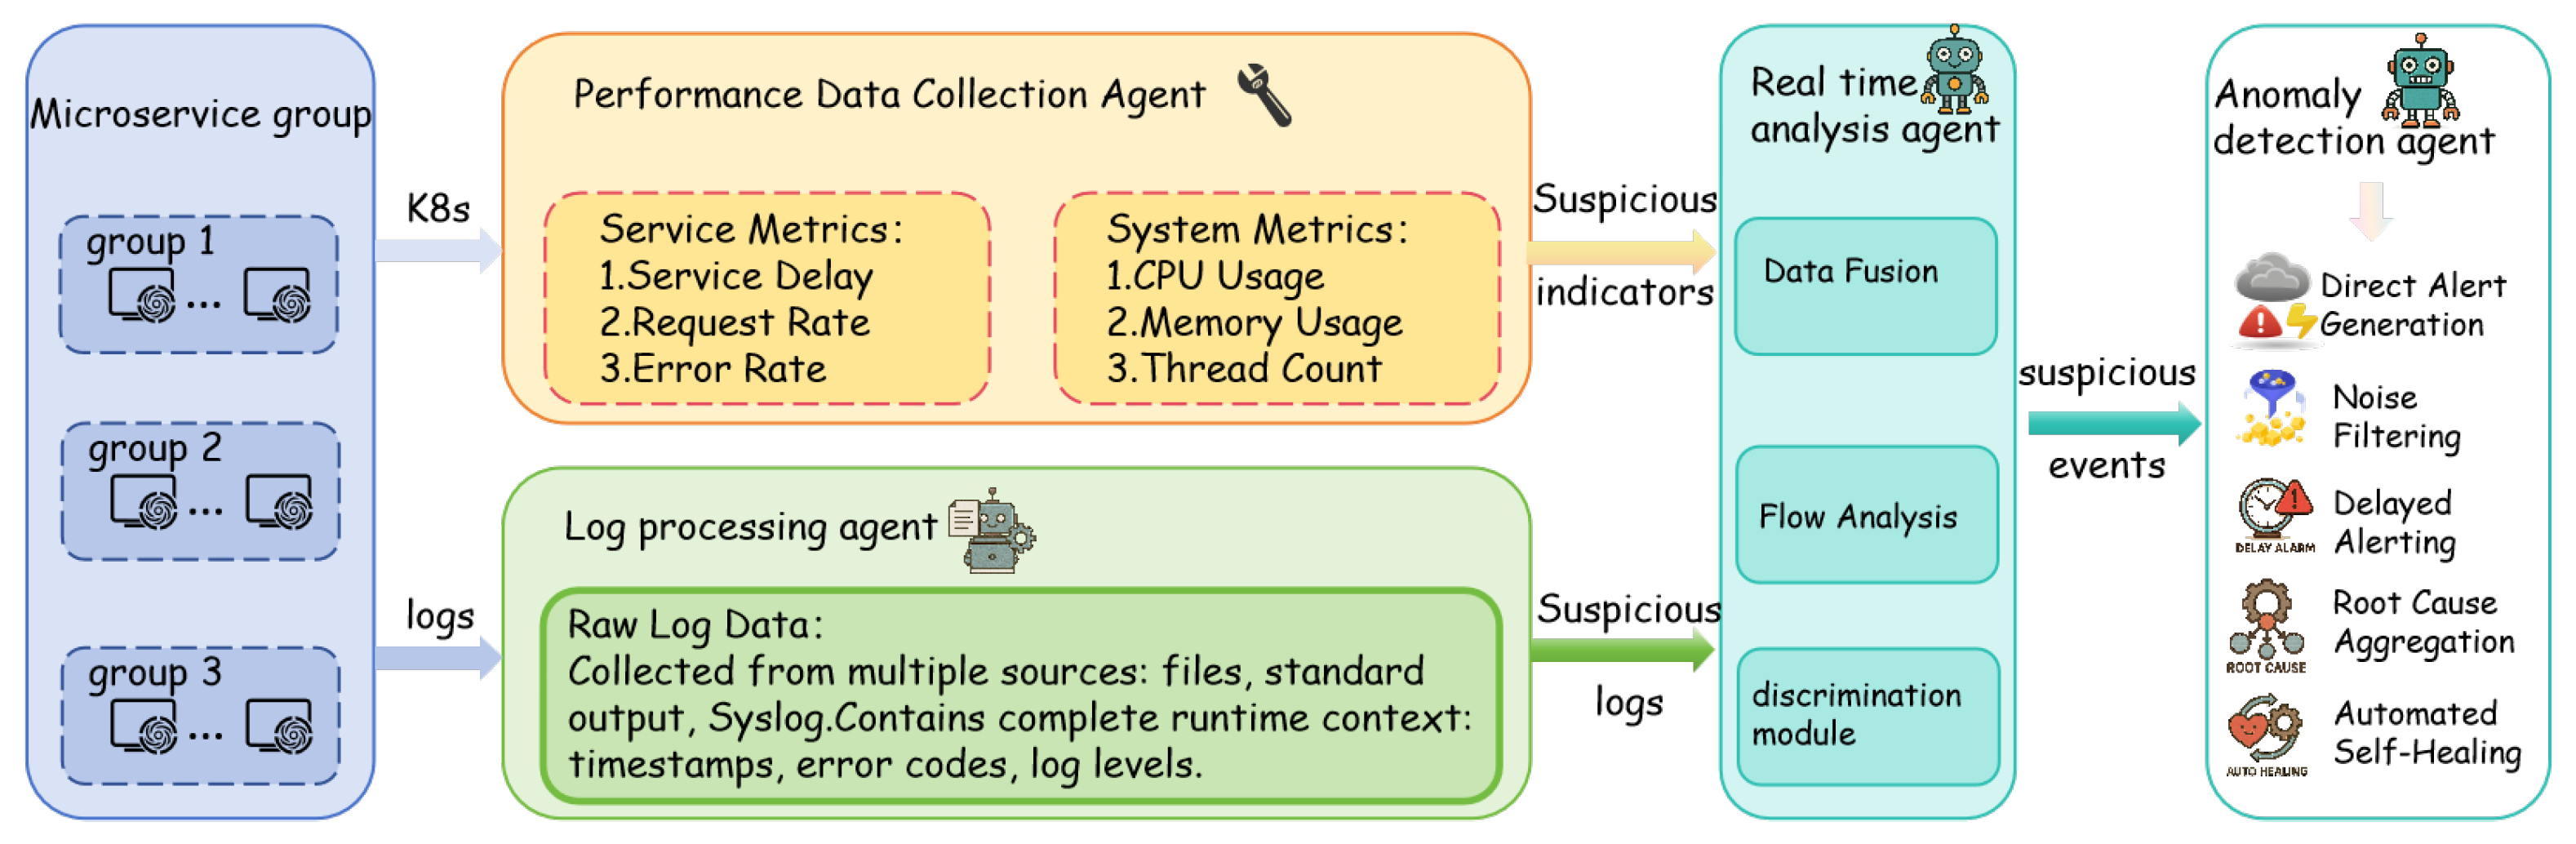
The system operates in four sequential stages: First, the performance data collection agent and log processing agent are responsible for continuously monitoring runtime metrics and ingesting structured logs, respectively. These agents stream their outputs in standardized formats to Kafka topics. Second, the real-time analysis agent consumes both metric and log data in real time, performing multi-dimensional correlation analysis and initial anomaly identification. It leverages LLMs to generate human-readable alert summaries and preliminary hypotheses. Third, the anomaly detection agent further evaluates these suspicious events using hybrid models and contextual reasoning, producing confidence scores, root cause localization, and actionable recommendations. This forms a complete “sense–analyze–diagnose–respond” operational loop for intelligent AIOps in power systems.
To enhance clarity on inter-agent interactions,
Figure 1 illustrates the dataflow across agents in LEMAD. Performance metrics and structured logs, produced by the performance data collection agent and log processing agent, respectively, are transmitted via Kafka topics to the real-time analysis agent. This agent correlates and interprets the data in real-time, generating suspicious events that are then streamed to the anomaly detection agent. The anomaly detection agent evaluates these events using hybrid models and contextual information, producing final reports and root cause analyses. This sequential flow forms a tightly integrated modular pipeline that enables robust interpretable anomaly detection in complex service environments.
By orchestrating modular agents with semantic understanding, distributed coordination, and contextual diagnosis capabilities, LEMAD offers a holistic, interpretable, and production-grade solution for intelligent service anomaly detection in critical infrastructures.
3.2. Performance Data Collection Agent
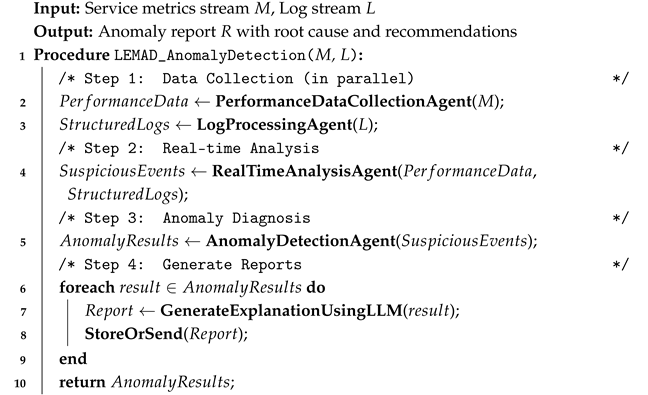
The performance data collection agent is designed to monitor the core performance metrics of microservices in real-time, including service-level indicators such as the service latency, request rate, and error rate, as well as system-level resource metrics such as CPU utilization, memory usage, and thread count. Its modular design ensures fine-grained monitoring at the service level and decouples data transmission through Kafka topics, enabling high availability and scalability in streaming the performance data to the real-time analysis agent. The data collection and streaming process is outlined in Algorithm 1.
| Algorithm 1: LEMAD End-to-End Anomaly Detection Workflow |
![Electronics 14 03008 i001]() |
The performance data collection agent comprises the following submodules:
Request Tracing Module: this provides entry and exit points for service requests to record the start and end timestamps, enabling millisecond-level measurement of request latency. Metric Aggregation Module: this performs sliding-window aggregation on request logs to compute per-second request rate (QPS) and error rate. System Metrics Collection Module: this periodically collects CPU utilization, memory usage, and thread count using the psutil library.
Metric Output Module: this streams the collected performance metrics in JSON format to a Kafka topic (e.g., performance-metrics) for consumption by the real-time analysis agent.
3.3. Log Processing Agent
The log processing agent functions as an intelligent collection and management system for microservice logs, designed to support the real-time collection, parsing, and forwarding of diverse runtime log data. It enables multi-source and multi-destination log distribution while integrating intelligent technologies for log structuring and filtering, ensuring efficient utilization of log data. Structured logs are streamed to the real-time analysis agent via Kafka topics, enabling closed-loop data flows across modules.
The agent consists of the following core modules:
Multi-Source Collection Module: this supports diverse log input channels, including file-based collection, standard output, and Syslog, enabling comprehensive log acquisition from heterogeneous sources.
Structured Parsing Module: this employs regular expressions and JSON parsers to extract essential fields—such as timestamps, log levels, and error codes—with support for multi-line log aggregation to handle complex log structures.
Intelligent Filtering Module: this integrates static rules (e.g., log levels, keywords) with dynamic rules to effectively filter redundant logs and reduce noise, enhancing downstream analysis efficiency.
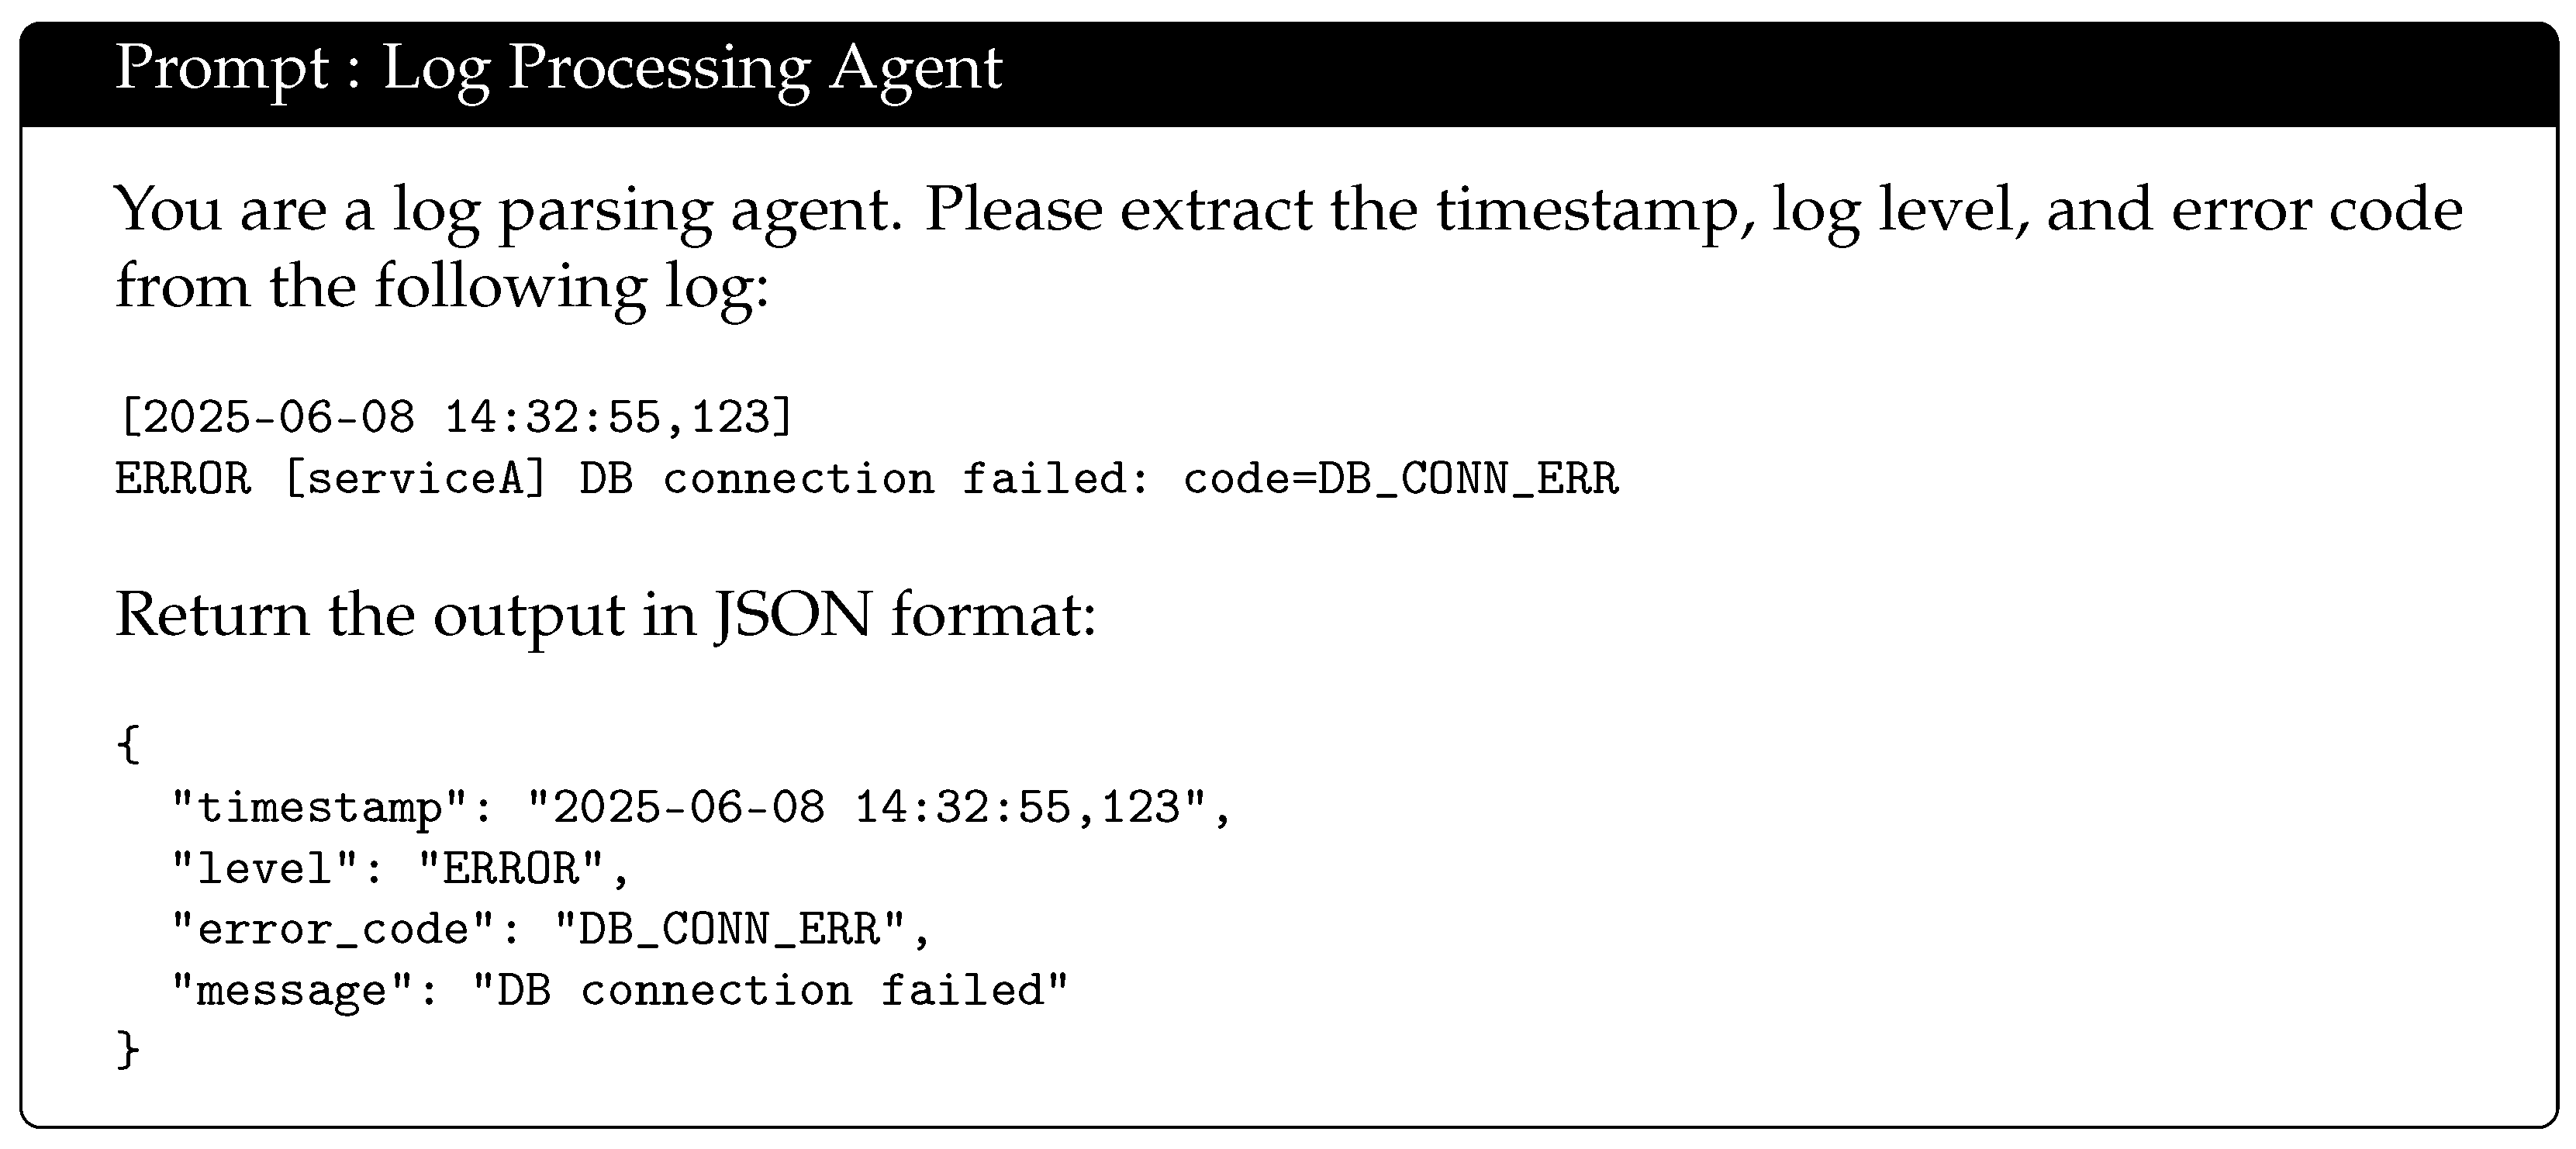
Intelligent Parsing Module (LLM Integration): This utilizes large language models to perform deep parsing of complex logs, such as stack trace dissection and semantic-level error classification, enabling advanced log understanding and anomaly detection. Its prompt is as follows in
Figure 2:
Compression and Checkpointing Module: this applies compression algorithms (e.g., gzip or lz4) to log data and uses offset files to record collection progress, ensuring data consistency and integrity during system restarts.
Log Forwarding Module: this leverages a Kafka producer to push structured logs to Kafka topics (e.g., structured-logs), facilitating consumption by the real-time analysis agent for downstream processing.
This modular design ensures the log processing agent meets the requirements of high availability, scalability, and interpretability in distributed microservice environments.
The log processing agent complements the performance data collection agent by supplying structured semantic information extracted from logs. Both agents publish to Kafka topics, which serve as upstream inputs for the real-time analysis agent.
3.4. Real Time Analysis Agent
The real-time analysis agent jointly consumes metric and log streams from the previous two agents and detects potential anomalies. These outputs are then passed downstream to the anomaly detection agent for further diagnosis.
The real-time analysis agent serves as the central monitoring hub of the AIOps system, responsible for the real-time consumption of data streams reported to Kafka topics by both the performance data collection agent and the log processing agent. Operating within a streaming processing framework, it performs multi-dimensional analysis, metric correlation, and intelligent alerting, enabling rapid problem detection and preliminary anomaly event triggering. This agent also ensures the provision of high-quality input data for the anomaly detection agent, thereby supporting subsequent in-depth analysis.
The real-time analysis agent comprises the following core modules:
Data Ingestion Module: this implements a Kafka consumer to receive real-time data from performance-metrics and structured-logs topics, ensuring continuous data flow from upstream modules.
Data Preprocessing Module: this performs timestamp alignment, data format normalization, and missing value handling for heterogeneous data sources, ensuring consistent and accurate data streams.
Streaming Analysis Module: this utilizes engines such as PyFlink or Spark Streaming to conduct sliding window computations, multi-dimensional metric correlation analysis, and dynamic threshold-based anomaly detection on streaming data.
Intelligent Alerting Module: This analyzes results to determine alerts, supporting static thresholds, dynamic thresholds, and pattern-based anomaly detection. This module generates preliminary suspicious events based on analysis outputs.
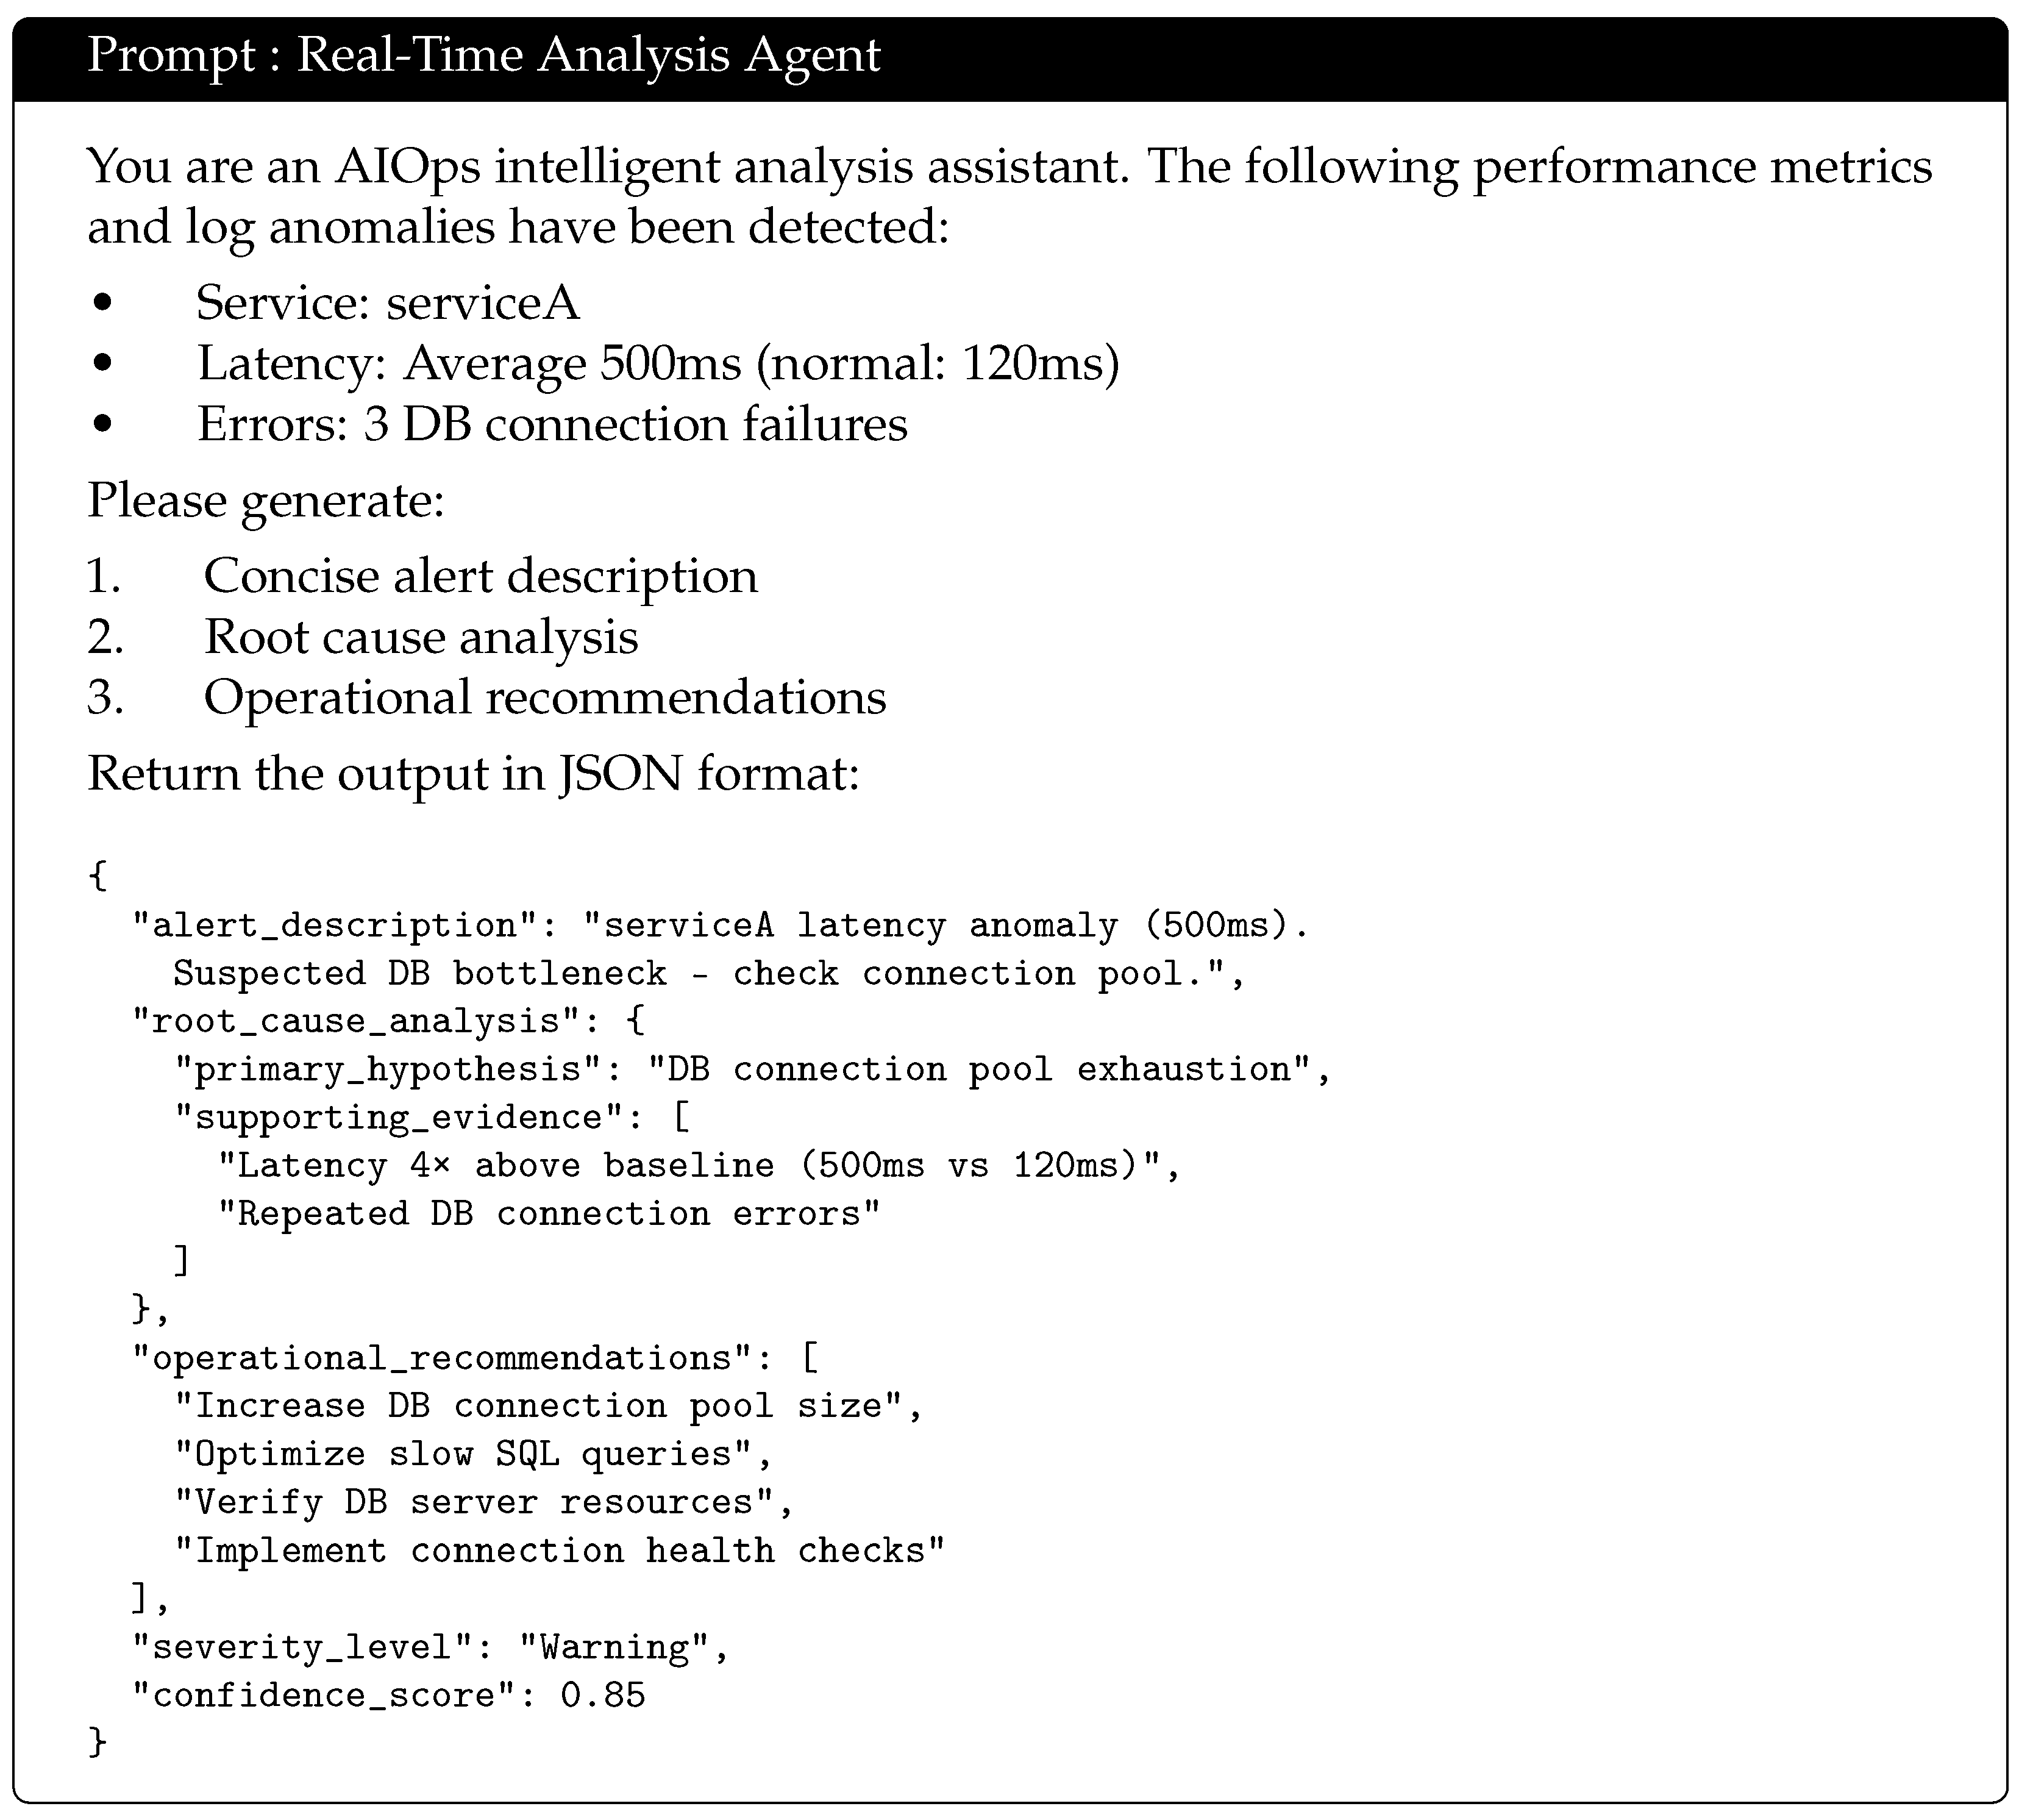
The Intelligent Explanation Module (LLM Integration) employs large language models to generate natural language descriptions of alerts and maintenance suggestions, thereby enriching alert information and improving interpretability. A representative prompt used in this process is shown in
Figure 3.
Event Output Module: this streams suspicious events in JSON format to a Kafka topic (e.g., suspicious-events), enabling seamless consumption by the anomaly detection agent.
This modular design ensures that the real-time analysis agent meets the demands of scalability, interpretability, and real-time processing, supporting comprehensive system monitoring in complex microservice environments.
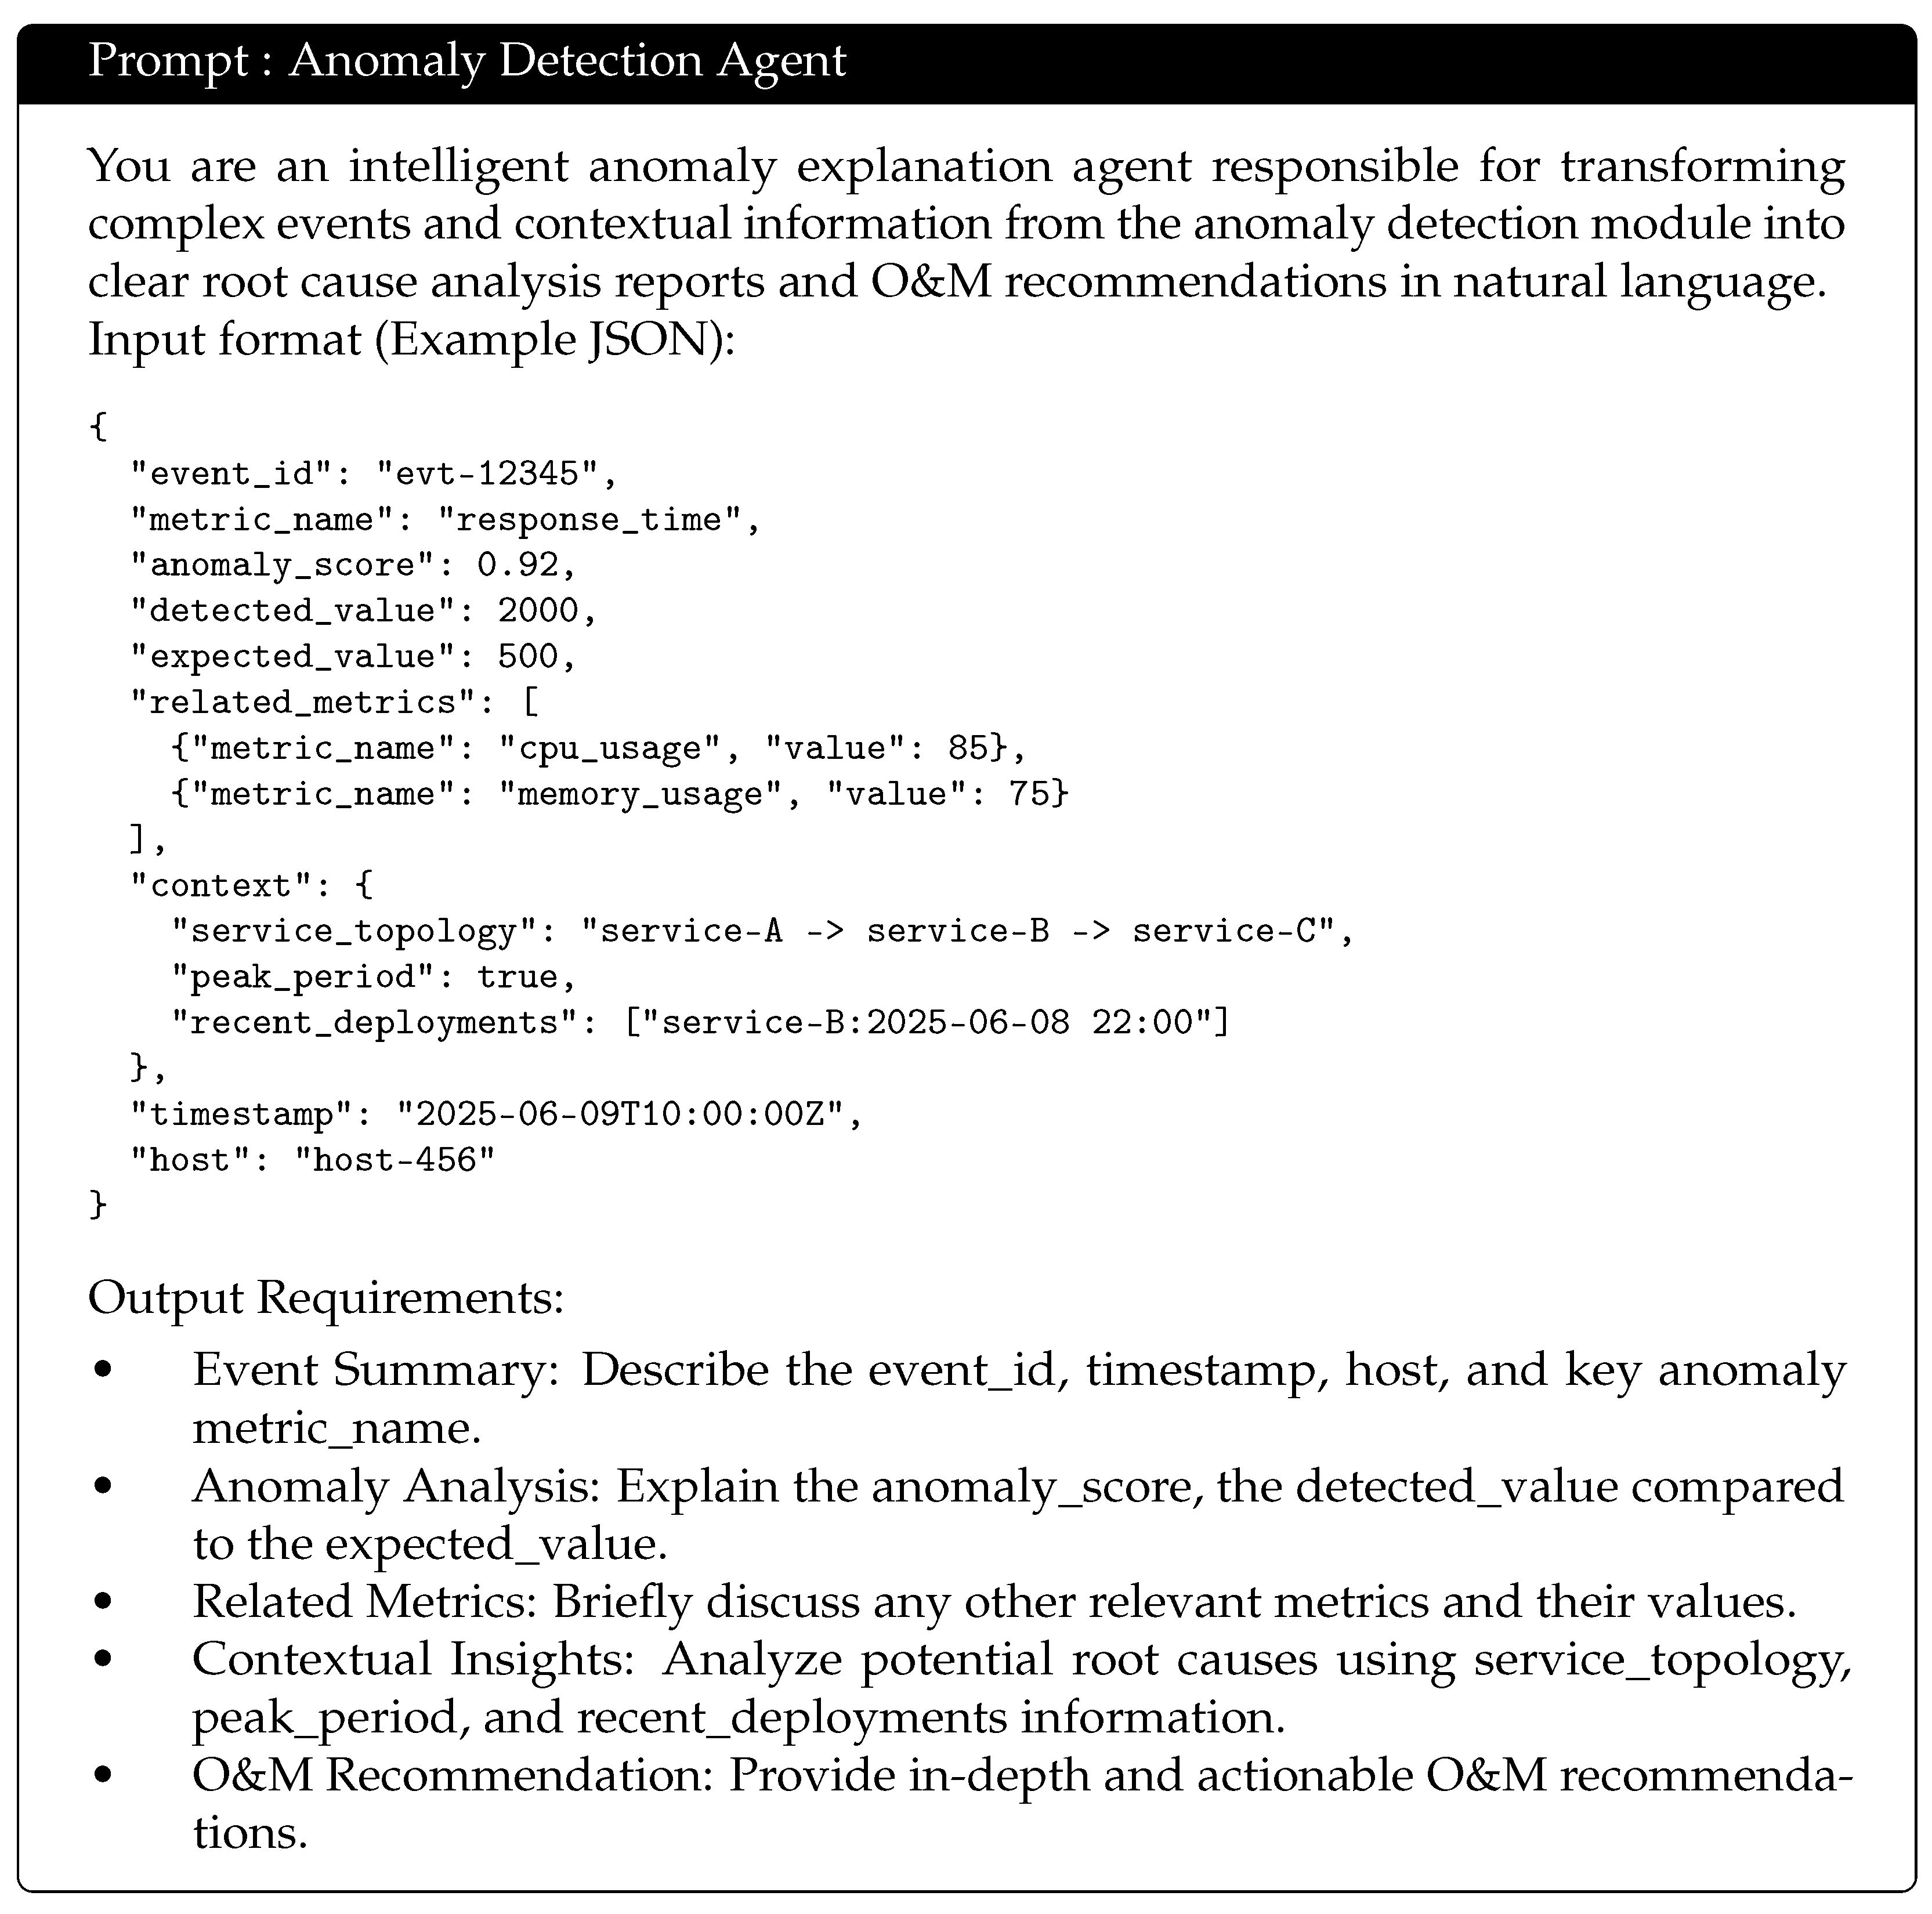
3.5. Anomaly Detection Agent
The anomaly detection agent functions as the diagnostic engine of the intelligent operations and maintenance (O&M) system. It consumes suspicious events from the suspicious-events Kafka topic generated by the real-time analysis agent and further evaluates the authenticity and severity of these events based on multiple algorithms and context awareness. By producing confidence scores and root cause localization recommendations, it achieves a closed-loop process from preliminary alerting to in-depth diagnostics.
The anomaly detection agent comprises the following key modules:
Anomaly Detection Algorithms Module: this integrates multiple algorithmic models, including isolation forest, Z-score, and LSTM, to perform multi-perspective anomaly detection and generate confidence scores for suspicious events.
Context-Aware Analysis Module: this incorporates contextual information such as service topology, call chains, and business peak periods to assist in determining the impact scope and severity of anomalies.
The Intelligent Explanation Module (LLM Integration) leverages large language models to generate root cause analyses and maintenance recommendations, thereby enhancing the interpretability and readability of reports, as illustrated in
Figure 4.
Result Output Module: this streams the final anomaly detection results to Kafka (for use by the alerting system) or Elasticsearch (for visualization and dashboard integration).
This modular architecture ensures that the anomaly detection agent meets the demands for scalability, interpretability, and real-time diagnostics in complex large-scale microservice environments.
4. Experiments
4.1. Datasets
In this study, we focused on a subset of services within the power system domain, comprising 1289 services selected from among tens of thousands of services across four major service platforms. For these selected services, we collected a comprehensive dataset of 28.88 million service invocations. Within these invocations, 1674 abnormal calls were identified in
Table 1. To address the data imbalance, we constructed a balanced dataset by randomly selecting 10,000 normal invocations along with all 1674 abnormal invocations.
To better characterize the sources of service anomalies, we categorized the failure resources into eight representative types, as summarized in
Table 2. These include common system-level issues such as high CPU utilization, memory exhaustion, I/O bottlenecks, and network instability, as well as runtime-specific problems like JVM failures. In addition, application-level anomalies are captured through API invocation errors, latency violations, and uncaught exceptions. This categorization provides a unified understanding of diverse failure patterns across platforms and serves as a foundation for subsequent root cause analysis.
4.2. Baseline
To evaluate the effectiveness of our approach, we selected several widely used unsupervised log anomaly detection methods as baselines:
PCA: a statistical method that uses principal component analysis to model the normal behavior of logs and detect anomalies by capturing deviations from the principal components [
49].
LogCluster: a statistical clustering-based method that groups similar log sequences and identifies anomalies by measuring deviations from cluster centroids [
50].
IM: a statistical approach that applies invariant mining techniques to extract consistent patterns from logs and identify anomalies as violations of these invariants [
51].
DeepLog: a deep learning-based method that employs an LSTM network to learn log sequence patterns and predict subsequent events, with anomalies identified as deviations from expected event sequences [
27].
LogAnomaly: a deep learning-based approach that leverages an LSTM autoencoder to model sequential dependencies and reconstruct logs, flagging significant reconstruction errors as anomalies [
28].
LogBERT: a transformer-based method that applies the BERT model to encode log sequences, capturing contextual semantics to detect anomalies through sequence classification or prediction [
43].
LogGPT: a generative approach that utilizes a pre-trained GPT model to predict the next log entry, identifying anomalies as unexpected or low-probability outputs in the log sequence [
44].
4.3. Evaluation Metrics
To comprehensively evaluate the performance of our anomaly detection system, we employed three standard metrics in machine learning: precision (P), recall (R), and F1-score (F1). These metrics quantitatively measure the system’s accuracy, coverage, and overall balance in identifying service anomalies, as defined below:
Precision (P)
Precision measures the proportion of correctly detected anomalies among all detected anomalies. Its calculation method is as follows:
where
is the number of true positives (correctly detected anomalies), and
is the number of false positives (normal samples incorrectly flagged as anomalies).
Recall (R)
Recall measures the proportion of actual anomalies that are correctly detected by the system. Its calculation method is as follows:
where
is the number of false negatives (actual anomalies that were not detected).
F1-score (F1)
F1-score provides a balanced measure between precision and recall by computing their harmonic mean. Its calculation method is as follows:
where
P is precision, and
R is recall.
Inference Latency (L)
Inference Latency measures the average time taken by the system to produce anomaly detection results for a single input sample during runtime. It reflects the real-time responsiveness and deployment efficiency of the model, and is calculated as follows:
where
and
denote the inference start and end timestamps for the
ith sample, and
N is the total number of test samples. Lower latency indicates better suitability for real-time applications.
4.4. Implementation Details
The proposed LEMAD system is deployed using a fully cloud-native microservice architecture, with all intelligent agents operating independently within containerized environments on a Kubernetes cluster. Inter-agent communication is achieved through Apache Kafka (v3.2) message queues, enabling asynchronous, decoupled, and fault-tolerant coordination across modules [
52].
Data Collection Layer. This layer comprises two primary agents. The log processing agent, implemented in Python 3.12.9, integrates the Fluentd log collection framework with HuggingFace’s transformers library to perform both regex-based and semantic log parsing using the BERT model. The performance data collection agent, written in Go, leverages the OpenTelemetry SDK to extract key service-level metrics such as CPU, memory usage, latency, and QPS. All collected data are normalized and streamed to Kafka topics in JSON format for downstream processing.
Stream Processing Layer. The real-time analysis agent is implemented using the PyFlink framework and performs continuous stream processing with support for dynamic time warping (DTW) and adaptive thresholding. It consumes both structured logs and metrics, correlates them using multi-dimensional analysis, and detects preliminary anomalies. Alerts are enriched with natural language explanations generated by LLMs.
Decision Layer. The anomaly detection agent adopts a hybrid model architecture, integrating an LSTM transformer model for temporal analysis, isolation forest for statistical detection, and the gpt-4o-mini model for semantic reasoning and root cause analysis. An auction-based task allocation algorithm is implemented in the coordinator agent to dynamically balance the computational load across nodes based on real-time metrics.
Storage and Reliability. To ensure system robustness, we incorporate redundancy and checkpointing mechanisms throughout the pipeline. Logs are compressed using Filebeat and streamed to Kafka, while metrics are routed through the OpenTelemetry Collector and stored in Prometheus. Stream jobs employ Apache Flink with exactly-once semantics enabled. The storage layer adopts a hot–cold tiering strategy: high-frequency (“hot”) data are stored in Elasticsearch for fast retrieval and visualization, while low-frequency (“cold”) data are archived to MinIO object storage for long-term retention.
Evaluation Environment. All experiments were conducted on the H800 GPU computing cluster over a 72 h period. We benchmarked multiple model variants under identical hardware configurations to evaluate their detection accuracy, inference latency, and system-level responsiveness. In particular, we introduced inference latency as a new metric to compare the runtime efficiency of LLM-based and non-LLM baselines. This addition addresses practical deployment concerns and directly responds to Reviewer 1’s suggestion. The results show that while LLM-enhanced models incur higher latency, they offer superior semantic reasoning and interpretability—highlighting a trade-off between accuracy and responsiveness discussed in
Section 5.1.
5. Results and Analysis
5.1. Comparative Experimental Results
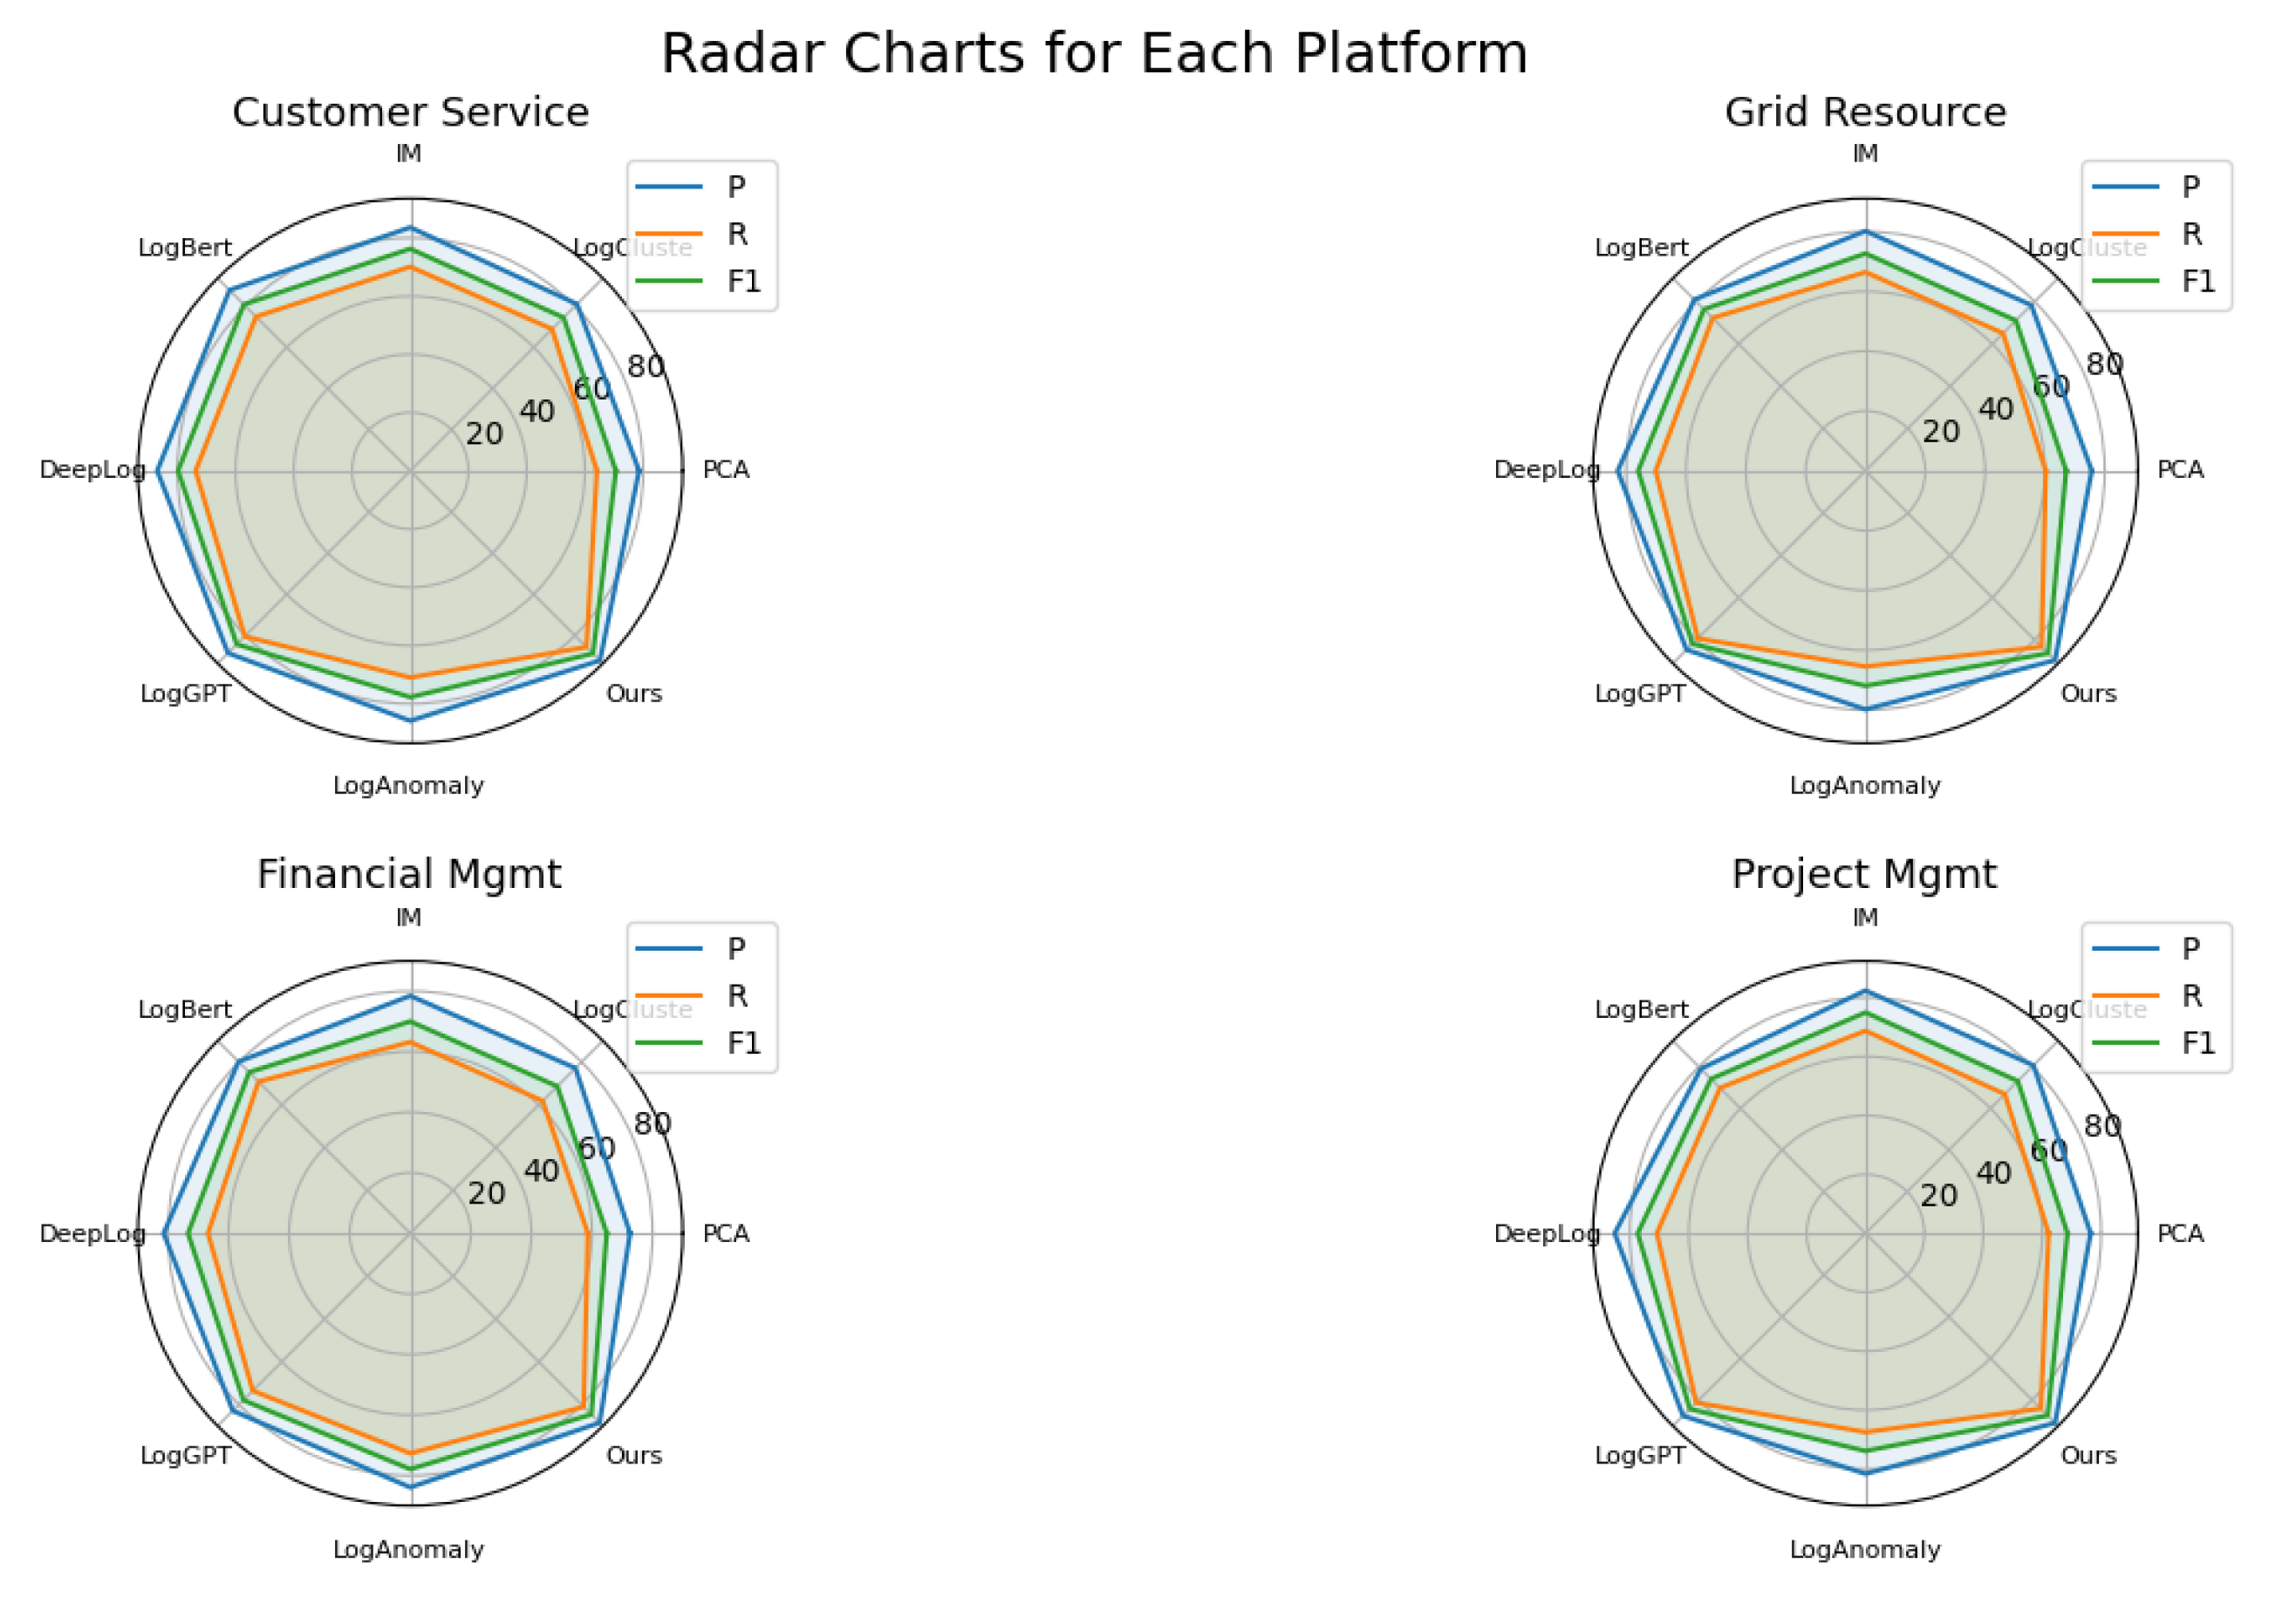
This experiment aimed to evaluate the effectiveness of various methods in detecting service performance anomalies, spanning four representative categories of enterprise middleware platforms: customer service, grid resource management, financial management, and project management, as shown in
Table 3. The evaluation metrics include precision (P), recall (R), and F1-score (F1), providing a comprehensive assessment of both the accuracy and completeness of each method’s anomaly detection capabilities.
Overall Performance Comparison. Our proposed method consistently outperforms all baseline methods across all platforms and evaluation metrics. Specifically, on the customer service platform, our method achieves the highest precision (92.16%), recall (85.63%), and F1-score (88.78%). Similarly, in the grid resource platform, it attains P = 89.64%, R = 83.27%, and F1 = 86.34%; in the financial management platform, P = 88.46%, R = 81.03%, and F1 = 84.58%; and in the project management platform, P = 91.03%, R = 84.19%, and F1 = 87.48%, as illustrated in
Figure 5. These results indicate the robustness and adaptability of our method across various business-critical domains.
Baseline Methods Analysis. Among the baseline methods, LogGPT and LogBERT show notable improvements over traditional approaches such as PCA, LogCluster, and IM. LogGPT, in particular, delivers the second-best performance after our method, achieving F1-scores of 84.30% (customer service), 81.90% (grid resource), 77.93% (financial management), and 84.35% (project management). LogBERT also demonstrates strong performance, with an F1-score of 80.85% on the customer service platform. In contrast, DeepLog and LogAnomaly maintain relatively strong but less competitive results. For example, on the financial management platform, LogAnomaly achieves F1 = 77.89%, outperforming DeepLog (73.39%) and IM (70.00%), yet falling short of our approach (84.58%).
Performance Across Platforms. While the relative rankings of the baseline methods remain mostly consistent across the four platforms, our method shows particularly significant gains in recall, which is critical for anomaly detection tasks. A higher recall ensures that a greater proportion of anomalous events are correctly identified, reducing the risk of undetected faults. For instance, on the grid resource platform, our method achieves a recall of 83.27%, which is substantially higher than that of DeepLog (70.21%) and LogAnomaly (65.48%).
Precision–Recall Balance. Our method achieves a strong balance between precision and recall across all platforms, resulting in the highest F1-scores overall, as shown in
Figure 6. This balance is essential for real-world applications, where both accurate detection (precision) and thorough anomaly coverage (recall) are necessary to ensure operational reliability and reduce false alarms.
Inference Latency Analysis. In addition to detection performance, inference latency is a crucial factor for the practical deployment of anomaly detection systems, especially in real-time or near-real-time environments. As shown in
Table 3, traditional machine learning methods such as PCA (165 ms) and IM (86 ms) exhibit lower latency but significantly underperform in terms of precision, recall, and F1-score. Deep learning methods like DeepLog (523 ms) and LogBERT (856 ms) offer better detection performance but incur moderate latency.
LogGPT, which utilizes a generative pre-trained language model, demonstrates strong anomaly detection capabilities (F1 = 84.30% on Customer Service) but has a relatively high inference latency of 1782 ms, indicating a potential bottleneck in time-sensitive scenarios. Our method achieves the best overall performance across all platforms (F1 = 88.78% on customer service) but with the highest latency at 3156 ms. This result suggests a trade-off between performance and responsiveness inherent to LLM-based approaches.
While the increased latency may be acceptable for offline analysis or periodic batch processing, it poses challenges for high-frequency online detection tasks. Future work may explore model compression, approximate inference, or edge deployment strategies to mitigate this limitation without sacrificing detection accuracy.
Overall, the experimental results demonstrate the superior effectiveness and strong generalizability of our method in detecting complex service performance anomalies. The consistent outperformance across all platforms underscores the robustness of our approach, which we attribute to its novel architectural designs, including advanced feature extraction, semantic log-context modeling, and fine-grained anomaly boundary identification. These capabilities enable the model to accurately capture both semantic and structural patterns in service logs, thereby enhancing its suitability for practical deployment in large-scale, real-world scenarios.
In summary, our approach demonstrates significant improvements in precision, recall, and F1-score compared to established baselines, confirming its value for large-scale real-world service performance anomaly detection.
5.2. Ablation Experiment
To evaluate the contribution of each core component in LEMAD, we conducted a series of ablation experiments on the financial management dataset using a reduced variant named LEMAD-base, which disables both the multi-agent architecture and the large language model (LLM) module. Specifically, we assessed the individual and combined effects of (i) agent-based distributed collaboration, (ii) semantic modeling via LLMs, and (iii) their synergistic integration, all under a consistent backbone encoder (BERT). This evaluation aimed to verify how these components enhanced anomaly detection accuracy and generalizability within the complex service environment of financial systems.
Setup and Variants
All ablation variants adopted BERT as the default encoder for log and metric processing. We compared four configurations:
LEMAD-base: this disables both LLM and agent coordination and uses centralized BERT-based classification only.
LEMAD-base + agents: this enables the multi-agent execution framework with distributed metric and log handlers.
LEMAD-base + LLM: this replaces the BERT-only output with LLM-based explanation and causal inference.
LEMAD-base + agents + LLM (full): this is the complete LEMAD system with both modules activated.
We report the average precision, recall, and F1-score across four platforms (customer service, grid resource, finance, project).
As shown in
Table 4, removing both agents and LLMs in
LEMAD-base leads to the lowest F1-score of 75.26%, highlighting the limitations of centralized modeling in handling large-scale distributed service environments.
Introducing agent collaboration (+agents) improves all metrics significantly. The distributed architecture enables parallel log parsing and localized metric analysis, reducing detection latency and improving precision.
Adding the LLM module (+LLM) provides an even larger gain in precision (from 78.62% to 85.21%) by incorporating semantic reasoning and anomaly explanation capabilities, although the recall remains similar to the +agents variant.
The full system achieves the best overall performance (F1 = 84.58%), validating the synergy between agent-based processing and LLM-based semantic inference. This suggests that the hierarchical architecture not only scales well but also captures the diverse and latent patterns in cloud-native power grid services.
6. Discussion
This paper presents a service anomaly detection framework that integrates large language models with a hierarchical multi-agent System, tailored for cloud-native infrastructures such as power grids. The proposed system addresses three key challenges in modern AIOps: (1) bridging the semantic gap between unstructured logs and structured metrics through contextual modeling with BERT and LLaMA; (2) enabling scalable and coordinated anomaly detection across distributed services via hierarchical agent collaboration; and (3) delivering interpretable and actionable diagnostics beyond traditional threshold-based alerts.
Experimental results on 1289 production services from the State Grid Corporation of China demonstrate that our framework achieves up to a 12% improvement in F1-score over strong baselines. The system is particularly effective in identifying cross-service cascading failures, multi-modal anomalies involving both log and metric data, and semantically ambiguous error patterns—benefiting from the synergy between deep semantic modeling and distributed reasoning.
However, due to the computational overhead introduced by multi-agent scheduling and LLM inference, the system exhibits higher response latency compared to lightweight models and is not suitable for latency-critical scenarios that require sub-3-s responses, such as real-time control systems. Instead, our method is best suited for minutes-level fault prediction, intelligent O&M, and root cause analysis, where interpretability and decision quality are prioritized over immediate reaction time.
Looking forward, we identify four future research directions: (1) applying model compression techniques such as knowledge distillation to enable lightweight deployment at the network edge; (2) incorporating online learning to improve adaptability to service evolution; (3) validating the framework across other critical domains such as finance and transportation; and (4) enhancing human–AI interaction through natural language interfaces and visual analytics to improve operational usability.
In summary, the proposed framework offers a practical and extensible paradigm for semantic-aware distributed anomaly detection and lays a foundation for building next-generation intelligent O&M systems for critical infrastructure.


