Article

MA-HRL: Multi-Agent Hierarchical Reinforcement Learning for Medical Diagnostic Dialogue Systems

1
School of Artificial Intelligence, Beihang University, Beijing 100191, China
2
Hangzhou International Innovation Institute, Beihang University, Hangzhou 310018, China
3
School of Logistics, Beijing Wuzi University, Beijing 101126, China
*
Author to whom correspondence should be addressed.
Electronics 2025, 14(15), 3001; https://doi.org/10.3390/electronics14153001
Submission received: 28 May 2025 / Revised: 21 June 2025 / Accepted: 26 June 2025 / Published: 28 July 2025
(This article belongs to the Special Issue Advanced Techniques for Multi-Agent Systems)

Abstract

Task-oriented medical dialogue systems face two fundamental challenges: the explosion of state-action space caused by numerous diseases and symptoms and the sparsity of informative signals during interactive diagnosis. These issues significantly hinder the accuracy and efficiency of automated clinical reasoning. To address these problems, we propose MA-HRL, a multi-agent hierarchical reinforcement learning framework that decomposes the diagnostic task into specialized agents. A high-level controller coordinates symptom inquiry via multiple worker agents, each targeting a specific disease group, while a two-tier disease classifier refines diagnostic decisions through hierarchical probability reasoning. To combat sparse rewards, we design an information entropy-based reward function that encourages agents to acquire maximally informative symptoms. Additionally, medical knowledge graphs are integrated to guide decision-making and improve dialogue coherence. Experiments on the SymCat-derived SD dataset demonstrate that MA-HRL achieves substantial improvements over state-of-the-art baselines, including +7.2% diagnosis accuracy, +0.91% symptom hit rate, and +15.94% symptom recognition rate. Ablation studies further verify the effectiveness of each module. This work highlights the potential of hierarchical, knowledge-aware multi-agent systems for interpretable and scalable medical diagnosis.

1. Introduction

In recent years, the field of deep learning, particularly in reinforcement learning (RL), has witnessed significant advancements, garnering attention for its capability to extract intricate patterns from massive datasets [1,2,3,4,5]. Reinforcement learning algorithms are primarily utilized to address the challenge of determining how intelligent agents (referred to as “Agents”) should act within their surrounding environments to maximize cumulative rewards [6,7,8,9]. Similar to humans, RL agents use interactive learning to successfully obtain satisfactory decision strategies [10,11,12,13]. Within this context, task-oriented dialogue systems based on deep reinforcement learning (DRL) have also found successful applications in the medical domain [14,15,16]. RL agents, through interactive conversations with patients, acquire critical pathological features from patients and subsequently assist healthcare professionals in diagnosing illnesses. This has, to some extent, alleviated the issue of constrained medical resources. However, the sheer volume of diseases and symptoms has introduced challenges related to the dimensions of action and state spaces, leading to sparse reward problems, consequently impacting the accuracy of disease discrimination [17].
To address this issue, the current approach involves integrating a knowledge graph with the dialogue system to prune the action space, to some extent, enhancing the diagnostic accuracy of intelligent diagnostic dialogue systems [18,19]. However, existing intelligent diagnostic dialogue systems heavily rely on data-driven learning and often fail to truly comprehend the relationship between symptoms and diseases. Consequently, most research on disease diagnosis dialogue systems is conducted without medical knowledge or relies heavily on statistical features (i.e., conditional probabilities from symptoms to diseases) [20,21,22]. Decision-making is based on the dialogue state, without effectively resolving the dimensionality challenge and sparse reward problem.
To address the aforementioned issues, this paper presents an intelligent diagnostic dialogue algorithm for disease diagnosis based on information entropy-guided hierarchical reinforcement learning, drawing inspiration from the human approach to dealing with complex problems [23,24,25,26]. Specifically, we restructure the problem based on clinical conversations, which primarily involves modeling the state space and reward function to accurately reflect the patient case information within the dialogue system.
Furthermore, we introduce the concept of information entropy by incorporating rewards that measure the information difference between consecutive states, thereby incentivizing the intelligent agent to actively seek more symptoms from the user [27,28,29,30]. This paper introduces an information entropy-based hierarchical reinforcement learning framework, which effectively mitigates the problem of state sparsity by integrating a hierarchical structure into the disease classifier. Lastly, this study incorporates prior medical knowledge graphs to further enhance the task completion rate of the dialogue system while overcoming some of the limitations of purely data-driven learning.
In summary, this paper makes the following contributions:
1. We propose an intelligent diagnostic dialogue management algorithm based on a hierarchical reinforcement learning framework. The hierarchical architecture alleviates the dimensionality disaster problem caused by the large number of diseases and symptoms in the action and state spaces.
2. We address the issue of sparsity in the disease classifier. We introduce the concept of information entropy and propose an information entropy-based reward function.
3. Furthermore, considering the higher requirement for coherence in medical dialogue, we enhance the diagnostic accuracy of the dialogue system by incorporating a medical knowledge graph.
We evaluate the MA-HRL model using the SD dataset [31]. The experimental results demonstrate that our model outperforms state-of-the-art methods in various evaluation metrics, except for the number of dialogue turns. Specifically, we achieve improvements of 7.2% in diagnosis accuracy, 0.91% in symptom hit rate, and 15.94% in symptom recognition rate.

2. Related Works

Reinforcement-learning-based dialogue systems have achieved significant progress in various domains in the past decade. In 2018, Wei et al. [21] first proposed combining dialogue systems with disease information collection and automated diagnosis tasks. They introduced a reinforcement-learning-based dialogue framework and annotated the first dataset for training intelligent diagnostic dialogue systems. However, this dataset had limited coverage of diseases and symptoms. In their dialogue management module, they only used a single DQN model, where the action space consists of a combination of diseases and symptoms. The size of the action space was the sum of the number of diseases and symptoms, which would be very large in real-world scenarios, leading to the dimensionality disaster problem.
To address this issue, Tang et al. [32,33] segmented diseases into several groups and trained corresponding strategies for each group, reducing the action space size for each model. They employed fixed rules to determine which strategy to interact with patients. Building upon this, Kao et al. [20] improved upon this approach by no longer relying on fixed rules to select sub-strategies. Instead, they adopted a hierarchical reinforcement learning (HRL) approach based on Multi-level Control to abstract the decision-making process into two control levels, with the upper-level strategy controlling the lower-level strategy.
In order to address this issue, Liao et al. [31] simultaneously trained both levels of strategy. The high-level strategy is referred to as the main controller, responsible for triggering sub-controllers in the lower level. The lower-level sub-controllers comprise N symptom checkers and one disease classifier. When the main controller deems that enough symptom information has been collected, it triggers the lower-level disease classifier to make the final diagnosis. Otherwise, it triggers the symptom checkers to continue asking about symptoms. The introduction of hierarchical reinforcement learning has significantly improved the diagnostic accuracy of intelligent diagnostic dialogue systems when dealing with a large number of diseases and symptoms.
Another related area is the usage of knowledge graphs in diagnostic systems [22,34,35]. Xu et al. [22] proposed a knowledge-guided KR-DS dialogue system, which combined a knowledge graph with the dialogue system to improve the diagnostic accuracy of intelligent diagnostic dialogue systems. Their KR-DQN model extended the single DQN agent by incorporating a medical knowledge graph. The graph includes two types of nodes: diseases and symptoms, both of which are connected by edges representing symptom–symptom and disease–symptom relationships. To capture the correlation between different symptoms and diseases, KR-DS calculated conditional probabilities as edge weights based on the information in the dataset.
Zhao et al. [36,37] argued that KR-DS only utilized the statistical features of the dataset to construct the knowledge graph, which lacks an in-depth understanding of disease–symptom and disease–disease relationships. To address this limitation, they applied Graph Convolutional Networks (GCNs) [38,39,40] to learn node representations in the knowledge graph. They combined GCN with the DQN model, proposing the Graph–DQN model.
Liu et al. [41] also introduced a knowledge graph in their model, considering two types of logic in symptom inquiry. One type is to ask for confirmation of a specific disease, which can be represented using conditional probabilities such as in KR-DS [22]. The other type is to inquire about distinguishing several similar diseases, which can be represented using mutual information between diseases and symptoms. The correlation between these two types of diseases and symptoms is combined in a weighted manner, forming the weights in the knowledge graph.
To enhance the acceptability of the medical system, Arsène Fansi Tchango et al. [42,43] incorporated the doctor’s trust reasoning as a requirement by introducing a reinforcement learning model and redefining the evidence gathering and automated diagnosis tasks. They trained an agent to improve the system’s performance through predicting discrepancies and shaping rewards. However, due to their overly strict reward function setting, they failed to address the sparsity issue of rewards, which affected the inference performance of the model.
Our model combines the aforementioned hierarchical reinforcement learning with action space pruning, effectively addressing the curse of dimensionality in both action and state spaces. To tackle the reward sparsity issue in the disease classifier, we propose an entropy-based reward function that ensures progressive convergence towards accurate disease classification during patient interactions, thus ensuring algorithmic correctness. Finally, we validate the effectiveness of our algorithm on the SD dataset.

3. Methodology

3.1. Overview

The architecture of the hierarchical reinforcement-learning-based intelligent diagnostic dialogue algorithm is shown in Figure 1, consisting of four main components: the agent, disease classifier, state tracker, and patient simulator. The agent and disease classifier together form the dialogue policy component, the state tracker is responsible for maintaining and updating the current environment state, and the patient simulator generates patient actions and provides feedback to the agent as rewards.
First, the dialogue policy component is treated as a complete agent. The agent receives the current environment state at time step t from the state tracker and maps the state to an action a t A based on the policy π ( a s t ) . The patient simulator generates patient actions and returns the computed reward rt to the agent, after which the environment state transitions to s t S . The goal of the agent is to find an optimal policy that maximizes the expected cumulative reward r t = R ( s t , a t ) , where γ [ 0 , 1 ] is the discount factor and T is the maximum number of dialogue turns. In the context of intelligent diagnosis dialogue, the environment state mainly includes the symptoms reported by the patient that the dialogue system has obtained. Let D be the set of diseases and S Y be the set of symptoms associated with these diseases. The state s t = b 1 , b 2 , , b S Y , t , r e is represented as follows: b i is a one-hot vector of length 3 ( i = 1 , 2 , , S Y ), where b i 1 , 0 , 0 , 0 , 1 , 0 , 0 , 0 , 1 , 0 , 0 , 0 indicates the presence of a certain condition, as shown in Table 1. In addition, the state vector includes the current turn t and whether there was a repetition of questions in the previous turn r e 0 , 1 .
The action space A = D S Y of the agent consists of two types of actions: if a t S Y , the dialogue system selects a symptom to ask the patient about; if a t D , the dialogue system makes a final diagnosis, and the dialogue process ends. The success or failure of the entire dialogue process is determined by whether the diagnosis result is correct.

3.2. Hierarchical Reinforcement Learning Architecture

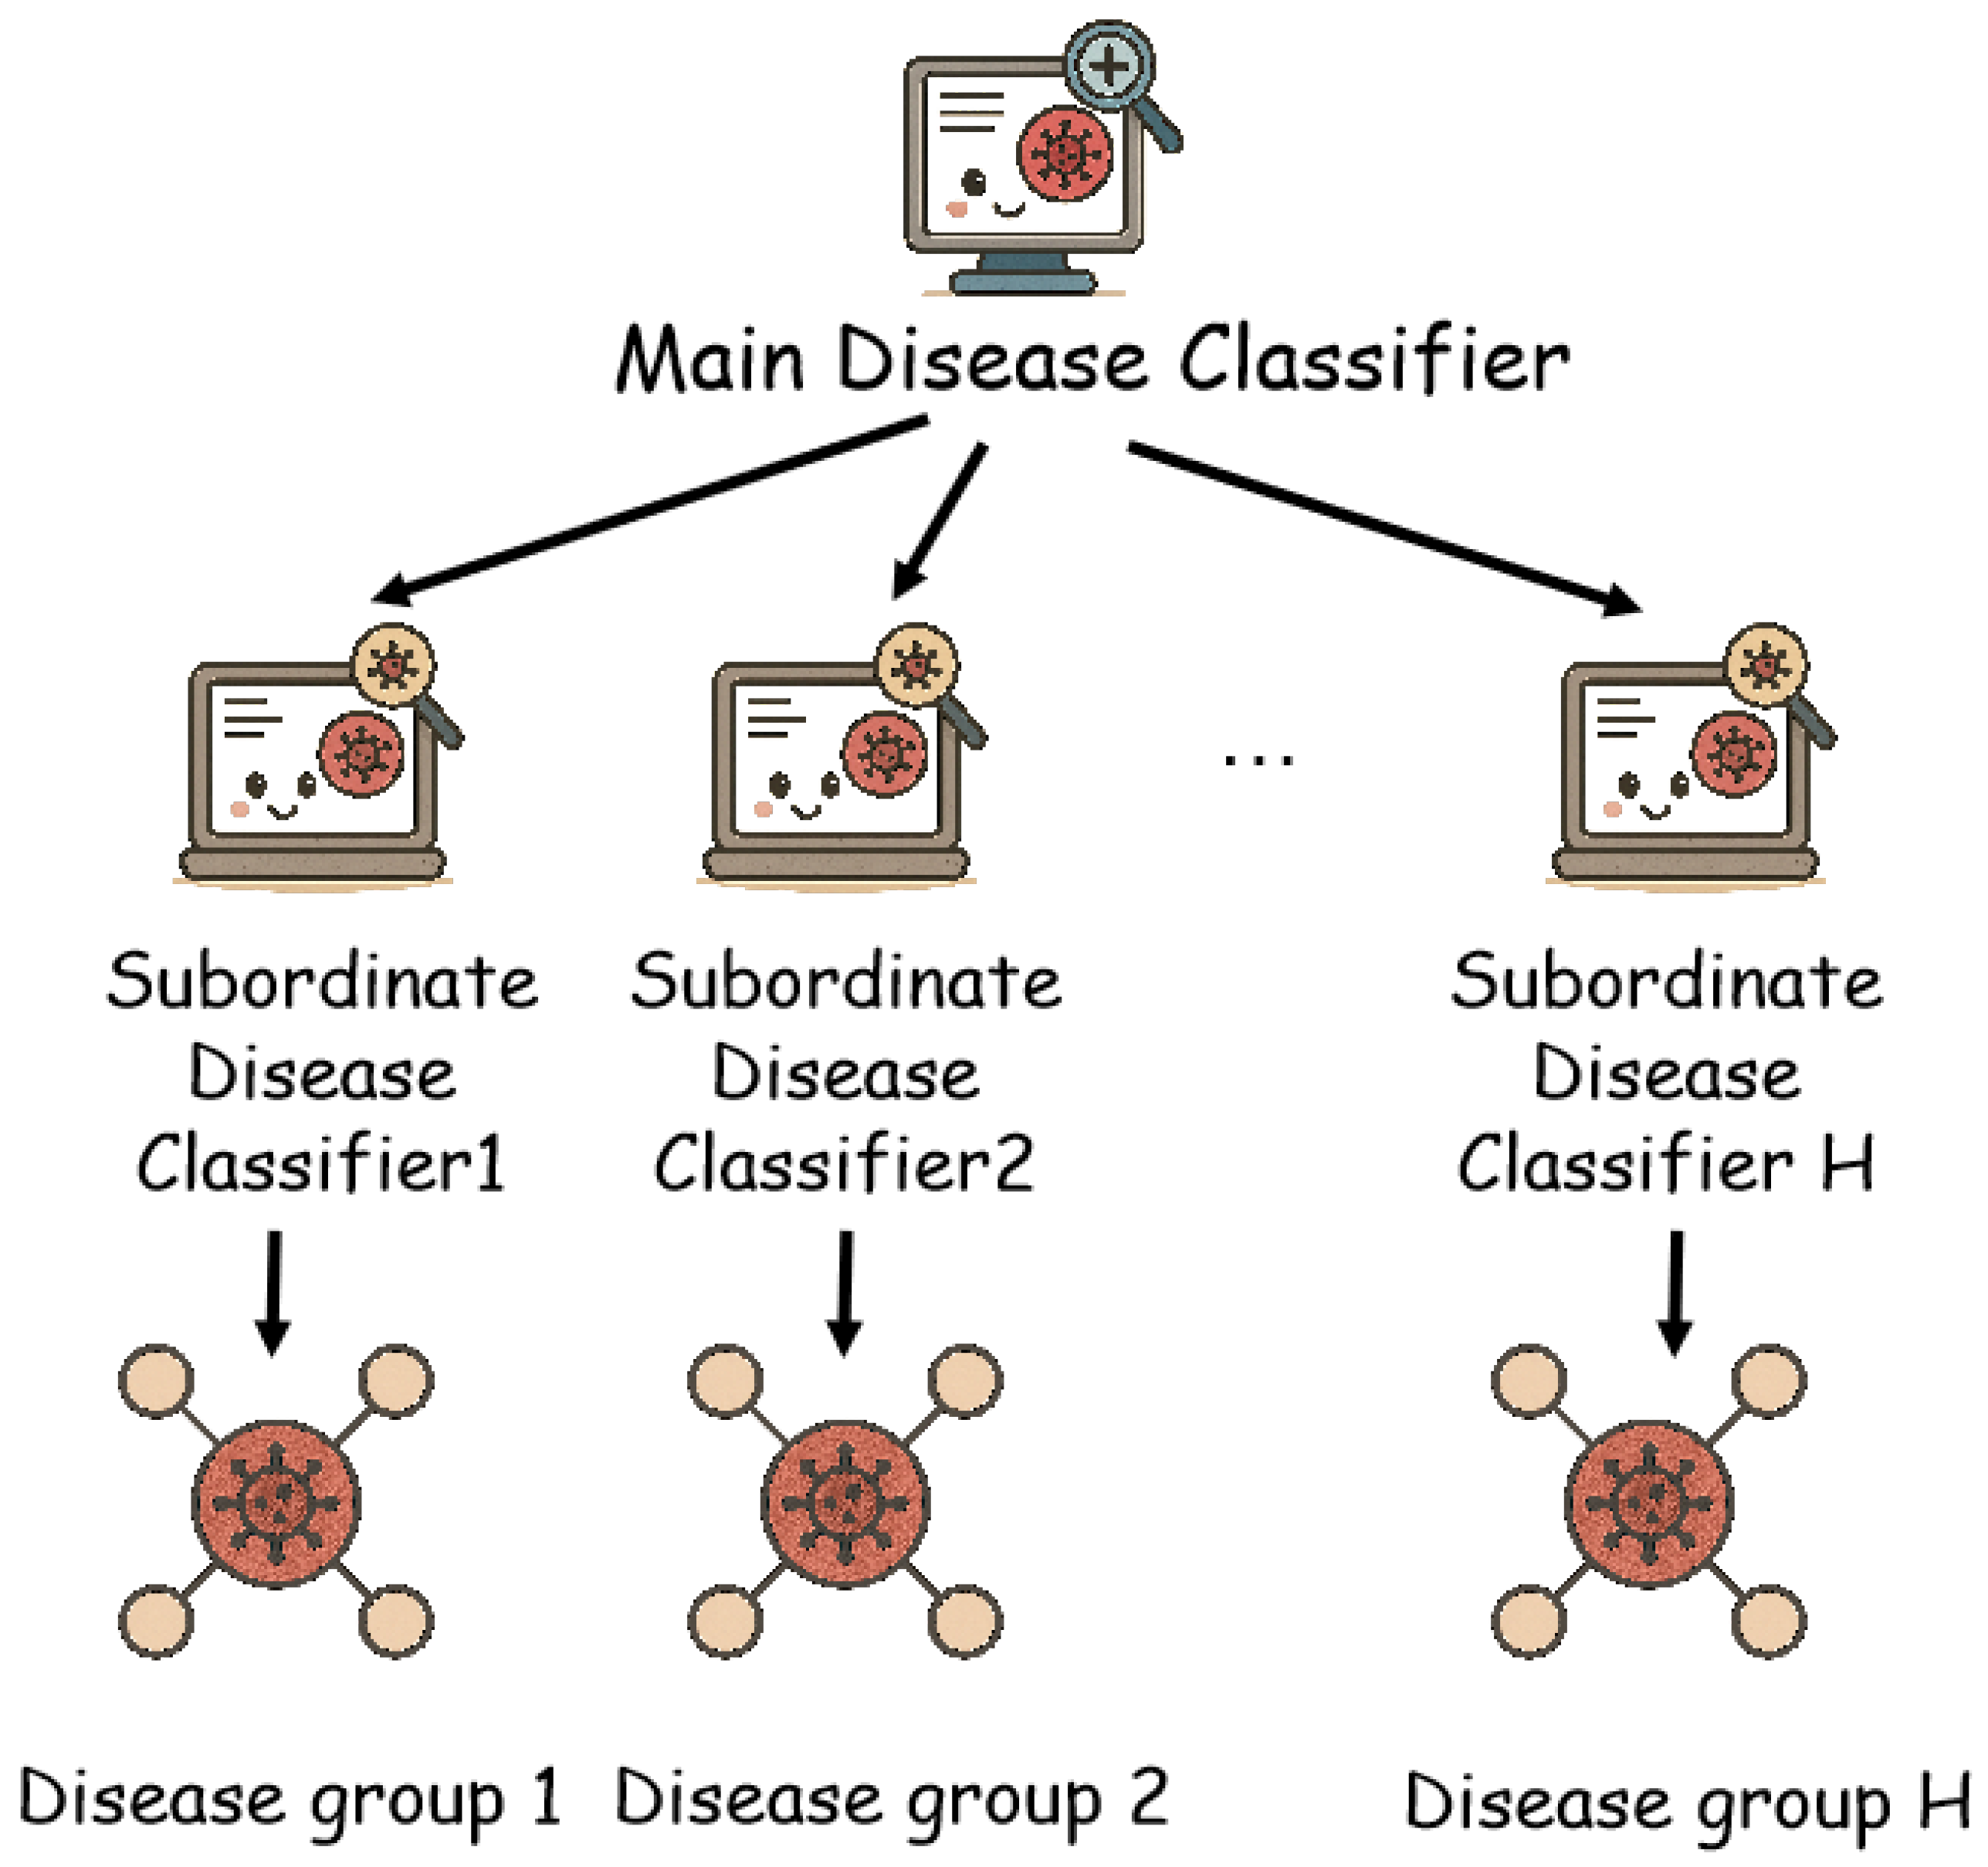
In this study, the disease set D is divided into H groups, where D = D 1 D 2 D H , and D i D j = , i j , i = 1 , 2 , , H , j = 1 , 2 , , H . Each sub-disease set D i is associated with a group of symptoms. The hierarchical architecture adopts a two-level structure, with H Worker Agent in the lower level, each corresponding to a disease group. Each Worker Agent is only concerned with the diseases in its corresponding group and the symptoms associated with those diseases, as shown in Figure 2.
In each round, the primary agent receives the environment state s t , which represents all the currently obtained symptom information. Based on the policy π M ( a t M s t ) , the primary agent decides whether to continue asking symptoms or perform disease diagnosis. The action space of the primary agent is defined as shown in Equation (1), which includes all the Worker Agents and the disease classifier. If one of the Worker Agents is triggered, a subtask is initiated, and in the following k rounds, the symptom inquiry will be conducted by the same Worker Agent ( k [ 1 , N ] , where N represents the maximum number of rounds for the subtask). The current subtask ends when the response to the symptom inquiry by the Worker Agent is “yes” or “no”. If the disease classifier is triggered, the dialogue system provides a disease judgment, and the current dialogue ends.
A M = W 1 , W 2 , , W H , d i s e a s e _ c l a s s i f e r
When a Worker Agent is triggered, it receives the environment state s t and extracts the relevant symptoms s t i corresponding to its assigned subgroup ( s t i = b 1 , b 2 , , b S Y i , t , r e ). The Worker Agent selects a symptom from its own action space based on the policy π i ( a t i s t i ) for further inquiry. The action space of the Worker Agent is defined as shown in Equation (2).
A i = s y 1 , s y 2 , , s y S Y i , i = 1 , 2 , , H
In the hierarchical reinforcement learning architecture, the main agent at the higher level receives an external reward r t e at each round. After the completion of a sub-task, the main agent calculates the cumulative reward r t M for that round using Equation (3), where i = 1 , 2 , , H , and γ is the discount factor.
r t M = s u m t = 1 k γ t r t + t e , i f a t M = W i r t e , i f a t M = d i s e a s e _ c l a s s i f i e r
The objective of the main agent is to maximize its reward; therefore, its loss function is computed using Equation (4), where s represents the next dialogue state, a M is the next action of the main agent, θ M denotes the parameters of the target network, θ M represents the parameters of the current network, and B M refers to the replay buffer of the main agent.
L θ m = E s , a M , r M , s B M r M + r M N max a M Q m s , a M ; θ m Q m s , a M ; θ m 2
The low-level Worker Agents receive internal rewards r t i n at each round. The objective of the Worker Agents is to maximize their rewards, and their loss function is computed using Equation (5). In this equation, θ i represents the parameters of the target network, θ i represents the parameters of the current network, and B i refers to the replay buffer of the Worker Agents.
L θ i = E s i , a i , r i , s i B i r i + r W max a i Q i s i , a i ; θ i Q i s i , a i ; θ i 2

3.3. Hierarchical Disease Classifier

If a single agent is used in the dialogue management module, the agent’s action space includes both symptoms and diseases. However, by assigning the disease classifier the task of disease diagnosis, the action space of the agent is narrowed, alleviating the curse of dimensionality issue. Unlike the agent, the disease classifier operates differently. While the agent optimizes its strategy by maximizing rewards within the reinforcement learning framework, disease classification involves supervised learning, where collected symptom information serves as inputs to the classifier. The classifier’s output is a probability distribution over all diseases, and the dialogue management module selects the disease with the highest probability as the final diagnosis.
Inspired by hierarchical reinforcement learning, this study applies hierarchical thinking to the process of disease diagnosis, modeling disease classifiers in a hierarchical manner, as depicted in Figure 3. The higher-level primary classifier, with a single instance, yields a probability distribution vector p m = p 1 , p 2 , p H over H disease groups. Among these, the group with the highest value triggers its corresponding secondary disease classifier, producing a probability distribution vector p i = p 1 , p 2 , p D i for diseases within that group. The loss function encompasses the categorical cross-entropy between the output probability distribution and the actual distribution. The cross-entropy for the primary disease classifier is expressed as in Equation (6), while for the secondary disease classifier, it follows Equation (7). Here, y j 0 , 1 . For the primary disease classifier, if the true group of the disease is j, y j takes the value 1; otherwise, it takes 0. For the secondary disease classifier, y j is 1 if the disease equals j; otherwise, it is 0.
L m = j = 1 H y j l o g ( p j )
L i = j = 1 D i y j l o g ( p j )

3.4. Reward Design Based on Information Entropy Differential

In the hierarchical architecture, based on the initial state, the initial probability distributions computed by the main disease classifier and the auxiliary disease classifiers are denoted as p M 0 = p 1 , p 2 , , p H and p W 0 = p 1 , p 2 , , p D i , respectively. Their entropies can be calculated using Equations (8) and (9), respectively. The calculated initial entropies serve as normalization terms between different dialogues, preventing significant discrepancies in reward values across different dialogues [44].
H M ( s 0 ) = i = 1 H p i l o g ( p i )
H W ( s 0 ) = i = 1 D i p i l o g ( p i )
Similarly, at time t, the information entropy of the main disease classifier H M ( s t ) and the auxiliary disease classifier H W ( s t ) are computed. After the dialogue system takes an action and transitions to a new state s t + 1 , the information entropies H M ( s t + 1 ) and H W ( s t + 1 ) are calculated. The information discrepancy rewards for the main agent and the auxiliary agent are then obtained using Equations (10) and (11), respectively. The term H Φ ( s t ) H Φ ( s t + 1 ) calculates the difference in entropy between two consecutive time steps. Ideally, this difference should always be positive, but in practice, there may be cases where the entropy increases. Therefore, the max function is used to avoid negative rewards.
r e n t r o p y M = m a x ( H M ( s t ) H M ( s t + 1 ) H M ( s 0 ) , 0 )
r e n t r o p y W = m a x ( H W ( s t ) H W ( s t + 1 ) H W ( s 0 ) , 0 )
In summary, the external reward function is designed in this study as shown in Equation (12), and the internal reward function is formulated as shown in Equation (13), where N represents the maximum number of dialogue turns:
r t e = + 3 × N + r e n t r o p y M i f s u c c e s s 2 × N + r e n t r o p y M i f r e p e a t e d 3 × N + r e n t r o p y M i f r e a c h m a x t u r n r e n t r o p y M o t h e r w i s e
r t i n = + 2 × N + r e n t r o p y W i f m a t c h 2 × N + r e n t r o p y W i f r e p e a t e d r e n t r o p y W o t h e r w i s e
In addition to the information entropy difference reward, the main agent is designed with positive rewards for successful diagnosis and negative rewards for diagnosis failure or exceeding the maximum number of dialogue turns. For the Worker Agents, positive rewards are assigned for inquiring about symptoms with patient responses of “yes” or “no,” while negative rewards are assigned for repeating previously asked symptoms.

3.5. Design of Knowledge Graph for Dialogue Management Module

Medical knowledge can be represented in the form of a knowledge graph, which can be utilized by the dialogue system. In this study, the diseases and symptoms extracted from the training and testing datasets are treated as nodes in the knowledge graph, and the related diseases and symptoms are connected through edges. To characterize the correlation between different symptoms and diseases, weights are assigned to the edges as edge attributes. Since a hierarchical structure is employed in this study, the Worker Agents at the lower level are responsible for a subset of diseases and symptoms. Therefore, a separate medical knowledge graph is constructed for each Worker Agent, which only includes the disease set D i and symptom set S Y i associated with that Worker Agent. The weights of the edges represent the degree of correlation between symptoms and diseases. In this study, the conditional probability p s y i d j is computed based on the dialogue dataset and used as the edge weight. p s y i d j indicates the probability of a patient having symptom s y i given that they have disease d j , and its calculation is described by Formula (14). Here, n d j , s y i represents the number of dialogues where the patient has disease d j and exhibits symptom s y i . By calculating the probability for each symptom–disease pair, the conditional probability matrix M i R S Y i × D i , i = 1 , 2 , , H for the disease group is obtained.
p ( s y i d j ) = n ( d j , s y i ) k = 1 N n ( d j , s y k )
Based on Formula (15), the current symptom probability distribution can be calculated, where p ( d i s ) is the probability distribution computed by the corresponding sub-disease classifier p ( d i s ) R D i × 1 , p ( s y m ) R S Y i × 1 .
p s y m = M i · p d i s
The probability distribution p ( s y m ) is combined with the Q-values computed by the Worker Agents, using prior knowledge to assist the agent’s decision-making. The calculation formula is shown in Equation (16). M L P ( s t ) represents the Q-value distribution computed by the Worker Agents, and the maximum value is selected to correspond to the symptom for inquiry.
a t = a r g m a x a s i g m o i d ( M L P W ( s t ) ) + s i g m o i d ( p ( s y m ) )

4. Experimental

4.1. Dataset

The SD dataset [31] has been used to test the model. The SD dataset is generated from the medical database SymCat (www.symcat.com) including 30,000 dialogue data points involving 90 diseases and 266 symptoms. The construction process of the dataset is as follows: In the SymCat database [45], there are 801 diseases, which were divided into 21 groups based on the International Classification of Diseases, Tenth Revision, Clinical Modification (ICD-10-CM) [46]. The most common 9 groups were selected, and 10 most common diseases were chosen from each group, resulting in a total of 90 diseases. In the Centers for Disease Control and Prevention (CDC) database [47], each disease is associated with a set of symptoms, and each symptom is assigned a probability value indicating the likelihood of having that symptom when diagnosed with the disease. Given a disease and its associated symptoms, the generation process of a patient’s goal is as follows: For each symptom, a random true or false label is assigned (indicating the presence or absence of the symptom), and then one symptom is randomly selected from all the symptoms marked as true as the explicit symptom, while the others are considered implicit symptoms.
Table 2 shows an overview of the dataset, and Table 3 shows the number of symptoms in each disease group, including the number of unique symptoms, which refers to the symptoms not related to other disease groups. It can be observed that each group has relatively fewer unique symptoms compared to associated symptoms. This also increases the difficulty for the intelligent conversational system to accurately identify the correct disease as a symptom is often associated with multiple disease groups.

4.2. Experimental Configuration

We use 80% of the data from the SD dataset, which include 24,000 patient goals, for training purposes. The remaining 20% of the data, amounting to 6000 patient goals, is used for testing. A total of 5000 training episodes are conducted, with each episode randomly selecting 100 patient goals for 100 independent dialogues. In order to ensure sufficient exploration and avoid local optima, both the primary agent and the secondary agent utilize the ε –greedy strategy during training. This means that the agents randomly select actions with a probability of ε and act according to the current policy with a probability of 1 ε .
Other hyperparameters are shown in Table 4.

4.3. Indicators

To evaluate the performance of the dialogue system and compare it with other models, certain metrics need to be defined. In each episode, K independent dialogues are conducted. This study focuses on the following metrics for assessment:
1. The success rate of the dialogue system, specifically the diagnostic accuracy in the intelligent medical inquiry task, is considered as one of the evaluation metrics.
i = 1 K s u c c e s s i K × 100 %
where s u c c e s s i = 1 if the dialogue system performs a successful diagnosis; otherwise, s u c c e s s i = 0 .
2. The cost of dialogue generation, specifically the number of dialogue turns.
3. Symptom hit rate, which refers to the ratio of symptoms inquired by the dialogue system for which the patient actually responds “yes”.
i = 1 K m i r i K × 100 %
where m i represents the number of symptoms in the ith dialogue for which the patient responds “yes,” and r i represents the total number of inquired symptoms.
4. Symptom recognition rate refers to the ratio of symptoms for which the patient responds “yes” to the total number of implicit symptoms that the patient has.
i = 1 K d i r i K × 100 %
where d i represents the number of symptoms for which the patient responds “yes” in the ith dialogue, and r i represents the total number of implicit symptoms the patient has.
Among them, the success rate of the dialogue system, which refers to the accuracy of the diagnosis, is a key indicator that determines the performance of the model in intelligent medical consultation tasks. It directly affects the usability of the intelligent medical consultation dialogue system.

4.4. Performance Analysis

The comparative experiment compares the MA-HRL model in this study with the following four related models:
  • SVM-ex: This model uses the Support Vector Machine (SVM) model [48] and treats the intelligent medical consultation task as a supervised classification task. The input consists of the patient’s explicit symptoms, and the output is the disease diagnosis. The experimental results of this model are generally considered as the lower bound of the diagnostic accuracy in intelligent medical consultation tasks.
  • SVM-ex&im: This model is similar to the SVM-ex model, with the difference that the input includes both explicit and implicit symptoms. The experimental results of this model are generally considered as the upper bound of the diagnostic accuracy in intelligent medical consultation tasks.
  • Flat-DQN [21]: This model uses a single agent to make decisions, and the action space consists of a set of diseases and symptoms. Its neural network structure is the same as the agent in this study.
  • HRL [31]: HRL is currently the state-of-the-art method, which first proposed the SD dataset and trained and validated the model on this dataset. HRL adopts a hierarchical reinforcement learning architecture, and its main and Worker Agents have the same neural network structure as in this study. However, its disease classifier is not hierarchical but a single neural network with a three-layer structure and 256 neurons in the hidden layer. HRL does not introduce information entropy and does not include any knowledge graph.
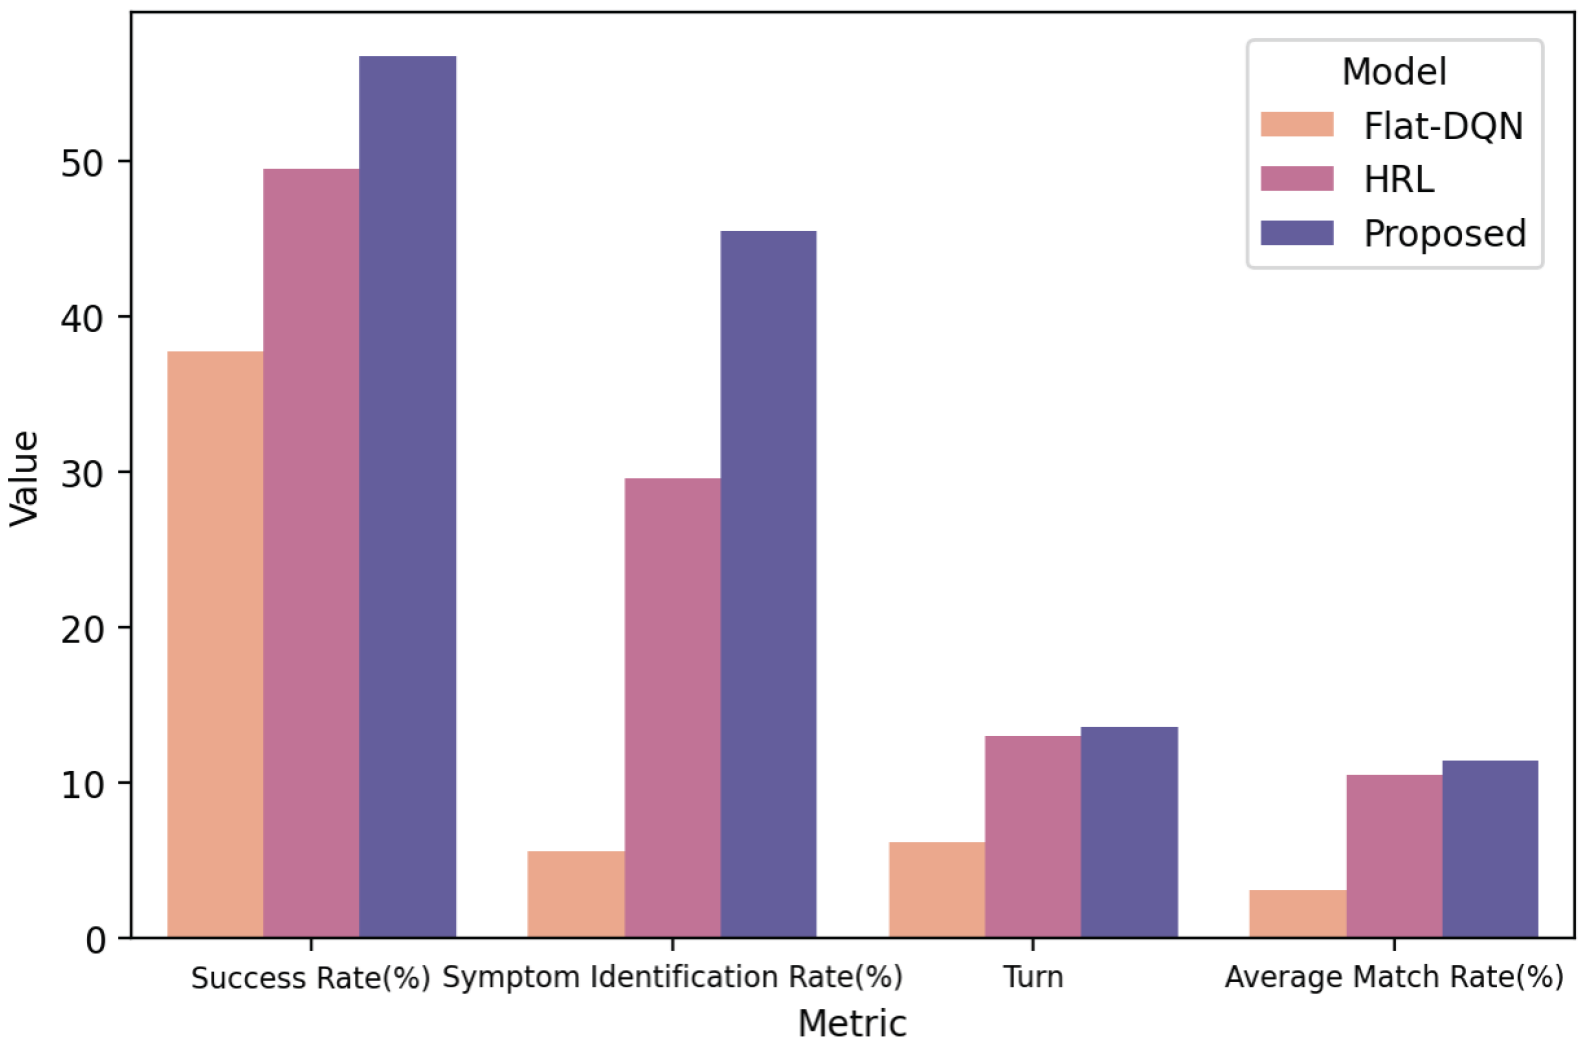
As shown in Table 5, the experimental results demonstrate that the MA-HRL model in this study outperforms the HRL model and the Flat-DQN model in all other metrics except the number of dialogue turns. Although there is a slight increase in the number of dialogue turns compared to HRL, it only incurs an average of one additional dialogue turn. On the other hand, while the Flat-DQN model has fewer dialogue turns, its diagnostic accuracy is lower. Compared to the HRL model, the MA-HRL model achieves a 7.2% improvement in diagnostic accuracy, a 0.91% improvement in symptom hit rate, and a significant 15.94% improvement in symptom recognition rate. The significant improvement in symptom recognition rate indicates that the MA-HRL model can inquire about nearly half of the patients’ implicit symptoms. Figure 4 presents the comparative experimental results of the three reinforcement learning models in the form of a bar chart.
Figure 5 depict the learning curve comparisons of the MA-HRL model, Flat-DQN, and HRL in this study.
Figure 5 shows the variation of the model’s average reward values with the number of training rounds. Our proposed model obtained substantial rewards early in the training process, resulting in a significant improvement compared to the baseline. Figure 5b illustrates the change in the average number of dialogue turns with the number of training rounds, demonstrating a notable improvement in our model as well. In Figure 5c, the success rate of disease diagnosis is depicted as it changes with the number of training rounds. Our model achieved a 10% increase in accuracy compared to the baseline. In summary, our model exhibits substantial improvements in terms of reward values, dialogue turns, and accuracy.

4.5. Ablation Experiment

The ablation experiments aim to compare and validate the contributions of multiple improvements made to the experimental metrics. The ablation experiments will compare the following models, where 1, 2, and 3 each add one improvement to the HRL model and 4, 5, and 6 add two improvements to the HRL model. Model 7 represents the complete model proposed in this study:
1. HRL + KG: Adding medical knowledge graph to the HRL model. 2. HRL + reward: Adding information gain reward to the HRL model. 3. HDC: Adding hierarchical disease classifier to the HRL model. 4. HRL + KG + reward: Adding medical knowledge graph and information gain reward to the HRL model. 5. HDC + KG: Adding medical knowledge graph to the HDC model. 6. HDC + reward: Adding information gain reward to the HDC model. 7. MA-HRL (Ours): The complete model proposed in this study.
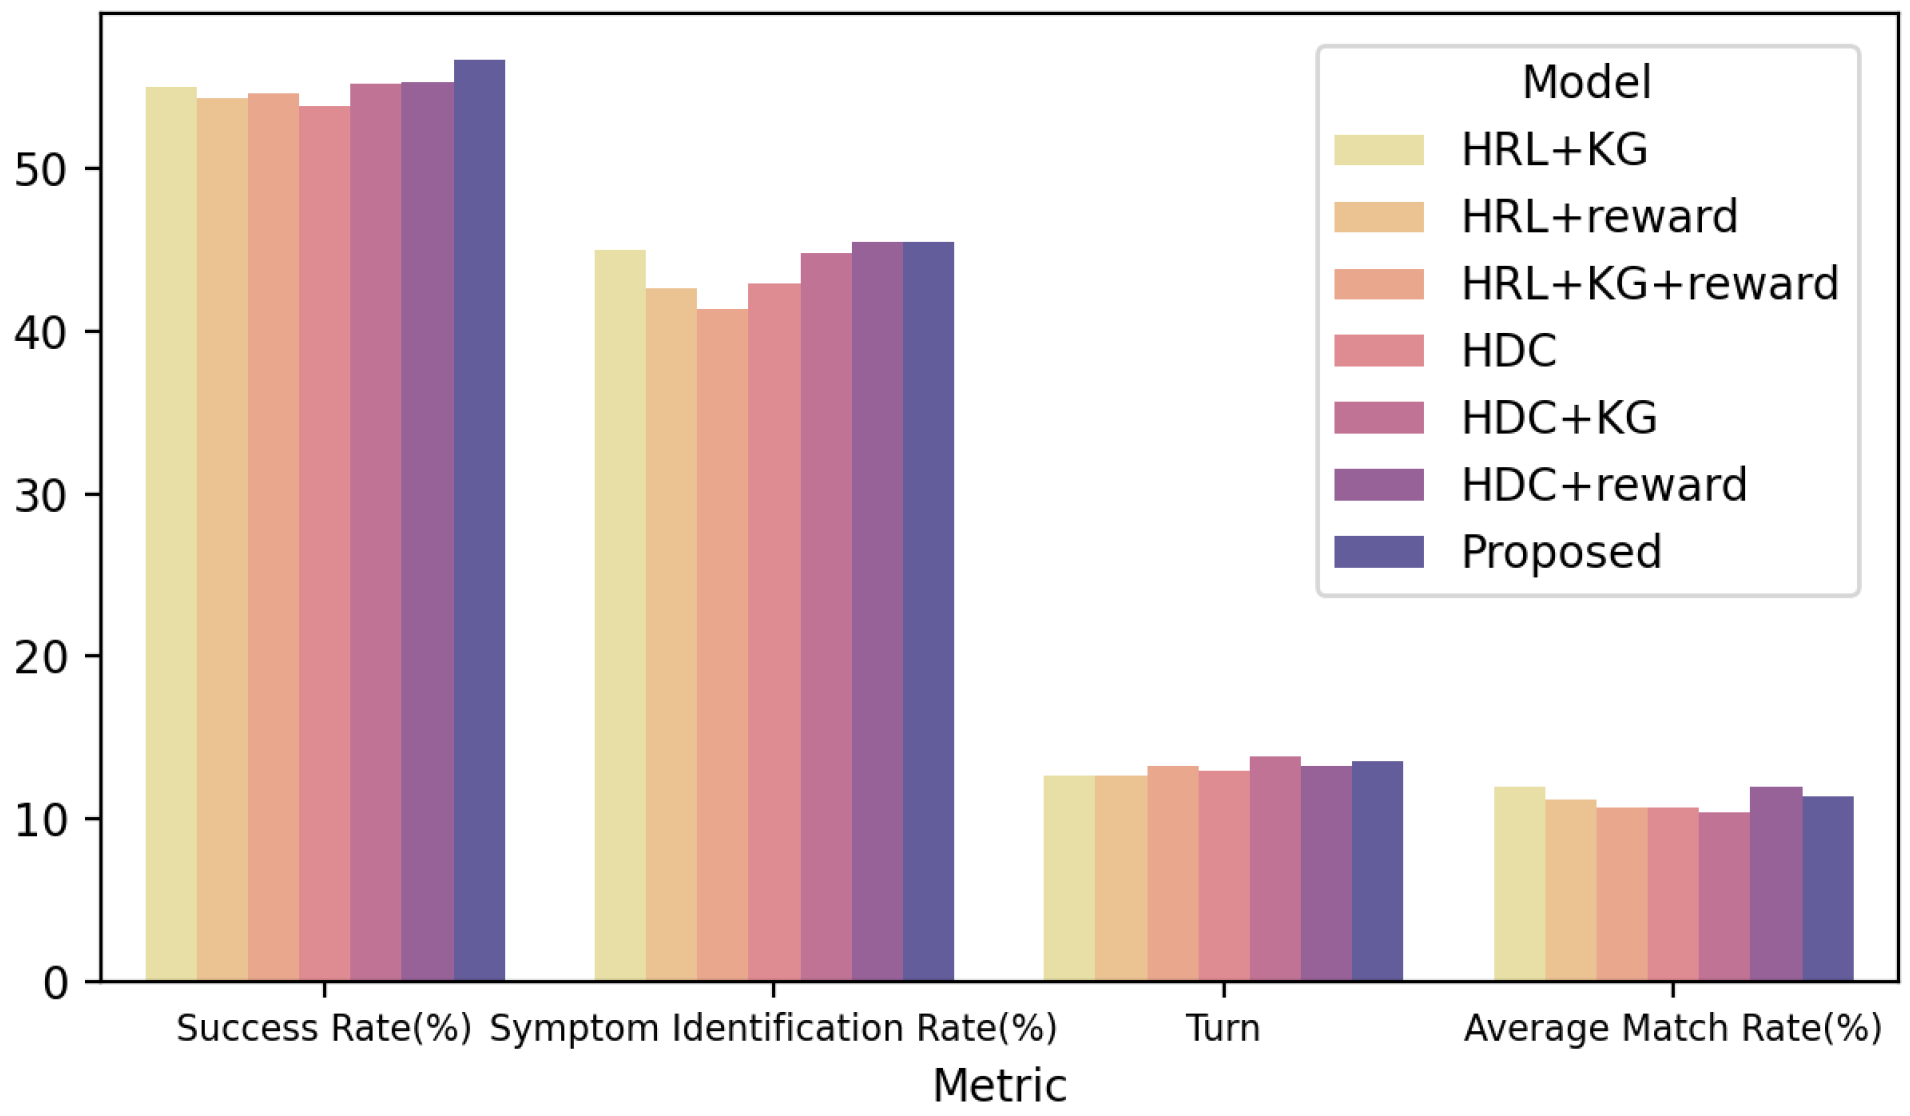
The experimental results, as shown in Table 6, reveal that when only one improvement is added to the HRL model, the introduction of medical knowledge graph contributes significantly to the enhancement of the metrics, with higher symptom hit rate and symptom recognition rate compared to the other two models. However, in the comparison of models with two improvements, the model incorporating the hierarchical disease classifier performs better, while the model with information gain reward outperforms the model with knowledge graph in all metrics. Figure 6 presents the results of the ablation experiments in a bar chart format.
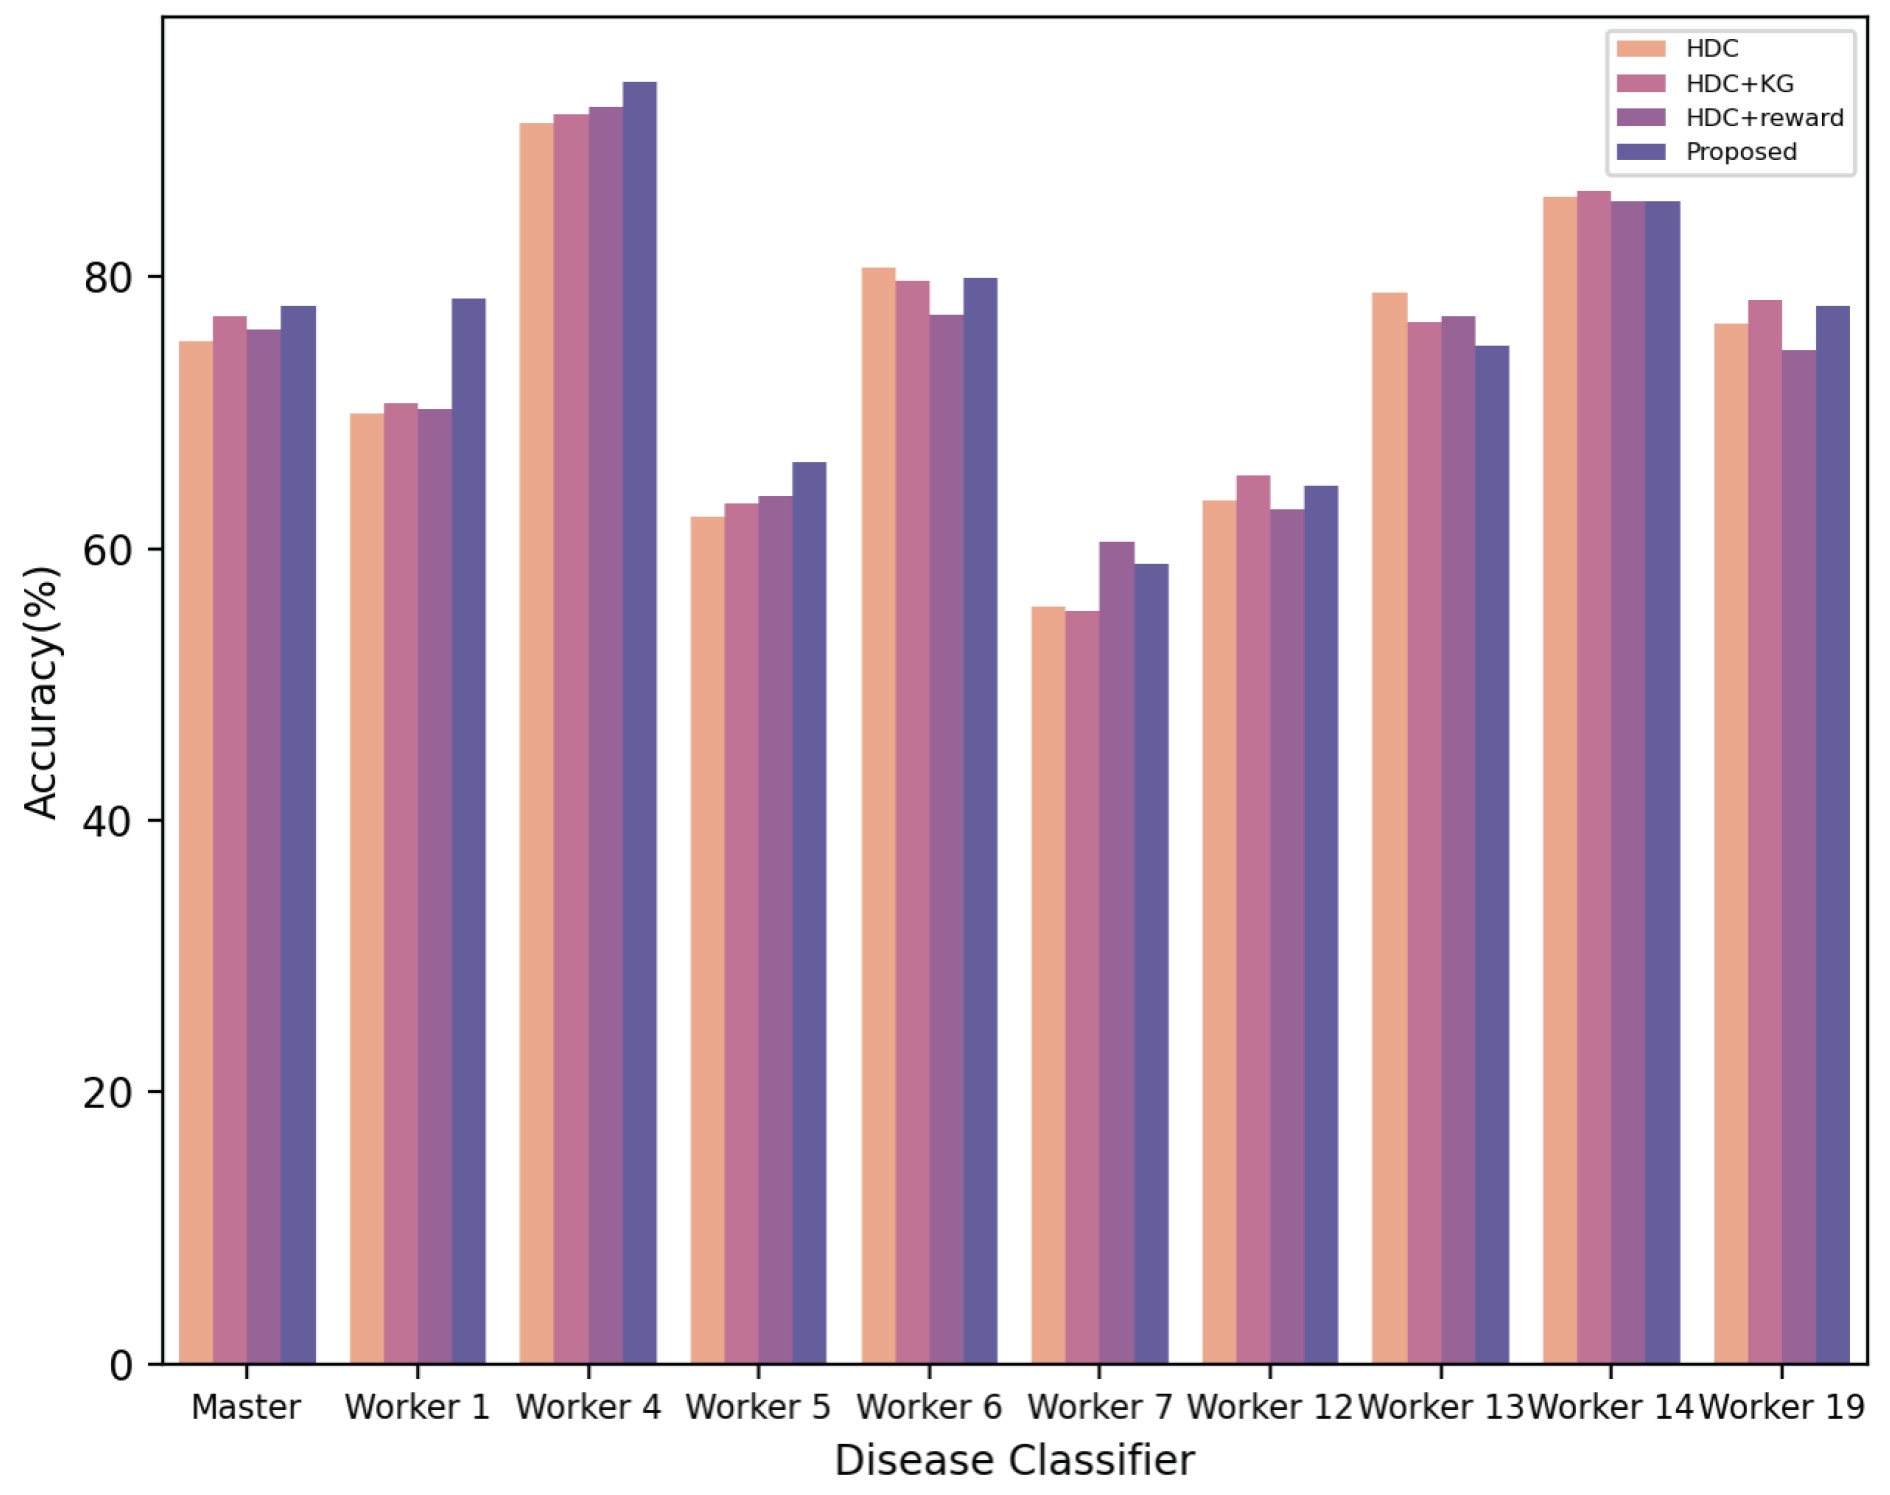
Table 7 presents the models that include a hierarchical disease classifier, along with the performance of the main disease classifier and each subordinate disease classifier during testing. It can be observed that the disease classifiers of each model exhibit similar performance across different disease groups. For example, they perform best in disease group 4 (endocrine, nutritional, and metabolic diseases) and worst in disease group 7 (eye and adnexa diseases). The main classifier and the three subordinate classifiers of the proposed model in this study achieve higher accuracy compared to other models, possibly due to the intelligent agent obtaining more symptom information through questioning. Overall, the performance of the disease classifiers in other models can be ranked from best to worst as HDC + KG, HDC, and HDC + reward, which aligns with the diagnostic accuracy of each model. Figure 7 visualizes these experimental results in a bar chart format.
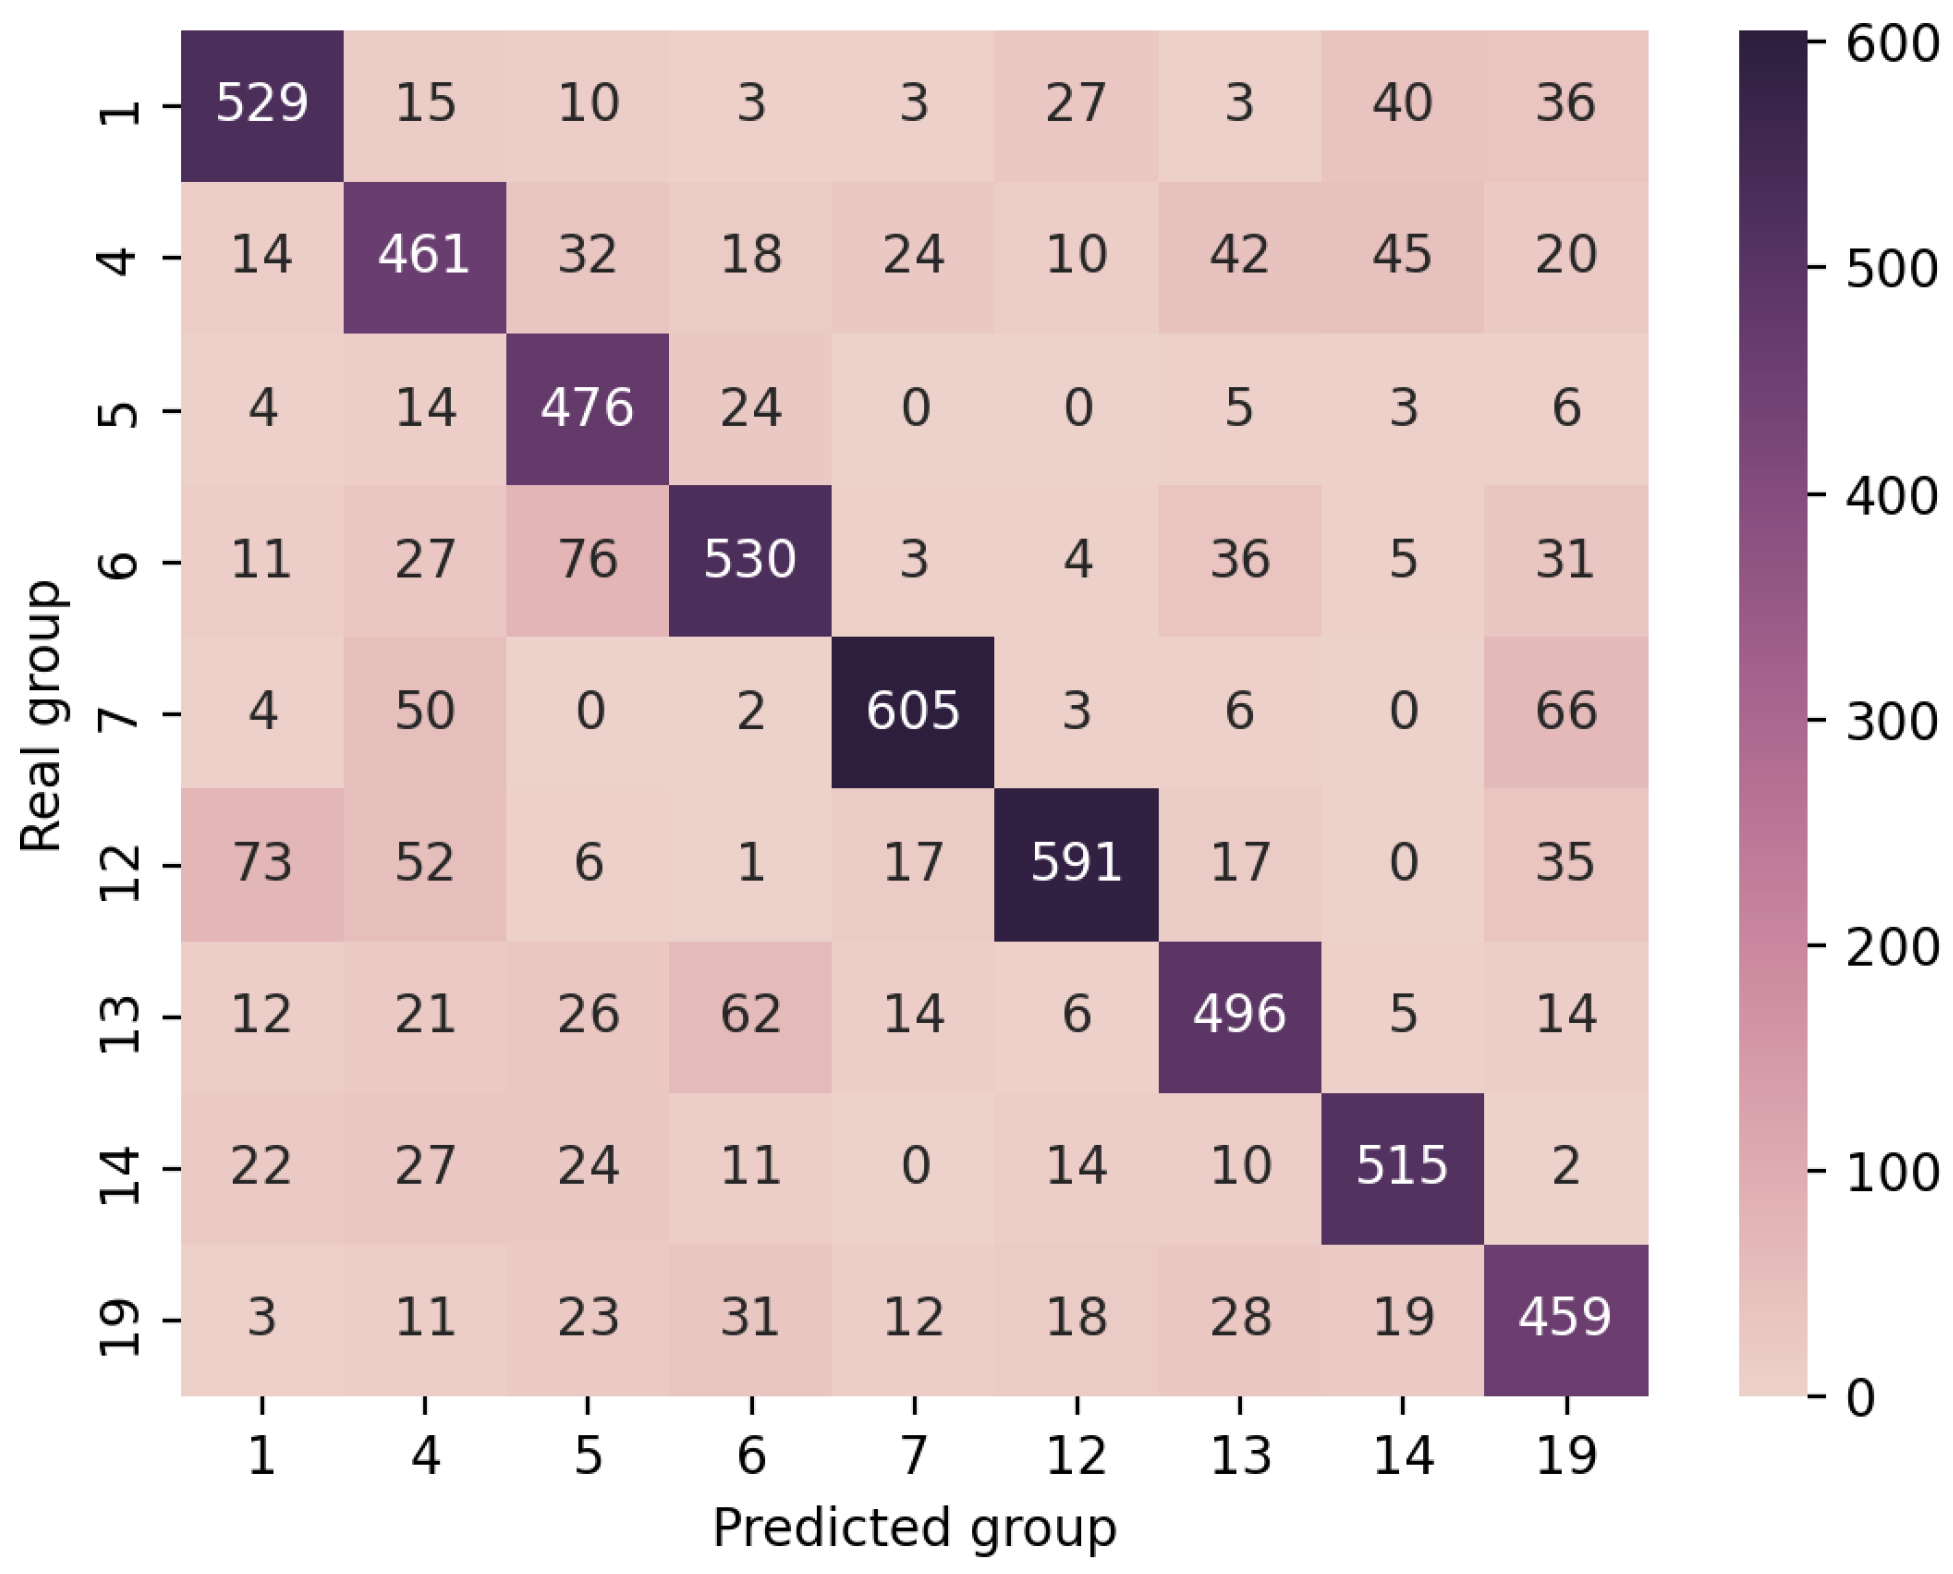
To further investigate the performance of the disease classifiers in the proposed model, the alignment between the actual disease group of the selected patient targets during testing and the predicted disease group by the disease classifiers is presented in Figure 8. From the figure, it can be observed that, due to the 77.9% accuracy of the main disease classifier, in most cases, the predicted disease group aligns with the actual disease group. However, inaccuracies in prediction occur due to the lower accuracy of some subordinate classifiers.

5. Conclusions

This study proposes and implements an intelligent diagnosis dialogue algorithm based on deep reinforcement learning. Inspired by hierarchical reinforcement learning, a hierarchical architecture for intelligent agents and disease classifiers is designed. The algorithm introduces the concept of information entropy and designs a reward function based on the difference in information entropy. A medical knowledge graph is constructed to assist intelligent agents in decision-making. The algorithm achieves effective results on a real-world dataset. However, current intelligent diagnosis systems typically only consider the patient’s symptom information as input and overlook other patient-specific features such as age, gender, and pathography. Incorporating these additional information into the system to improve the diagnostic accuracy is one of the future directions for further research.

Author Contributions

Conceptualization and Methodology: X.L. and W.W.; Software: Y.Q.; Validation: X.L. and Y.Q.; Data Curation: Z.F. and Y.Q.; Writing—Original Draft Preparation: X.L. and X.Y.; Writing—Review and Editing: X.Y., R.S., J.Y. and W.W.; Visualization: Z.F.; Supervision: R.S. and W.W. All authors have read and agreed to the published version of the manuscript.

Funding

This work was supported in part by the National Science and Technology Major Project (No. 2022ZD0117801), and the Beihang Ganwei Project (JKF-20240761).

Data Availability Statement

The original contributions presented in this study are included in the article; further inquiries can be directed to the corresponding author.

Acknowledgments

I would like to express my deepest gratitude to my supervisor, Wenjun Wu, for their invaluable guidance, insightful feedback, and continuous support throughout the course of this research. I also wish to thank the other authors for their collaborative efforts and stimulating discussions. This work was supported in part by the National Science and Technology Major Project (No. 2022ZD0117801). I am grateful to the State Grid Corporation of China for providing essential resources and infrastructure for this project. Special thanks go to Yuchen Qin, whose dedication to writing code and conducting experimental validation was instrumental to the success of this research.

Conflicts of Interest

The authors declare no conflicts of interest.

References

  1. Wang, X.; Wang, S.; Liang, X.; Zhao, D.; Huang, J.; Xu, X.; Dai, B.; Miao, Q. Deep reinforcement learning: A survey. IEEE Trans. Neural Netw. Learn. Syst. 2022, 35, 5064–5078. [Google Scholar] [CrossRef] [PubMed]
  2. Moerl, T.M.; Broekens, J.; Plaat, A.; Jonker, C.M. Model-based reinforcement learning: A survey. Found. Trends® Mach. Learn. 2023, 16, 1–118. [Google Scholar]
  3. Matsuo, Y.; LeCun, Y.; Sahani, M.; Precup, D.; Silver, D.; Sugiyama, M.; Uchibe, E.; Morimoto, J. Deep learning, reinforcement learning, and world models. Neural Netw. 2022, 152, 267–275. [Google Scholar] [CrossRef]
  4. Vrba, P.; Mařík, V.; Siano, P.; Leitão, P.; Zhabelova, G.; Vyatkin, V.; Strasser, T. A review of agent and service-oriented concepts applied to intelligent energy systems. IEEE Trans. Ind. Inform. 2014, 10, 1890–1903. [Google Scholar] [CrossRef]
  5. Marinakis, V.; Doukas, H.; Tsapelas, J.; Mouzakitis, S.; Sicilia, Á.; Madrazo, L.; Sgouridis, S. From big data to smart energy services: An application for intelligent energy management. Future Gener. Comput. Syst. 2020, 110, 572–586. [Google Scholar] [CrossRef]
  6. Sutton, R.S.; Barto, A.G. Reinforcement learning. J. Cogn. Neurosci. 1999, 11, 126–134. [Google Scholar]
  7. Kaelbling, L.P.; Littman, M.L.; Moore, A.W. Reinforcement learning: A survey. J. Artif. Intell. Res. 1996, 4, 237–285. [Google Scholar] [CrossRef]
  8. Calinescu, R.; Grunske, L.; Kwiatkowska, M.; Mirandola, R.; Tamburrelli, G. Dynamic QoS management and optimization in service-based systems. IEEE Trans. Softw. Eng. 2010, 37, 387–409. [Google Scholar] [CrossRef]
  9. Pinson, P.; Madsen, H. Benefits and challenges of electrical demand response: A critical review. Renew. Sustain. Energy Rev. 2014, 39, 686–699. [Google Scholar]
  10. Li, S.E. Deep reinforcement learning. In Reinforcement Learning for Sequential Decision and Optimal Control; Springer Nature: Singapore, 2023; pp. 365–402. [Google Scholar]
  11. Desolda, G.; Ardito, C.; Matera, M. Empowering end users to customize their smart environments: Model, composition paradigms, and domain-specific tools. ACM Trans. Comput.-Hum. Interact. (TOCHI) 2017, 24, 1–52. [Google Scholar] [CrossRef]
  12. Aiello, M. A challenge for the next 50 years of automated service composition. In Proceedings of the International Conference on Service-Oriented Computing, Seville, Spain, 29 November–2 December 2022; Springer Nature: Cham, Switzerland, 2022; pp. 635–643. [Google Scholar]
  13. Levene, M.; Poulovassilis, A.; Abiteboul, S.; Benjelloun, O.; Manolescu, I.; Milo, T.; Weber, R. Active XML: A data-centric perspective on web services. In Web Dynamics: Adapting to Change in Content, Size, Topology and Use; Springer: Berlin/Heidelberg, Germany, 2004; pp. 275–299. [Google Scholar]
  14. Cuayáhuitl, H.; Lee, D.; Ryu, S.; Cho, Y.; Choi, S.; Indurthi, S.; Yu, S.; Choi, H.; Hwang, I.; Kim, J. Ensemble-based deep reinforcement learning for chatbots. Neurocomputing 2019, 366, 118–130. [Google Scholar] [CrossRef]
  15. Mo, K.; Zhang, Y.; Li, S.; Li, J.; Yang, Q. Personalizing a dialogue system with transfer reinforcement learning. In Proceedings of the AAAI Conference on Artificial Intelligence, New Orleans, LA, USA, 2–7 February 2018; Volume 32. [Google Scholar]
  16. Chen, Z.; Chen, L.; Zhou, X.; Yu, K. Deep reinforcement learning for on-line dialogue state tracking. In Proceedings of the National Conference on Man-Machine Speech Communication, Hefei, China, 15–18 December 2022; Springer Nature: Singapore, 2022; pp. 278–292. [Google Scholar]
  17. Kwan, W.C.; Wang, H.R.; Wang, H.M.; Wong, K.F. A survey on recent advances and challenges in reinforcement learning methods for task-oriented dialogue policy learning. Mach. Intell. Res. 2023, 20, 318–334. [Google Scholar] [CrossRef]
  18. Zhou, H.; Young, T.; Huang, M.; Zhao, H.; Xu, J.; Zhu, X. Commonsense knowledge aware conversation generation with graph attention. In Proceedings of the 27th International Joint Conference on Artificial Intelligence, Stockholm, Sweden, 13–19 July 2018; Volume 18, pp. 4623–4629. [Google Scholar]
  19. Moon, S.; Shah, P.; Kumar, A.; Subba, R. Opendialkg: Explainable conversational reasoning with attention-based walks over knowledge graphs. In Proceedings of the 57th Annual Meeting of the Association for Computational Linguistics, Florence, Italy, 28 July–2 August 2019; pp. 845–854. [Google Scholar]
  20. Kao, H.C.; Tang, K.F.; Chang, E. Context-aware symptom checking for disease diagnosis using hierarchical reinforcement learning. In Proceedings of the AAAI Conference on Artificial Intelligence, New Orleans, LA, USA, 2–7 February 2018; Volume 32. [Google Scholar]
  21. Wei, Z.; Liu, Q.; Peng, B.; Tou, H.; Chen, T.; Huang, X.; Wong, K.-F.; Dai, X. Task-oriented dialogue system for automatic diagnosis. In Proceedings of the 56th Annual Meeting of the Association for Computational Linguistics, Melbourne, Australia, 15–20 July 2018; Volume 2: Short Papers, pp. 201–207. [Google Scholar]
  22. Xu, L.; Zhou, Q.; Gong, K.; Liang, X.; Tang, J.; Lin, L. End-to-end knowledge-routed relational dialogue system for automatic diagnosis. In Proceedings of the AAAI Conference on Artificial Intelligence, Honolulu, HI, USA, 27 January–1 February 2019; Volume 33, pp. 7346–7353. [Google Scholar]
  23. Milanovic, N.; Malek, M. Current solutions for web service composition. IEEE Internet Comput. 2004, 8, 51–59. [Google Scholar] [CrossRef]
  24. Ardagna, D.; Pernici, B. Adaptive service composition in flexible processes. IEEE Trans. Softw. Eng. 2007, 33, 369–384. [Google Scholar] [CrossRef]
  25. Rao, J.; Su, X. A survey of automated web service composition methods. In Proceedings of the International Workshop on Semantic Web Services and Web Process Composition, San Diego, CA, USA, 6 July 2004; Springer: Berlin/Heidelberg, Germany, 2004; pp. 43–54. [Google Scholar]
  26. Kona, S.; Bansal, A.; Blake, M.B.; Gupta, G. Generalized semantics-based service composition. In Proceedings of the 2008 IEEE International Conference on Web Services, Beijing, China, 23–26 September 2008; pp. 219–227. [Google Scholar]
  27. Weise, T.; Blake, M.B.; Bleul, S. Semantic web service composition: The web service challenge perspective. In Web Services Foundations; Springer: New York, NY, USA, 2014; pp. 161–187. [Google Scholar]
  28. Weise, T.; Bleul, S.; Geihs, K. Web Service Composition Systems for the Web Service Challenge-a Detailed Review; University of Kassel: Kassel, Germany, 2007. [Google Scholar]
  29. Grattafiori, A.; Dubey, A.; Jauhri, A.; Pandey, A.; Kadian, A.; Al-Dahle, A.; Letman, A.; Mathur, A.; Schelten, A.; Vaughan, A.; et al. The llama 3 herd of models. arXiv 2024, arXiv:2407.21783. [Google Scholar]
  30. Dankwa, S.; Zheng, W. Twin-delayed ddpg: A deep reinforcement learning technique to model a continuous movement of an intelligent robot agent. In Proceedings of the 3rd International Conference on Vision, Image and Signal Processing, Singapore, 27–29 July 2019; pp. 1–5. [Google Scholar]
  31. Liao, K.; Zhong, C.; Chen, W.; Liu, Q.; Wei, Z.; Peng, B.; Huang, X. Task-oriented dialogue system for automatic disease diagnosis via hierarchical reinforcement learning. In Proceedings of the Tenth International Conference on Learning Representations (ICLR 2022), Virtual, 25 April 2022. [Google Scholar]
  32. Tang, K.F.; Kao, H.C.; Chou, C.N.; Chang, E.Y. Inquire and diagnose: Neural symptom checking ensemble using deep reinforcement learning. In Proceedings of the NIPS Workshop on Deep Reinforcement Learning, Barcelona, Spain, 5–10 December 2016. [Google Scholar]
  33. Nesterov, A.; Ibragimov, B.; Umerenkov, D.; Shelmanov, A.; Zubkova, G.; Kokh, V. Neuralsympcheck: A symptom checking and disease diagnostic neural model with logic regularization. In Proceedings of the International Conference on Artificial Intelligence in Medicine, Halifax, NS, Canada, 14–17 June 2022; Springer International Publishing: Cham, Switzerland, 2022; pp. 76–87. [Google Scholar]
  34. Liu, W.; Tang, J.; Liang, X.; Cai, Q. Heterogeneous graph reasoning for knowledge-grounded medical dialogue system. Neurocomputing 2021, 442, 260–268. [Google Scholar] [CrossRef]
  35. Lin, S.; Zhou, P.; Liang, X.; Tang, J.; Zhao, R.; Chen, Z.; Lin, L. Graph-evolving meta-learning for low-resource medical dialogue generation. In Proceedings of the AAAI Conference on Artificial Intelligence, Virtually, 2–9 February 2021; Volume 35, pp. 13362–13370. [Google Scholar]
  36. Zhao, X.; Chen, L.; Chen, H. A weighted heterogeneous graph-based dialog system. IEEE Trans. Neural Netw. Learn. Syst. 2021, 34, 5212–5217. [Google Scholar] [CrossRef]
  37. Zhang, H.; Liu, M.; Gao, Z.; Lei, X.; Wang, Y.; Nie, L. Multimodal dialog system: Relational graph-based context-aware question understanding. In Proceedings of the 29th ACM International Conference on Multimedia, Virtual, 20–24 October 2021; pp. 695–703. [Google Scholar]
  38. Kipf, T.N.; Welling, M. Semi-supervised classification with graph convolutional networks. arXiv 2016, arXiv:1609.02907. [Google Scholar]
  39. Chen, W.; Feng, F.; Wang, Q.; He, X.; Song, C.; Ling, G.; Zhang, Y. Catgcn: Graph convolutional networks with categorical node features. IEEE Trans. Knowl. Data Eng. 2021, 35, 3500–3511. [Google Scholar] [CrossRef]
  40. Jin, W.; Derr, T.; Wang, Y.; Ma, Y.; Liu, Z.; Tang, J. Node similarity preserving graph convolutional networks. In Proceedings of the 14th ACM International Conference on Web Search and Data Mining, Virtual, 8–12 March 2021; pp. 148–156. [Google Scholar]
  41. Liu, W.; Cheng, Y.; Wang, H.; Tang, J.; Liu, Y.; Zhao, R.; Li, W.; Zheng, Y.; Liang, X. “My nose is running.” “Are you also coughing?”: Building A Medical Diagnosis Agent with Interpretable Inquiry Logics. arXiv 2022, arXiv:2204.13953. [Google Scholar]
  42. Fansi Tchango, A.; Goel, R.; Martel, J.; Wen, Z.; Marceau Caron, G.; Ghosn, J. Towards trustworthy automatic diagnosis systems by emulating doctors’ reasoning with deep reinforcement learning. Adv. Neural Inf. Process. Syst. 2022, 35, 24502–24515. [Google Scholar]
  43. Lin, J.; Xu, L.; Chen, Z.; Lin, L. Towards a reliable and robust dialogue system for medical automatic diagnosis. In Proceedings of the International Conference on Learning Representations (ICLR 2021), Vienna, Austria, 4 May 2021. [Google Scholar]
  44. Shannon, C.E. A mathematical theory of communication. Bell Syst. Tech. J. 1948, 27, 379–423. [Google Scholar] [CrossRef]
  45. Al-Ars, Z.; Agba, O.; Guo, Z.; Boerkamp, C.; Jaber, Z.; Jaber, T. NLICE: Synthetic Medical Record Generation for Effective Primary Healthcare Differential Diagnosis. In Proceedings of the 2023 IEEE 23rd International Conference on Bioinformatics and Bioengineering (BIBE), Dayton, OH, USA, 4–6 December 2023; pp. 397–402. [Google Scholar]
  46. Cartwright, D.J. ICD-9-CM to ICD-10-CM codes: What? why? how? Adv. Wound Care 2013, 2, 588–592. [Google Scholar] [CrossRef] [PubMed]
  47. Sievert, D.M.; Boulton, M.L.; Stoltman, G.; Johnson, D.; Stobierski, M.G.; Downes, F.P.; Somsel, P.A.; Rudrik, J.T.; Brown, W.; Hafeez, W.; et al. From the centers for disease control and prevention. JAMA 2002, 288, 824. [Google Scholar]
  48. Wang, Z.; Xue, X. Multi-class support vector machine. Support Vector Mach. Appl. 2014, 23–48. [Google Scholar]
Figure 1. Architecture of MA-HRL.
Electronics 14 03001 g001
Figure 2. Hierarchical reinforcement learning architecture.
Electronics 14 03001 g002
Figure 3. Hierarchical diagnostic algorithm.
Electronics 14 03001 g003
Figure 4. Comparison experimental results.
Electronics 14 03001 g004
Figure 5. Learning curve comparisons of the MA-HRL, Flat-DQN, and HRL.
Electronics 14 03001 g005
Figure 6. Results of ablation experiments.
Electronics 14 03001 g006
Figure 7. Comparison of accuracy among different disease classifiers.
Electronics 14 03001 g007
Figure 8. Prediction of disease group by disease classifiers.
Electronics 14 03001 g008
Table 1. Meaning of state vector.
VectorMeaning
[ 0 , 0 , 0 ] No inquiry about this symptom
[ 0 , 0 , 1 ] Patient responds “Uncertain”
[ 0 , 1 , 0 ] Patient responds “No”
[ 1 , 0 , 0 ] Patient responds “Yes”
Table 2. Overview of the dataset.
CategoriesQuantity
Patient goal30,000
Disease90
Disease group10
Symptoms266
Average prominent symptoms2.6
Table 3. Distribution of disease groups in the dataset.
Disease
Groups
Disease
Group Names
Number of
Disease
Categories
Number of
Patient
Goals
Number of
Associated
Symptoms
Number of
Unique
Symptoms
1Infectious diseases and parasitic diseases103371659
4Endocrine, nutritional and metabolic diseases1033488916
5Psychiatric and behavioral disorders1033556810
6Neurological disorders103380587
7Ocular and adnexal diseases1032864610
12Skin and subcutaneous tissue diseases1033035118
13Musculoskeletal system and connective tissue diseases1032496224
14Diseases of the genitourinary system1032746926
19Injuries, poisonings, and certain other external causes103389736
Table 4. Model hyperparameter settings.
HyperparametersValues
Training epochs5000
Number of dialogues per epoch100
Batch size100
Learning rate0.005
ε 0.1
Maximum dialogue turns28
Maximum dialogue turns for subtask N5
Discount factor γ 0.95
Table 5. Results of comparative experiments.
ModelDiagnostic
Accuracy (%)
Number of
Dialogue Turns
Symptom
Matching Rate (%)
Symptom
Recognition Rate (%)
SVM-ex32.2N/AN/AN/A
SVM-ex&im73.1N/AN/AN/A
Flat-DQN37.76.23.15.6
HRL49.512.9510.4929.56
MA-HRL (Ours)56.713.5511.445.5
Table 6. Ablation Study Results.
ModelDiagnostic
Accuracy (%)
Number of
Dialogue Turns
Symptom
Matching Rate (%)
Symptom
Recognition Rate (%)
HRL + KG55.012.6412.045.0
HRL + reward54.412.6211.242.6
HDC53.912.9410.742.9
HRL + KG + reward54.613.2010.741.4
HDC + KG55.213.8410.444.8
HDC + reward55.313.2312.045.5
MA-HRL (Ours)56.713.5511.445.5
Table 7. Accuracy of each disease classifier.
Disease ClassifierHDCHDC + KGHDC + RewardMA-HRL (Ours)
Primary disease classifier75.3%77.1%76.1%77.9%
Secondary disease classifier169.94%70.68%70.24%78.42%
Secondary disease classifier 491.3%92.04%92.48%94.4%
Secondary disease classifier 562.36%63.3%63.9%66.42%
Secondary disease classifier 680.65%79.77%77.27%79.91%
Secondary disease classifier 755.75%55.46%60.47%58.85%
Secondary disease classifier 1263.6%65.38%62.85%64.64%
Secondary disease classifier 1378.85%76.67%77.14%74.96%
Secondary disease classifier 1485.92%86.39%85.6%85.6%
Secondary disease classifier 1976.53%78.33%74.59%77.88%
Disclaimer/Publisher’s Note: The statements, opinions and data contained in all publications are solely those of the individual author(s) and contributor(s) and not of MDPI and/or the editor(s). MDPI and/or the editor(s) disclaim responsibility for any injury to people or property resulting from any ideas, methods, instructions or products referred to in the content.