Abstract
The energy transition toward greater electrification leads to incentives in public transportation fed by catenary-powered networks. In this context, emerging technological devices such as in-motion-charging vehicles and electric vehicle charging points are expected to be operated while connected to trolleybus networks as part of new electrification projects, resulting in a significant demand for power. To enable a significant increase in electric transportation without compromising technical compliance for voltage and current at grid systems, the implementation of stationary battery energy storage systems (BESSs) can be essential for new electrification projects. A key challenge for BESSs is the selection of the optimal converter topology for charging their batteries. Ideally, the chosen converter should offer the highest efficiency while minimizing size, weight, and cost. In this context, a modular dual-active-bridge converter, considering its operation as a full-power converter (FPC) and a partial-power converter (PPC) with module-shedding control, is analyzed in terms of operation efficiencies and thermal behavior. The goal is to clarify the advantages, disadvantages, challenges, and trade-offs of both power-processing techniques following future trends in the electric transportation sector. The results indicate that the PPC achieves an efficiency of 98.58% at the full load of 100 kW, which is 1.19% higher than that of FPC. Additionally, higher power density and cost effectiveness are confirmed for the PPC.
1. Introduction
In European cities, the goal of reducing dependence on fossil fuels and adopting electrified transport systems is being achieved through the construction and modernization of catenary-powered public transport systems, which include trolleybus systems and rail transit systems such as trams, metros, and railways. As part of this global modernization effort, cities are designing catenary-powered transportation systems as an infrastructure capable of accommodating in-motion-charging (IMC) vehicles, electric vehicles (EVs) charging points, and renewable energy sources (RESs). Examples of manuscripts addressing EV integration into trolleybus networks can be found in [,,,,], into railway systems in [,,], and into tramways in []. The incorporation of RESs in the substation through a power converter is explored in [,,,]. Research on IMC vehicle implementation is presented in [,,].
The integration of these technologies can introduce technical challenges for the catenary network infrastructure. On one hand, the insertion of new loads into the grid can cause high voltage drops at vulnerable points, particularly at points far from substations. On the other hand, the integration of photovoltaic RES-based generators can cause power surpluses at certain times, resulting in high voltage levels that exceed technical compliance. To mitigate both issues, the use of stationary battery energy storage systems (BESSs) to regulate voltage levels presents a viable solution []. BESSs are connected to the trolleybus network using DC/DC converters, as per Figure 1, which are typically modeled as fully processed devices, where all the energy passes through the converter. However, in high-power scenarios, full-power converters (FPCs) must process the whole input power, requiring bulky magnetic components and high-blocking-voltage switching devices, which pose challenges in improving system efficiency, power density, and cost. In contrast, partial-power-processing (PPP) architectures handle only a fraction of the total power []. This approach takes advantage of specific topologies that allow the majority of the power to flow directly from the input to the output, bypassing the converter, while just a fraction of the power is processed by the converter’s active components. This approach significantly reduces the voltage and current stress on the partial-power converters (PPCs), leading to substantial improvements in system size, cost, and overall efficiency [,,,].
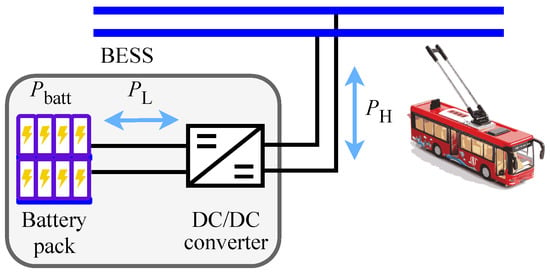
Figure 1.
Diagram of a BESS connected to the trolleybus grid line. is the battery power. and are the power in the high- and low-voltage sides, respectively.
In PPP, traditional isolated converters can be employed by optimizing the architecture to achieve efficient power conversion []. Among various isolated converters, the dual-active-bridge (DAB) converter is one of the most widely used topologies due to its symmetrical structure and bidirectional power flow capability. Additionally, it supports a simple modulation technique, single phase shift (SPS) []. Under appropriate load conditions, SPS enables soft switching by adjusting the phase-shift value between the full-bridge switches connected to the transformer without requiring additional circuitry [,].
In this context, this paper proposes the DAB-based partial-power-processing and full-power-processing converter for BESSs connecting to trolleybus grid networks. Comparisons with full-power-processed DAB converters are carried out to examine efficiency, the size of magnetic components, and cost, and the advantages of the partial-power-processing converter have been validated under the real voltage distribution from the trolleybus power grid of Bologna, Italy. This paper demonstrates that (a) the PPC processes lower power compared to the FPC, reducing the size of magnetic components; (b) the PPP configuration achieves high efficiency, comparable to the performance of FPP; and (c) PPP exhibits higher power density and offers greater cost-effectiveness.
The rest of the manuscript is organized as follows: A background on DAB-based FPP and PPP is provided in Section 2. Section 3 presents the technical requirements for trolleybus charging, and Section 4 introduces the design parameters of the FPC and PPC and the switching devices’ thermal network design. A performance evaluation of FPP and PPP is provided in Section 5. Finally, conclusions are drawn in Section 6.
2. DAB-Based Full- and Partial-Power Processing
2.1. DAB-Based Full-Power Processing
In this subsection, the background on the conventional FPP operations of the DAB is discussed. As visible from Figure 2 (top), under FPP operations, the converter processes the whole-system power leading to and . and represent the total input and output power of the system, while and denote the input and output power processed by the converter. This leads to the trivial conclusion that the system efficiency is equivalent to the FPC efficiency as per the following illustration:
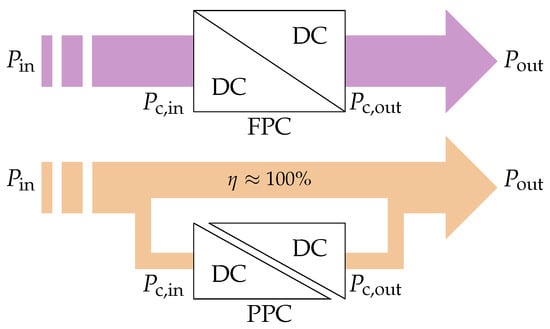
Figure 2.
Power flow under FPP (top) and PPP (bottom) operations.
For the sake of simplicity, in this manuscript, the sole SPS modulation technique is considered []. The primary and secondary bridges are cross-modulated to achieve square-wave voltages on both ends of the high-frequency transformer. By playing with the time delay between primary and secondary voltages, it is possible to regulate the power processed by the FPC as per [] the following:
where n is the transformer’s turns ratio, L is the leakage inductance, is the switching frequency, and d is the phase-shift value, where d is [−0.25; 0.25] []. On the other hand, and are the voltages at the primary and secondary DC links, respectively.
2.2. DAB-Based Partial-Power Processing
Unlike FPP, whose power converter processes the whole-system power, under PPP operations, the PPC processes only a portion of the system power; see Figure 2 (bottom). This is possible thanks to the high-efficiency link that theoretically transfers a portion of the power from input to output with virtually no losses. Real implementation always presents some losses related to this high-efficiency link due to the line impedance. Nevertheless, such losses can be considered negligible if compared with the ones related to the converter [].
Different from FPP, the power processed by the PPC is a fraction of the system power . In fact, it is possible to define the processed power ratio as
Considering (3), the overall efficiency of PPP, becomes
where the represents the efficiency of the PPC. It is evident that as long as the processed power ratio remains low enough, the overall system efficiency can be improved. Clearly, by setting , (4) reverts to the FPP case (1).
2.2.1. Input-Series–Output-Parallel Architecture
As showcased in (4), PPP’s capability to improve system efficiency is strictly related to the processed power ratio . It turns out that such a ratio is strictly related to the PPP architecture []. In this manuscript, the input-series–output-parallel (ISOP) architecture displayed in Figure 3 was deemed to be optimal in virtue of its step-down behavior. As the name suggests, the input and output connections resemble an input-series and output-parallel configuration; thus, the system and the PPC share the same input current and output voltage [].

Figure 3.
Schematic representation of the ISOP architecture.
According to the Kirchhoff laws and according to Figure 3 notation, the voltage and current through the PPC are given by
leading to the processed power ratio of
The more the input and output voltages are similar, the smaller becomes. Theoretically, if , the PPC processes no power.
2.2.2. DAB-Based Partial-Power Processing
Considerations related to ISOP configuration hold for any converter topology as long as a galvanic isolation between input and output is available. In this regard and to enable a fair comparison with the discussion provided in Section 2.1, the DAB-based implementation shown in Figure 4 has been considered.
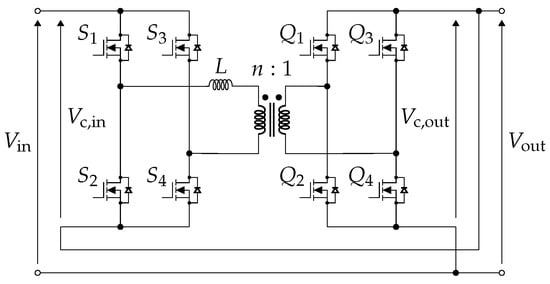
Figure 4.
DAB-based ISOP configuration.
The ISOP configuration does not change the operating principle of the DAB converter. Therefore, the conventional SPS modulation technique discussed in Section 2.1 remains applicable. Based on (5) and (6), the power processed by the PPP system can be expressed as
leading to a formulation equivalent to that of the FPP; see (2). The equivalence between (2) and (7) represents a non-trivial original theoretical outcome that can simplify the feedback loop definition (e.g., voltage and current transducers), control feedforward variable selection, and potentially transfer inductance L custom design. In fact, the partial- or full-power-processing characteristic can be defined later in time or even changed (i.e., retrofitting an FPP system with a PPP one and vice versa) without affecting converter auxiliaries and magnetics.
3. Technical Requirements
To compare the performance of FPP and PPP during BESS discharging operation, the trolleybus network of Bologna, Italy, is considered. Specifically, the Marconi–Trento–Trieste (MTT) feeding section (FS) visible in Figure 5 and previously discussed in [,] has been deemed to be relevant. Traction substation (TS) Trento e Trieste (TT) supplies power from the right side, while TS Marconi (M) supplies power from the left. Trolleybuses operating within the MTT FS depart near TS M, travel along the southern edge of the section, and terminate close to TS TT, covering a distance of 2200 m. The return journey follows the northern side for approximately 2500 m. The BESS is installed 900 m away from TS TT [].
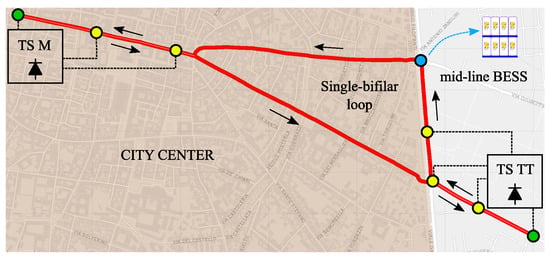
Figure 5.
Marconi–Trento e Trieste trolleybus feeding section with BESS.
3.1. Control Transfer Characteristic
According to international standards like the EN 50163 [], the trolleybus power grid is supplied with a rated voltage of 750 V at the substations. On the other hand, the line voltages can swing according to power absorption and regenerative braking. In any case, voltages are always bounded within V. In this work, the BESS operates with a constant voltage of 500 V, and its control trans-characteristics are modeled following the approach in []. Only the discharging condition is considered, meaning the BESS activates only when the line voltage drops below the threshold voltage. In this case, the discharge threshold is set to 650 V, above which the BESS remains inactive. Based on these parameters, the relationship between the converter input current and line voltage is illustrated in Figure 6 (left), demonstrating the BESS’s behavior in the trolleybus grid. For the sake of clarity, the current injected by the BESS is represented as a positive value in this study.

Figure 6.
Control trans-characteristic (left) and processed power (right).
Accordingly, the power processed by the BESS under FPC and PPC as a function of line voltage is shown in Figure 6 (right). The orange line represents the power processed by the FPC, which is also equal to the total system power. It is evident that the lower the line voltage, the higher the power that the BESS is required to deliver. The purple line represents the power processed by the PPC, and the system power processed by the PPP is the same as that of FPP. This demonstrates that for the same system power output, the PPC handles only a fraction of the power processed by the FPC.
3.2. Voltage and Power Mission Profile
The voltage profile at the grid point nearest to the BESS is used to evaluate the performance of both FPP and PPP, as illustrated in Figure 7 (left), which was obtained from a simulation that mimics the one-day operation of a trolleybus system, with a time discretization of 1 second []. With the high-precision simulation, the trolleybus network, vehicle dynamics, and also the different driving cycles of several trolleybuses throughout the day have been considered. This simulation procedure was verified using measurements collected from the TS-TT system [].

Figure 7.
The real one-day mission profiles from the Bologna trolleybus network of input voltage (left) and power (right).
For the trans-characteristics presented in Figure 6, the corresponding power profile of the converter is depicted in Figure 7 (right). To further analyze the operational range of the converter in terms of voltage and power, the probability distribution functions (PDFs) in the BESS activation period are examined, as shown in Figure 8. Figure 8 (left) illustrates the PDFs of the input voltage profile. The probability significantly increases from 630 V, with 96.33% of the input voltage occurring between 630 V and 650 V, which corresponds to a low-power-operation region. As shown in Figure 8 (right), the power is widely distributed under 40 kW. However, the mission profiles indicate that during certain time intervals, the line voltage can transiently drop to close to 600 V, with the corresponding power approaching 100 kW. Therefore, to ensure the reliability and safety of the system, the converter must not only be optimized for high efficiency under nominal conditions, but it must also be capable of handling short-duration power overloads.

Figure 8.
Probability distribution functions of input voltage profile (left) and power profile (right).
4. DAB-Based FPC and PPC Design
With reference to the BESS working characteristics and trolleybus grid mission profiles discussed in Section 3, a four-module DAB structure was selected to handle a 100 kW rated power. The module-shedding control is implemented to enhance the system’s adaptability, which can also improve the system’s overall efficiency while maintaining the capability to process high power when the trolleybus grid has a significant voltage drop [].
4.1. Design Parameters for FPC and PPC
In this case, DAB converters were designed considering a fixed switching frequency of 20 kHz, a maximum phase-shift value d of 0.15, and transformer turn ratios n to enable full-range zero-voltage switching commutation in case of line voltages of 750 V. With conservative and future-proof designs in mind, leakage inductance was sized assuming that it will work at a full charging power, a minimum line voltage, and a maximum processed power ratio. Both FPP and PPP employ four modules in parallel, and the PPC handles the maximum power of only 15.8 kW. The operational parameters of the converters are shown in Table 1.

Table 1.
Main parameters of DAB-based converters.
To select the optimal switching devices, switch ampacity was computed by taking advantage of the formulation introduced in [], considering the worst-case scenarios of a 600 V input voltage. The main parameters of the selected MOSFETs are summarized in Table 2. It is worth pointing out that both primary side switches of FPC and PPC are rated at 1200 V to ensure safe operation under all conditions, particularly to withstand the maximum line voltage of 1000 V.

Table 2.
Main parameters of the selected MOSFETs.
The core parameters of the transformer designed for both FPP and PPP are presented in Table 3. The design process follows the high-frequency transformer design steps for DAB converters introduced in []. In this work, the design criteria consider the magnetizing maximum inductance to keep the magnetizing current below 2% of the rated current, while maintaining a maximum flux density below 0.2 T. Based on these requirements, the N97 ferrite E-shape cores are selected as the transformer core material for this application.

Table 3.
Main parameters of the selected cores for transformers.
4.2. Switching Devices’ Thermal Network Design
A comprehensive loss assessment of switching devices requires the consideration of the cooling system design, as this defines the electrical and efficiency behavior for the system. The applied loss evaluation method relies on the component thermal description in the form of look-up tables (LUTs) generated from datasheet information. This procedure allows for taking into account the actual voltage, power, and junction temperature along the mission profile []. Simulations for one module are performed in MATLAB (release r2024b) with the switches’ thermal descriptions across various operating conditions, including power level from 0 kW to 25 kW, output voltages ranging from 500 V to 750 V, and junction temperatures from 25 °C to 180 °C. These simulations generated 3D LUTs to characterize losses as functions of power, output voltage, and junction temperature.
In this design, the Cauer RC thermal network is employed. Each half-bridge (i.e., two devices in total) is equipped with an individual heatsink, so the thermal chain of each half-bridge includes two parallel junction-to-case () and case-to-heatsink () configurations, as well as a series heatsink-to-ambient thermal impedance () configuration. Therefore, a device’s steady-state loss can be found using
where and are the power loss and junction temperature of a single switching device, respectively. , , and represent the thermal resistances.
is derived from MOSFET datasheets, as shown in Table 4. The thermal interface material resistance is evaluated, as it depends on the specific device dimensions and materials, while the heatsink-to-ambient thermal resistances are calculated according to (8) to ensure safe junction temperatures under full-load conditions, where the value of can be derived from the LUTs. This maintains device operation within the allowable temperature range of 100 °C under an ambient temperature of 25 °C. The corresponding values are provided in Table 5.

Table 4.
Cauer thermal parameters of selected MOSFETs.

Table 5.
Cauer thermal parameters from case to ambient.
5. Numerical Performance Assessment
In this section, the component losses and system efficiencies are examined to determine suitable considerations for the performance evaluation of the FPP and PPP.
5.1. Switching Loss Analysis
With reference to the DAB working parameters and thermal network design discussed in Section 4.1 and Section 4.2, Figure 9 and Figure 10 illustrate the calculated switching device losses of a single DAB-based converter according to (8), considering conduction loss, switching loss, and a 20 W additional loss per module due to the driving, cooling, and auxiliary circuits. The modules operate within a system power range of 0–25 kW, an input voltage range of 600–650 V, and an ambient temperature of 25 °C.
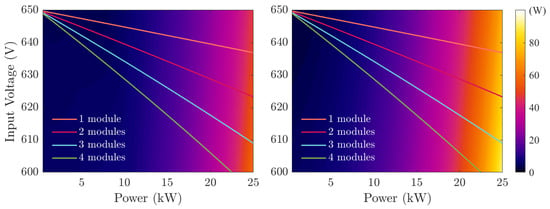
Figure 9.
Switching loss color map with the function of the system power and input voltage of the primary side (left) and secondary side (right) in FPCunder a 25 °C ambient temperature. The solid lines represent the single converter’s operating conditions with different numbers of working modules, with 1, 2, 3, and 4 modules corresponding to the system power ranges of 0–25 kW, 0–50 kW, 0–75 kW, and 0–100 kW, respectively.
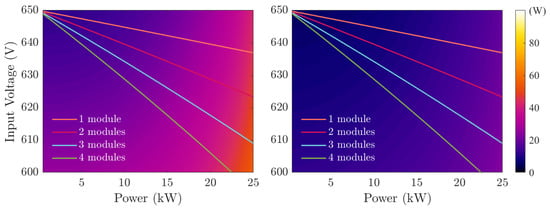
Figure 10.
Switching loss color map with the function of the system power and input voltage of the primary side (left) and secondary side (right) in PPC under a 25 °C ambient temperature. The solid lines represent the single converter’s operating conditions with different numbers of working modules, with 1, 2, 3, and 4 modules corresponding to the system power ranges of 0–25 kW, 0–50 kW, 0–75 kW, and 0–100 kW, respectively.
Figure 9 shows the switching loss (i.e., commutation and conduction losses) map of a single MOSFET on the primary and secondary sides, respectively. For the same system power and voltage operating conditions, the losses on the secondary side are observed to be higher than the primary side. In fact, the secondary side works in the low-voltage scenario, which typically results in higher current levels and, consequently, greater losses. The solid lines represent the voltage and system power levels of a single converter with a different number of active modules. With the rated power limit of one module, the one-, two-, three-, and four-module structures correspond to the system power ranges of 0–25 kW, 0–50 kW, 0–75 kW, and 0–100 kW, respectively. With respect to Figure 6, the system power increases as the input voltage decreases, leading to a higher number of active modules. As shown in the loss map, at the same input voltage level, the power processed by each module decreases as more modules are in parallel, resulting in significantly lower losses per module.
The loss performance on both sides of PPC is depicted in Figure 10. With reference to (5) and the defined operating parameters, the primary side of the PPC is the low-voltage side. As a result, the switching devices on the primary side experience higher losses compared to those on the secondary side. The solid lines represent the same cases as shown in Figure 9. It can be observed that in the high-voltage region, which corresponds to low system power, the losses per module are comparable regardless of the number of working modules. Therefore, increasing the number of modules at high voltage levels can lead to higher overall system losses, indicating low system efficiency. In contrast, in the low-voltage region, adding more modules in parallel helps reduce the losses of each individual module, potentially improving the global efficiency in this condition.
When comparing the FPC and PPC, it is evident that in the high-system-power region, specifically above 15 kW, the switching losses of FPC are significantly higher than those of PPC. In the low-system-power region, the losses of FPC remain insensitive to the variations in the input voltage. However, in the PPC, the losses increase as voltage decreases, and particularly when the voltage drops below 650 V, the loss performance of PPC can even exceed that of FPC.
5.2. Transformer Loss Analysis
Transformer losses are also key factors affecting system efficiency, which will be analyzed in this subsection. The losses are divided into ferromagnetic core loss and copper loss. For the sake of simplification, the loss in the ferromagnetic core is calculated using the Steinmetz equation:
where represents the maximum flux density in the core. In DAB converters, is primarily influenced by the input voltage on the primary side, the switching frequency , and the core parameters []. k, , and are coefficients that are determined by the type of core material. For example, the values for the N97 material in this case are 61, 1.08, and 2.13, which are obtained from the loss curves provided in the datasheet by the TDK manufacturer []. The core volume can also be obtained from the datasheet.
On the other hand, the copper loss is calculated using
where and are the RMS currents on the primary and secondary sides of the transformer, respectively. and represent the resistance of the transformer windings.
With reference to the core selection shown in Table 3, Figure 11 and Figure 12 illustrate the distribution of core loss and copper loss with different system powers and voltage levels for both FPC and PPC. The solid lines show the single converter’s operating conditions with varying numbers of working modules, as depicted in Figure 9 and Figure 10.
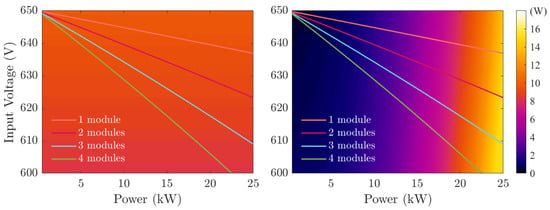
Figure 11.
Core loss (left) and copper loss (right) color map with the function of the system power and input voltage in FPC under a 25 °C ambient temperature. The solid lines represent the single converter’s operating conditions with different numbers of working modules, with 1, 2, 3, and 4 modules corresponding to the system power ranges of 0–25 kW, 0–50 kW, 0–75 kW, and 0–100 kW, respectively.
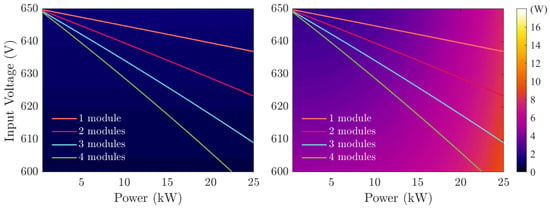
Figure 12.
Core loss (left) and copper loss (right) color map with the function of the system power and input voltage in PPC under a 25 °C ambient temperature. The solid lines represent the single converter’s operating conditions with different numbers of working modules, with 1, 2, 3, and 4 modules corresponding to the system power ranges of 0–25 kW, 0–50 kW, 0–75 kW, and 0–100 kW, respectively.
Figure 11 (left) and Figure 12 (left) show the core loss behavior of transformers in FPC and PPC, respectively. According to [], an increasing input voltage results in a higher , which leads to higher core loss as per the Steinmetz equation. In the ISOP configuration, the PPC exhibits a lower input voltage compared to FPC, which is the main reason for the core loss being significantly lower than that in FPC. In both figures, the variation in core loss is small across the displayed voltage and system power range. As indicated by the path of solid lines, the core loss per module has minor differences regardless of the number of active modules, which leads to a higher total core loss of the system with increasing module numbers.
Regarding copper loss, it mainly depends on the current through the transformer windings, as indicated in (10). Copper loss will rise with increasing power. According to Table 1, the maximum power processed by PPC is only 15.8% of FPC. Furthermore, given that FPC and PPC work under the same output voltage conditions, PPC experiences a lower secondary-side current. This is the dominant contribution for minimizing the copper loss of PPC, as shown in Figure 11 (right) and Figure 12 (right). According to the solid lines in Figure 11, the copper loss of individual modules in FPC decreases as the number of parallel modules increases at the same voltage level. For PPP, the copper loss per module under high-voltage and low system-power conditions remains relatively unaffected by the module number, indicating that the high number of modules cannot contribute to the improvement in system efficiency. In contrast, under low-voltage and high-power conditions, adding modules can significantly reduce the copper loss per module.
5.3. Module-Shedding Analysis
Based on the loss analysis in Section 5.1 and Section 5.2, the different numbers of operating modules have varying impacts on the different types of losses. Therefore, the overall effect on the system losses requires further investigation. This subsection will consider both switching devices and transformer losses under different parallel module number cases, aiming to provide guidance for optimizing the system efficiency using module-shedding control, as indicated in [].
Global efficiency, varying according to the number of active modules under all possible voltage and corresponding power working conditions, is presented in Figure 13, where the losses for switching devices and transformers under each condition are obtained from Figure 9, Figure 10, Figure 11 and Figure 12. As depicted in Figure 13, the intersection points of each curve indicate the optimal load-switching thresholds, where the system’s efficiency improves by adding or dropping a module. It is worth noting that the conventional module shedding presented in [] shows the efficiency performance under different numbers of modules based on a fixed voltage with varying power levels, where the maximum system efficiency remains the same in all cases, and the intersection point values can be calculated according to the power at the peak efficiency and the number of operating modules. However, in this research, as shown in Figure 6, the power processed by the system is highly correlated with the input voltage. Therefore, the efficiency curves with different numbers of operating modules are presented with corresponding input voltage and power values, which deviate from the conventional rules observed in traditional module-shedding approaches. Based on this analysis, an LUT for the required number of active modules as a function of power or input voltage is derived.
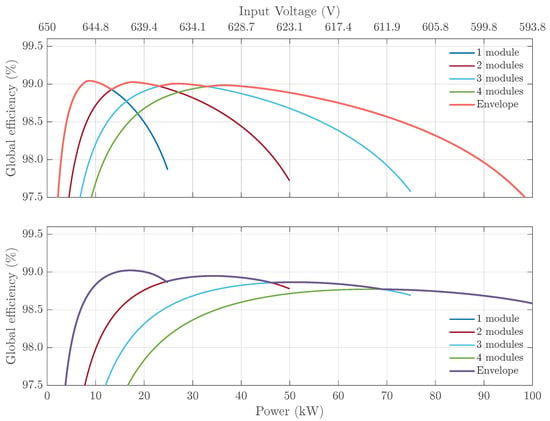
Figure 13.
Global efficiency curve of modular DAB-based FPP (top) and PPP (bottom) with module-shedding control.
The overall efficiency comparison of FPP and PPP with module shedding is presented in Figure 14. It can be seen that when the trolleybus grid voltage is above approximately 645 V, the efficiency of FPP is higher than PPP. In the intermediate voltage range of approximately 620 V to 645 V, both FPP and PPP exhibit comparable efficiency. When the input voltage drops below 620 V, PPP demonstrates an obvious advantage.
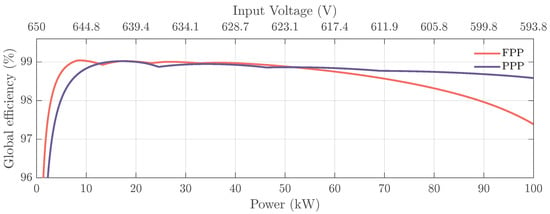
Figure 14.
Global efficiency comparison of FPP and PPP.
5.4. Efficiency and Cost Analysis
Based on the efficiency and cost analysis in Section 4.1 and Section 5.3, the key results are summarized in Table 6. The maximum efficiencies of FPP and PPP are 99.04% and 99.02%, respectively, occurring at input voltages of 645.5 V and 641.1 V. To show the merits of describing the overall efficiency, weighted efficiencies are computed on the voltage PDF given in Figure 8. The weighted efficiencies of FPP and PPP are 97.73% and 97.10%, respectively. PPP demonstrates great performance in the high-power range, achieving an efficiency of 98.58% at full load, which is 1.19% higher than that of FPP. Furthermore, the values of specific cost in both the PPC and FPC configurations are calculated based on the total cost of switching devices and transformer cores. The specific cost of the system for FPP is 8.22 €/kW, which is 29.57% higher than that of PPP at 6.34 €/kW.

Table 6.
Efficiency and cost assessment for FPP and PPP systems.
Therefore, FPP and PPP have comparable efficiency performances, and PPP offers a more cost-effective solution. It is also worth noting that the core volume used in PPC, as shown in Table 3, is only 72% of that used in FPP, which means that PPP can provide a higher power density. There are clear advantages of PPP in terms of cost and volume. The Pareto fronts for system efficiency, cost, and power density presented in [] reveal that the system efficiency can be improved by reducing power density and increasing the cost of the components. In this paper, although PPP demonstrates a comparable weighted efficiency to FPP, as well as a lower efficiency under light loads, it can potentially allow for the use of higher-performance and more expensive components in its design, further reducing losses and improving the overall efficiency due to the room for further designs made available by better power densities and costs.
6. Conclusions
DAB-based full-power- and partial-power-processing topologies have been evaluated when integrating BESSs into trolleybus grid lines in order to compensate for voltage drops. Considering the real voltage and power mission profiles from the Bologna trolleybus system, both architectures were assessed in terms of converter design, thermal behavior, efficiency, and cost. This paper confirms that PPC processes only a fraction of the total system power, significantly reducing the size of magnetic components and the overall converter cost, while still maintaining a comparable efficiency with FPC. The thermal network and loss assessment show that PPP reduces the core loss thanks to the lower voltage stress but increases the switching losses under low-voltage conditions. Specifically, PPP achieves a full-load efficiency of 98.58%, which is 1.19% higher than that of FPP, and the weighted efficiency of FPP of 97.73% remains slightly higher than the 97.10% efficiency of PPP based on a one-day profile. On the other hand, the transformer core volume and specific cost of PPP are 72.08% and 77.18% compared to those of FPP, respectively, indicating a higher power density and more cost-effective solutions. In conclusion, the DAB-based PPP has potential in the application of BESS integration into trolleybus grid networks, especially in the power density- and cost-dominated scenarios.
In this paper, the study focused on steady-state loss distribution and efficiency performance, and aspects such as BESS charging scenarios or the dynamic response of the network during periods of intensive energy regeneration were not considered. However, these are key factors that can influence system-level performance. Future work can extend the analysis to BESS charging periods and the dynamic performance of the system. The bidirectional power operation and different DAB modulation techniques are still areas that should be studied.
Author Contributions
Conceptualization, J.G., R.F.P. and R.M.; methodology, M.R., V.M., S.W. and R.M.; software, J.G., R.F.P. and S.B.; validation, J.G., R.F.P. and R.M.; formal analysis, M.R., V.M., S.W. and R.M.; investigation, J.G., R.F.P. and R.M.; resources, J.G., R.F.P. and S.B.; data curation, J.G., R.F.P., S.B. and R.M.; writing—original draft preparation, J.G., R.F.P., S.B., M.R., V.M., S.W. and R.M.; writing—review and editing, J.G., R.F.P., S.B., M.R., V.M., S.W. and R.M.; visualization, J.G., R.F.P. and S.B.; supervision, M.R. and R.M.; project administration, M.R. and R.M.; funding acquisition, M.R. All authors have read and agreed to the published version of the manuscript.
Funding
This research was funded by the European Union—NextGenerationEU under the National Recovery and Resilience Plan (PNRR)—Mission 4 Education and Research—Component 2 From Research to Business—Investment 1.1, Notice PRIN 2022—(DD N.104 del 2/2/2022), title ‘Smart Electric traNsport systems for Sustainable Urban Mobility (SENSUM)’, proposal code 20227PF9CC—CUP J53C24002680006.
Data Availability Statement
The dataset is available upon request from the authors.
Conflicts of Interest
The authors declare no conflicts of interest.
References
- Weisbach, M.; Schneider, T.; Maune, D.; Fechtner, H.; Spaeth, U.; Wegener, R.; Soter, S.; Schmuelling, B. Intelligent Multi-Vehicle DC/DC Charging Station Powered by a Trolley Bus Catenary Grid. Energies 2021, 14, 8399. [Google Scholar] [CrossRef]
- Van der Horst, K.; Diab, I.; Mouli, G.R.C.; Bauer, P. Methods for increasing the potential of integration of EV chargers into the DC catenary of electric transport grids: A trolleygrid case study. eTransportation 2023, 18, 100271. [Google Scholar] [CrossRef]
- Bartłomiejczyk, M.; Jarzebowicz, L.; Hrbáč, R. Application of Traction Supply System for Charging Electric Cars. Energies 2022, 15, 1448. [Google Scholar] [CrossRef]
- Lukianov, M.; Romero-Cadaval, E.; Kasprowicz, A.; Husev, O.; Strzelecki, R. Scalable Multiport DC-DC Converter for Bidirectional EV Charging in DC Traction Grids. IEEE Trans. Circuits Syst. II Express Briefs 2025, 72, 968–972. [Google Scholar] [CrossRef]
- Lukianov, M.; Cadaval, E.R.; Matiushkin, O.; Strzelecki, R. Traction powered multiport DC-DC converter for bidirectional EV charging application—HIL simulation results. In Proceedings of the 2025 IEEE 19th International Conference on Compatibility, Power Electronics and Power Engineering (CPE-POWERENG), Antalya, Türkiye, 20–22 May 2025; pp. 1–6. [Google Scholar] [CrossRef]
- Brenna, M.; Longo, M.; Yaïci, W. Modelling and Simulation of Electric Vehicle Fast Charging Stations Driven by High Speed Railway Systems. Energies 2017, 10, 1268. [Google Scholar] [CrossRef]
- Fernández-Rodríguez, A.; Fernández-Cardador, A.; Cucala, A.P.; Falvo, M.C. Energy Efficiency and Integration of Urban Electrical Transport Systems: EVs and Metro-Trains of Two Real European Lines. Energies 2019, 12, 366. [Google Scholar] [CrossRef]
- Hajian, M.; Tricoli, P. A Mixed 1-phase and 3-phase Vehicle Charging System from AC Rail Traction Power Network. In Proceedings of the 2021 IEEE 15th International Conference on Compatibility, Power Electronics and Power Engineering (CPE-POWERENG), Florence, Italy, 14–16 July 2021; pp. 1–6. [Google Scholar] [CrossRef]
- Zhang, T.; Zhao, R.; Ballantyne, E.E.; Stone, D. Increasing urban tram system efficiency, with battery storage and electric vehicle charging. Transp. Res. D Transp. Environ. 2020, 80, 102254. [Google Scholar] [CrossRef]
- Diab, I.; Saffirio, A.; Chandra-Mouli, G.R.; Bauer, P. A simple method for sizing and estimating the performance of PV systems in trolleybus grids. J. Clean. Prod. 2023, 384, 135623. [Google Scholar] [CrossRef]
- Diab, I.; Scheurwater, B.; Saffirio, A.; Chandra-Mouli, G.R.; Bauer, P. Placement and sizing of solar PV and Wind systems in trolleybus grids. J. Clean. Prod. 2022, 352, 131533. [Google Scholar] [CrossRef]
- Bartłomiejczyk, M. Potential Application of Solar Energy Systems for Electrified Urban Transportation Systems. Energies 2018, 11, 954. [Google Scholar] [CrossRef]
- Cano, A.; Arévalo, P.; Benavides, D.; Jurado, F. Sustainable tramway, techno-economic analysis and environmental effects in an urban public transport. A comparative study. Sustain. Energy Grids Netw. 2021, 26, 100462. [Google Scholar] [CrossRef]
- Paternost, R.F.; Mandrioli, R.; Cirimele, V.; Ricco, M.; Grandi, G. Solutions for Retrofitting Catenary-Powered Transportation Systems Toward Greater Electrification in Smart Cities. Smart Cities 2024, 7, 3853–3870. [Google Scholar] [CrossRef]
- Paternost, R.F.P.; Diab, I.; Mouli, G.R.C.; Ricco, M.; Bauer, P.; Grandi, G. Stationary Energy Storage Solutions and Power Management for Bus Fleet Electrification in Congested Grid Areas. IEEE Access 2024, 12, 140211–140222. [Google Scholar] [CrossRef]
- Paternost, R.F.; Mandrioli, R.; Barbone, R.; Ricco, M.; Cirimele, V.; Grandi, G. Catenary-Powered Electric Traction Network Modeling: A Data-Driven Analysis for Trolleybus System Simulation. World Electr. Veh. J. 2022, 13, 169. [Google Scholar] [CrossRef]
- Stoian, A.V.; Geng, J.; Baldisserri, S.; Tiburtini, F.M.; Ricco, M.; Mandrioli, R. Performance Evaluation of DAB-Based Partial Power Processing for In-Motion-Charging Trolleybuses. In Proceedings of the 2025 IEEE 19th International Conference on Compatibility, Power Electronics and Power Engineering (CPE-POWERENG), Antalya, Türkiye, 20–22 May 2025; pp. 1–6. [Google Scholar] [CrossRef]
- Kwon, Y.D.; Freijedo, F.D.; Wijekoon, T.; Liserre, M. Series Resonant Converter-Based Full-Bridge DC–DC Partial Power Converter for Solar PV. IEEE J. Emerg. Sel. Top. Power Electron. 2024, 12, 1719–1729. [Google Scholar] [CrossRef]
- Kwon, Y.D.; Freijedo, F.D.; Wijekoon, T.; Liserre, M. A Multiport Partial Power Converter for Smart Home Applications. IEEE Trans. Power Electron. 2024, 39, 8824–8833. [Google Scholar] [CrossRef]
- Anzola, J.; Aizpuru, I.; Romero, A.A.; Loiti, A.A.; Lopez-Erauskin, R.; Artal-Sevil, J.S.; Bernal, C. Review of Architectures Based on Partial Power Processing for DC-DC Applications. IEEE Access 2020, 8, 103405–103418. [Google Scholar] [CrossRef]
- Iyer, V.M.; Gulur, S.; Bhattacharya, S.; Ramabhadran, R. A Partial Power Converter Interface for Battery Energy Storage Integration with a DC Microgrid. In Proceedings of the IEEE Energy Conversion Congress and Exposition (ECCE), Baltimore, MD, USA, 29 September–3 October 2019; pp. 5783–5790. [Google Scholar] [CrossRef]
- Song, H.; Xu, R.; Gao, S.; Wang, Y.; Xu, D. A high-frequency Dual Active Bridge Converter with Partial Power Processing. In Proceedings of the 2022 IEEE International Power Electronics and Application Conference and Exposition (PEAC), Guangzhou, China, 4–7 November 2022; pp. 258–263. [Google Scholar] [CrossRef]
- De Doncker, R.; Divan, D.; Kheraluwala, M. A three-phase soft-switched high power density DC/DC converter for high power applications. In Proceedings of the Conference Record of the 1988 IEEE Industry Applications Society Annual Meeting, Pittsburgh, PA, USA, 2–7 October 1988; Volume 1, pp. 796–805. [Google Scholar] [CrossRef]
- Pittala, L.K.; Barbone, R.; Mandrioli, R.; Cirimele, V.; Ricco, M.; Grandi, G. Insights on DAB Converter with Auxiliary Inductors. In Proceedings of the 2023 International Conference on Clean Electrical Power (ICCEP), Terrasini, Italy, 27–29 June 2023; pp. 458–463. [Google Scholar] [CrossRef]
- Carvalho, E.L.; Chub, A.; Hassanpour, N.; Blinov, A.; Rathore, A.K.; Vinnikov, D. P3R: Partial Power Postregulated Grid-Forming Converter for Prosumer DC Buildings. IEEE Trans. Ind. Electron. 2025, 72, 1628–1637. [Google Scholar] [CrossRef]
- De Doncker, R.; Divan, D.; Kheraluwala, M. A three-phase soft-switched high-power-density DC/DC converter for high-power applications. IEEE Trans. Ind. Appl. 1991, 27, 63–73. [Google Scholar] [CrossRef]
- Rojas, J.; Renaudineau, H.; Kouro, S.; Rivera, S. Partial power DC-DC converter for electric vehicle fast charging stations. In Proceedings of the IECON 2017—43rd Annual Conference of the IEEE Industrial Electronics Society, Beijing, China, 29 October–1 November 2017; pp. 5274–5279. [Google Scholar] [CrossRef]
- dos Santos, N.G.F.; Zientarski, J.R.R.; Martins, M.L.d.S. A Review of Series-Connected Partial Power Converters for DC–DC Applications. IEEE J. Emerg. Sel. Top. Power Electron. 2022, 10, 7825–7838. [Google Scholar] [CrossRef]
- EN 50163:2004+A2:2020; Railway Applications—Supply Voltages of Traction Systems. CENELEC: Brussels, Belgium, 2020.
- Alharbi, M.A.; Alcaide, A.M.; Dahidah, M.; Montero-Robina, P.; Ethni, S.; Pickert, V.; Leon, J.I. Rotating Phase Shedding for Interleaved DC–DC Converter-Based EVs Fast DC Chargers. IEEE Trans. Power Electron. 2023, 38, 1901–1909. [Google Scholar] [CrossRef]
- Dey, S.; Chakraborty, S.S.; Singh, S.; Hatua, K. Design of High Frequency Transformer for a Dual Active Bridge (DAB) Converter. In Proceedings of the 2022 IEEE Global Conference on Computing, Power and Communication Technologies (GlobConPT), New Delhi, India, 23–25 September 2022; pp. 1–6. [Google Scholar] [CrossRef]
- Sangwongwanich, A.; Yang, Y.; Sera, D.; Blaabjerg, F. Lifetime Evaluation of Grid-Connected PV Inverters Considering Panel Degradation Rates and Installation Sites. IEEE Trans. Power Electron. 2018, 33, 1225–1236. [Google Scholar] [CrossRef]
- TDK Electronics. Ferrites and Accessories; Technical Report; TDK Electronics: Munich, Germany, 2013. [Google Scholar]
- Kolar, J.W.; Krismer, F.; Lobsiger, Y.; Muhlethaler, J.; Nussbaumer, T.; Minibock, J. Extreme efficiency power electronics. In Proceedings of the 2012 7th International Conference on Integrated Power Electronics Systems (CIPS), Nuremberg, Germany, 6–8 March 2012; pp. 1–22. [Google Scholar]
- Burkart, R.M.; Kolar, J.W. Comparative η– ρ– σ Pareto Optimization of Si and SiC Multilevel Dual-Active-Bridge Topologies with Wide Input Voltage Range. IEEE Trans. Power Electron. 2017, 32, 5258–5270. [Google Scholar] [CrossRef]
Disclaimer/Publisher’s Note: The statements, opinions and data contained in all publications are solely those of the individual author(s) and contributor(s) and not of MDPI and/or the editor(s). MDPI and/or the editor(s) disclaim responsibility for any injury to people or property resulting from any ideas, methods, instructions or products referred to in the content. |
© 2025 by the authors. Licensee MDPI, Basel, Switzerland. This article is an open access article distributed under the terms and conditions of the Creative Commons Attribution (CC BY) license (https://creativecommons.org/licenses/by/4.0/).