1. Introduction
In recent years, the increasing integration of wind farms into the power grid has brought the issue of broadband oscillation into sharp focus [
1]. During grid connection, the unique dynamic characteristics of power electronic devices often lead to frequent broadband oscillations [
2]. Unlike oscillations observed in synchronous generator-based systems, these phenomena are specific to inverter-dominated renewable energy systems and may result in equipment disconnection, control failure, and severe threats to grid stability [
3,
4]. As the proportion of renewable energy in modern power systems continues to rise, these challenges become increasingly pronounced. Therefore, accurately assessing and mitigating the risks associated with broadband oscillations in wind-integrated grids is essential for maintaining system security and reliability.
Impedance-based analysis has become a widely accepted technique for evaluating the small-signal and broadband stability of converter-based systems [
5]. By analyzing the source–load impedance interaction in the frequency domain, this approach allows for intuitive assessment of resonance conditions and control interactions. However, its effectiveness heavily relies on the availability of accurate impedance models for individual components within the power plant [
6,
7]. Existing impedance modeling methods can be generally categorized into white-box modeling and black/grey-box measurement approaches.
White-box modeling is based on the explicit mathematical description of converter dynamics, which requires full knowledge of the internal control structure and system parameters. For example, Zhou et al. [
8] proposed a deep reinforcement learning-based PMU placement method that reduces PMU count by 27.3% while maintaining observability, enabling improved system identification. Yan et al. [
9] developed a hybrid TimesNet–Autoformer model for oscillation source location, achieving over 90% accuracy on a 39-bus system. Wang et al. [
10] formulated a harmonic transfer function method for LCC-HVDC systems, with modeling errors below ±5% across 1–500 Hz. Other efforts have focused on modeling sub-synchronous impedance [
11,
12,
13], sequence impedance aggregation [
14,
15], and topology-based impedance networks. However, the practical application of white-box methods is constrained by the proprietary nature of commercial renewable energy equipment [
16,
17].
To overcome these limitations, black/grey-box methods estimate impedance from terminal voltage and current measurements. For example, Yu and Wang [
18] used high-frequency signal injection to identify dq-axis parameters in IPMSMs with sub-5% error across six operating conditions. Meng et al. [
19] used a neural network to model railway system impedance and predict resonance frequency shifts with less than 3% error. Despite their success, these methods rely on time-consuming frequency sweep tests and external excitation, which are not suitable for real-time operation [
20].
The increasing complexity of renewable-dominated systems has created a pressing need for scalable, non-intrusive, and data-adaptive impedance modeling approaches. As such, data-driven methods have emerged as promising alternatives. These approaches eliminate the need for physical modeling and offer improved flexibility for real-world applications. Diefenthäler et al. [
21] used ANNs to detect high-impedance faults with over 92% accuracy. Taghvaie et al. [
22] provided a thorough review of harmonic estimation techniques, highlighting the role of AI in data-driven impedance learning. Lu et al. [
23] introduced a physics-informed neural network for predicting the remaining life of power devices from impedance trends, achieving errors below 6%. Zhai et al. [
24] proposed a sensitivity-analysis-guided grey wolf optimizer to estimate PMSG parameters, reducing errors by 35% compared to PSO.
Nevertheless, most data-driven models treat impedance as a unified curve, overlooking its frequency-specific behavior. In practice, different frequency bands are dominated by different physical phenomena: low-frequency impedance is affected by grid and power-sharing interactions, while high-frequency behavior is shaped by inner-loop controls and filters. As such, a truly effective model must be frequency-aware, capable of adapting to both spectral and operating condition variations.
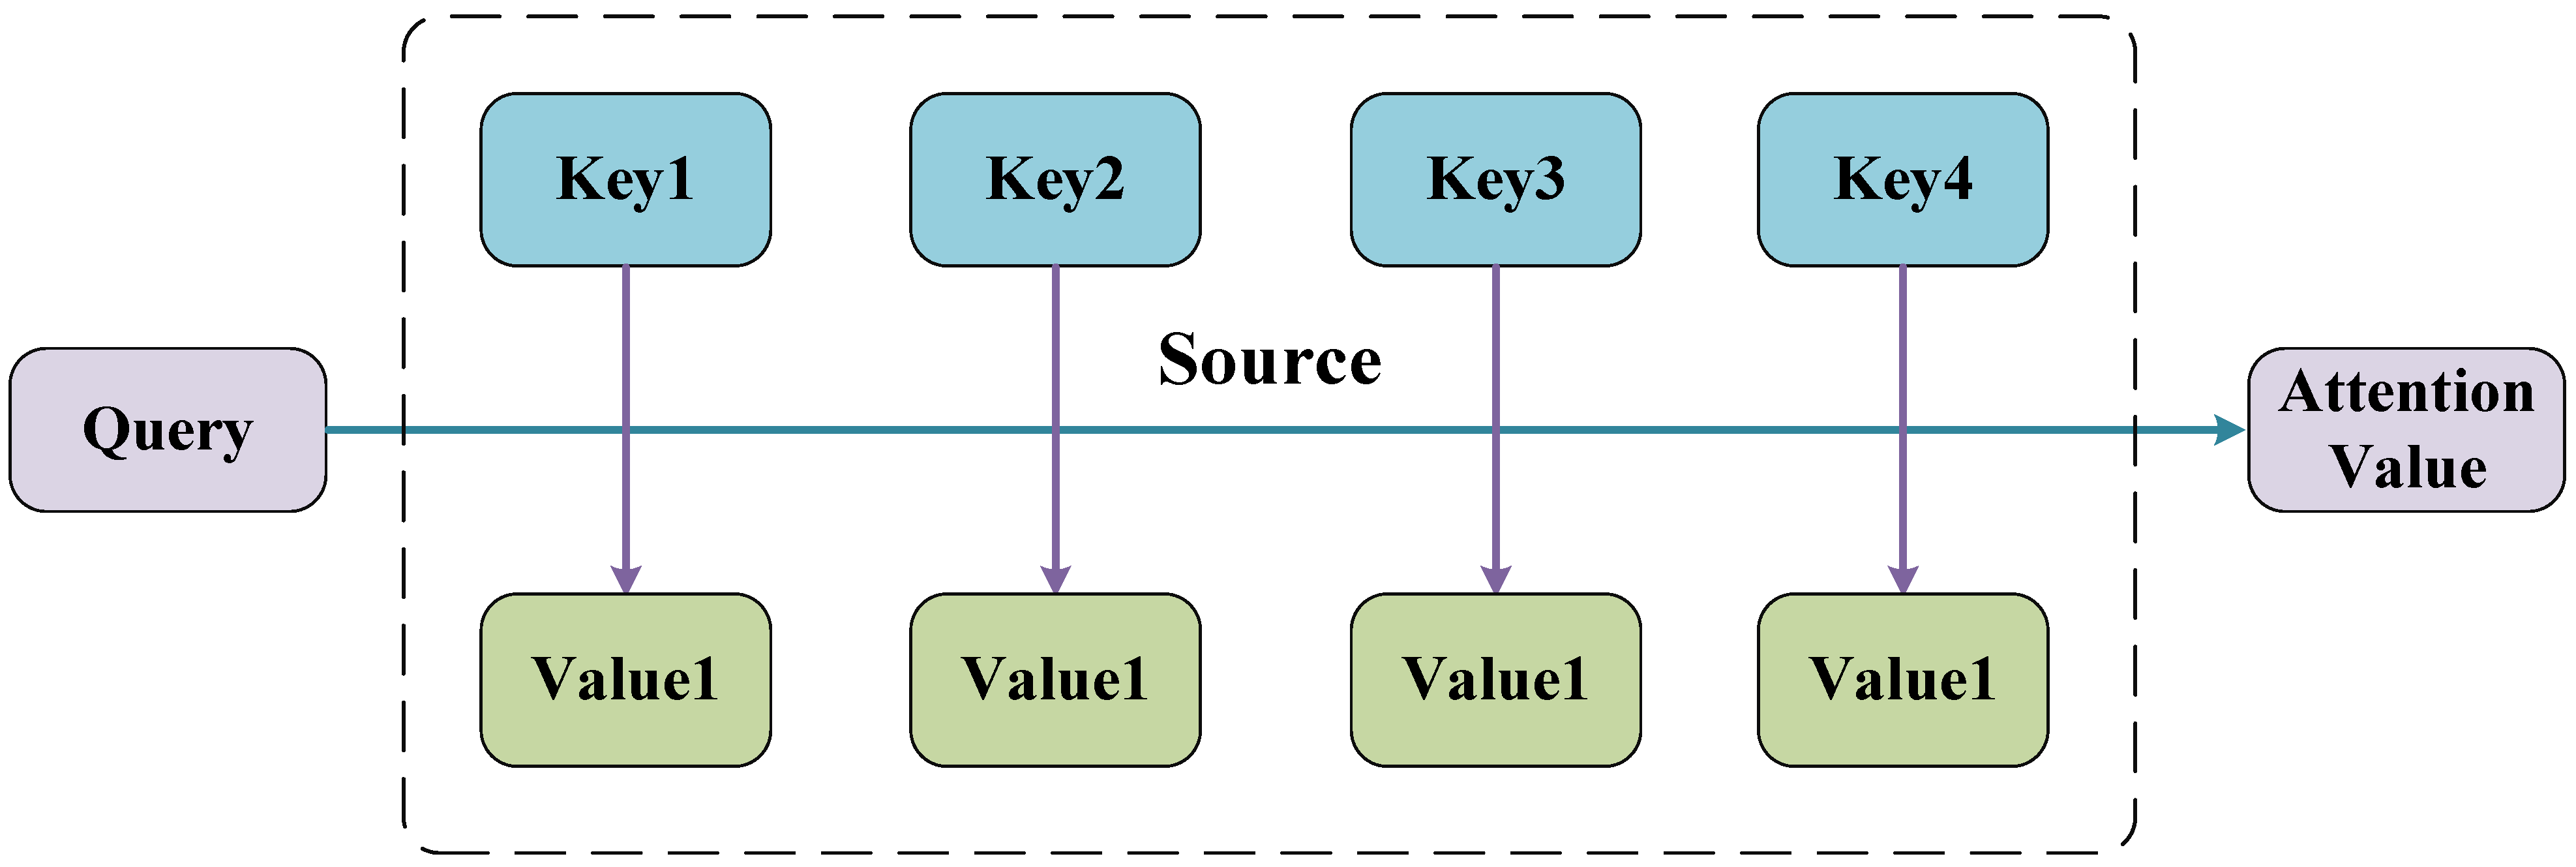
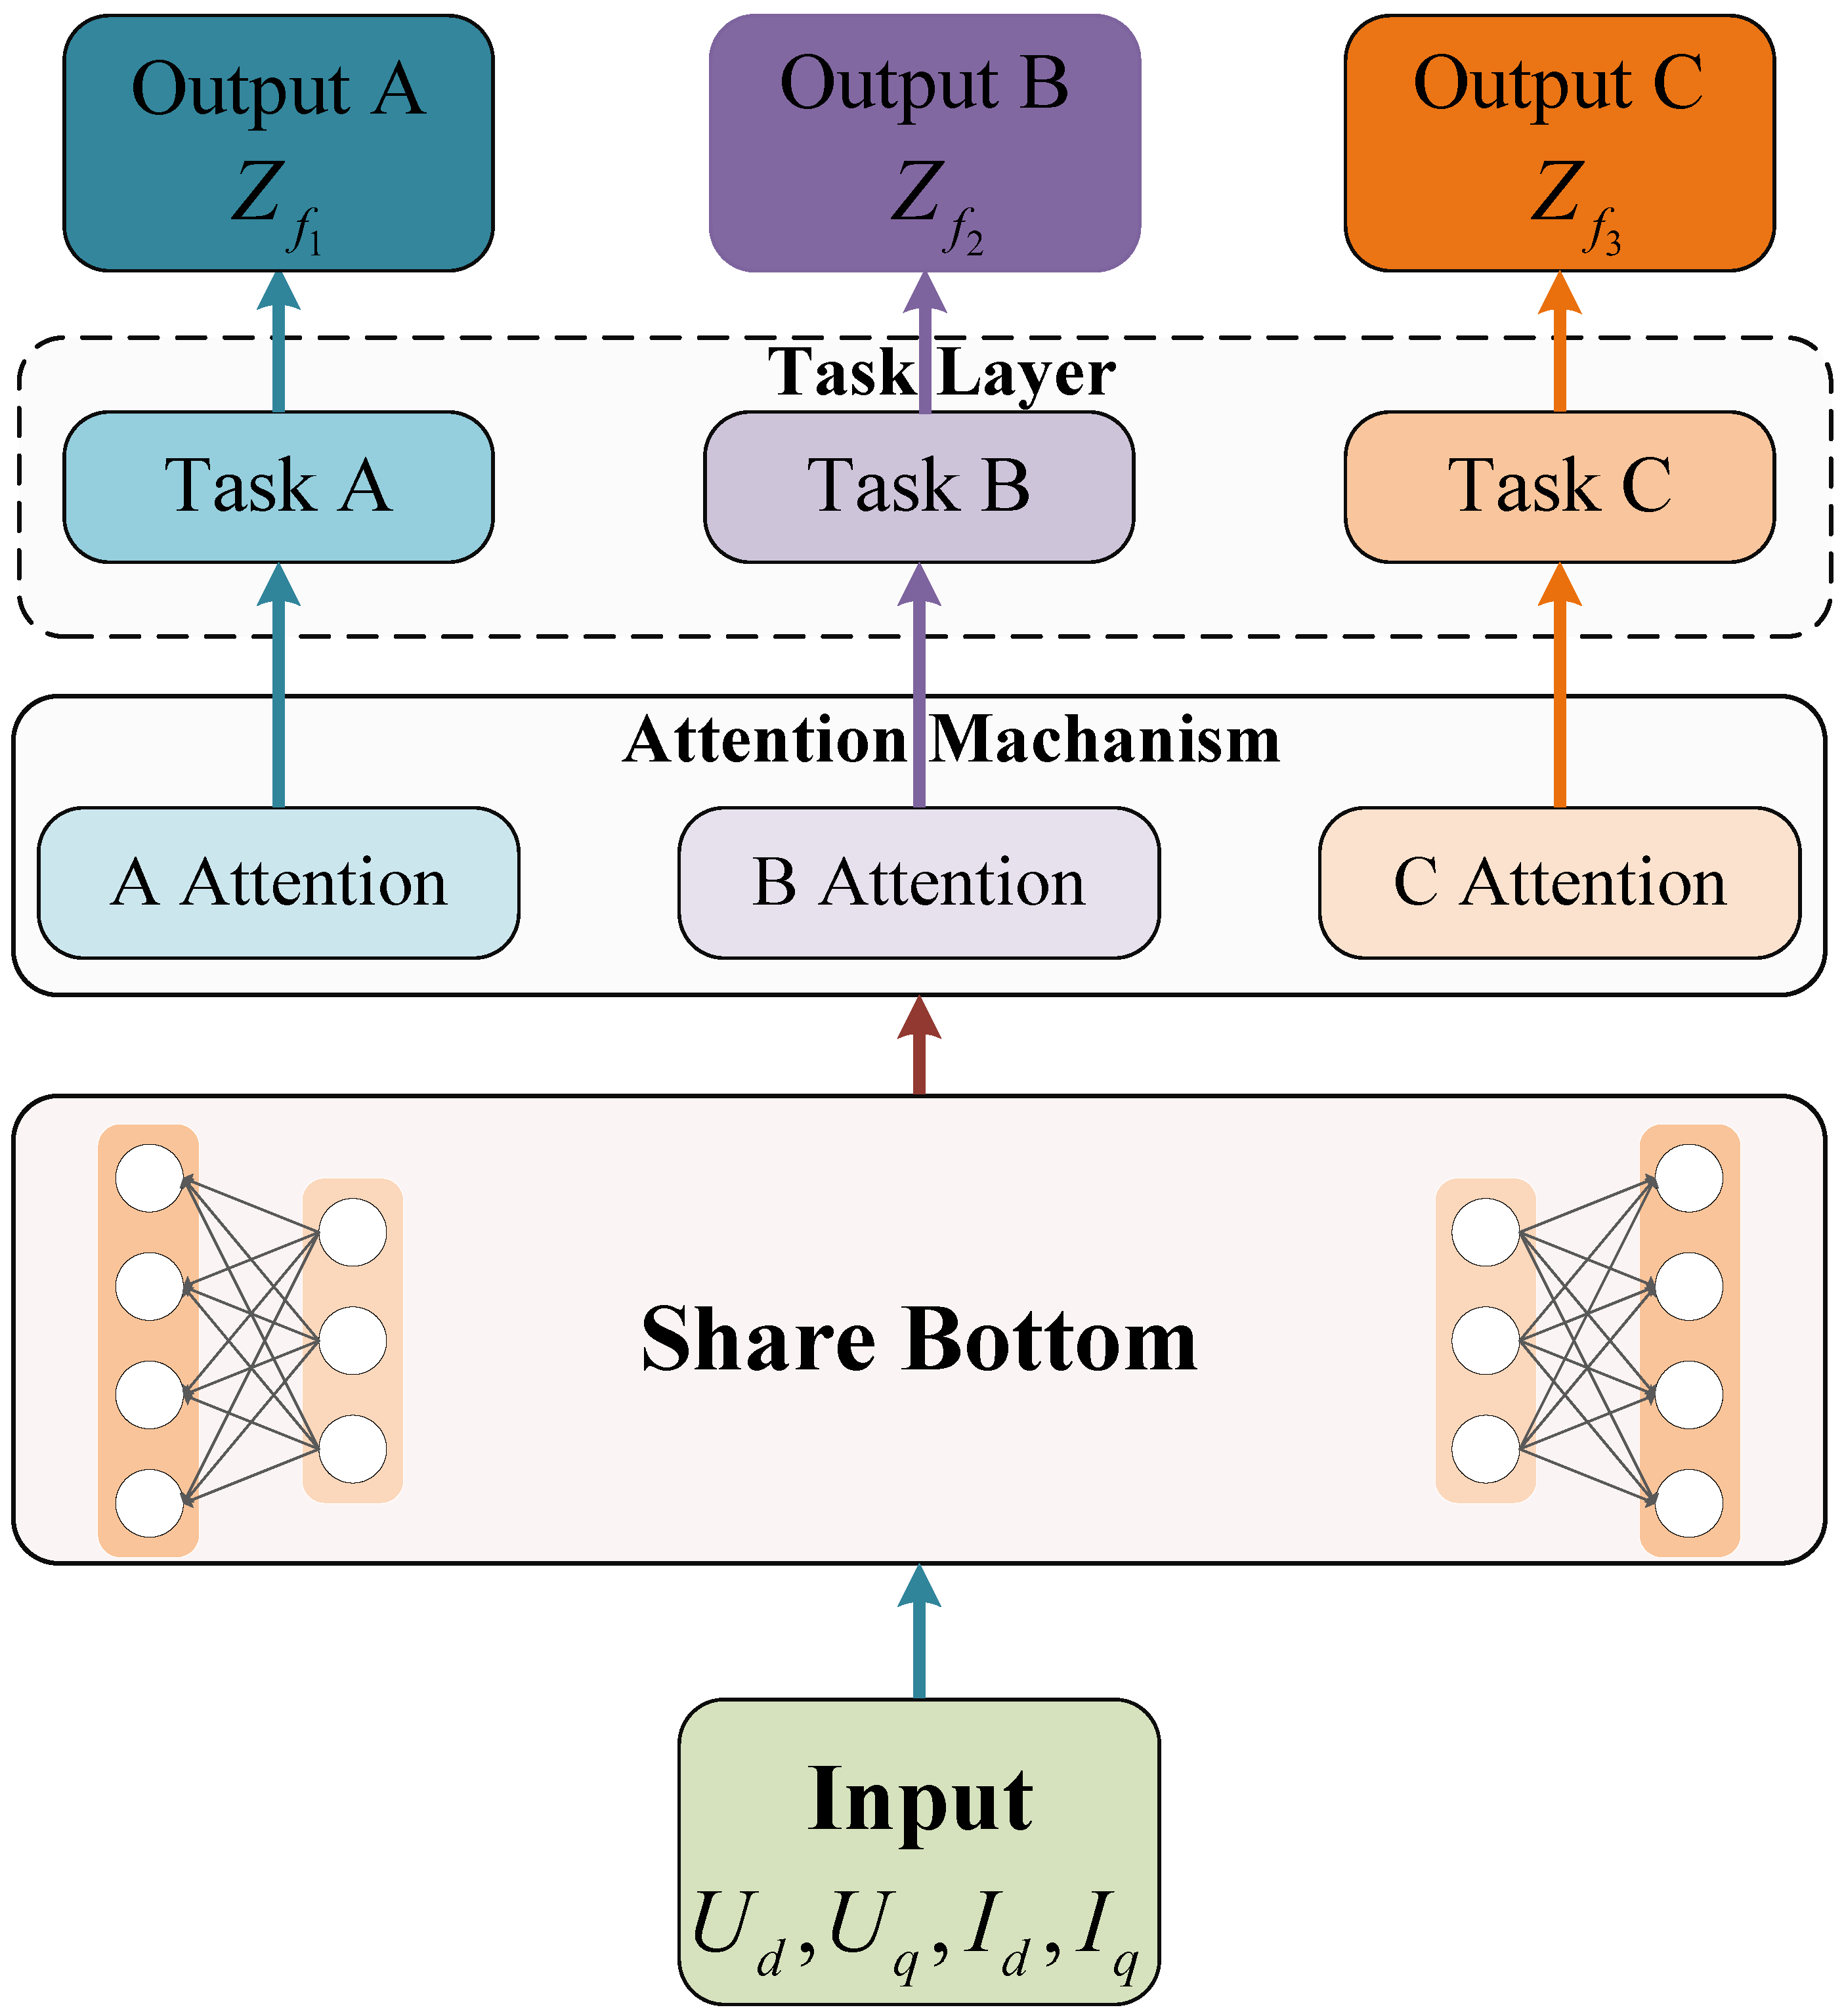
In conclusion, developing real-time broadband impedance models for renewable energy units remains challenging due to parameter confidentiality and the limitations of existing sweep-based techniques. To address these challenges, this paper proposes a real-time online impedance identification method for PMSG-based wind turbines. The proposed method leverages a multi-task neural network framework composed of shared and task-specific layers, enhanced by an attention mechanism that dynamically allocates learning focus across different frequency components. This method, named ASSA (Attention-based Shared and Specific Architecture), enables frequency-decomposed impedance identification and supports online monitoring in renewable-dominated systems. The primary contributions of this work are as follows:
- (1)
A comprehensive theoretical analysis is provided on the mapping between terminal input/output signals and frequency-domain impedance in renewable systems. This lays the foundation for applying deep neural networks to real-time impedance identification.
- (2)
A broadband impedance dataset is constructed under varying wind speed, loading, and voltage conditions, capturing realistic environmental uncertainties and operating variability in PMSG-based systems.
- (3)
A novel multi-task framework, ASSA, is proposed to separate and parallelly identify impedance across frequency bands using a shared-specific structure combined with a frequency-aware attention mechanism.
- (4)
Extensive simulations on a 10-unit wind farm model demonstrate that ASSA achieves higher accuracy, stronger robustness, and better generalization compared to conventional CNN- and black-box-based models, particularly under dynamic and uncertain conditions.
2. Problem Formulation and Modeling Methodology
This section elaborates on the core problem addressed in this study—broadband impedance identification for renewable energy systems—and outlines the methodological framework proposed to tackle it. In modern power systems with increasing penetration of converter-based renewable energy sources, accurate modeling and real-time characterization of source–grid interactions have become critical for maintaining system stability and ensuring reliable operation. Traditional stability analysis tools often fall short when applied to systems dominated by fast-switching inverters, necessitating the use of frequency-domain impedance models that can capture the dynamic behavior of both sources and the grid across a wide frequency spectrum.
Section 2.1 introduces the theoretical foundation of small-signal impedance modeling in the
rotating reference frame, which allows the decomposition of three-phase quantities into orthogonal components and enables clear insight into control-related dynamics. This modeling technique is particularly effective for analyzing the interaction between renewable energy units and the grid in weak and variable grid conditions.
Section 2.2 then presents a hybrid identification framework that combines physics-informed feature selection with data-driven modeling using neural networks. The method is designed to overcome challenges such as limited access to internal control parameters of commercial inverters while ensuring high fidelity in impedance prediction over a broad operating space. The proposed framework ultimately supports real-time monitoring and stability assessment of renewable energy stations.
2.1. dq-Domain Impedance Modeling for Renewable Energy Units
In impedance-based stability analysis, a grid-connected renewable energy system is conceptually divided into two interacting subsystems: the upstream grid and the downstream generation unit or station. For each part, an equivalent impedance or admittance model is established in the frequency domain. By combining these models at the point of common coupling (PCC), the overall system dynamics can be evaluated, particularly in terms of resonance, control-induced oscillations, and damping across multiple frequency ranges. This approach has proven to be both analytically tractable and practically effective in converter-dominated systems.
The modeling of renewable generation units in this work is performed in the synchronous reference frame. This frame is obtained via the Park transformation, which rotates the original three-phase signals into a coordinate system aligned with the fundamental frequency of the system. In this transformed frame, sinusoidal steady-state signals appear as constant values under balanced conditions, which significantly simplifies dynamic analysis and control design. Furthermore, it allows the separation of active and reactive power channels, making the impedance representation more intuitive for system-level interaction studies.
The small-signal impedance of a renewable energy unit in the
frame at frequency
f is defined as:
In this matrix representation, and represent the self-impedances of the d and q axes, respectively, while and denote the cross-coupling terms. These elements are complex-valued and frequency-dependent, capturing the impedance magnitude and phase responses as seen from the terminals of the converter. The function encapsulates the nonlinear mapping from terminal voltage and current vectors to the resulting impedance, taking into account the device’s control loops, measurement filters, modulation strategies, and grid conditions.
Conventionally, two types of impedance modeling approaches are used. White-box models are built using explicit knowledge of the converter’s internal control structure, plant dynamics, and parameter values. While they offer high interpretability and analytical tractability, their implementation requires full access to proprietary device information, which is rarely available for commercial renewable energy equipment. On the other hand, black-box models rely purely on frequency-domain input–output measurements to estimate the impedance matrix without requiring internal details. However, such models face challenges in terms of robustness against noise, limited resolution at high frequencies, and weak generalizability across operating points.
2.2. Physics-Informed Data-Driven Identification Framework
To address the limitations of traditional modeling techniques and to enhance the scalability of impedance analysis for practical systems, we propose a hybrid data-driven framework informed by physical principles. The core idea is to guide the structure of the neural network and the selection of input features using physical understanding of power converter dynamics. In doing so, the model benefits from the learning capacity of neural networks while retaining the physical relevance and interpretability of traditional analytical models.
The impedance identification task is reformulated as a supervised nonlinear regression problem. The input to the model consists of five variables: the -axis voltages , currents , and the frequency f at which the impedance is to be evaluated. The output of the model includes the four frequency-dependent complex impedance elements in the reference frame: , , , and . Each of these elements is expressed in polar coordinates, with the magnitude and phase angle (where ) serving as the identification targets. This structure enables the model to capture the complete broadband impedance characteristics of the system, including both axis-specific behavior and cross-axis coupling effects, across a wide range of frequencies and operating conditions.
While the proposed method is generic and can be applied to a wide range of inverter-based renewable energy sources, this study adopts permanent magnet synchronous generator (PMSG)-based wind turbines as the target application for model validation. PMSGs are widely used in large-scale wind farms due to their high efficiency, compact size, and full converter interface, which provides full controllability of active and reactive power. Moreover, their control loops are representative of modern converter-dominated systems, making them an ideal benchmark for demonstrating the performance of the proposed framework.To support real-time application, the trained neural network model—based on a feedforward structure—can be deployed to edge controllers, where it receives real-time voltage and current measurements and outputs the corresponding broadband impedance characteristics with low inference latency. This enables real-time impedance tracking and online stability assessment under dynamic operating conditions.
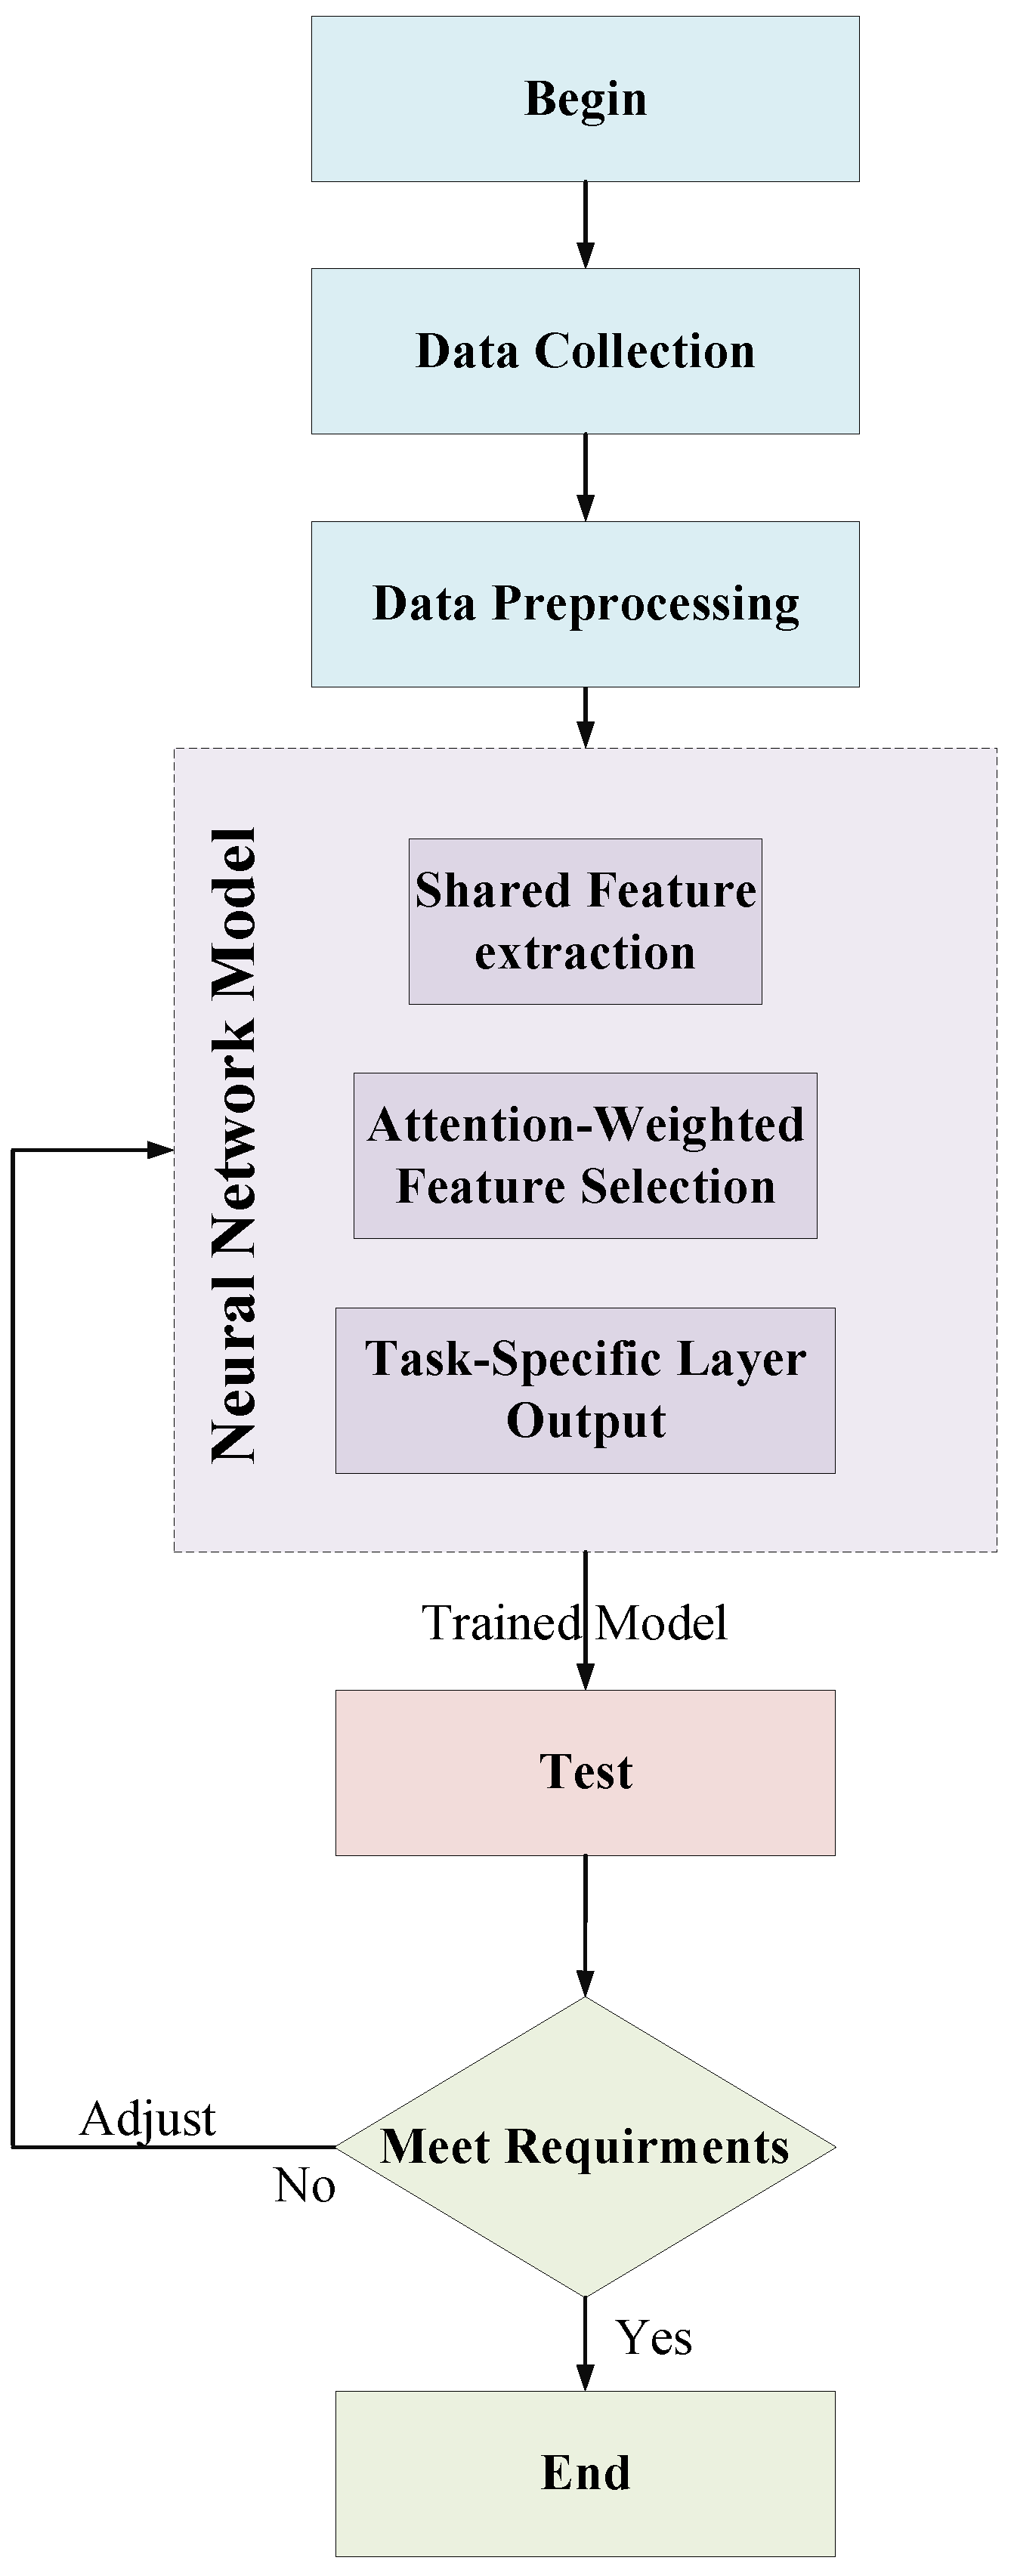
Figure 1 illustrates the overall modeling and identification process, which consists of the following key steps:
- 1.
Data Acquisition: Simulation models or measurement setups are used to generate voltage and current time-series data under varying operating conditions. These include different active power setpoints, which are swept across the full range of 0 to 1 p.u. for typical PMSG operation. Broadband impedance is computed by injecting small perturbations and observing the frequency response over 1–1000 Hz.
- 2.
Feature Engineering and Normalization: The collected data are structured into input–output pairs for training. Inputs are normalized to the range (0, 1) to ensure stable training dynamics. The impedance responses are represented in polar coordinates to preserve magnitude–phase integrity and facilitate physical interpretation.
- 3.
Neura Network Design and Training:A fully connected feedforward neural network is constructed with four input neurons and two output neurons. The number of hidden layers and neurons per layer is chosen based on a grid search over validation performance. The model is trained using stochastic gradient descent with backpropagation, minimizing a loss function that combines magnitude and phase errors.
Figure 1.
Overall workflow of the data-driven impedance identification process.
Figure 1.
Overall workflow of the data-driven impedance identification process.
This physics-informed data-driven framework provides a scalable, interpretable, and device-agnostic approach for broadband impedance identification. It is well suited for both offline characterization and real-time application in stability assessment, control tuning, and fault diagnosis of renewable power stations.
4. Case Study
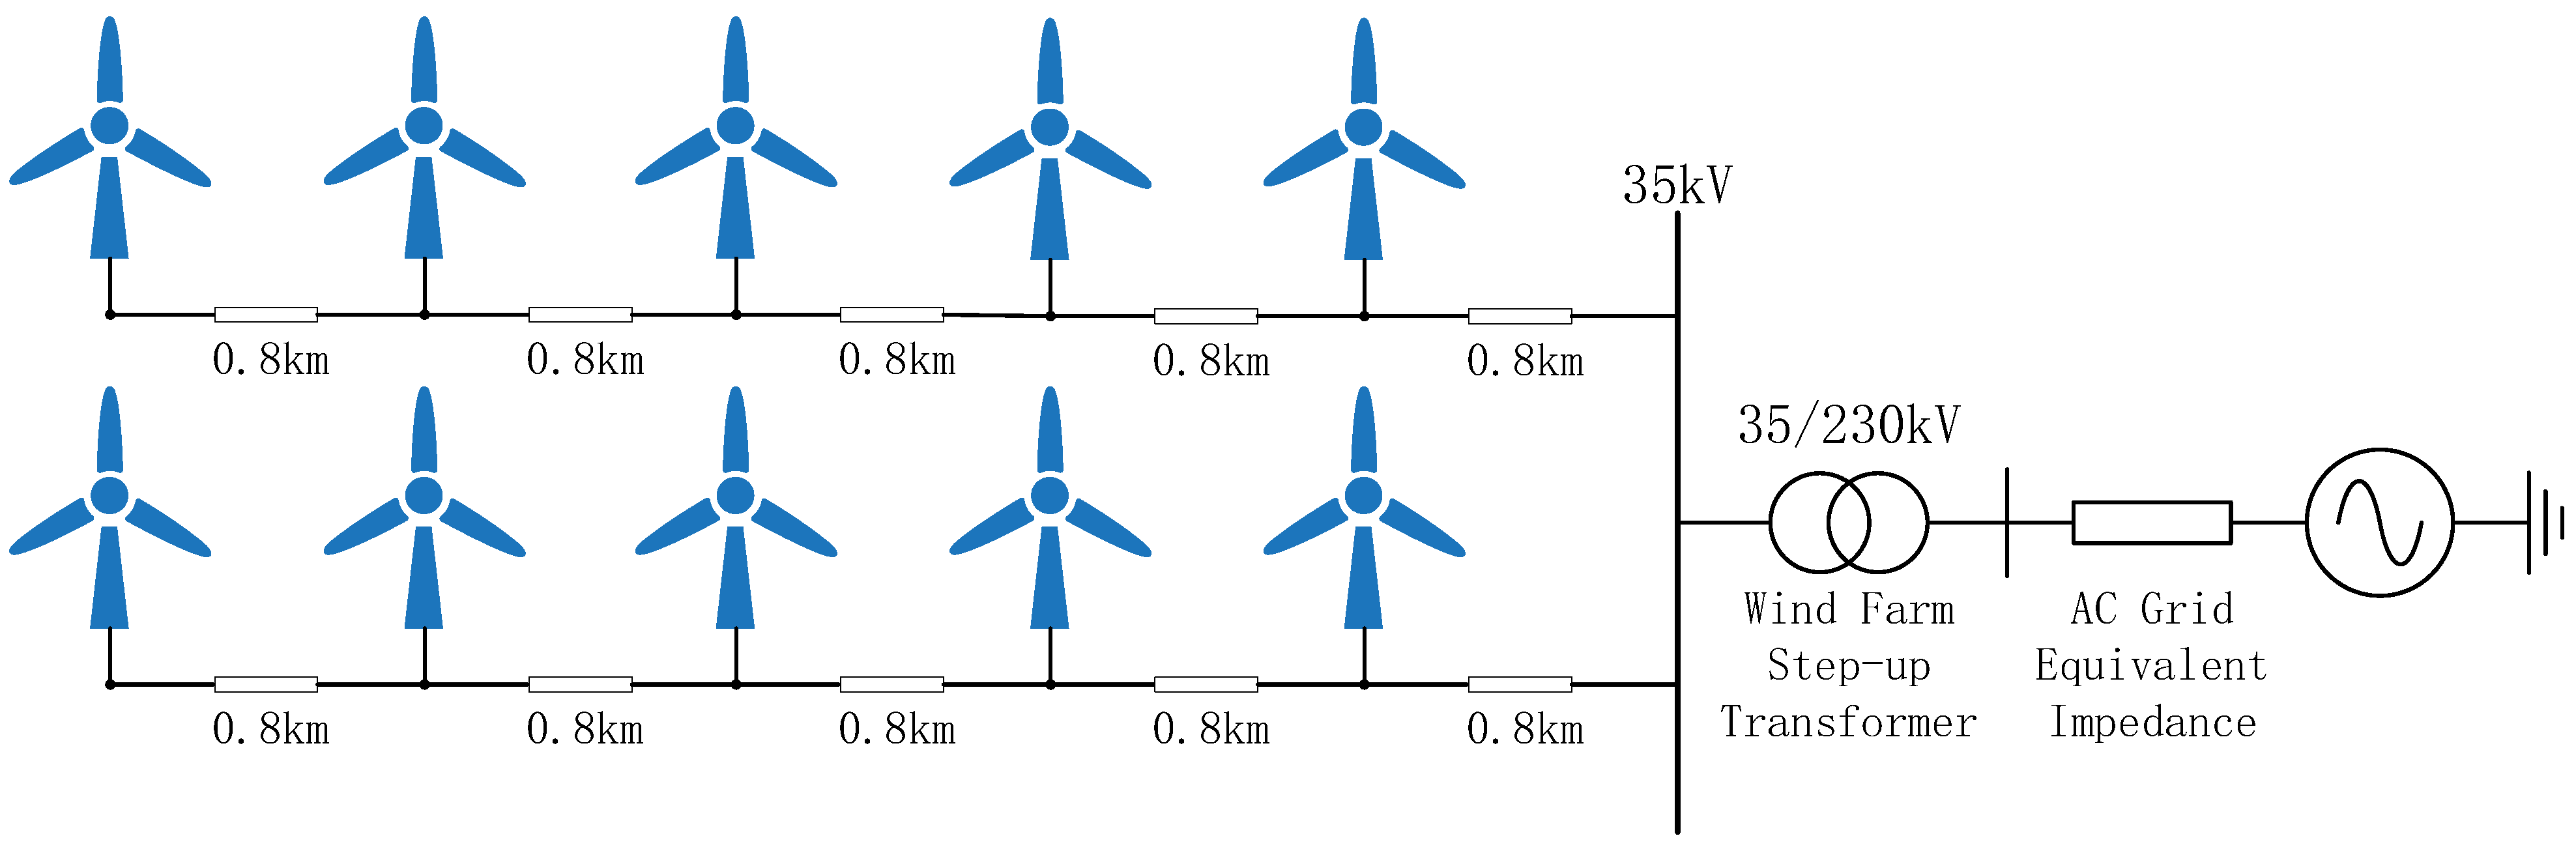
The simulation platform employed in this study integrates both electromagnetic modeling and machine learning environments. Specifically, the wind farm system was constructed in MATLAB/Simulink R2022, as illustrated in
Figure 4. The model includes 10 wind turbines, each connected to a 35 kV collection bus via a 0.69 kV/35 kV step-up transformer. This bus is then connected to a 220 kV transmission system through a 35 kV/220 kV transformer, and power is delivered to an infinite bus via two series-compensated transmission lines. The wind farm is divided into two feeders, each consisting of five turbines, with 0.8 km of cable between adjacent turbines.
To enable online impedance identification across a wide frequency band, a data-driven identification framework was developed using TensorFlow 2.8. The proposed ASSA (Attention-based Shared-Specific Architecture) algorithm was implemented for supervised regression. Model training and evaluation were conducted on a high-performance computing server equipped with an Intel i9-12900K CPU, 32 GB RAM, and 48 GB GPU memory, ensuring efficient handling of large-scale datasets and neural network computations.
4.1. Sample Set Construction
During the dataset generation process, various operational parameters of the wind farms were adjusted to cover multiple working conditions under real operating states. The system’s randomness is primarily reflected in factors such as wind speed, the number of wind turbines, series compensation levels, and switching states. These adjustments ensure dataset diversity and sufficient coverage of different operational scenarios. The final dataset comprises system operation data under steady-state conditions. To maximize coverage of system operating states, the wind speed of each turbine was randomly and uniformly distributed between 6 and 12 m/s. The switching states (K1, K2) of 10 wind turbines were randomly assigned values of 0 or 1, generating a total of 3000 labeled samples. Of these, 80% or 2400 samples, were allocated for the training set, with a subset randomly selected for the validation set. The remaining 600 samples were used for the test set.
4.2. Model Performance Evaluation Criteria
In regression tasks, common performance metrics include Mean Squared Error (MSE), Root Mean Squared Error (RMSE), Mean Absolute Error (MAE), and the coefficient of determination (R²) [
25]. These metrics effectively evaluate the predictive ability of the model and the distribution of errors.
The Mean Squared Error measures the squared differences between the predicted values and the actual values. The formula is:
The Root Mean Squared Error is the square root of the MSE, representing the error in standard units. The formula is:
The Mean Absolute Error measures the absolute differences between the predicted values and the actual values. The formula is:
The coefficient of determination measures how well the model explains the variability of the target variable. The formula is:
4.3. Performance Testing
In order to validate the effectiveness and superiority of the proposed algorithm, this experiment conducts a comparative analysis with several classical algorithms. By evaluating the performance of various algorithms under identical experimental conditions, the advantages of the proposed algorithm in addressing specific problems are thoroughly demonstrated. Key metrics such as Mean Squared Error (MSE), Root Mean Squared Error (RMSE), Mean Absolute Error (MAE), and the coefficient of determination are utilized to confirm the strong adaptability and robustness of the proposed algorithm across diverse scenarios. These comparisons offer compelling experimental evidence for the superiority of the proposed algorithm. The detailed results are presented in
Table 1.
Based on the experimental results and comparative analysis, the proposed algorithm ASSA exhibits excellent performance across all metrics. In comparison to classical algorithms such as Linear Regression, Decision Tree, Random Forest, and Bayesian Regression, ASSA achieves an MSE of just 0.0098, an RMSE of 0.0989, and an MAE as low as 0.0105, highlighting its remarkable advantage in error control. Moreover, ASSA achieves an R² of 0.9412, which further confirms the algorithm’s precision and stability in data fitting. Compared to other algorithms, ASSA consistently maintains lower errors and higher prediction accuracy in complex scenarios, demonstrating particularly strong generalization ability in regression tasks. Thus, the experimental results strongly validate the superiority and robustness of the proposed algorithm in solving relevant problems.
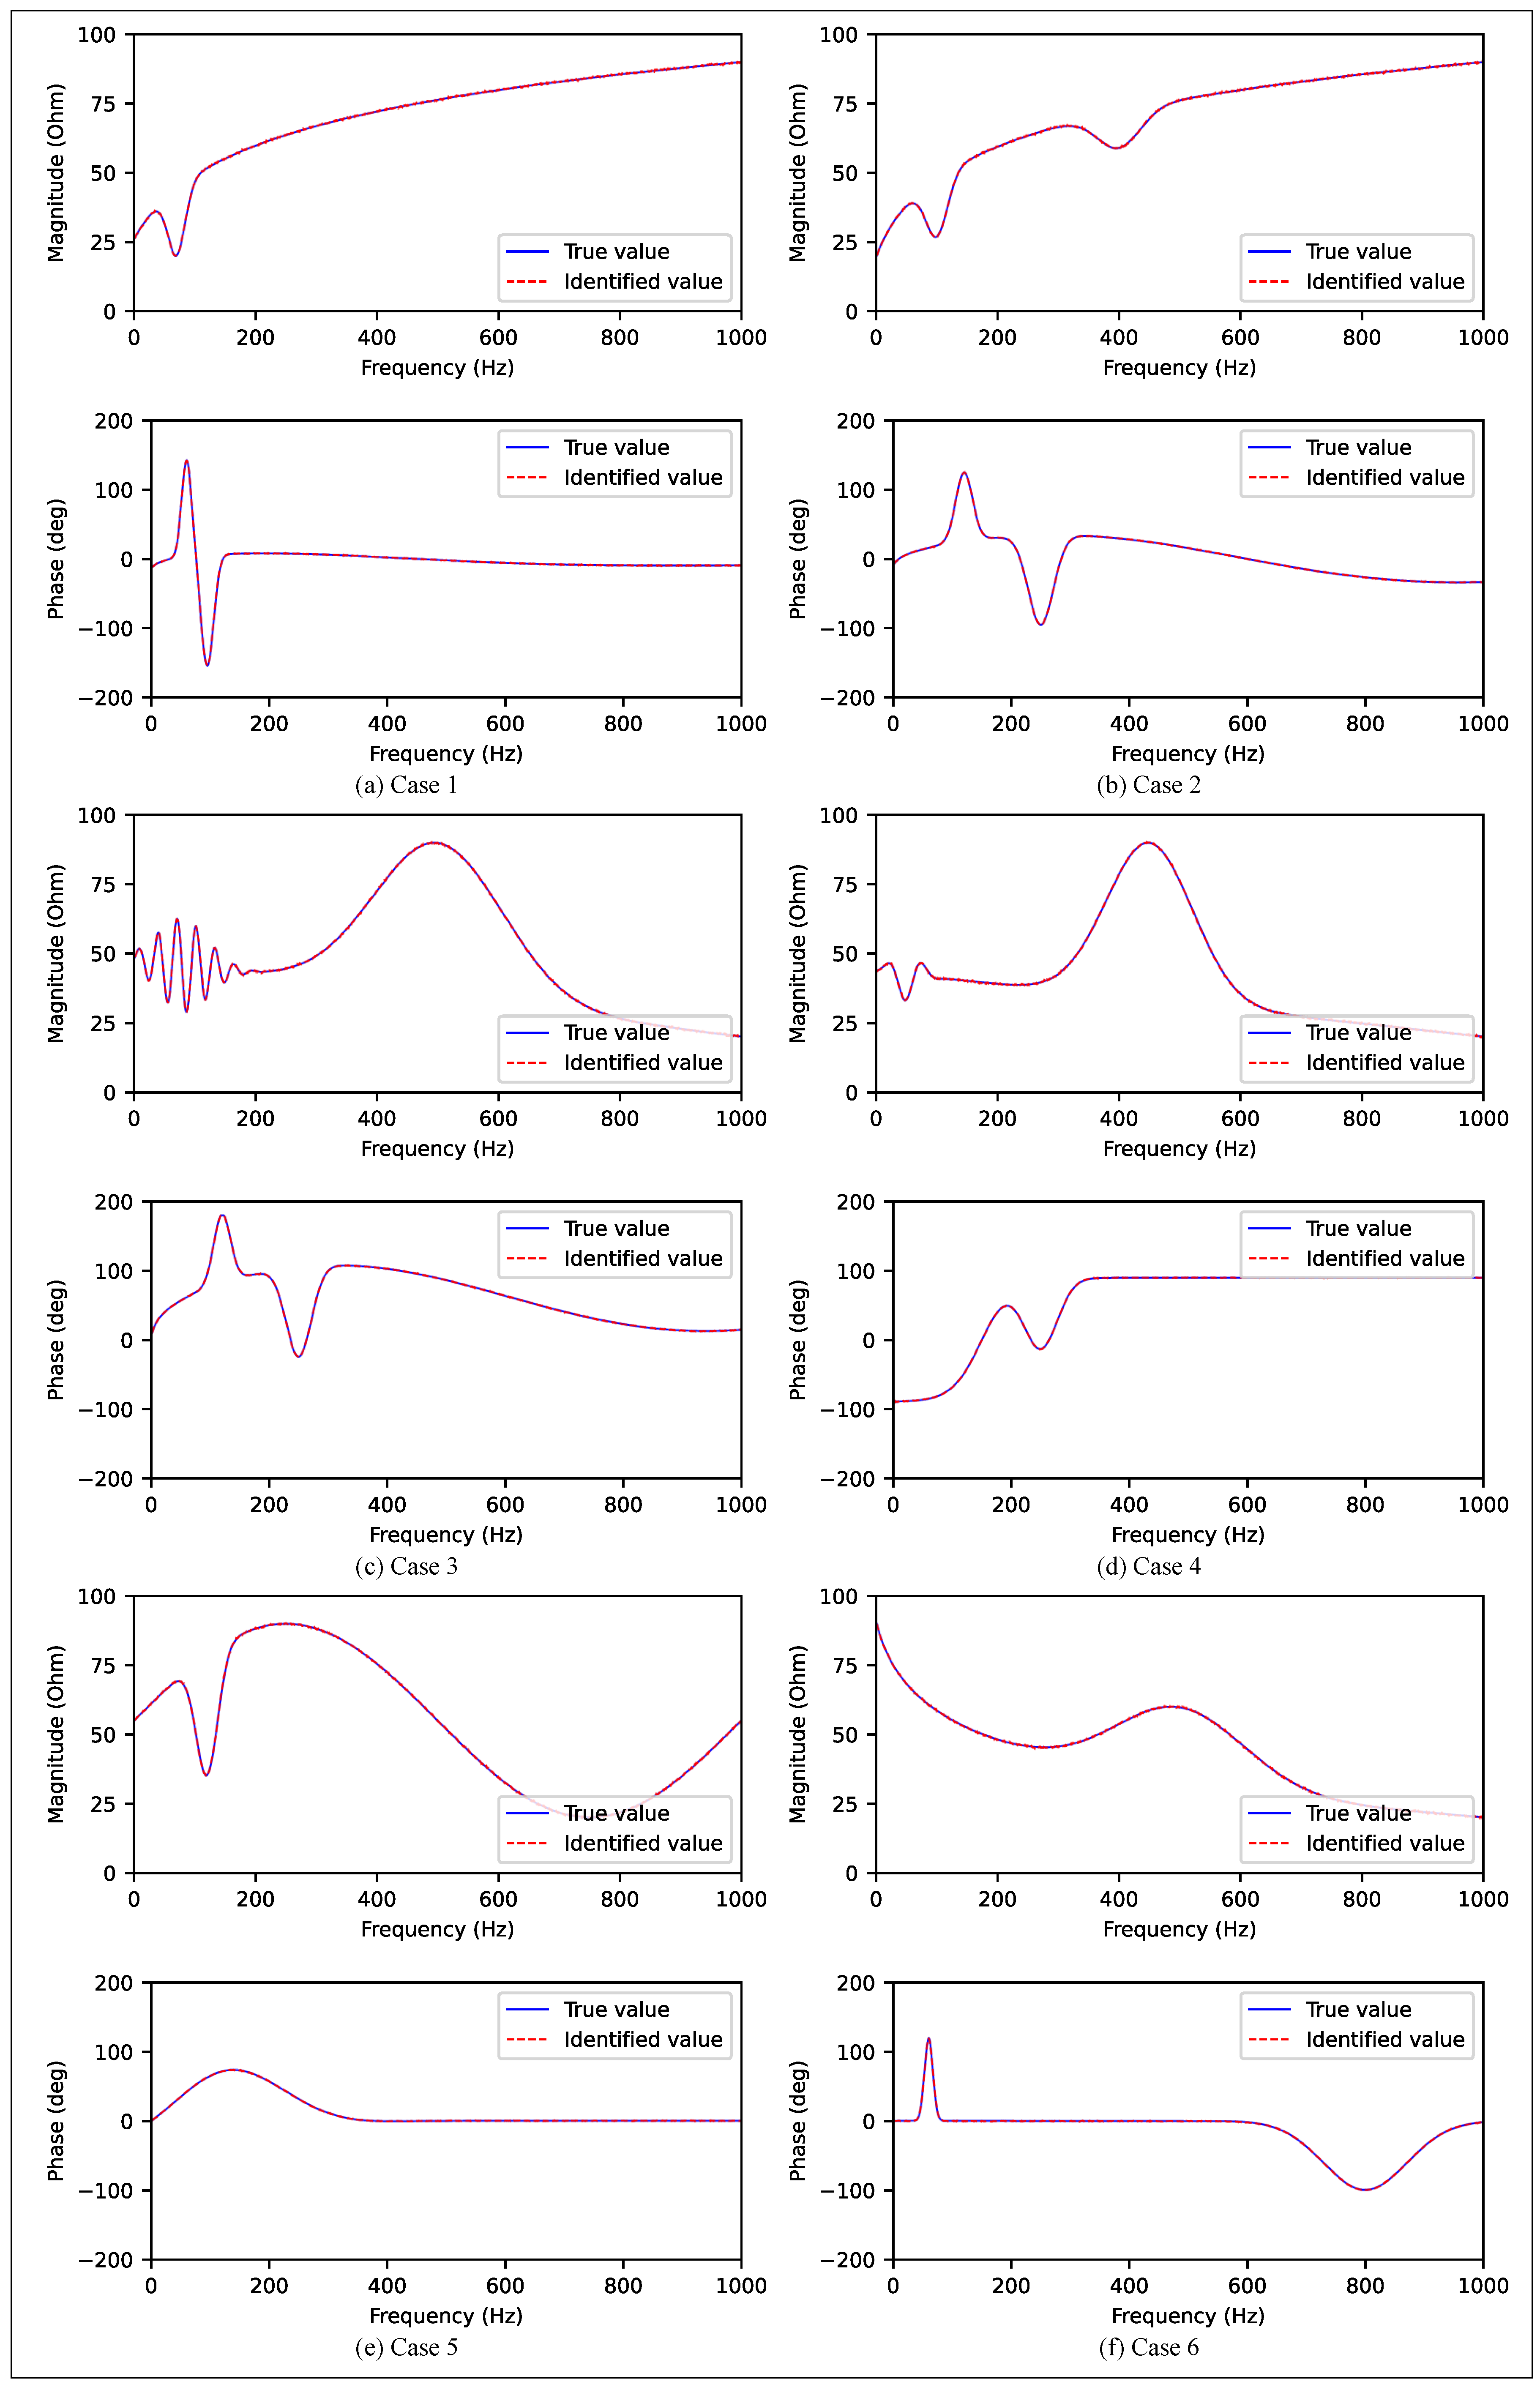
Building on the previously mentioned algorithm and model, the real-time impedance of the wind farm is identified online by using real-time current/voltage measurement signals. To assess the performance and real-time operation of the proposed algorithm, four wind speeds—8 m/s, 9 m/s, 10 m/s, and 12 m/s—are randomly set for the wind farm, as illustrated in
Figure 5.
In this figure, the “true values” refer to the impedance responses obtained through sweep frequency experiments under corresponding operating conditions. These experimental measurements represent the actual broadband impedance characteristics of the wind farm system. The “identified values” are the impedance values predicted by the proposed ASSA algorithm based on the real-time voltage and current signals. The comparison between these two sets of values visually demonstrates the accuracy of the proposed identification method. From the comparison of the experimental results, it is evident that within the frequency range of 1 Hz to 1000 Hz, the predicted values of the proposed algorithm exhibit a high degree of consistency with the actual values. The performance metrics approach optimal levels, with the coefficient of determination being close to 1, which indicates excellent predictive accuracy across a wide frequency range. This confirms that the algorithm proposed in this paper accurately captures data characteristics, exhibiting strong predictive capabilities and generalization performance. Additionally, it further validates the effectiveness and reliability of the proposed method in regression tasks.
5. Conclusions
In conclusion, this paper proposes a real-time online wideband impedance identification method based on a multi-task neural network—ASSA—which effectively overcomes the limitations of traditional impedance modeling approaches for commercial new energy equipment. By combining shared and task-specific structures with an attention mechanism, the method can accurately identify impedance across different frequency bands and improve the fitting precision.To support practical applicability, a wideband impedance dataset was constructed under multiple working conditions with random uncertainties. Experimental results demonstrate that the proposed method achieves a Mean Squared Error (MSE) of 0.0098, a Root Mean Squared Error (RMSE) of 0.0989, a Mean Absolute Error (MAE) of 0.0105, and a coefficient of determination () of 0.9412. These results verify the model’s strong accuracy and generalizability, indicating its potential in enhancing system stability. However, some limitations remain. The model is currently validated primarily through simulation-based data, and its generalizability to real-world measurement noise or hardware uncertainty needs further exploration. Additionally, the model’s scalability and computational efficiency in large-scale deployments require more investigation.In future work, we plan to incorporate field measurement data, further optimize the model architecture, and extend the application to more complex power electronic systems. These efforts aim to advance the practical deployment of data-driven impedance modeling techniques in real-world renewable-integrated power systems.


