Article

Multimodal Gene Expression and Methylation Profiling Reveals Misclassified Tumors Beyond Histological Diagnosis

Faculty of Science, Thompson Rivers University, Kamloops, BC V2C 0C8, Canada
*
Author to whom correspondence should be addressed.
Electronics 2025, 14(12), 2442; https://doi.org/10.3390/electronics14122442
Submission received: 21 April 2025 / Revised: 13 June 2025 / Accepted: 14 June 2025 / Published: 16 June 2025

Abstract

Accurate tumor classification is essential for guiding treatment, yet histology alone may overlook key molecular differences or result in misclassification. We present a multimodal strategy that integrates gene expression (mRNA) and DNA methylation data to improve classification accuracy and detect misclassified tumors. Using 6216 samples from The Cancer Genome Atlas (TCGA), we applied Support Vector Machines (SVMs) and hierarchical clustering to evaluate classification accuracy across single and integrated platforms. mRNA and methylation data alone achieved accuracies of 97% and 95.4%, respectively. Their integration further reduced false positives and improved the identification of outliers, including histologically misclassified cases such as papillary renal cell carcinoma samples clustering with bladder cancer. The integrated approach also revealed molecular subtypes correlated with somatic mutations and patient survival, offering clinically relevant insights. Our findings highlight the value of combining genetic and epigenetic profiles to refine cancer diagnostics. This framework enhances diagnostic precision, supports treatment decisions, and provides a scalable quality control tool for molecular oncology.

1. Introduction

Accurate diagnosis of cancer is the basis for effective treatment, as it directly influences therapeutic decisions and patient management [1]. Although current expertise in histologic interpretation, supplemented by additional techniques such as immunohistochemistry, is adequate in most cases, a proportion of tumors remain difficult to classify due to the subjective nature of histopathology [2,3]. Histopathology may overlook subtle molecular subtypes that significantly impact clinical outcomes [4]. This challenge is particularly evident in complex tissues and when the primary origin of metastatic tumors is uncertain [5].
Diagnostic discrepancies among pathologists further worsen this issue, since histologic interpretation is subject to interobserver variability. A study published in JAMA highlighted a lack of concordance in 25% of breast cancer cases, with even higher rates (over 45%) in specific diagnoses [6]. Such inconsistencies can lead to inappropriate treatment strategies, adversely affecting patient outcomes. To address these limitations, comprehensive molecular profiling of tumors has emerged as an essential approach to differentiating molecular subtypes based on their biological behavior [7,8]. High-throughput genomic technologies allow the examination of genetic and epigenetic alterations, providing deeper insights into tumor subclassifications [9,10].
Several studies have comprehensively characterized different tumors using various molecular platforms [11,12]. Despite the success of multiplatform studies, practical limitations hinder their implementation in clinical settings. Multiplatform analyses require significant cost, time, manpower, and availability of biological tissue [13]. Consequently, current genomic studies often focus on single-platform characterizations. The integration of gene expression and DNA methylation data offers a balanced approach to capturing both genetic and epigenetic landscapes while remaining feasible for clinical application [14,15,16,17]. Recent graph-based deep learning frameworks have pushed this further, for example, MOGAT [18], DeepMoIC [19], and SeNMo [20].
This integration improves the identification of discrepancies between molecular signatures and histological classifications, helping to detect misclassified tumors and revealing biologically distinct subtypes not discernible solely by morphology [21]. The introduction of new data-intensive molecular technologies, biased manual feature selections with an arbitrary cutoff for each new generation, and some technical issues has resulted in a reproducibility crisis and tremendous barriers to accurate tumor classification in the clinical setting and biological interpretation [22]. Furthermore, a systematic integration of genetic and epigenetic data to identify misclassified samples is still lacking. Identifying misclassified samples (outliers) can help reduce diagnostic errors and serve as a valuable quality control measure in clinical practice.
The purpose of this paper is to develop multimodal strategies to identify cancer misclassification by integrating genetic and epigenetic data to improve the precision of tumor classification in cases where histology or tumor morphology is ambiguous. By cross-validating histological diagnoses with molecular signatures, our approach not only improves diagnostic precision but also provides a robust quality control measure for clinical practice. This is crucial because misclassification can directly affect treatment choices and patient outcomes.

2. Materials and Methods

2.1. Overview of This Study

This study identifies cancer misclassifications using molecular profiling data, specifically gene expression (mRNA) and DNA methylation data. By integrating these two data types, this research provides a comprehensive view of tumor biology, enhancing the detection of discrepancies between molecular profiles and traditional histological classifications. The approach involves several computational strategies, including the integration of multi-omics data, the application of unsupervised clustering techniques (such as hierarchical clustering) to group tumors based on molecular similarities, the use of supervised classification models based on Support Vector Machines (SVMs) to classify tumors using known labels, feature selection and dimensionality reduction to improve model performance and interpretability, and the implementation of outlier detection algorithms to identify samples that significantly deviate from their assigned groups.

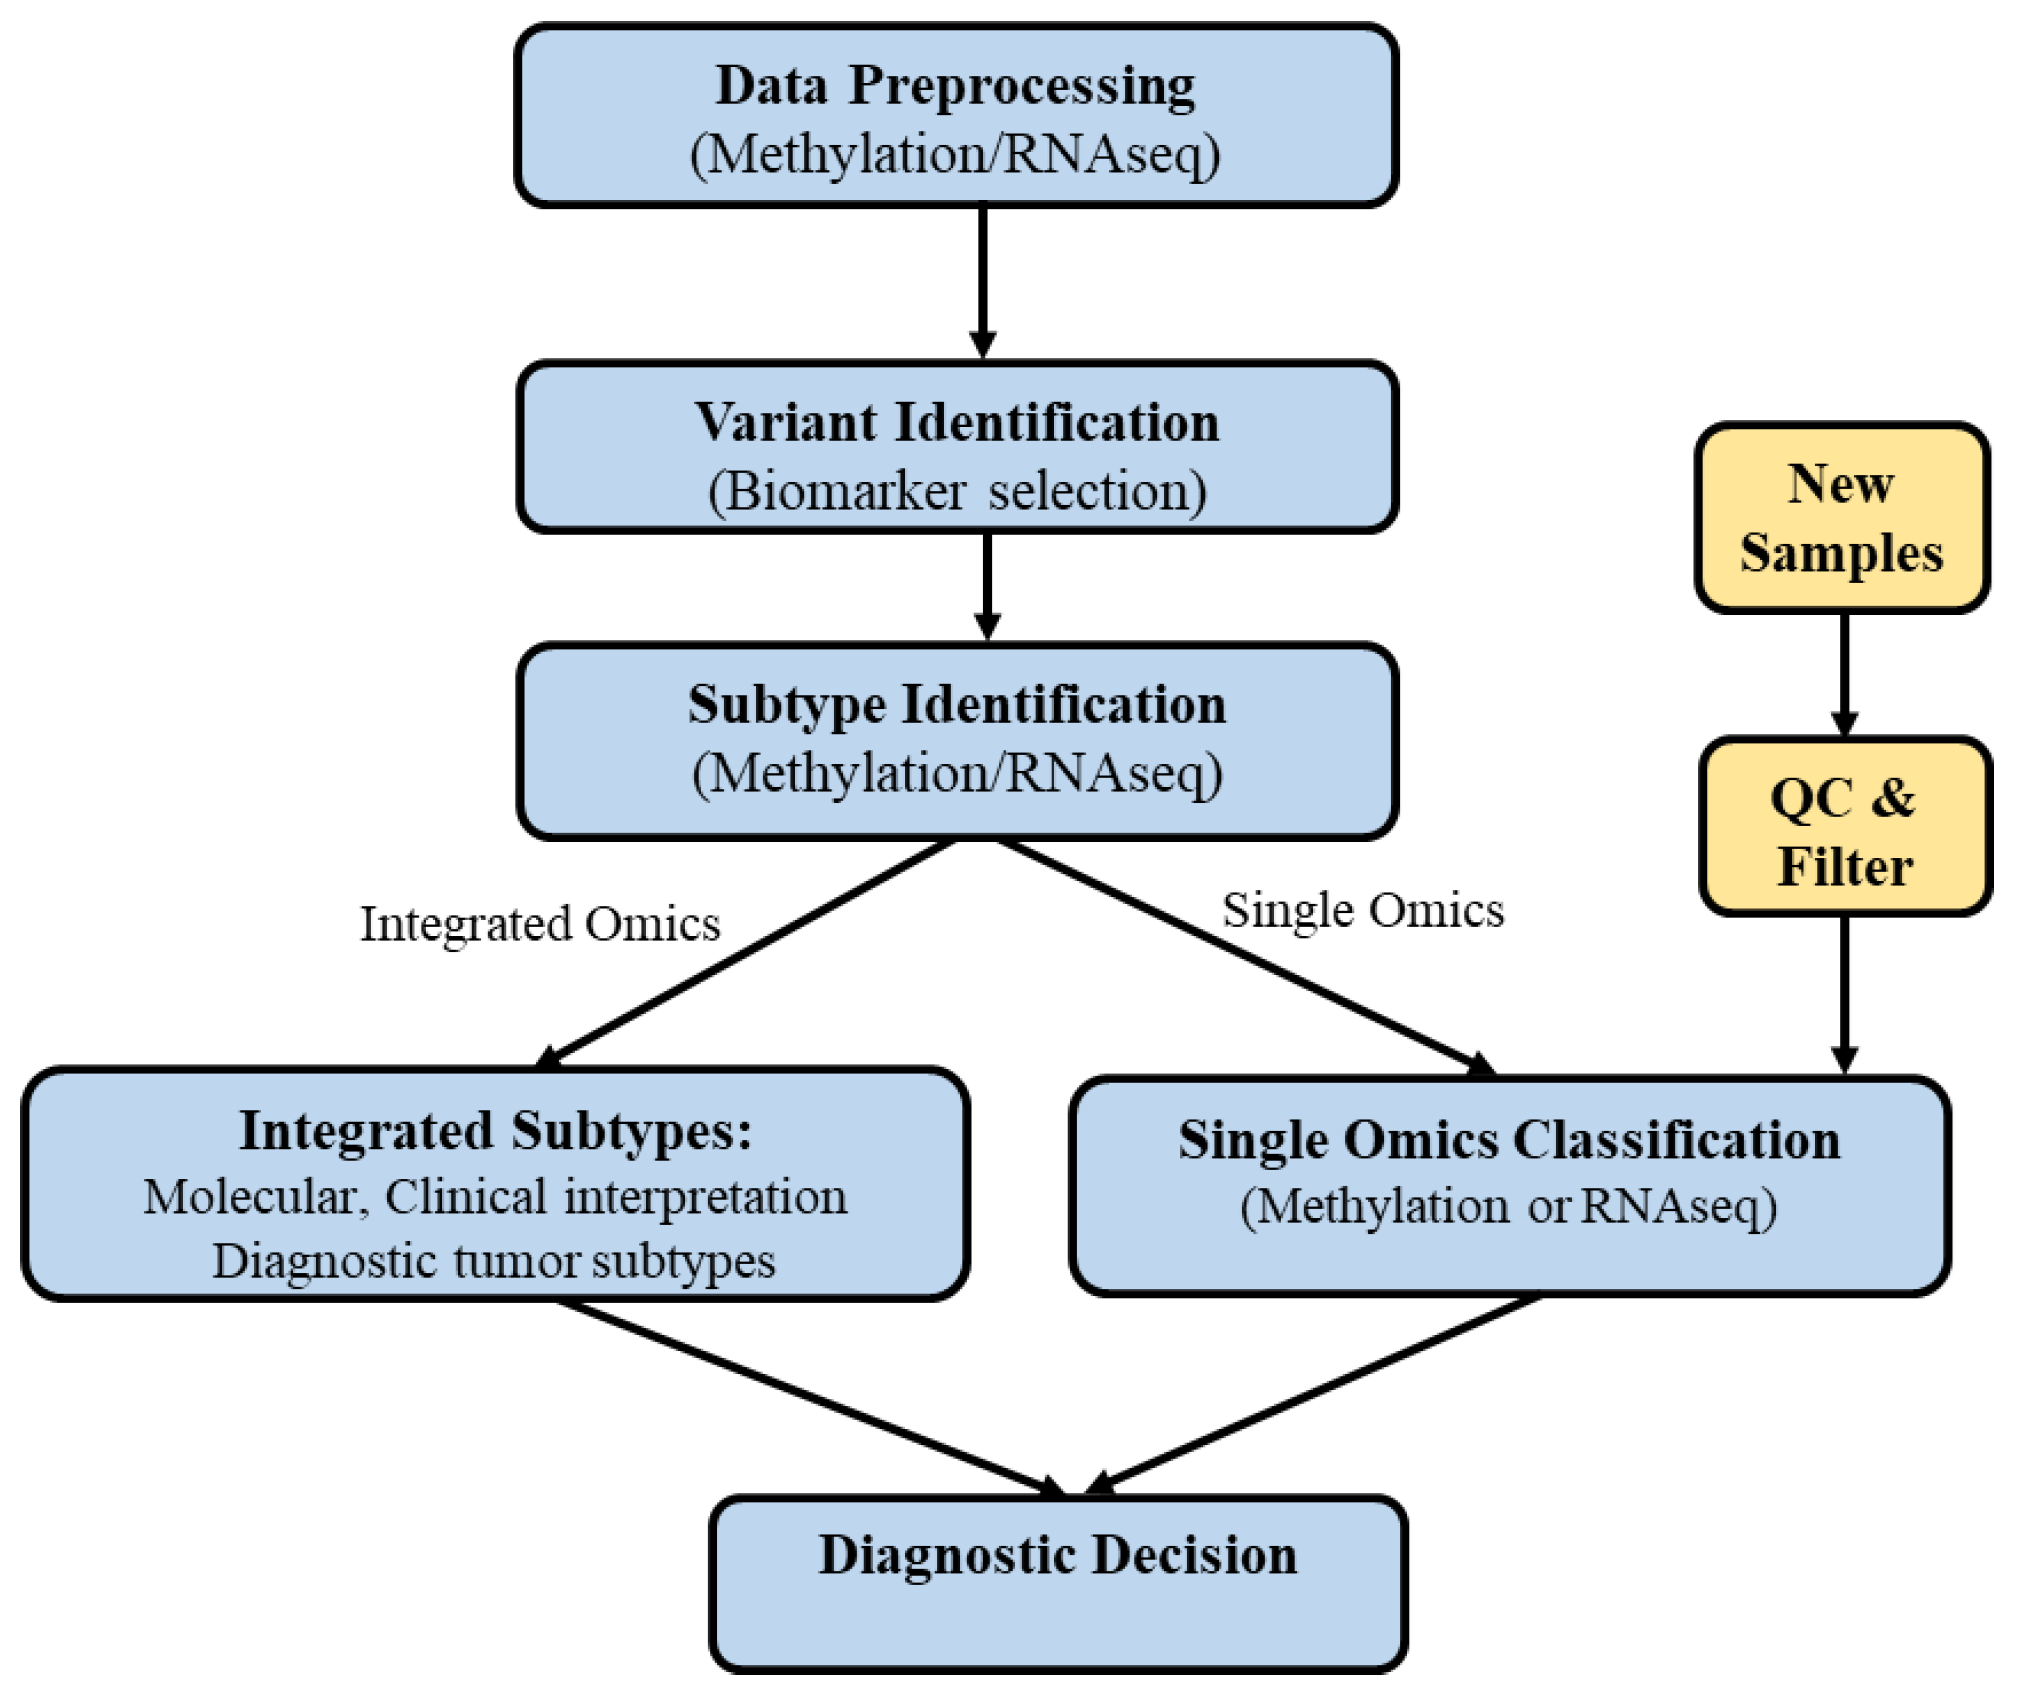
2.2. Developed Pipeline

The data processing pipeline, illustrated in Figure 1, outlines the steps from raw data preprocessing to molecular subtype identification, integration, classification, and clinical interpretation through survival analysis (survival difference < 0.05 is considered to be significant). The workflow aims to identify genomic similarities and differences among the molecular subtypes of different tumor types, regardless of tissue of origin, and to perform systematic and integrated analyses within each tumor type. We developed a simplified procedure for predicting new samples using the built-in classifier. By filtering and sorting the mRNA or methylation dataset, the classifier can predict molecular subtypes even when only one omics platform is available.

2.3. Data Collection and Preprocessing

For proof of principle, this study utilized 22 tumor types from The Cancer Genome Atlas (TCGA) Data Portal [23], downloading and analyzing 6216 patient samples profiled by both methylation and mRNA data. All data used in this study are publicly available, deidentified from TCGA [23], and thus did not require additional ethical approval. The identification of subtypes was performed using unsupervised clustering approaches, and integrated subtypes were systematically analyzed. Subsequently, subtype classification was performed using identified subgroups based on DNA methylation and mRNA data. For DNA methylation, the Illumina HumanMethylation450 BeadChip (450K array) methylation arrays use 480,000 methylation sites across the entire genome.

2.4. Feature Selection and Clustering

In the subtype classification framework, the 450K methylation and mRNA data were preprocessed, and the most variable 10,000 CpG sites and genes were selected to discover tumor subtypes, similar to [4]. Hierarchical clustering was performed on both data types to identify subtypes based on similarity measures using the Euclidean distance method with Ward.D2 linkage (hclust(method = “ward.D2”)). Characteristics (CpGs and genes) that typically differ between putative subtypes were determined to build predictors of these subtypes. We used the Partek Genomics Suite software version 7.0 (Partek, St. Louis, MO, USA) for clustering. Statistical and classification analyses were conducted using the R/Bioconductor package.
Regarding data collection and preprocessing, the mRNA dataset (RNAseq) for the 22 tumor types was downloaded from the UCSC Cancer Genomics Browser. The gene expression datasets, measured using the Illumina HiSeq RNASeqV2 platform, were log 2 -transformed and PanCancer-normalized across all TCGA cohorts. The batch effect concerns were addressed using global normalization techniques. The various tumor types were combined into one data file before further processing.
Figure 1 also depicts the procedures used to efficiently identify additional methylation and gene expression characteristics correlated with the identified subtypes, an important aspect of subtype classification analysis. This analytical framework is suitable for both single-omics platforms and integrated mRNA/methylation platforms.

2.5. Classification Models

To ensure the robustness of our modeling approach and avoid biased evaluation, we created independent training and test datasets for both the mRNA and methylation data. We randomly divided the 6216 samples into two equal, non-overlapping sets of 3108 samples each, ensuring a balanced representation of each subtype. We trained the SVM models on the training set of 3108 samples, performing feature extraction to identify biomarkers—specifically CpG sites and genes relevant for subtype-based classification.
SVM models are ideally suited to high-dimensional and low-sample-size omics data and have been widely applied to gene expression data analysis due to their robustness in high-dimensional, low-sample-size contexts. Brown et al. first demonstrated the effectiveness of SVMs in classifying cancer types using microarray gene expression data, and the models exhibited strong performance even when the number of genes vastly exceeded the number of samples [24]. Chu and Wang further validated the use of SVMs for gene expression-based classification in biomedical contexts, emphasizing their ability to handle complex, high-dimensional feature spaces [25]. In our study, various models with different kernel parameters were executed using the training sets from both the methylation and mRNA data. Five-fold cross-validation was performed to ensure realistic accuracy estimates. We used cost-based classification (C–classification) with a radial basis function (RBF) kernel. Cost (C) values were swept from 2 1 to 2 4 , and gamma ( γ ) values from 10 10 to 10 2 in exponential steps (i.e., 10 10 , 10 9 , , 10 2 ). Optimal ( C , γ ) pairs were chosen by five-fold cross-validation. The selected models were saved and subsequently loaded for evaluation on the test set. The best-performing models were then evaluated against the test set of 3108 samples in a blind test without prior knowledge of their subtypes.

2.6. Limitations of Existing Approaches and Rationale for Our Strategy

Traditional single-omics or morphology-only workflows face three major shortcomings. First, histology alone can miss clinically relevant molecular subtypes, generating diagnostic ambiguity and inconsistent treatment decisions [2,3,4]. Second, each single-omics platform captures only a slice of tumor biology, so analyses are susceptible to platform-specific bias [10]. Third, without cross-validation across molecular layers, it is difficult to separate true biological signals from modality-specific artifacts. Our multimodal framework integrates gene expression and DNA methylation data, enabling robust cross-platform validation of tumor classes and higher-resolution subtype discovery.

3. Results

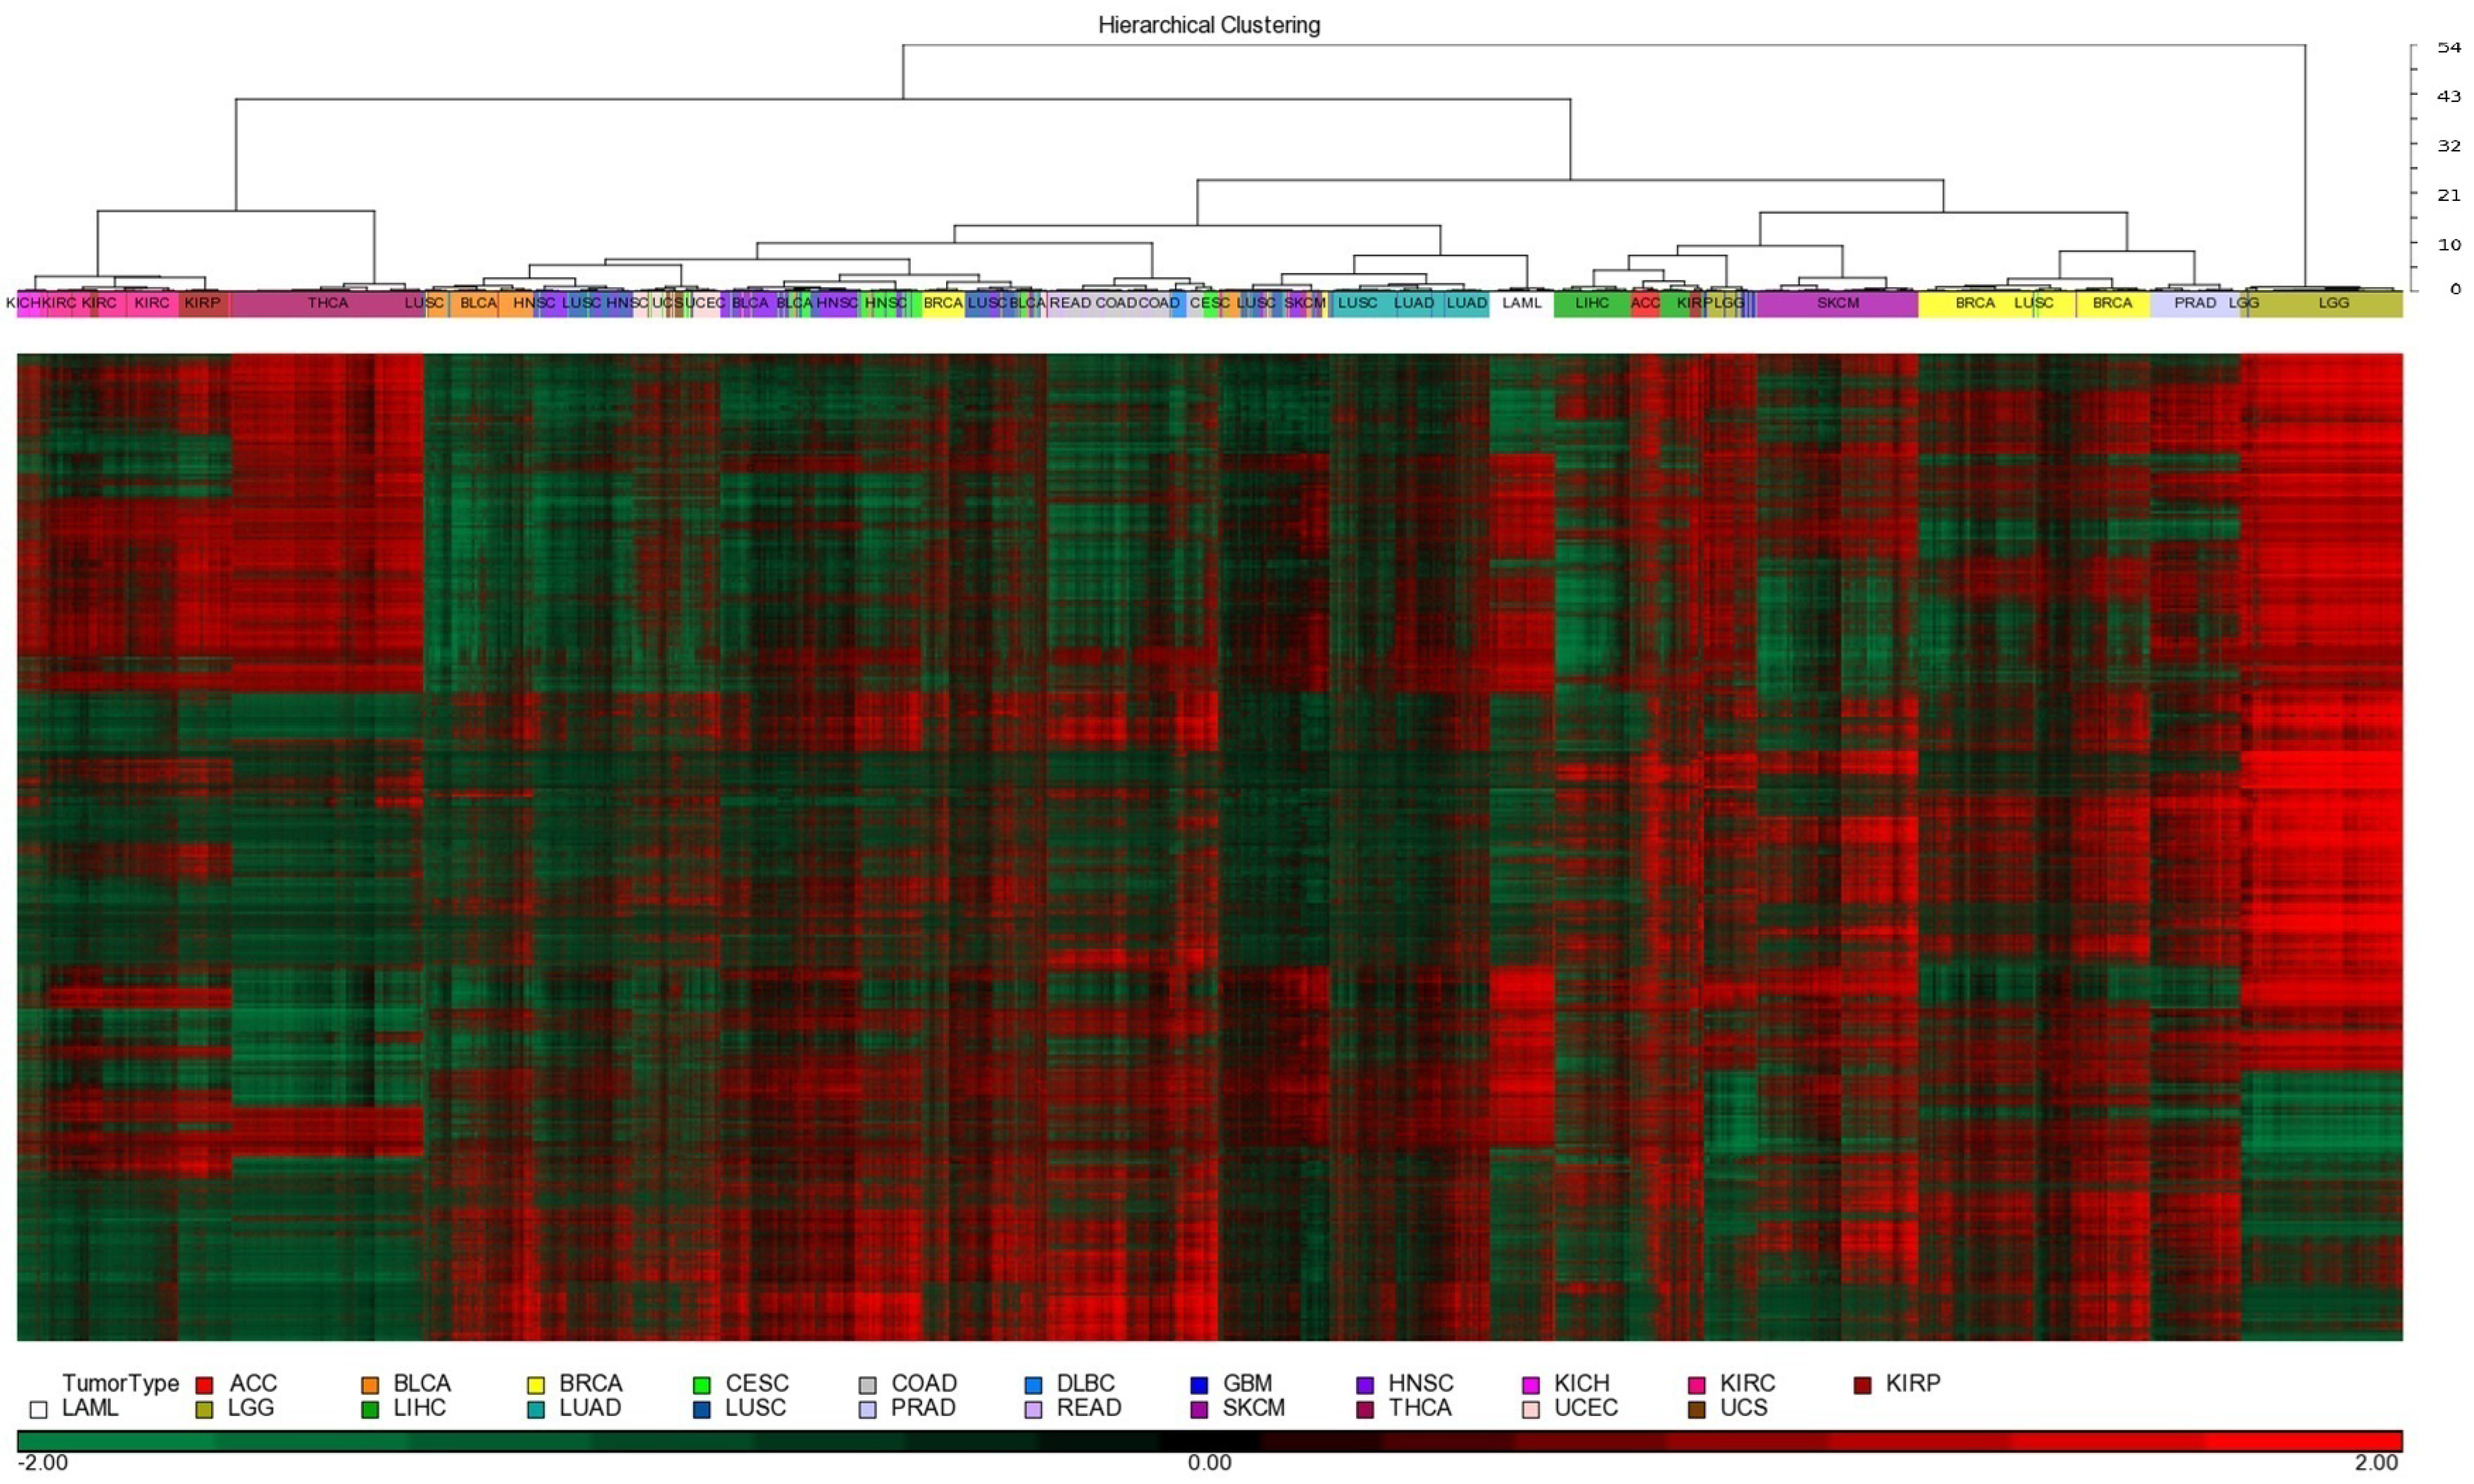
3.1. Patient Samples, Molecular Platforms, and Clustering

To develop a molecular taxonomy for tumor classification, we focused on the two most informative platforms (RNA sequencing (RNA-seq) and DNA methylation profiling) and assessed their reliability in classifying tumor types. Individually, mRNA expression and methylation profiles were insufficient for accurate classification of every profiled tumor type [10], but these two platforms complement each other when combined.
We performed unsupervised hierarchical clustering of the 10,000 most variable CpG probes to identify a diverse set of methylation signatures (Figure 2). The silhouette and gap statistics analyses of the hierarchical structure of the subgroup indicated that the optimal number of methylation signatures ranged from k = 16 to k = 22. Empirical testing identified 22 as the most stable, since the expansion of subgroups yielded a small relative change in tumor classification. The 22 methylation signatures correlated well with histology-based classification of cancer tissue origin: blood, skin, thyroid, brain, and adrenal. For tumors where epigenetic remodeling is a driver of tumor initiation, methylation signatures corresponded well with tumor classifications defined in the WHO 2021 classification system [26,27], such as IDH mutation-driven IDH wildtype (GBM) and IDH mutant gliomas (astrocytoma and oligodendroglioma). Previously, lower-grade gliomas (LGGs) were defined as gliomas classified as grade 2 or grade 3 according to the WHO 2016 CNS4 classification system without considering the mutational status of the IDH gene. However, for some cancer types, there is poor resolution of tissue or cell of origin: lung squamous cell carcinoma (LUSC), lung adenocarcinoma (LUAD), kidney renal clear cell carcinoma (KIRC), kidney renal papillary cell carcinoma (KIRP), chromophobe renal cell carcinoma (KICH), acute myeloid leukemia (LAML), uterine carcinosarcoma (UCS), etc.
Unsupervised hierarchical clustering of the 10,000 most variably expressed genes revealed distinct signatures. According to silhouette and gap statistics, we chose 22 clusters to match those identified in the methylation data. RNA expression signatures generally aligned with the tissue of origin for most profiled cancers. However, some tumor types, notably squamous cell carcinomas of the lung, head and neck, cervix, and uterus, did not segregate distinctly and showed overlap with bladder and lung cancer profiles. Based on RNA profiling, a greater number of tumor samples were grouped into the 22 discrete clusters compared to clustering based on methylation data.

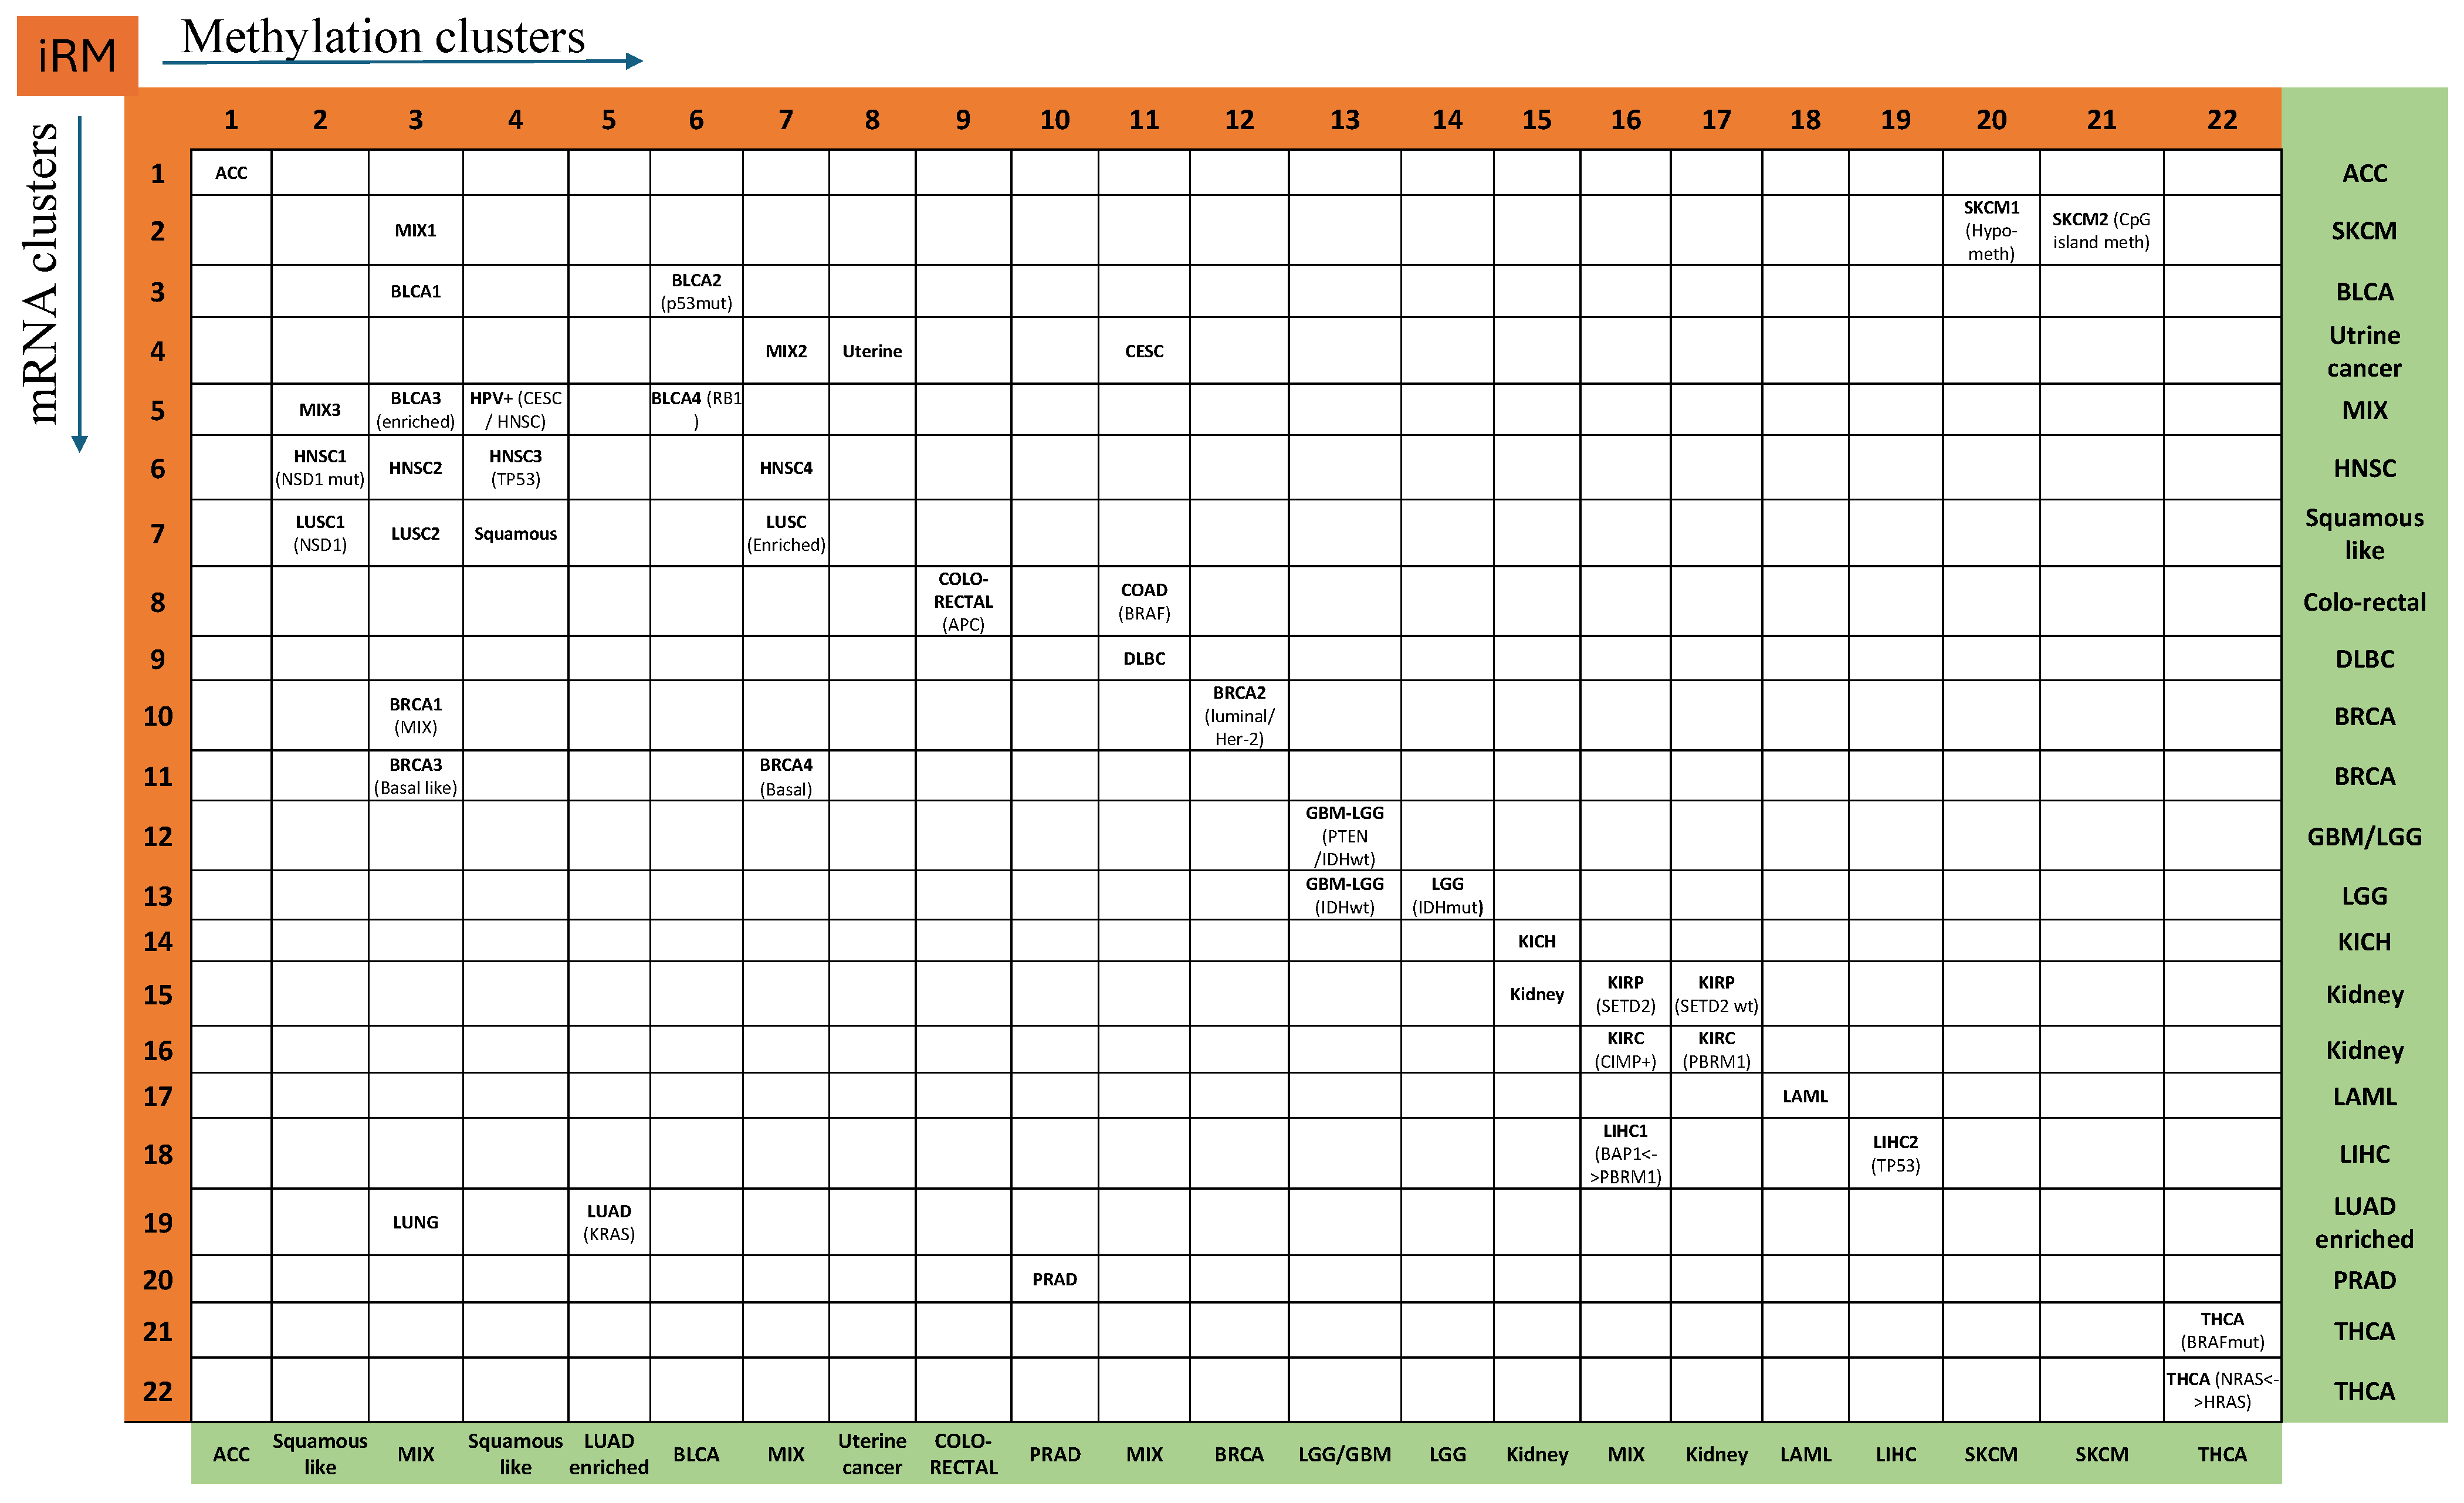
3.2. Integrated RNA and Methylation (iRM) Molecular Taxonomy

To increase the resolution and accuracy of identifying the tumor tissue of origin, we integrated the RNA and methylation signatures, referred to as integrated RNA and methylation (iRM) signatures, revealing 45 iRM classes populated by at least 10 samples. Overall, 6101 of the 6216 patient samples (98.1%) fell within the 45 iRM classes, with the remaining 115 samples (1.9%) segregating to iRM classes populated by <10 samples. The nomenclature of the iRM classes was designated according to the dominant tumor type, under the condition that it represented > 90% of the members of the iRM. Out of the 45 iRM classes, 36 were populated by a predominant tumor type.

3.3. Clinically Significant iRM Signatures

We examined the tumor types and iRMs for associations with mutational signatures, which can confer clinically relevant information with respect to patient treatment. We investigated the association of the iRMs with clinical data (survival) and identified diagnostic tumor subtypes (molecular basis for subtypes) by integrating the mutated genes. For each integrative analysis, we only considered the subtypes (mRNA and methylation) within each tumor type. To investigate the clinical relevance of integrative methylation and mRNA subtypes, we performed Kaplan–Meier survival analysis on the integrative mRNA and methylation subtypes.
In the case of HNSC, methylation signature 4 and the mRNA data split the samples into clusters 5 and 6 (R5-M4, R6-M4, and R7-M4), as shown in Figure 3. R5-M4 is associated with good survival, while R6-M4 is associated with poor survival. mRNA split HNSC into clusters 5, 6, and 7 (R5-M4, R6-M2, R6-M3, R6-M4, R6-M7, R7-M2, and R7-M7). Cluster 5 (R5-M4) is 100% HPV-positive, while clusters 6 and 7 are 97% HPV-negative. R7-M2 and R7-M7 are 100% smokers. HNSC converged to either the CESC group (row 5 with iRM of R5-M4) or the LUSC group (rows 6 and 7 with iRM of R6-M7 and R7-M7). iM6-M4 is associated with a higher frequency of mutations in genes such as TP53, FAT1, CDKN2A, and NOTCH1 than the other subtypes, R5-M4 and R7-M4, whereas R5-M4 is characterized by a low frequency of those mutated genes in R6-M4 and R7-M4 and is associated with good survival. iM5-M4 has more mutated FGFR3 and B2M.

3.4. Histologic Features of Outlier Samples Based on iRM Signatures

For a subset of the iRM signatures, there is a dominant (usually > 90%) tumor type accompanied by a minority of additional tumor samples of one or more different histological classifications. In particular, colorectal iR8–M9 is populated by 314 tumors, of which 312 are colorectal adenocarcinomas, and the remaining cases are 1 CESC and 1 BLCA, as defined on a clinicopathologic basis. The mutational signature of the BLCA tumor (ID-A20F) is not informative for identifying tissue of origin (Table 1). Histological examination of the H&E sections revealed that the A20F tumor sample resembles adenocarcinoma with malignant gland formation (Figure 4). Primary adenocarcinoma of the urinary bladder is uncommon (1–2%) and is a source of diagnostic confusion, as adenocarcinomas can arise in adjacent organs, particularly the colon. Therefore, it is of interest that among the rare and misclassified tumors in the colorectal adenocarcinoma group, there exists a tumor that has a diagnosis of BLCA with characteristics of adenocarcinoma. Thus, we propose that the BLCA sample ID-A20F possesses both the molecular signature and histology of adenocarcinoma.
The COAD iR8–M11 signature consists of 38 colorectal tumors and 2 CESC tumors. The two CESC tumors (ID-A69B and ID-A3GM) do not have the most frequently mutated COAD genes (APC and TP53). Examination of tumor histology revealed an adenocarcinoma pathology (Figure 4), rather than squamous features of CESC, supporting an adenocarcinoma molecular signature. Adenocarcinomas make up 10–15% of cervical cancer, indicating that these cervical cancers showing adenocarcinoma are interestingly clustered on a molecular basis with colorectal adenocarcinoma.
The KIRC iR16–M17 consists of 264 kidney tumors histologically classified as 262 KIRC and 2 KIRP, both originating in the kidney. One of the KIRP tumors possesses two mutations (VHL and BAP1) that frequently occur in KIRCs but are typically absent in KIRP (Table 1), raising the possibility of histologic misclassification. The BLCA iR3–M6 signature consists of 200 samples that were histologically classified as 197 BLCA and 3 KIRP. The kidneys and bladder are part of the urinary system, and similarities in transitional cell carcinoma between these organs may contribute to histopathological misclassification. We observed that one of the KIRPs (ID-7130) possesses three mutations (KDM6A, FGFR3, and STAG2) that are frequently observed in BLCAs but are absent in KIRP (Table 1). Histological examination revealed that KIRP ID-7287 exhibits transitional cell characteristics, reminiscent of BLCA transitional cells. Transitional cell cancer is rare in the kidneys but does occur (7%), and it is again interesting that a KIRP sample that clusters with BLCA on a molecular basis indeed exhibits histological features shared by BLCA.
Within the HNSC R6M2 signature of 82 tumors, there were three bladder cancers. We observed that the BLCA sample ID-A3IB was unusual for bladder cancer due to squamous differentiation, including the presence of squamous pearls (Figure 3). These are hallmark features of squamous carcinomas and are consistent with the iRM allocation of this BLCA sample to head and neck squamous carcinoma.

3.5. Classification to Identify Misclassified Samples

We systematically analyzed the molecular factors that affect classification accuracy by varying the kernel parameters in our models. “Stray samples”, defined as samples belonging to subtypes with fewer than five instances within a tumor type, were removed from the training set but retained in the testing set. We built classifiers using the training data and calculated the classification error rate on the testing data. SVM models were utilized to build models and make predictions. We presented highlights of the test results for a fixed set of parameters; although varying these parameters improved the results in certain cases, finding the optimal parameters to achieve the highest classification accuracy was computationally intensive. Therefore, we restricted our analysis to a specific range of parameters that produced satisfactory results.

3.6. mRNA-Based Misclassification Identification

The SVM-based classification test using mRNA data achieved a classification accuracy of 97%. Most misclassified samples were consistent across different numbers of features; for instance, 91% of the same misclassified samples occurred between models using 700 and 800 features. The misclassified samples were mainly the “stray samples” in the test set; for example, for mRNA with 800 features, 30 out of 90 stray samples were misclassified, and the total number of misclassified samples was 97. Another significant source of misclassified samples originated from clusters containing mixed tumor types. Clusters composed of a single tumor type were classified most accurately. The learning process may have been affected by the diversity of tumor types within a cluster.

3.7. Methylation-Based Misclassification Identification

Training and testing using methylation data produced the highest accuracy of approximately 95.4%. Most misclassified samples were common across different numbers of features, with 94% of the same misclassified samples occurring between models using 700 and 800 features. The misclassified samples were predominantly the “stray samples” in the test set. There were 12 misclassified samples common between methylation and mRNA data when using 800 features, representing about 0.4% of the total samples. Of these 12 samples, 5 were “stray samples.” Removing outliers from both the mRNA and methylation datasets improved the test accuracy by approximately 1%.

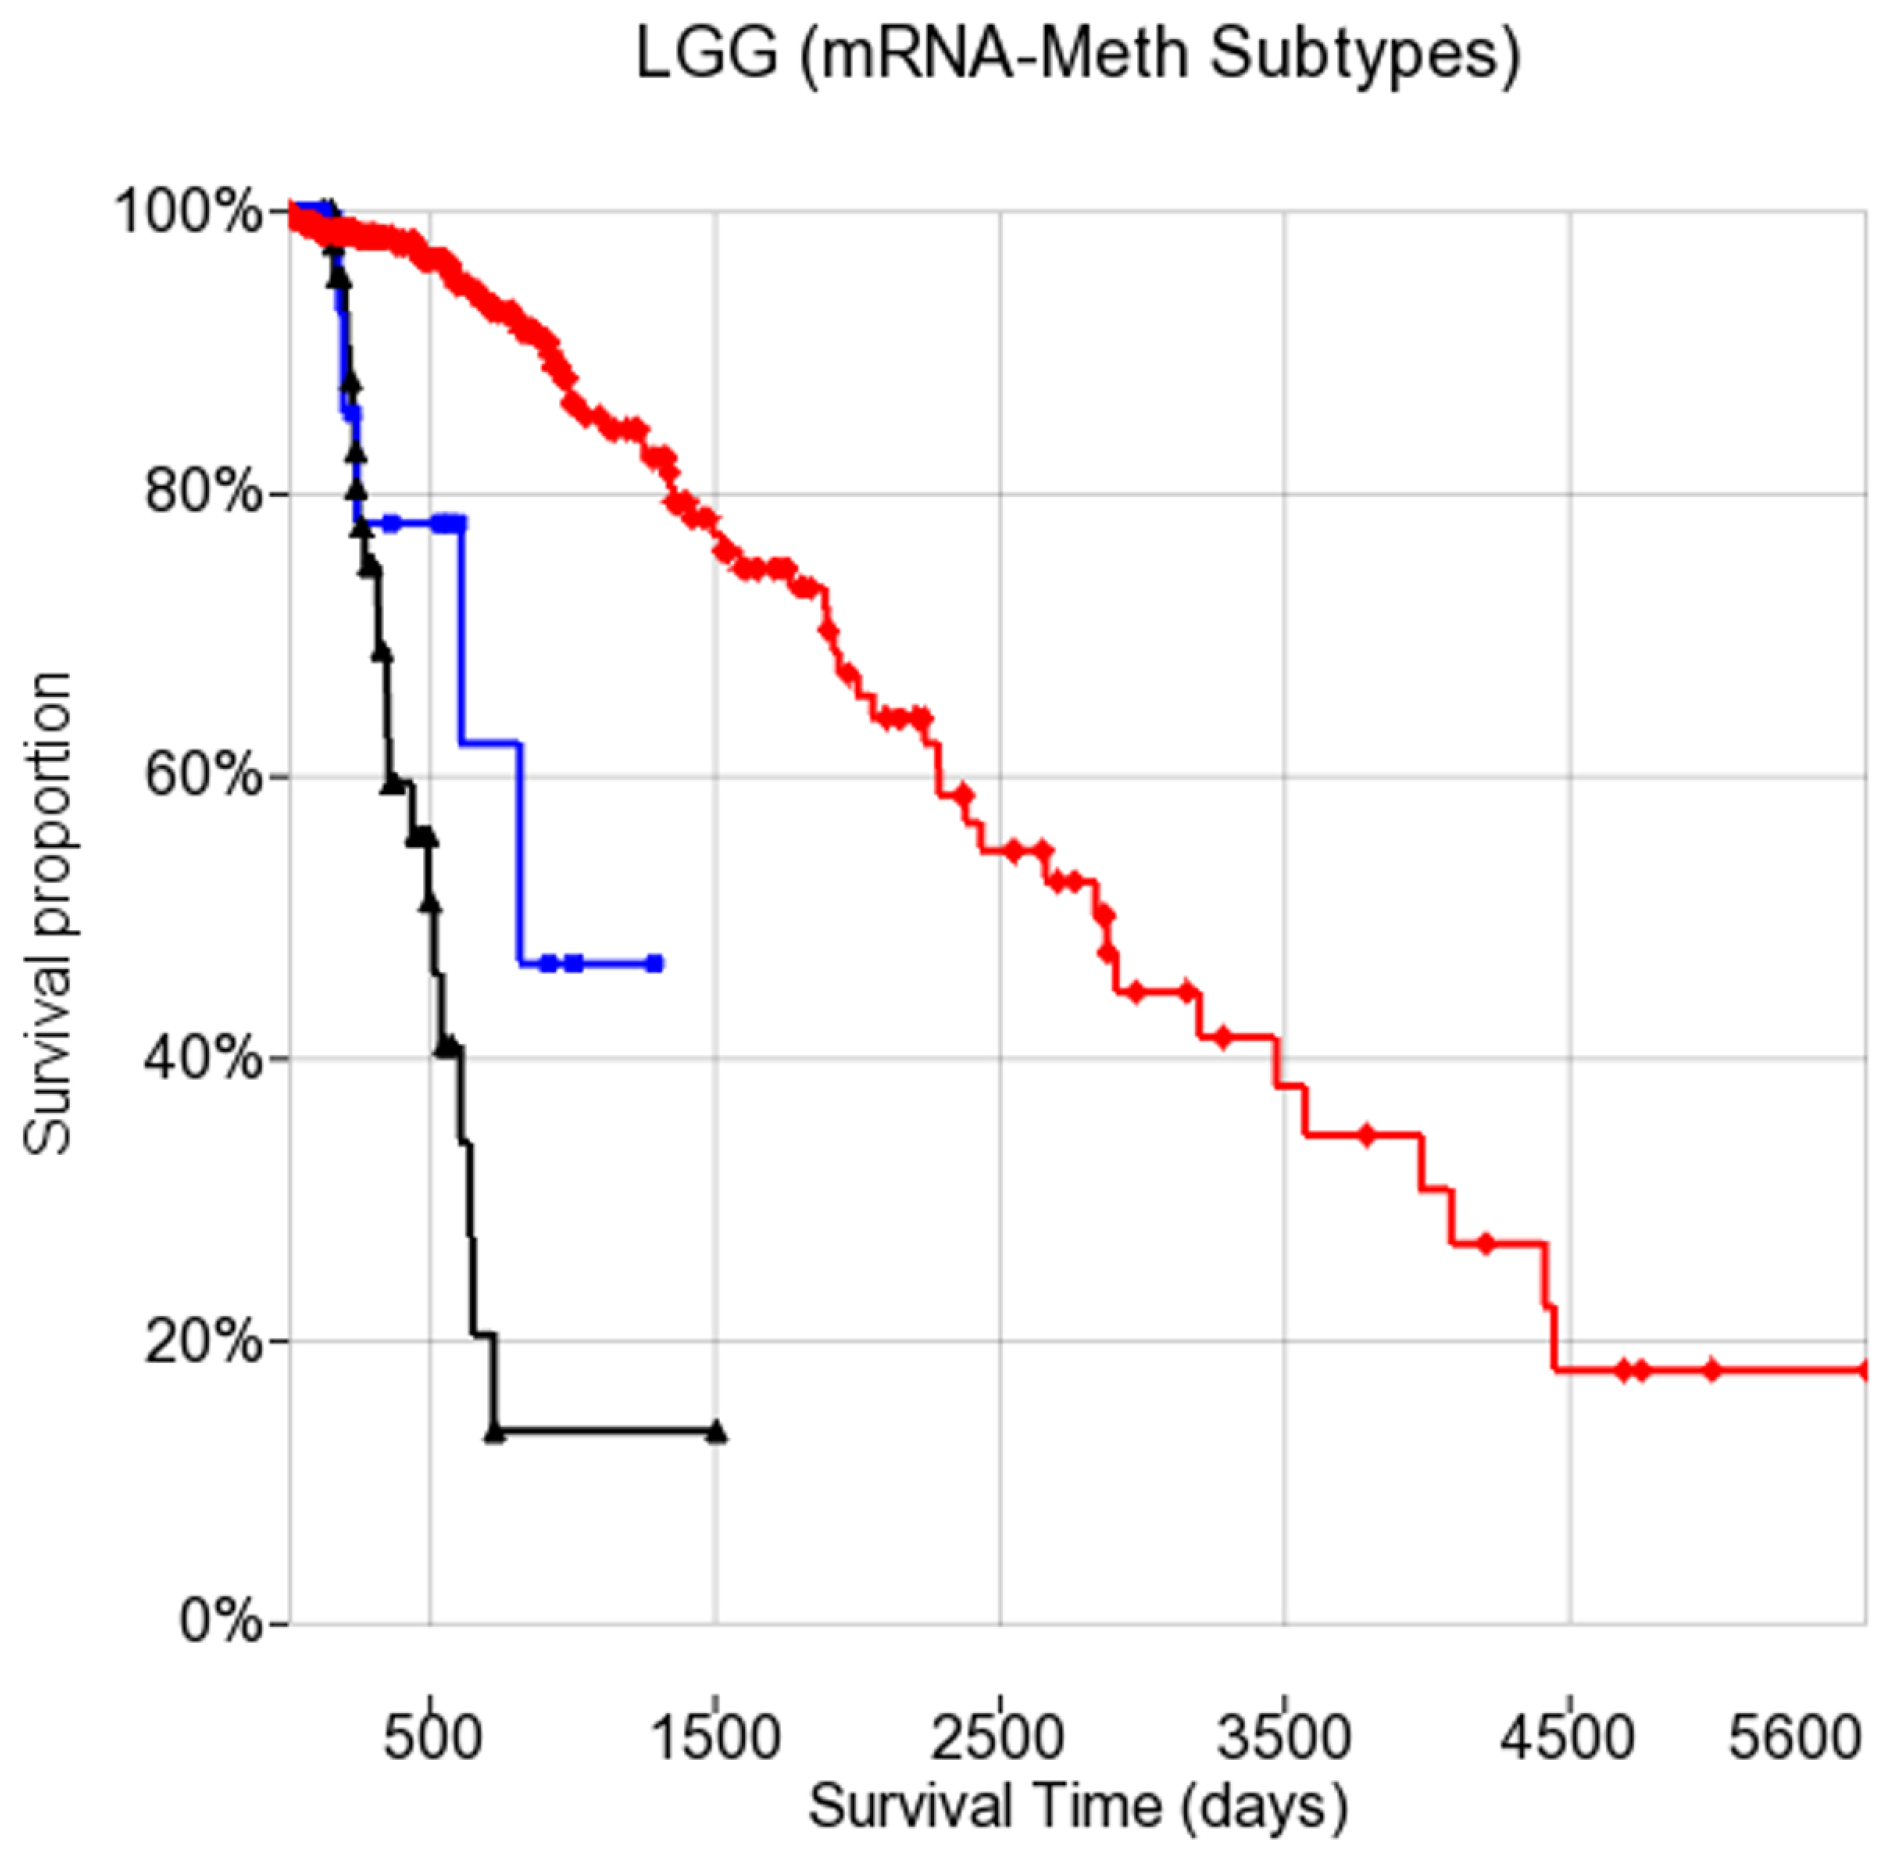
3.8. Subtype Analysis

We elucidated known molecular characteristics of LGG to confirm prior findings [28]. Methylation patterns split LGG into two clusters (columns 13 and 14) based on IDH status (R13–M14 is an IDH mutant group, while column 13 is for IDH wt). Methylation clusters corresponded well with known molecular subtypes based on IDH status. The mRNA patterns divided LGG into two rows (rows 12 and 13) for the fixed column of 13. We compared these three groups of LGG split by mRNA and methylation. Figure 5 shows a Kaplan–Meier diagram with the survival statistics of the integrative subtype (RNA–methylation). We evaluated the associations of those integrative subtypes with clinical data. In Figure 5, it can be seen that there are clear survival differences between R13–M14 and the other two subtypes (R12–M13 and R13–M13), where R12–M13 is associated with poor survival while R13–M14 has better survival.
We generated a table of mutated genes for the integrated methylation and mRNA subtypes to ascertain whether they correspond to the molecular subtype of LGG. Table 2 shows the number of mutated genes for each integrative subtype. p-values were calculated to assess the statistical significance using the function `chisq.test` in Bioconductor. We only present the genes with p-values of less than 0.05. Genes were also ranked based on p-values, with the smallest values at the top. We observed a high degree of correlation between the integrative mRNA and methylation subtypes and somatic mutations. Somatic mutations separate R13–M14 from other mRNA and methylation subtypes. It can be seen in Table 2 that R12–M13 has a higher frequency of mutated EGFR and PTEN. R13–M14 has better survival and a higher frequency of mutated gene groups such as IDH1, IDH2, TP53, ATRX, and CIC. This may have important clinical implications for the mRNA subtype assignment of LGG, since they correspond to certain molecular subtypes with different clinical outcomes and a higher frequency of mutations in EGFR and PTEN in R12–M13 than in R13–M13. The high mutation frequency of the genes in Table 2 for LGG is consistent with previous reports [28].

4. Discussion

In our study, we proposed a multimodal strategy combining gene expression with epigenetic data to provide a more objective basis for tumor classification, which is particularly important in clinical scenarios where histological ambiguities exist. Our analysis demonstrated classification accuracies of 97% and 95.4% for mRNA and DNA methylation data, respectively. The integration of these modalities resulted in improved detection of misclassified samples, with cross-platform consistency supporting the reliability of our approach.
Initially, we identified mRNA and 450K methylation signatures to map methylation and mRNA profiles to tumor subtypes, based on single-platform clustering analyses. We performed subtype integration and classification analysis to enhance tumor classification accuracy and identify potential misclassifications. The integration of gene expression and DNA methylation profiling represents a strategic approach to uncovering discrepancies that may be overlooked by conventional histological methods.
By creating reproducible workflows for clustering 450K methylation and mRNA data, we were able to identify tumor subtypes, analyze these subtypes in correlation with molecular profiles, and perform subtype classification using predictive modeling and validation. A total of 6216 samples across 22 tumor types were evaluated from TCGA, with the most variable 10,000 CpG methylation sites and genes selected for analysis.
After segregating all 22 cancers into discrete clusters based on CpG methylation and RNA expression, we investigated whether the identified subtypes were associated with patient outcomes and molecular subtypes based on genetic mutations. Hierarchical clustering was used to identify methylation and mRNA subtypes, utilizing the most variable CpGs and genes after performing quality control and comprehensive exploratory data analysis. The mRNA datasets clustered into significant major groups associated with cancer types and preserved more cluster relationships within tumor types compared to the methylation data. In contrast, the methylation clusters exhibited more diverse cancer-type compositions, indicating higher biological variability.
By correlating integrative subtypes with somatic mutation data and patient outcomes, we demonstrated that misclassified tumors based on traditional histology could be re-evaluated using molecular signatures. For instance, papillary renal cell carcinoma samples that clustered with bladder cancer were re-assigned based on consistent molecular and mutational profiles, underscoring the clinical relevance of our strategy.
Specifically, head and neck squamous cell carcinoma (HNSC) and bladder cancer (BLCA) exhibited high levels of divergence, splitting into many methylation subtypes. This led to higher genomic instability and higher misclassification error rates in HNSC and BLCA than in other tumor types. However, we observed a high degree of correlation between integrative subtypes and somatic mutations for all subtype combinations in HNSC. Tumors such as adrenocortical carcinoma (ACC), acute myeloid leukemia (LAML), and prostate adenocarcinoma (PRAD) mainly belonged to single cancer-type clusters (single tissue clusters), which had low genomic instability and low misclassification error rates.
Our integrated analysis of mRNA and methylation subtypes with somatic mutation data provided significant information for predicting overall survival in the subtypes of each tumor type. For example, the integrated subtype of papillary renal cell carcinoma (KIRP) (R15–M16) was associated with a higher frequency of mutations in the NF2, FAT1, MLL2, PBRM1, and SETD2 genes, correlating with poor survival. Conversely, mutations in genes such as TP53, PIK3CA, and NF1 were associated with improved survival in the R10–M3 subtype of breast cancer (BRCA). These findings underscore the importance of integrating genetic and epigenetic data to identify biologically distinct subtypes that may not be distinguishable through histological examination alone. A recent survey by Tran et al. [29] highlights how multi-omics integration with clinical variables can improve survival prediction and support more tailored patient management strategies.
Molecular profiling can provide important and clinically relevant biological markers (biomarkers), particularly when applied to tumor classification [12]. In this regard, the German Cancer Research Center (DKFZ) recently developed a DKFZ methylation classifier based on an unsupervised learning approach to perform central nervous system tumor diagnosis and identify brain tumors [7]. Furthermore, another recent methylation-based classifier, developed using a supervised approach, accurately predicted certain prognostic and predictive biomarkers in gliomas [10]. Recent studies [30,31,32,33] have shown that DNA methylation profiling is a potentially useful tool for producing reliable molecular classifications that can help guide the selection of appropriate cancer treatments.
In addition, other approaches in the literature have also focused on integrating multi-omics data, using different computational frameworks. For example, deep learning architectures have been used to combine histopathological imaging with molecular profiles. Coudray et al. [34] demonstrated that deep learning models can accurately classify lung cancer histopathology images and that the integration of genomic data further improved predictive precision. Similarly, Chaudhary [35] used ensemble deep learning approaches to integrate multi-omics data, enhancing prognostic predictions in liver cancer. Furthermore, Campanella et al. [36] applied weakly supervised deep learning methods to achieve clinical-grade computational pathology. Graph machine learning methods have matured rapidly, and Valous et al. [37] provided a comprehensive overview.
However, achieving robust and accurate subtype classification is challenging and computationally demanding. We systematically analyzed the factors affecting classification accuracy by developing reproducible workflows and implementing realistic variable selection through the separation of training and test datasets. SVM models were utilized, achieving a high classification accuracy of 97% for mRNA data and 95.4% for 450K methylation-based subtype classification. These high accuracies indicate the effectiveness of our strategies in identifying misclassified samples.
Our integrated approach, which combines the strengths of both mRNA and methylation analyses, provides a rigorous framework for identifying outlier samples. This strategy is especially valuable when the histological characteristics are ambiguous, serving as an internal quality control check that can guide subsequent clinical evaluation and treatment planning. These findings pave the way for future clinical applications where molecular profiling is routinely incorporated as a complementary tool to traditional histopathology, thereby reducing diagnostic errors.
Limitations: The present work, while demonstrating the value of multimodal profiling, has several important limitations. First, it relies on frozen deidentified TCGA specimens; artifacts that arise in routine formalin-fixed paraffin-embedded (FFPE) material are therefore underrepresented. Second, tissue-processing variability remains a concern: differences in fixation protocols, extraction chemistries, and sequencing centers can introduce batch effects that shift DNA methylation β values and gene expression counts, potentially reducing the generalizability of the Support Vector Machine boundary. Third, computational demand is nontrivial: training an RBF-kernel SVM grows quadratically with sample size, raising issues of resource allocation and environmental footprint when scaling to very large prospective cohorts.
Future Research: Future work will address these issues on several fronts. A broad PanCancer follow-up study is now being designed to evaluate the performance of the method across a wider spectrum of tumor types and routine laboratory workflows. The planned extensions will also expand the input data beyond mRNA and DNA methylation, integrating imaging-derived features, copy-number profiles, and proteomic measurements to capture additional layers of tumor biology and further reduce misclassification. To make the approach practical for day-to-day clinical use, we will investigate lightweight model compression and approximation strategies that reduce computational load and accelerate inference without compromising accuracy. Finally, methods for handling missing omics modalities, such as the Bu et al. framework for cancer molecular subtyping using limited multi-omics data [38], can reduce cost, tissue availability, and complexity barriers. Incorporating these approaches could improve future workflows.

5. Conclusions

Our study highlights the importance of strategies for identifying cancer misclassification by integrating gene expression and DNA methylation profiling. By applying unsupervised clustering techniques, integrating multi-omics data, and employing supervised classification models with feature selection, we have effectively enhanced tumor classification accuracy and identified misclassified samples. The high classification accuracy achieved by our SVM models demonstrates the effectiveness of these strategies. By developing these strategies for identifying cancer misclassification, we contribute to improved diagnostic precision and offer a framework to incorporate molecular profiling into clinical practice.
In summary, our multimodal profiling strategy significantly enhances tumor classification accuracy by identifying cancer misclassification through the integration of gene expression and DNA methylation profiling. By applying unsupervised clustering, integrating multi-omics data, and employing supervised classification models with rigorous feature selection, we have enhanced tumor classification accuracy and identified misclassified samples. The high classification accuracies achieved by our models highlight the effectiveness of integrating multimodal data in cancer diagnostics.

Author Contributions

Conceptualization, Y.M.; Investigation, Y.M.; Writing—original draft, Y.M. and N.A.; Writing—review & editing, Y.M. and N.A. All authors have read and agreed to the published version of the manuscript.

Funding

This study was supported by the Natural Sciences and Engineering Research Council of Canada (NSERC) under the Discovery Grant (RGPIN-2023-05341).

Data Availability Statement

All data downloaded from the TCGA is publicly available on the Genomic Data Commons (GDC) website (https://portal.gdc.cancer.gov/) (accessed on 20 April 2025).

Conflicts of Interest

There are no conflicts of interest to declare.

References

  1. Siegel, R.; Miller, K.; Jemal, A. Cancer statistics, 2020. CA Cancer J. Clin. 2020, 70, 7–30. [Google Scholar] [CrossRef] [PubMed]
  2. Cibas, E.; Ducatman, B. Cibas and Ducatman’s Cytology: Diagnostic Principles and Clinical Correlates, 6th ed.; Elsevier: Amsterdam, The Netherlands, 2025. [Google Scholar]
  3. Wang, W.; Zhao, Y.; Teng, L.; Yan, J.; Guo, Y.; Qiu, Y.; Ji, Y.; Yu, B.; Pei, D.; Duan, W.; et al. Neuropathologist-level integrated classification of adult-type diffuse gliomas using deep learning from whole-slide pathological images. Nat. Commun. 2023, 14, 6359. [Google Scholar] [CrossRef] [PubMed]
  4. Jiang, G.; Wang, Z.; Cheng, Z.; Wang, W.; Lu, S.; Zhang, Z.; Anene, C.; Khan, F.; Chen, Y.; Bailey, E.; et al. The integrated molecular and histological analysis defines subtypes of esophageal squamous cell carcinoma. Nat. Commun. 2024, 15, 8988. [Google Scholar] [CrossRef] [PubMed]
  5. Moran, S.; Martínez-Cardús, A.; Sayols, S.; Musulén, E.; Balañá, C.; Estival-Gonzalez, A.; Moutinho, C.; Heyn, H.; Diaz-Lagares, A.; de Moura, M.; et al. Epigenetic profiling to classify cancer of unknown primary: A multicentre, retrospective analysis. Lancet Oncol. 2016, 17, 1386–1395. [Google Scholar] [CrossRef]
  6. Elmore, J.; Longton, G.; Carney, P.; Geller, B.; Onega, T.; Tosteson, A.; Nelson, H.; Pepe, M.; Allison, K.; Schnitt, S.; et al. Diagnostic concordance among pathologists interpreting breast biopsy specimens. JAMA 2015, 313, 1122–1132. [Google Scholar] [CrossRef]
  7. Capper, D.; Jones, D.; Sill, M.; Hovestadt, V.; Schrimpf, D.; Sturm, D.; Koelsche, C.; Sahm, F.; Chavez, L.; Reuss, D.; et al. DNA methylation-based classification of central nervous system tumours. Nature 2018, 555, 469–474. [Google Scholar] [CrossRef]
  8. Berger, A.; Korkut, A.; Kanchi, R.; Hegde, A.; Lenoir, W.; Liu, W.; Liu, Y.; Fan, H.; Shen, H.; Ravikumar, V.; et al. A comprehensive pan-cancer molecular study of gynecologic and breast cancers. Cancer Cell 2018, 33, 690–705.e9. [Google Scholar] [CrossRef]
  9. Sturm, D.; Capper, D.; Andreiuolo, F.; Gessi, M.; Kölsche, C.; Reinhardt, A.; Sievers, P.; Wefers, A.; Ebrahimi, A.; Suwala, A.; et al. Author Correction: Multiomic neuropathology improves diagnostic accuracy in pediatric neuro-oncology. Nat. Med. 2024, 30, 306. [Google Scholar] [CrossRef]
  10. Yang, J.; Wang, Q.; Zhang, Z.; Long, L.; Ezhilarasan, R.; Karp, J.; Tsirigos, A.; Snuderl, M.; Wiestler, B.; Wick, W.; et al. DNA methylation-based epigenetic signatures predict somatic genomic alterations in gliomas. Nat. Commun. 2022, 13, 4410. [Google Scholar] [CrossRef]
  11. Weinstein, J.; Collisson, E.; Mills, G.; Shaw, K.; Ozenberger, B.; Ellrott, K.; Shmulevich, I.; Sander, C.; Stuart, J.; The Cancer Genome Atlas Research Network. The Cancer Genome Atlas Pan-Cancer analysis project. Nat. Genet. 2013, 45, 1113–1120. [Google Scholar] [CrossRef]
  12. Hoadley, K.; Yau, C.; Wolf, D.; Cherniack, A.; Tamborero, D.; Ng, S.; Leiserson, M.; Niu, B.; McLellan, M.; Uzunangelov, V.; et al. Multiplatform analysis of 12 cancer types reveals molecular classification within and across tissues of origin. Cell 2014, 158, 929–944. [Google Scholar] [CrossRef] [PubMed]
  13. Overby, C.; Tarczy-Hornoch, P. Personalized Medicine: Challenges and Opportunities for Translational Bioinformatics. Per. Med. 2013, 10, 453–462. [Google Scholar] [CrossRef] [PubMed]
  14. Reuss, D.; Mamatjan, Y.; Schrimpf, D.; Capper, D.; Hovestadt, V.; Kratz, A.; Sahm, F.; Koelsche, C.; Korshunov, A.; Olar, A.; et al. IDH mutant diffuse and anaplastic astrocytomas have similar age at presentation and little difference in survival: A grading problem for WHO. Acta Neuropathol. 2015, 129, 867–873. [Google Scholar] [CrossRef] [PubMed]
  15. Mamatjan, Y.; Agnihotri, S.; Goldenberg, A.; Tonge, P.; Mansouri, S.; Zadeh, G.; Aldape, K. Molecular Signatures for Tumor Classification: An Analysis of The Cancer Genome Atlas Data. J. Mol. Diagn. 2017, 19, 881–891. [Google Scholar] [CrossRef]
  16. Argelaguet, R.; Velten, B.; Arnol, D.; Dietrich, S.; Zenz, T.; Marioni, J.; Buettner, F.; Huber, W.; Stegle, O. Multi-Omics Factor Analysis—a framework for unsupervised integration of multi-omics data sets. Mol. Syst. Biol. 2018, 14, e8124. [Google Scholar] [CrossRef]
  17. Taskesen, E.; Babaei, S.; Reinders, M.; de Ridder, J. Integration of gene expression and DNA-methylation profiles improves molecular subtype classification in acute myeloid leukemia. BMC Bioinform. 2015, 16, S5. [Google Scholar] [CrossRef]
  18. Tanvir, R.; Islam, M.; Sobhan, M.; Luo, D.; Mondal, A. MOGAT: A Multi-Omics Integration Framework Using Graph Attention Networks for Cancer Subtype Prediction. Int. J. Mol. Sci. 2024, 25, 2788. [Google Scholar] [CrossRef]
  19. Wu, J.; Chen, Z.; Xiao, S.; Liu, G.; Wu, W.; Wang, S. DeepMoIC: Multi-Omics Data Integration via Deep Graph Convolutional Networks for Cancer Subtype Classification. BMC Genom. 2024, 25, 1209. [Google Scholar] [CrossRef]
  20. Waqas, A.; Tripathi, A.; Ahmed, S.; Mukund, A.; Farooq, H.; Schabath, M.; Stewart, P.; Naeini, M.; Rasool, G. SeNMo: A self-normalizing deep learning model for enhanced multi-omics data analysis in oncology. arXiv 2024, arXiv:2405.08226. Available online: https://arxiv.org/abs/2405.08226 (accessed on 10 June 2025). [Google Scholar] [CrossRef]
  21. Hoadley, K.; Yau, C.; Hinoue, T.; Wolf, D.; Lazar, A.; Drill, E.; Shen, R.; Taylor, A.; Cherniack, A.; Thorsson, V.; et al. Cell-of-origin patterns dominate the molecular classification of 10,000 tumors from 33 types of cancer. Cell 2018, 173, 291–304.e6. [Google Scholar] [CrossRef]
  22. Haibe-Kains, B.; Adam, G.; Hosny, A.; Khodakarami, F.; Massive Analysis Quality Control (MAQC) Society Board of Directors; Waldron, L.; Wang, B.; McIntosh, C.; Goldenberg, A.; Kundaje, A.; et al. Transparency and reproducibility in artificial intelligence. Nature 2020, 586, E14–E16. [Google Scholar] [CrossRef] [PubMed]
  23. The Cancer Genome Atlas Research Network. The Cancer Genome Atlas Program (TCGA) Homepage. 2025. Available online: https://portal.gdc.cancer.gov/ (accessed on 20 April 2025).
  24. Brown, M.; Grundy, W.; Lin, D.; Cristianini, N.; Sugnet, C.; Ares, M.; Haussler, D. Support Vector Machine Classification of Microarray Gene Expression Data; Technical Report UCSC-CRL-99-09; University of California: Santa Cruz, CA, USA, 1999. [Google Scholar]
  25. Chu, F.; Wang, L. Gene expression data analysis using support vector machines. In Proceedings of the International Joint Conference on Neural Networks, Portland, OR, USA, 20–24 July 2003. [Google Scholar] [CrossRef]
  26. Berger, T.; Wen, P.; Lang-Orsini, M.; Chukwueke, U. World Health Organization 2021 Classification of Central Nervous System Tumors and Implications for Therapy for Adult-Type Gliomas: A Review. JAMA Oncol. 2022, 8, 1493–1501. [Google Scholar] [CrossRef] [PubMed]
  27. Louis, D.; Perry, A.; Wesseling, P.; Brat, D.; Cree, I.; Figarella-Branger, D.; Hawkins, C.; Ng, H.; Pfister, S.; Reifenberger, G.; et al. The 2021 WHO Classification of Tumors of the Central Nervous System: A summary. Neuro Oncol. 2021, 23, 1231–1251. [Google Scholar] [CrossRef] [PubMed]
  28. Brat, D.; Verhaak, R.; Aldape, K.; Yung, W.; Salama, S.; Cooper, L.; Rheinbay, E.; Miller, C.; Vitucci, M.; Morozova, O.; et al. Comprehensive, Integrative Genomic Analysis of Diffuse Lower-Grade Gliomas. N. Engl. J. Med. 2015, 372, 2481–2498. [Google Scholar] [CrossRef]
  29. Tran, D.; Nguyen, H.; Pham, V.; Nguyen, P.; Nguyen Luu, H.; Minh Phan, L.; DeStefano, C.; Yeung, S.; Nguyen, T. A comprehensive review of cancer survival prediction using multi-omics integration and clinical variables. Brief Bioinform. 2025, 26, bbaf150. [Google Scholar] [CrossRef]
  30. Zhou, J.; Theesfeld, C.; Yao, K.; Chen, K.; Wong, A.; Troyanskaya, O. Deep learning sequence-based ab initio prediction of variant effects on expression and disease risk. Nat. Genet. 2018, 50, 1171–1179. [Google Scholar] [CrossRef]
  31. Whalen, S.; Schreiber, J.; Noble, W.; Pollard, K. Navigating the pitfalls of applying machine learning in genomics. Nat. Rev. Genet. 2022, 23, 169–181. [Google Scholar] [CrossRef]
  32. Mamatjan, Y. Pan-Cancer Classification System with Explainable AI Interpretation: A Feasibility Study. In Proceedings of the IEEE Congress on Evolutionary Computation (CEC), Yokohama, Japan, 30 June–5 July 2024; pp. 1–6. [Google Scholar] [CrossRef]
  33. Simon, M.; Kuschel, L.; von Hoff, K.; Yuan, D.; Hernáiz Driever, P.; Hain, E.; Koch, A.; Capper, D.; Schulz, M.; Thomale, U.; et al. Rapid DNA methylation-based classification of pediatric brain tumors from ultrasonic aspirate specimens. J. Neurooncol. 2024, 169, 73–83. [Google Scholar] [CrossRef]
  34. Coudray, N.; Ocampo, P.; Sakellaropoulos, T.; Narula, N.; Snuderl, M.; Fenyö, D.; Moreira, A.; Razavian, N.; Tsirigos, A. Classification and mutation prediction from non-small cell lung cancer histopathology images using deep learning. Nat. Med. 2018, 24, 1559–1567. [Google Scholar] [CrossRef]
  35. Chaudhary, K.; Poirion, O.; Lu, L.; Garmire, L. Deep Learning-Based Multi-Omics Integration Robustly Predicts Survival in Liver Cancer. Clin. Cancer Res. 2018, 24, 1248–1259. [Google Scholar] [CrossRef]
  36. Campanella, G.; Hanna, M.; Geneslaw, L.; Miraflor, A.; Werneck Krauss Silva, V.; Busam, K.; Brogi, E.; Reuter, V.; Klimstra, D.; Fuchs, T. Clinical-grade computational pathology using weakly supervised deep learning on whole slide images. Nat. Med. 2019, 25, 1301–1309. [Google Scholar] [CrossRef] [PubMed]
  37. Valous, N.; Popp, F.; Zörnig, I.; Jäger, D.; Charoentong, P. Graph machine learning for integrated multi-omics analysis. Br. J. Cancer 2024, 131, 205–211. [Google Scholar] [CrossRef] [PubMed]
  38. Bu, Y.; Liang, J.; Li, Z.; Wang, J.; Wang, J.; Yu, G. Cancer molecular subtyping using limited multi-omics data with missingness. PLoS Comput. Biol. 2024, 20, e1012710. [Google Scholar] [CrossRef] [PubMed]
Figure 1. Diagram showing the subtype identification, integration, and classification steps.
Electronics 14 02442 g001
Figure 2. Hierarchical clustering of 22 tumor types based on DNA methylation profile.
Electronics 14 02442 g002
Figure 3. Integrated RNA and methylation (iRM) clusters, where the vertical sequence represents RNA clusters (R1–R22), while the horizontal sequence represents methylation-based clusters (M1–M22).
Electronics 14 02442 g003
Figure 4. Outlier detection: histological examination of H&E sections for the outlier (ID: 7130), showing features of both bladder cancer and KIRP.
Electronics 14 02442 g004
Figure 5. Kaplan–Meier diagram showing the survival statistics of combined methylation and mRNA subtypes (noted as mRNA_meth subtype combination) for LGG. The survival time on the x-axis is given in days. For Log-Rank test, Chi-sq (df = 2) = 124.8, p-value = 7.9 × 10 28 . For Wilcoxon-Gehan, Chi-sq (df = 2) = 86, p-value = 1.99 × 10 19 .
Electronics 14 02442 g005
Table 1. Mutational frequencies in BLCA vs. KIRP and misclassified sample IDs.
Gene NameBLCA (N: 366)KIRP (N: 225)Misclassified Sample ID
71307287
KDM6A7661
FGFR35331
STAG238511
BAP1144
PBRM1186
VHL1
CDH171
NSD1214
TP531513
PIK3CA832
# of sequenced samples366153
Table 2. Mutation frequencies in LGG cohorts R12–M13 (n = 64), R13–M13 (n = 26), and R13–M14 (n = 422), with associated P-values.
Gene NameR12–M13R13–M13R13–M14p-Value
IDH10 (0%)0 (0%)401 (96%) 2.1 × 10 86
EGFR25 (40%)6 (24%)2 (1%) 2.9 × 10 33
PTEN20 (32%)1 (4%)4 (1%) 1.3 × 10 24
TP537 (11%)5 (20%)238 (57%) 8.6 × 10 13
NF19 (15%)9 (35%)12 (3%) 2.1 × 10 12
ATRX2 (4%)5 (20%)190 (46%) 1.3 × 10 10
BRAF1 (2%)3 (12%)0 (0%) 5.5 × 10 10
CIC0 (0%)1 (4%)111 (27%) 9.6 × 10 7
ATM0 (0%)2 (8%)3 (1%)0.002
ARID20 (0%)3 (12%)8 (2%)0.002
NOTCH10 (0%)1 (4%)43 (11%)0.02
# of sequenced samples6426422
Disclaimer/Publisher’s Note: The statements, opinions and data contained in all publications are solely those of the individual author(s) and contributor(s) and not of MDPI and/or the editor(s). MDPI and/or the editor(s) disclaim responsibility for any injury to people or property resulting from any ideas, methods, instructions or products referred to in the content.

