1. Introduction
The XCP has garnered widespread attention all over the world as an efficient tool for oceanographic observation. Its core component is a pair of electrodes on the probe. These electrodes leverage Faraday’s law of electromagnetic induction to measure the current generated by seawater cutting the vertical component of the Earth’s magnetic field in the horizontal direction, thereby deducing information about the velocity and direction of ocean currents. In 1970, T. B. Sanford [
1] initiated research efforts in this field. Between 1979 and 1980, T. B. Sanford [
2] and his research team, in collaboration with Sippican Inc., fabricated and sea-tested hundreds of XCPs, achieving preliminary observational outcomes. Subsequently, the company commercialized XCP, leading to its broad application in ocean surveys, including the observation of the rapid overflow water phenomenon in the Denmark Strait [
3].
Ag-AgCl electrodes are widely acknowledged as effective materials for weak signal measurement due to their excellent non-polarization performance [
4]. Currently, there are three predominant methods for fabricating Ag-AgCl electrodes [
5]: electrolytic method [
6,
7], hot-dip coating method [
8,
9,
10], and powder pressing method [
11,
12,
13]. The powder pressing method, which is also the method employed in this study, involves mixing silver (Ag) powder and silver chloride (AgCl) powder in a secret specific ratio, pressing them into a mold to form an Ag-AgCl cylinder, and then cutting and threading it to create the electrode base. In the manufacturing and performance research of XCP electrodes, a method for fabricating XCP electrodes using quasi-nano Ag-AgCl materials [
14] was fabricated and it established an ocean current simulation system for laboratory testing. Scanning electron microscopy results revealed that the AgCl particles within the electrode are less than 500 nanometers, significantly expanding the contact area of the electrode material, which aids in enhancing measurement sensitivity and response speed [
15]. Ref. [
16] also focused on the dynamic and static electrical characteristics of XCP electrodes. For instance, static electrical characteristic testing demonstrated that the electrode drift range is 6.7 nanovolts per second (nv/s), a performance approximately 7.5 times better than the 50 nv/s required by XCP. Dynamic electrical characteristic testing showed that, at a flow velocity of 5.14 cm per second (cm/s), the relative error between the measured electric field and the calculated electric field is 7%, validating the effectiveness of the testing method for XCP laboratory testing.
The research subjects of this paper are four pairs of Ag-AgCl electrodes, namely Electrodes I, II, III, and IV. Electrodes I and II were custom-made by a company, and their product specifications are shown in
Table 1. Electrode III is a self-developed electrode, and Electrode IV is an improved self-developed electrode. The second part will detail the preparation process of Electrode III and the construction of the experimental environment; the fabrication process for Electrode IV is similar, with a more refined control process. The third part compares tests of these four pairs of electrodes, including the electrodes’ self-noise, power spectral density, and frequency response. The fourth part is the summary of this paper.
2. Electrode Design and Fabrication
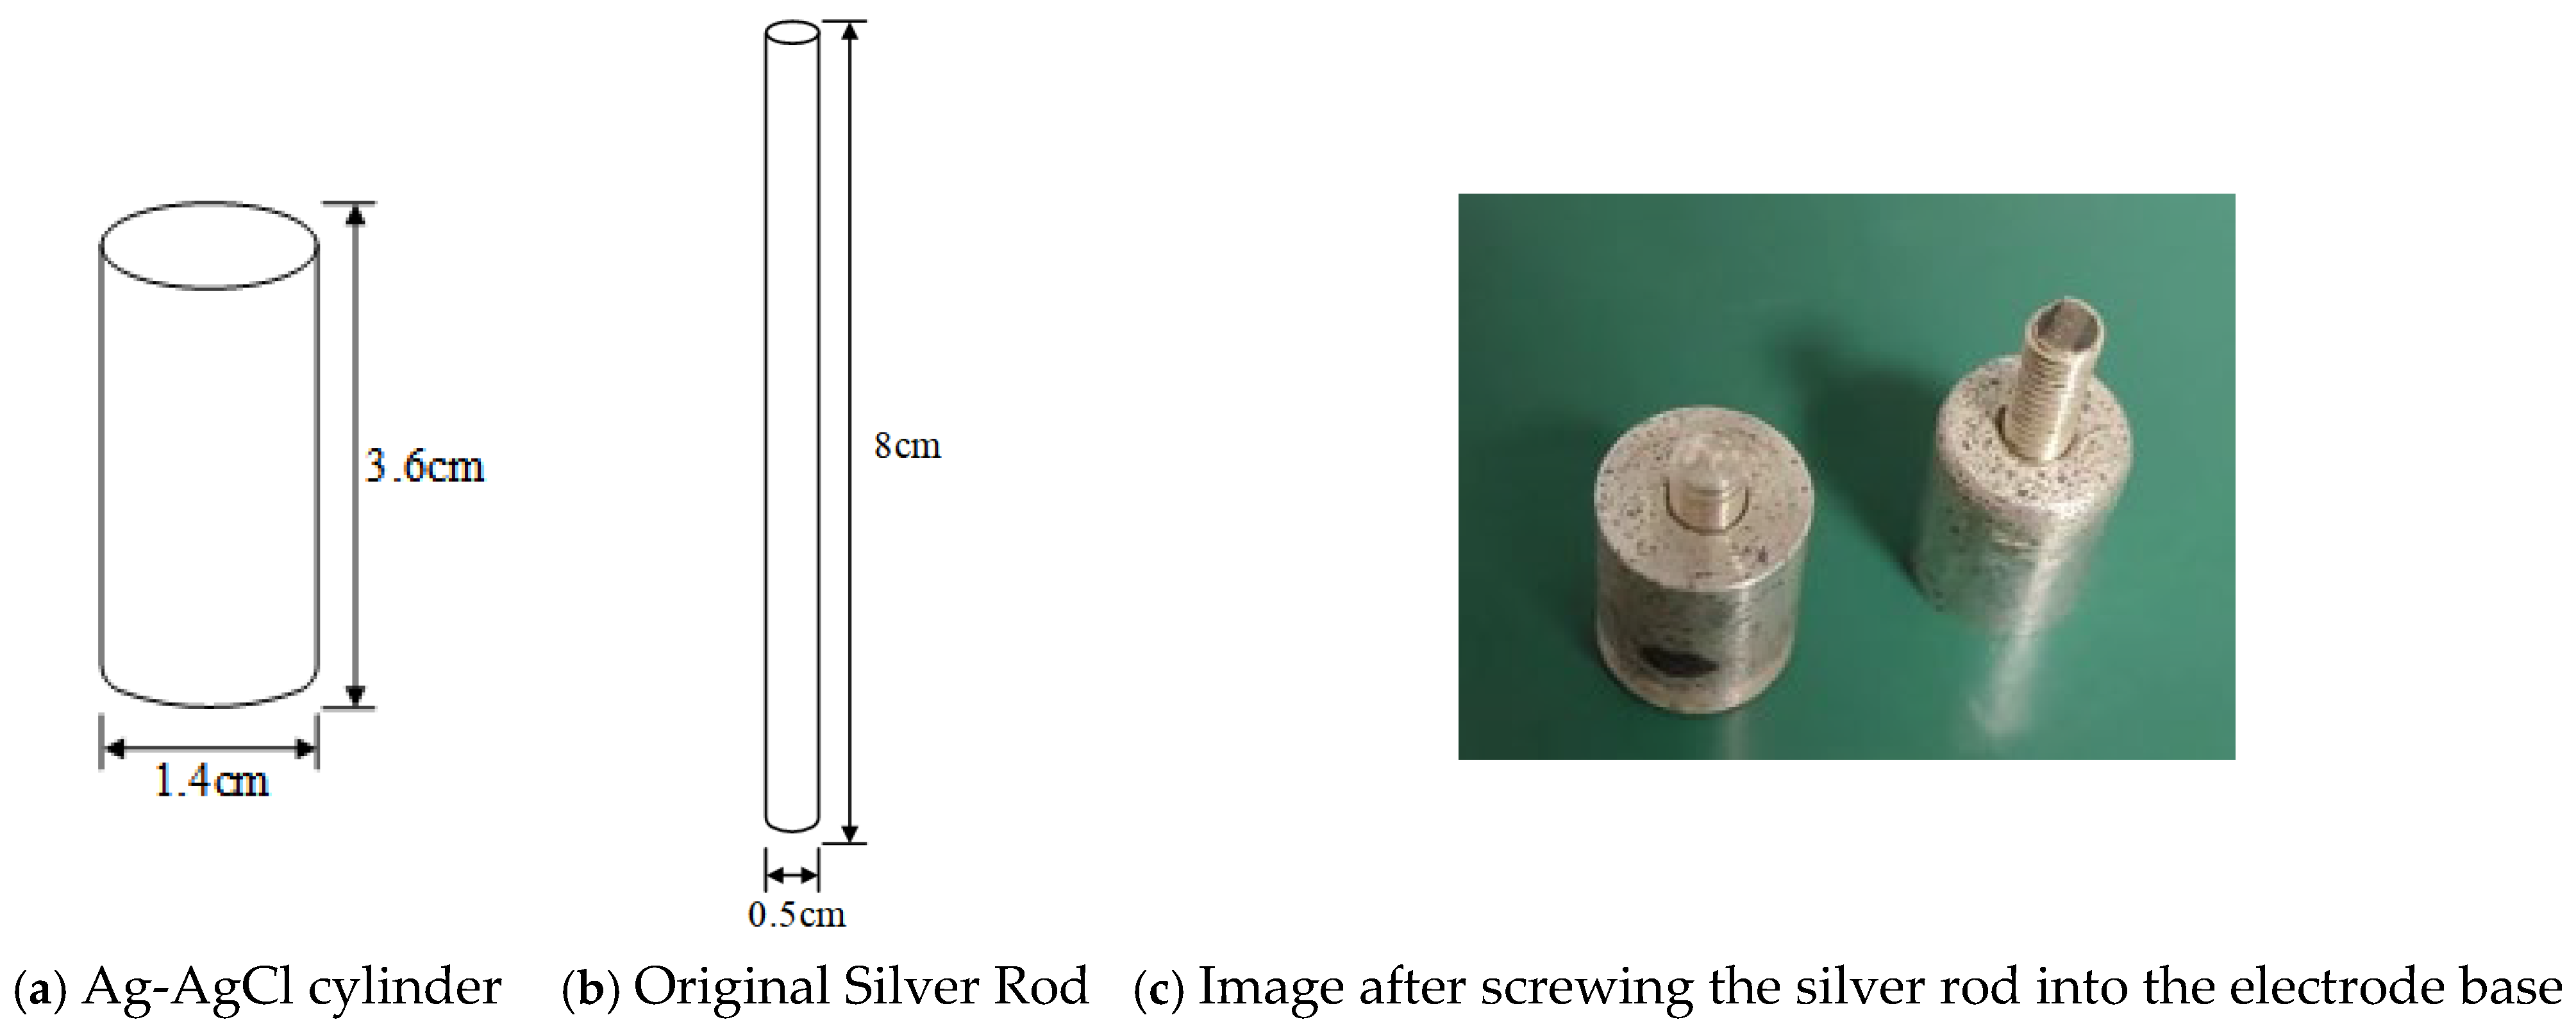
The Ag-AgCl Electrode III designed in this study is primarily composed of three parts. The first part is the threaded silver rod, the shape and dimensions of which are shown in
Figure 1a. The second part is the electrode base, the shape and dimensions of which are depicted in
Figure 1b. By screwing the two components tightly together and threading the conductor through the central hole in the silver rod, as illustrated in
Figure 1c, the design and assembly of a single electrode can be completed.
The production process of electrodes primarily consists of five steps. In the first step, the electrode base is fabricated, as depicted in
Figure 1b. It necessitates blending Ag powder with AgCl powder in a specific proportion. Since this proportion pertains to the core technology of the product and relevant references are unavailable, through numerous practical tests during the self-developed electrode process, an appropriate ratio of Ag powder to AgCl powder was ultimately determined. The well-mixed powders are then placed into a specially designed mold and pressed to form a cylindrical Ag-AgCl body with a height of 3.6 cm and a base diameter of 1.4 cm, as shown in
Figure 2a. This cylinder is further cut into a smaller cylinder with a height of 1.08 cm and a base diameter of 0.8 cm, and a threaded hole is drilled inside it, forming a threaded cylinder with a height of 0.5 cm and a base diameter of 0.29 cm, which constitutes the electrode base shown in
Figure 1b. In the second step, a threaded silver rod is processed. The original cylindrical silver rod shown in
Figure 2b is machined into the threaded silver rod depicted in
Figure 1a, with a height of 1.2 cm and a base diameter of 0.29 cm. One end of the silver rod is drilled to prepare for the next step of attaching the wire. In the third step, the electrode base is assembled with the threaded silver rod. As illustrated in
Figure 1c, the threaded end of the silver rod is screwed into the threaded hole of the electrode base, tightly connecting the two to form the electrode body.
Figure 3a displays the physical images of the electrode bodies after screwing the silver rod into the electrode base, showcasing two different specifications. In the fourth step, wires are attached. The threaded silver rod is removed from
Figure 2c, and the wire is inserted into the pre-drilled hole of the silver rod, which is then clamped tightly using a plier to ensure a secure and reliable connection between the wire and the silver rod, preventing any loosening or detachment. The silver rod is then screwed back into the electrode base, forming the Ag-AgCl bare electrode, as shown in
Figure 3b.
Step 5: For each bare electrode, as shown in
Figure 3b, it is equipped with a protective sleeve and then potted with resin. The purpose of fitting a protective sleeve is to safeguard the electrode, as it is susceptible to corrosion due to chemical reactions when electrified in seawater without a protective cover. The processed protective sleeves are depicted in
Figure 4a. The bare electrode is inserted into the protective sleeve and then the gap at the connection is filled with insulating and waterproof adhesive, as illustrated in
Figure 4b. The potting process effectively isolates the wire joints from direct contact with seawater, enhancing the service life and stability of the electrode. Once the adhesive is completely dry, the final electrode product is presented as shown in
Figure 4c.
The fabrication process of Electrode IV is meticulously refined based on Electrode III. First, during the powder mixing stage, the ratio of silver powder to silver chloride powder is precisely controlled, and a more homogeneous mixing technique is employed to maximize the material contact area, thereby enhancing the electrode’s conductivity and stability. Second, the pressing process is optimized by adjusting mold pressure and temperature parameters, resulting in a denser Ag-AgCl cylinder with a more uniform internal structure and fewer microscopic defects. For machining the threaded holes and silver rods, higher-precision turning techniques are adopted to ensure tighter thread fits and reduce contact resistance. During assembly, torque-controlled tools are used to strictly regulate the tightening force between the silver rod and the electrode base, preventing signal fluctuations caused by loosening. In the wire connection step, low-impedance aviation connectors are introduced, and laser welding replaces mechanical clamping to further minimize contact noise. Finally, during the encapsulation phase, a specialized corrosion-resistant resin is selected for vacuum potting, and a step-curing process is implemented to eliminate internal stresses, ensuring long-term performance stability of the electrode in submerged conditions.
The above describes the fabrication process of the electrodes. The performance of the electrodes is closely related to the experience of the person who makes them, which is also the core technology determining the quality of the electrodes. When used specifically, two electrodes are paired and directly contact the seawater to be measured. Utilizing the principle of electromagnetic induction, the current of seawater can be measured. Before the electrodes are put into use, the following basic tests must be conducted.
3. Electrode Testing
This paper conducts a comparative test of four pairs of electrodes, primarily considering self-noise, power spectral density, and frequency response. Self-noise refers to the fluctuation in electrode potential and current caused by chemical reactions when the electrode contacts seawater, also known as electrochemical noise or electrode self-noise. The lower the self-noise the better, as it can improve the signal-to-noise ratio and resolution of the observed signal. In the experiment, without an excitation electric field, the power spectral noise at 1 Hz after the electrode pair is electrified is considered the self-noise of the electrode. Frequency response typically refers to the characteristic of the electrode’s response to the input signal as the frequency changes. In electrochemistry, electrode frequency response can be described as the relationship between the amplitude and phase of the electrode potential or current response and the frequency change under the influence of different frequencies of alternating current signals. In the experiment, an excitation electric field is connected, and the response of the electrode pair to different frequencies of excitation signals is recorded.
3.1. Experimental Setup and Testing Process
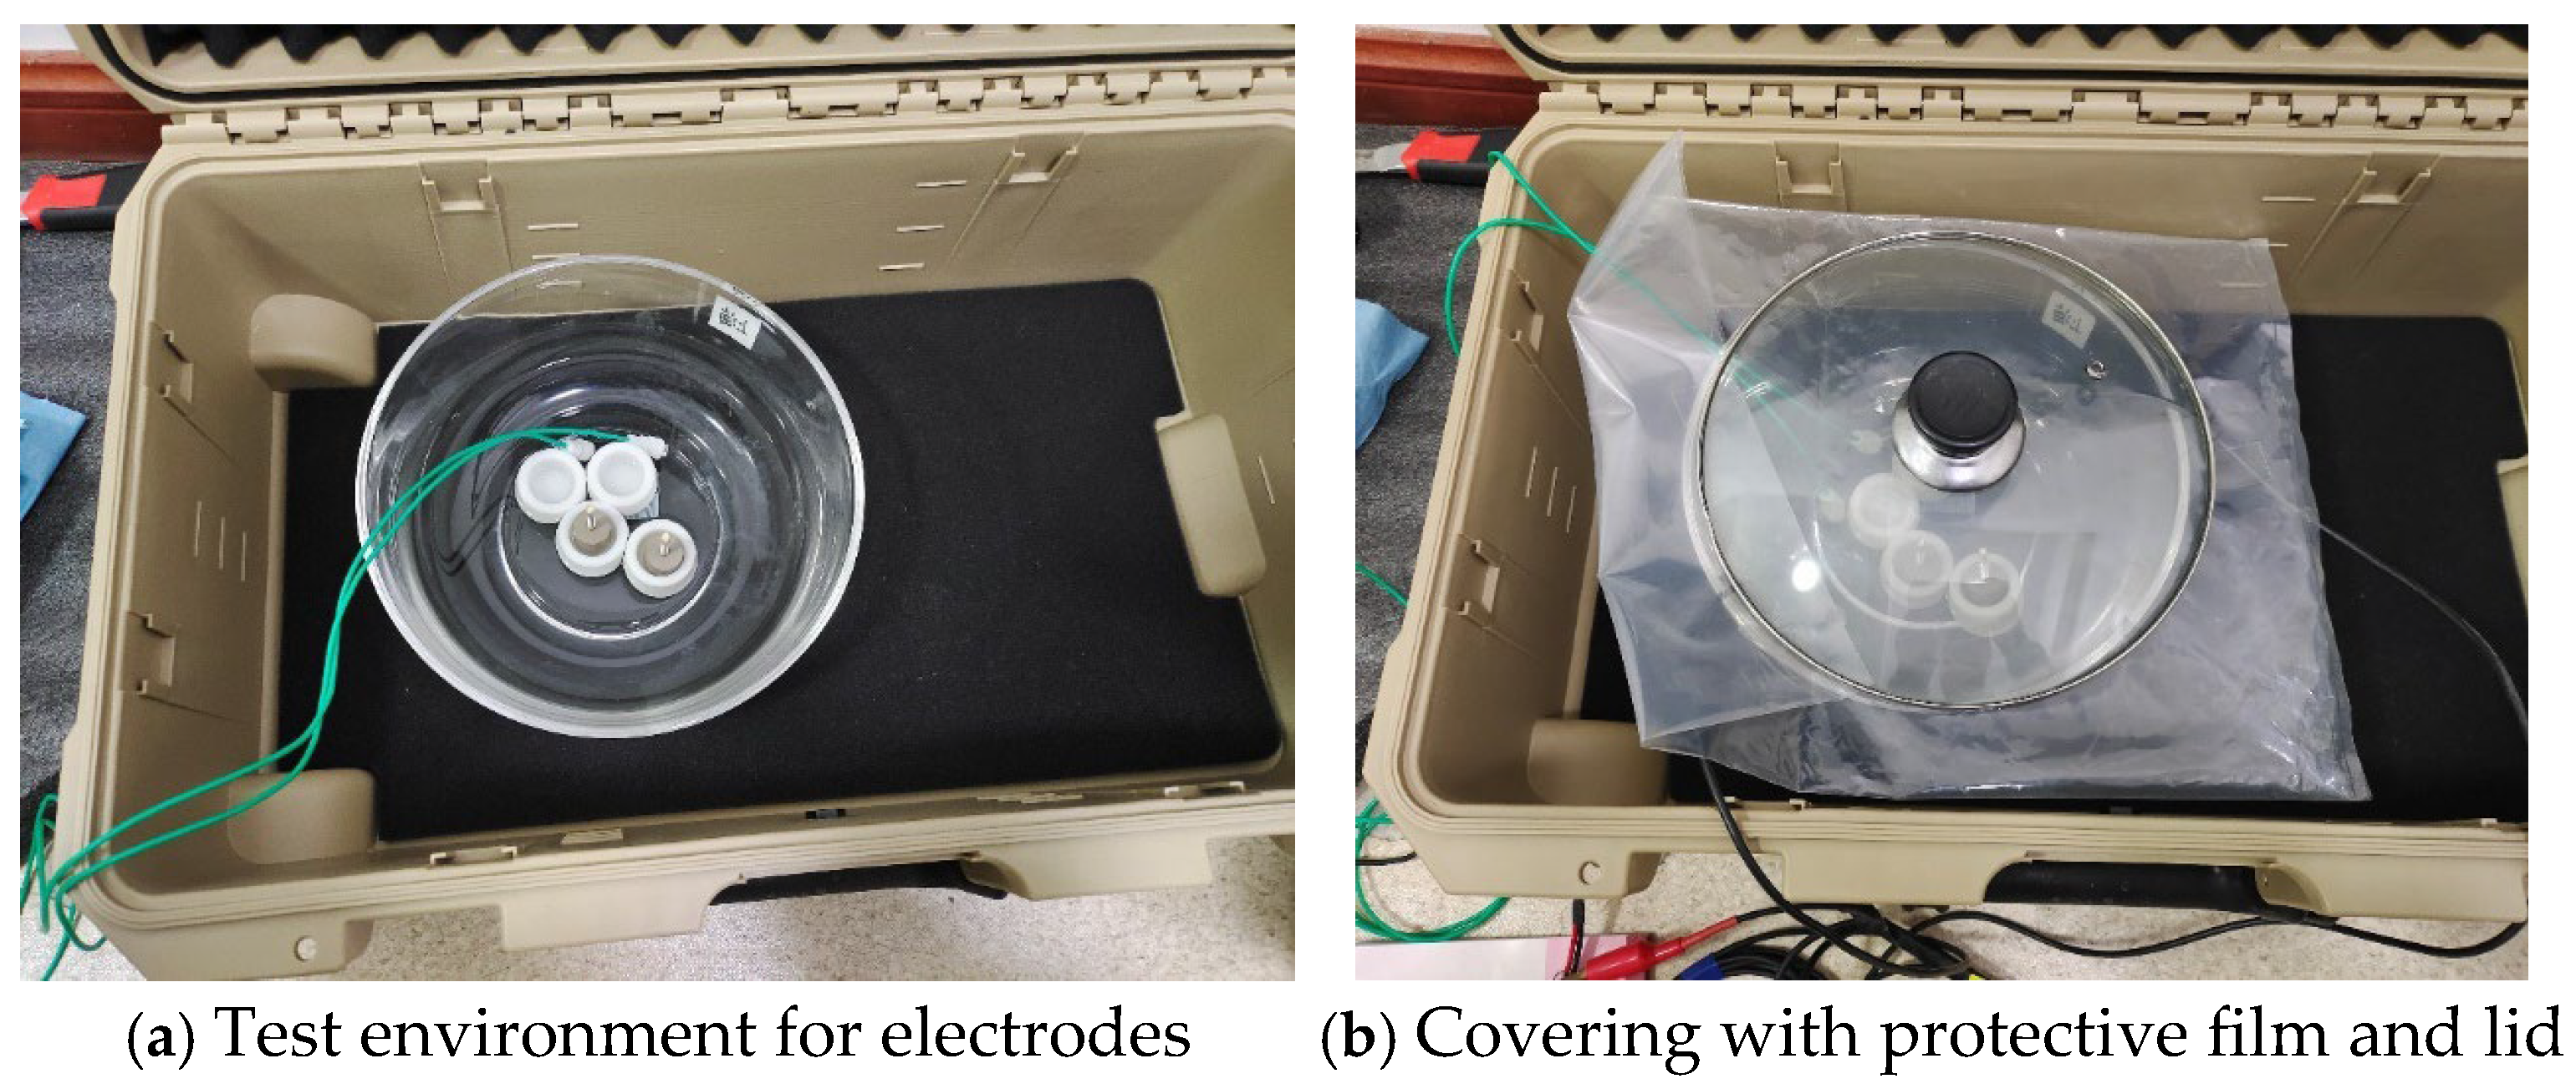
The testing setup for the electrodes is depicted in
Figure 5a, with the outermost enclosure being an aluminum electromagnetic shielding box. Inside this shielding box, a glass vessel is positioned, containing a pair of electrodes connected via green wires. The glass vessel is filled with saline at a concentration of 35 parts per thousand, comparable to the salinity of seawater, as shown in
Figure 5b, and then sealed with a protective film and lid. The other ends of the green wires are interfaced with a data acquisition card, whose output is then connected to a computer. The objective of this experiment is to measure the self-noise data of the electrodes.
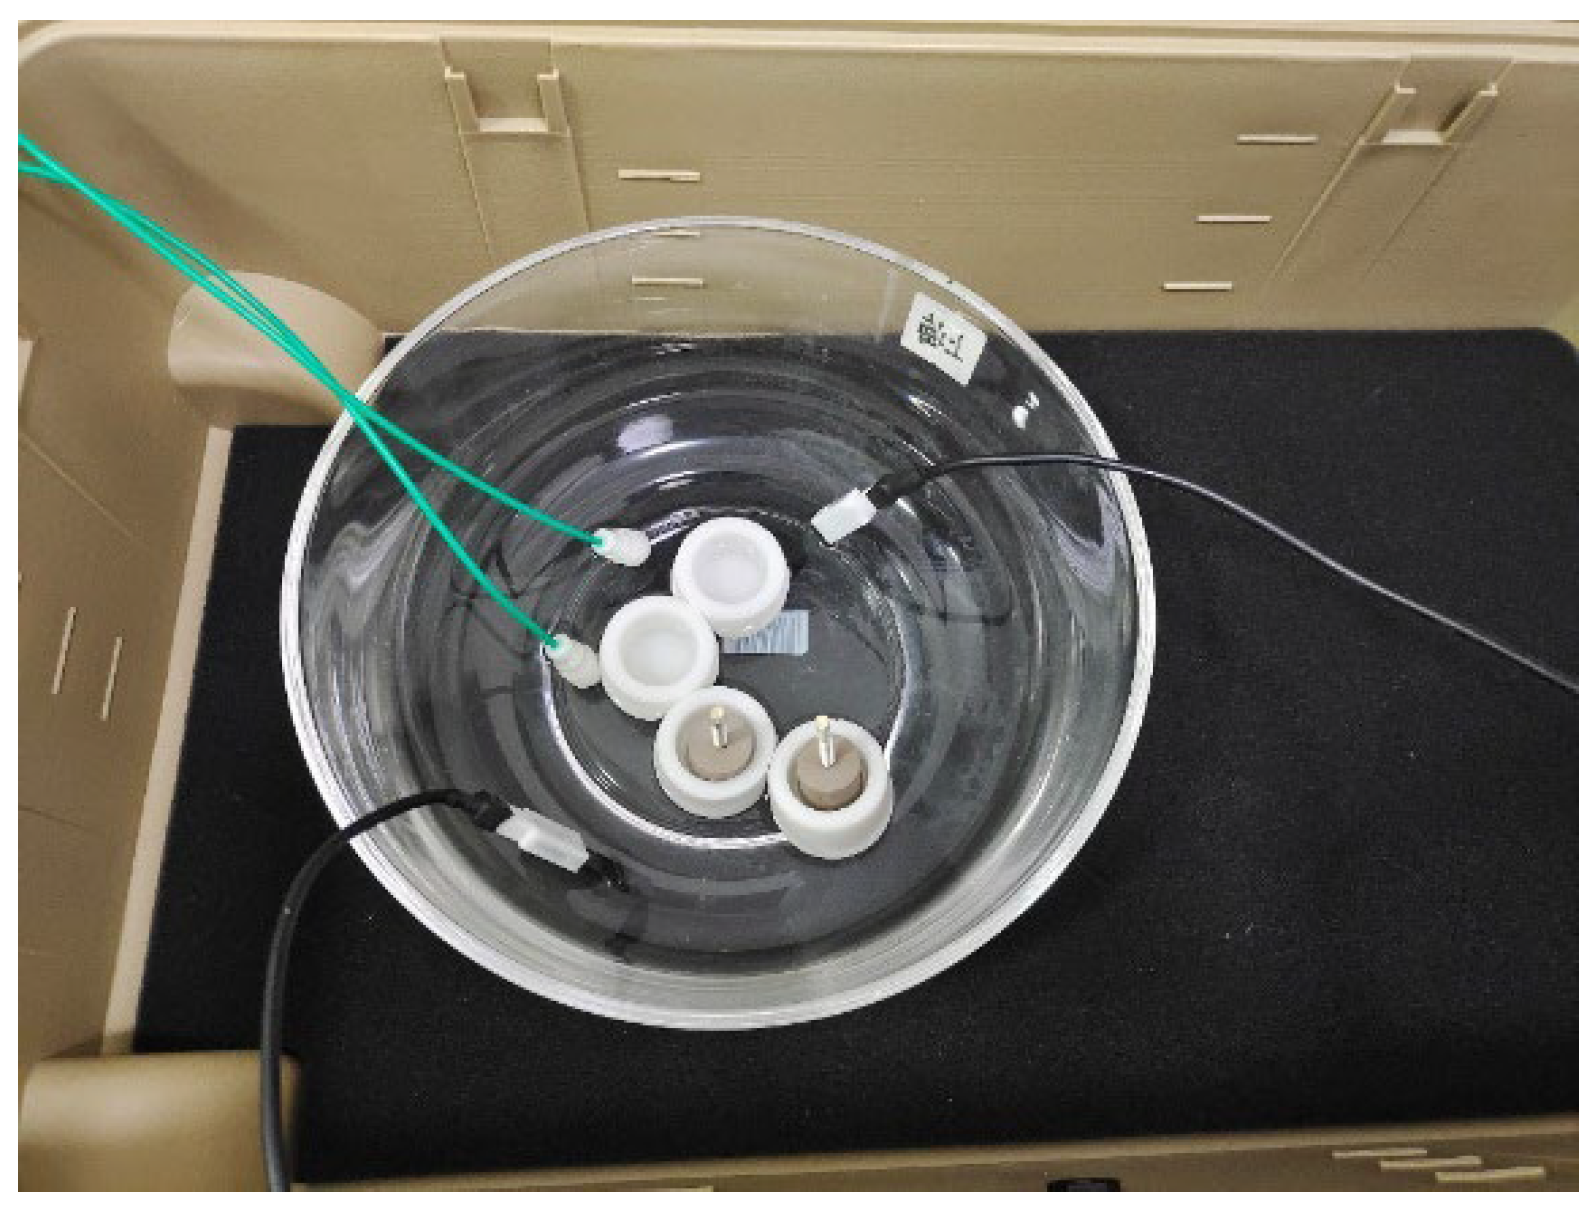
When testing the frequency response of the test electrodes, as illustrated in
Figure 6, another pair of excitation electrodes are placed inside the glass container. The other ends of the excitation electrodes are connected to a signal generator.
Figure 7 depicts the applied excitation signal at 13 Hz. By adjusting the frequency knob on the signal generator, the frequency of the excitation signal can be altered.
3.2. Experimental Testing
Four pairs of electrodes were tested in this section.
3.2.1. Testing of Electrodes I, II, and IV
This electrode test included three pairs of electrodes, namely Electrodes I, II, and IV. These three pairs of electrodes were tested synchronously under the same environment. During the 24 h immersion process, measurements were taken every four hours, with each test lasting 1000 s, resulting in a total of seven sets of 1000 s long data. The analysis results are presented in
Figure 8,
Figure 9,
Figure 10,
Figure 11 and
Figure 12.
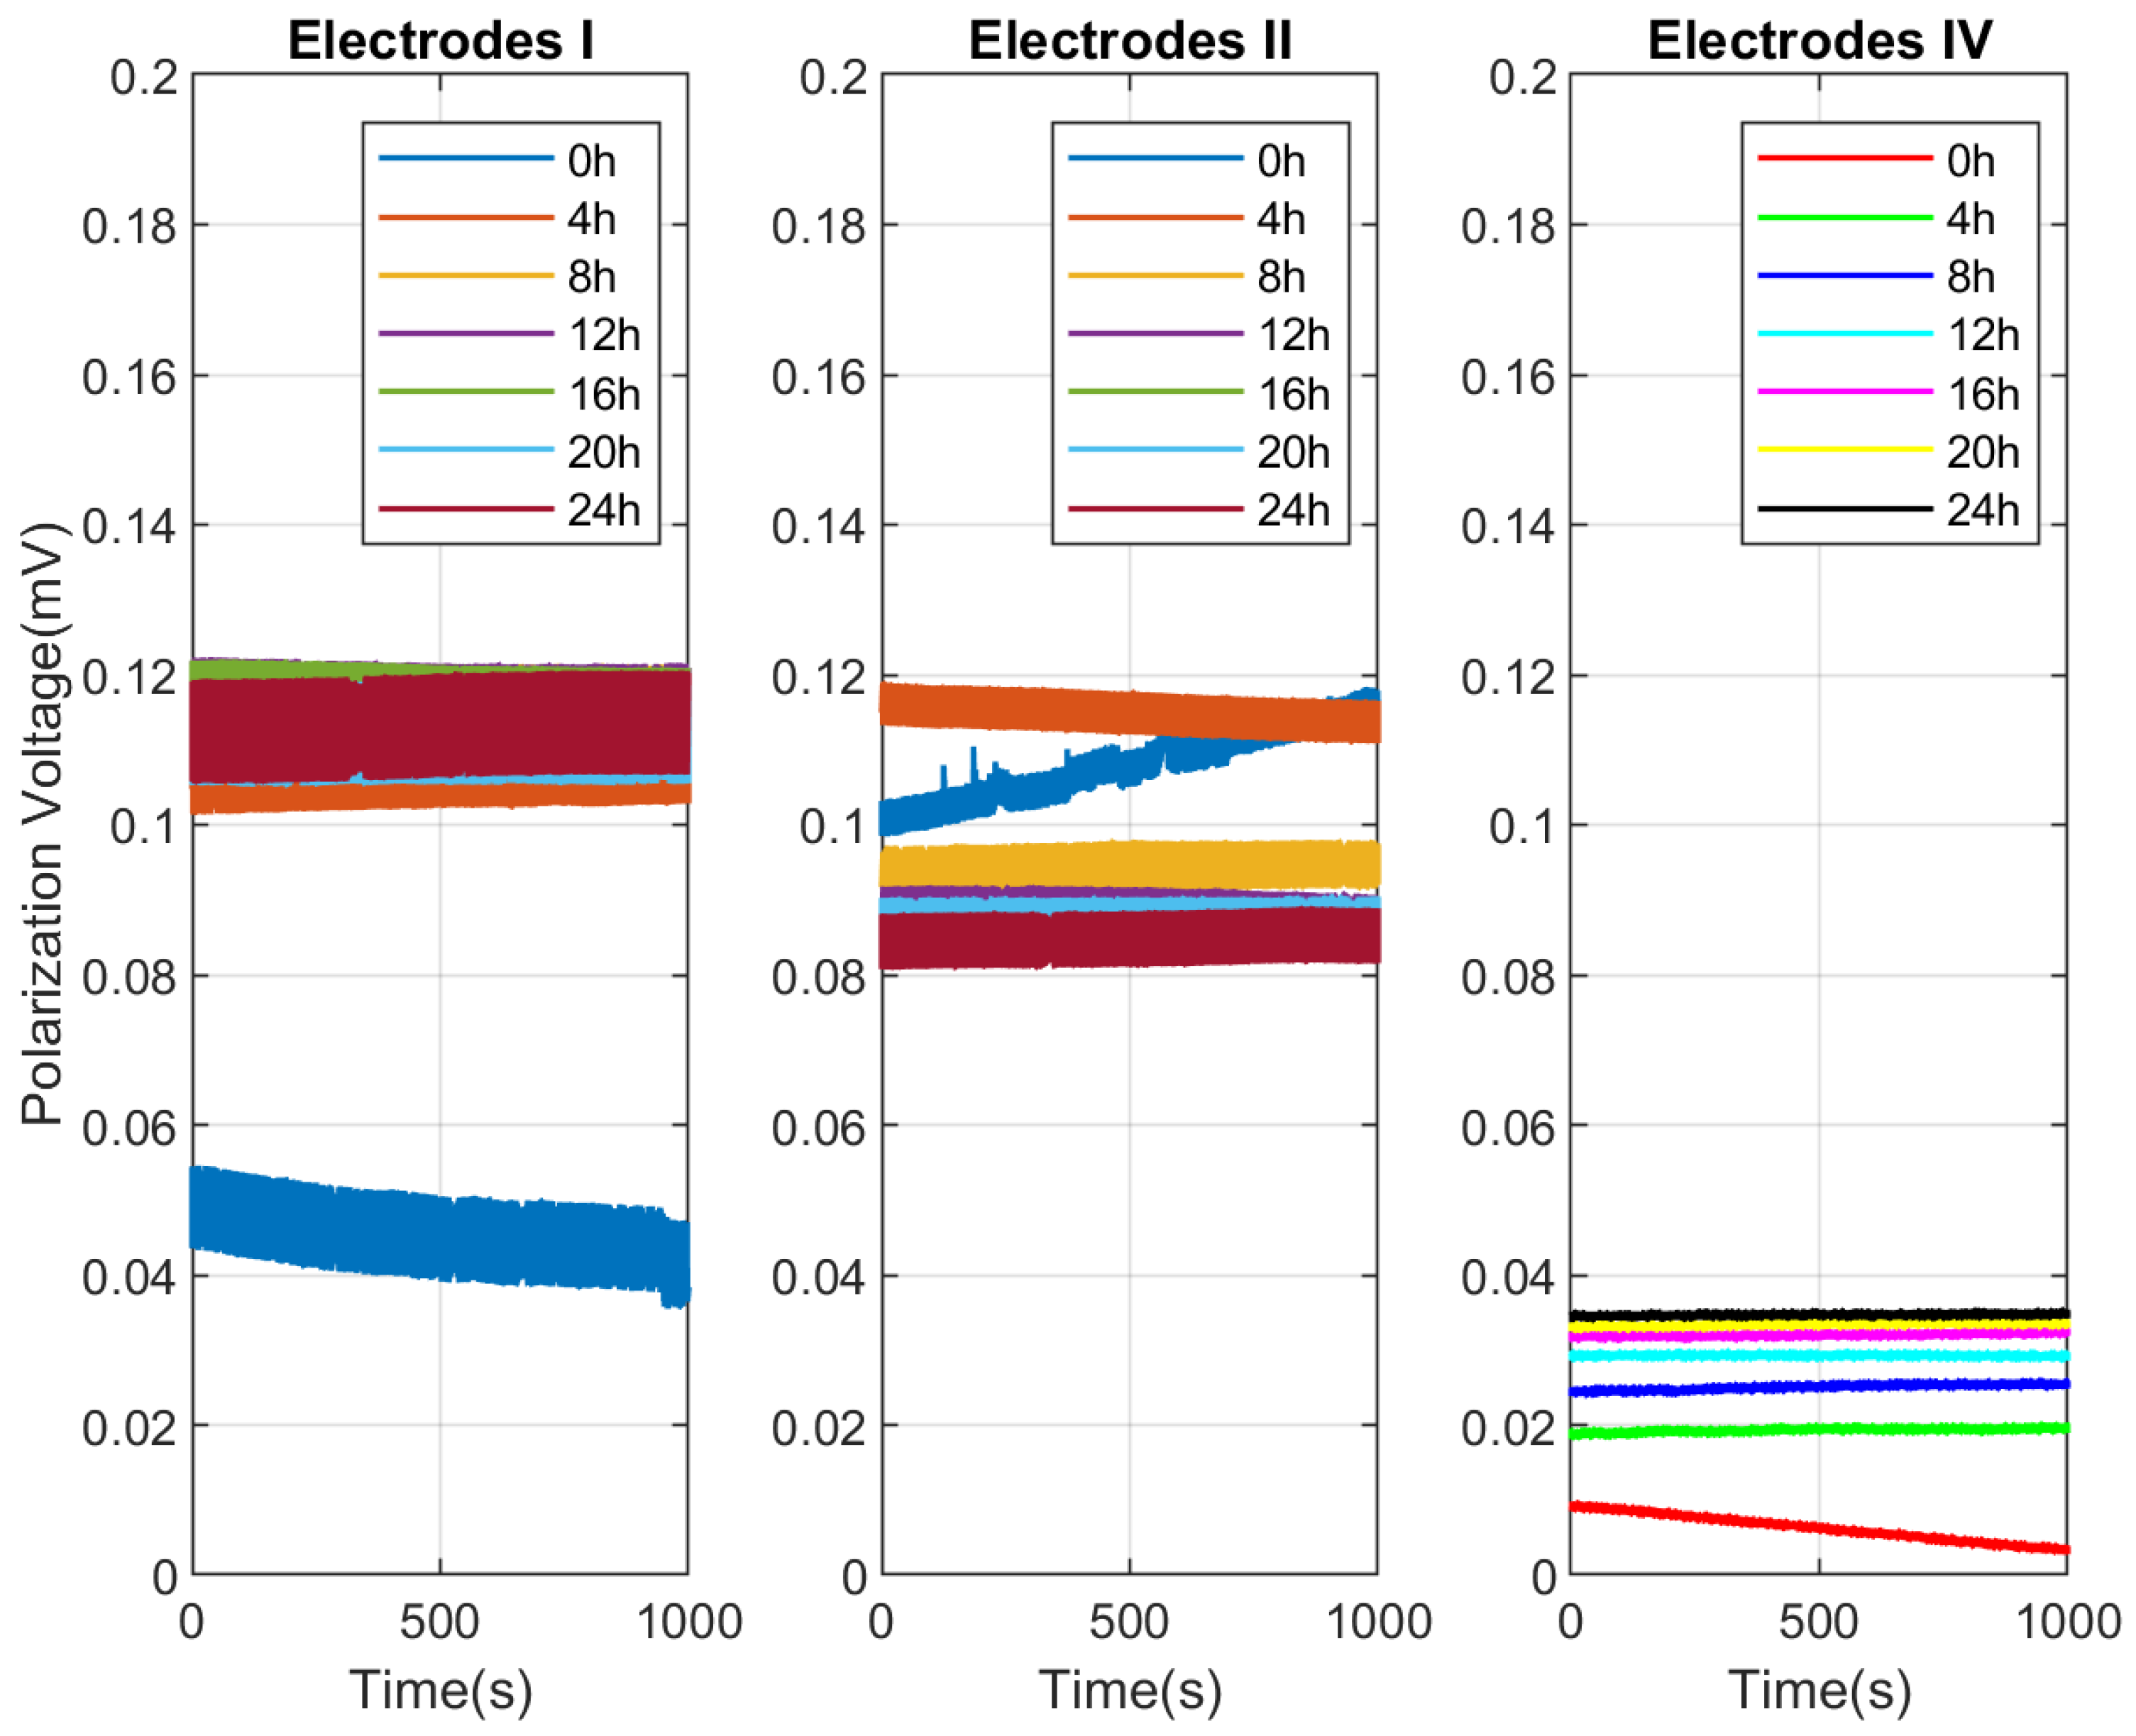
Figure 8 displays seven sets of 1000 s long polarization voltage time series for Electrodes I, II, and IV at different immersion times. This figure shows how the polarization voltage of the three electrodes varies with time at different time points (0 h, 4 h, 8 h, 12 h, 16 h, 20 h, and 24 h). Each subplot represents one electrode, with the horizontal axis indicating time (in seconds) and the vertical axis indicating polarization voltage (in millivolts, mV). For Electrode I, the 0 h curve shows a gradual decrease in polarization voltage over time, while the curves at other time points (4 h to 24 h) are relatively stable, with little variation in polarization voltage, all of which are higher than the 0 h polarization voltage. For Electrode II, the 0 h curve fluctuates initially, then gradually rises and stabilizes. The 4 h curve also fluctuates at the beginning but quickly stabilizes, with a polarization voltage higher than that at 0 h. The curves from 8 h to 24 h are relatively stable, with little variation in polarization voltage, all higher than the 0 h polarization voltage. For Electrode IV, except for the 0 h curve, the curves at other time points are relatively stable, with little variation in polarization voltage. The 0 h curve shows a gradual decrease in polarization voltage over time, with a significant drop. In general, for these three pairs of electrodes, the polarization voltage may fluctuate initially but then stabilizes over time. The polarization voltage at 0 h is the lowest for all electrodes, possibly indicating that the electrodes need some time to reach a stable state at the beginning of the experiment. As time progresses, the polarization voltage of the electrodes generally increases, which is related to the chemical reactions occurring on the electrode surface. In terms of electrode performance, Electrode IV consistently has the smallest polarization voltage. These conclusions can provide insights for further experimental design and electrode material selection.
Figure 9a illustrates the mean polarization voltage of the seven 1000 s long measurements for Electrodes I, II, and IV, varying with immersion time. This figure depicts the trend of average polarization voltage over time for the three electrodes. Electrode I rises rapidly within the first few hours and then reaches a plateau and remains stable after approximately 4 h, with the highest voltage level among all electrodes. Electrode II has a slightly higher voltage at the beginning than Electrode I and rises rapidly to its peak, but it begins to decline after about 4 h and stabilizes after 8 h. However, its stabilized voltage level is still lower than that of Electrode I. Electrode IV has the lowest initial voltage and rises only slightly in the first few hours, then shows a steady upward trend. Throughout the 24 h, its voltage level remains below those of Electrodes I and II. All electrodes undergo significant voltage changes during the initial stage, related to initial chemical or physical changes on the electrode surface. As time progresses, the electrode performance stabilizes, indicating that the electrode surface has reached an equilibrium state. These observations can provide valuable insights for electrode material selection, electrode design optimization, or predicting electrode performance in practical applications.
Figure 9b displays the standard deviation of the seven 1000 s long polarization voltage measurements for Electrodes I, II, and IV, varying with immersion time. This figure shows the trend of the standard deviation of polarization voltage (STD of Polarization Voltage) over time (in hours) for the three electrodes. The standard deviation of Electrode I’s polarization voltage exhibits a slight upward trend throughout the period, gradually increasing from approximately 4.3 mV to nearly 5 mV, indicating a slight increase in voltage fluctuation over time but overall little change, demonstrating good stability. The standard deviation of Electrode II’s polarization voltage drops sharply within the first few hours, from nearly 5 mV to about 2 mV, then gradually rises and stabilizes at around 2.5 mV. This may mean that Electrode II experiences significant voltage fluctuations during the initial stage but then stabilizes. The standard deviation of Electrode IV’s polarization voltage starts at about 1.8 mV, then quickly drops and stabilizes at about 0.5 mV after 4 h. This indicates that Electrode IV experiences significant voltage fluctuations during the initial stage but quickly reaches a stable state with much lower fluctuation than Electrodes I and II. Overall, after reaching a stable state, Electrode IV exhibits the lowest voltage fluctuation, potentially providing more stable performance in long-term operation. Although Electrode II has significant initial fluctuations, it ultimately reaches a relatively stable fluctuation level. Electrode I maintains high stability throughout the period but has slightly higher voltage fluctuations than Electrode IV. This information is useful for assessing electrode stability and predicting its performance in practical applications.
Figure 10a shows the power spectral density (PSD) of Electrode I at different immersion times. This figure displays the root mean square (RMS) value of the PSD of Electrode I at different immersion times (from 0 to 24 h) varying with frequency. The vertical axis is in logarithmic scale, representing the RMS value of PSD (in nV/√Hz), and the horizontal axis is frequency (in Hz), also in logarithmic scale. The spike at 50 Hz corresponds to mains interference. The curves at different immersion times show some differences, but the overall trend is that the RMS value of PSD gradually decreases as immersion time and frequency increase. This means that, within these frequency ranges, the fluctuation of Electrode I decreases as immersion time and frequency increase.
Figure 10b presents the PSD of Electrode II at different immersion times.
Figure 10c shows the PSD of Electrode IV at different immersion times. Comparing the three graphs in
Figure 10, we observe that the trend of PSD varying with frequency is evident in all figures. As frequency increases, the PSD gradually decreases. Overall, Electrode IV has the lowest PSD, indicating better performance than Electrodes I and II.
Figure 11 presents a comparison of the 1 Hz self-noise variations over immersion time for Electrodes I, II, and IV. This figure demonstrates the trend of the root mean square (RMS) value of power spectral density (PSD) at 1 Hz for three distinct electrodes (Electrodes I, II, and IV) as a function of time (in hours). It is observable that Electrode II exhibits the highest PSD RMS value at the initial time point (0 h), exceeding 50 nV/√Hz, but this value rapidly decreases over time and stabilizes after 4 h, remaining at a lower level. The PSD RMS value of Electrode I remains relatively stable across all time points, slightly above 10 nV/√Hz, indicating good stability. The PSD RMS value of Electrode IV stays at a very low level throughout the entire period, close to 0 nV/√Hz, suggesting minimal fluctuation throughout the experimental process. From these data, it can be concluded that Electrode II may have experienced significant fluctuations during the initial stage but subsequently stabilized rapidly. Electrode I demonstrates excellent stability, with its PSD RMS value showing little variation throughout the experiment. Electrode IV exhibits extremely low fluctuation, making it the most stable among the three electrodes. This information is of significant reference value for assessing electrode performance and stability, especially when selecting electrodes for applications requiring low noise or high stability. Comparing the above seven figures, it is evident that Electrode IV has the best overall performance, outperforming Electrodes I and II.
3.2.2. Testing of Electrodes III and IV
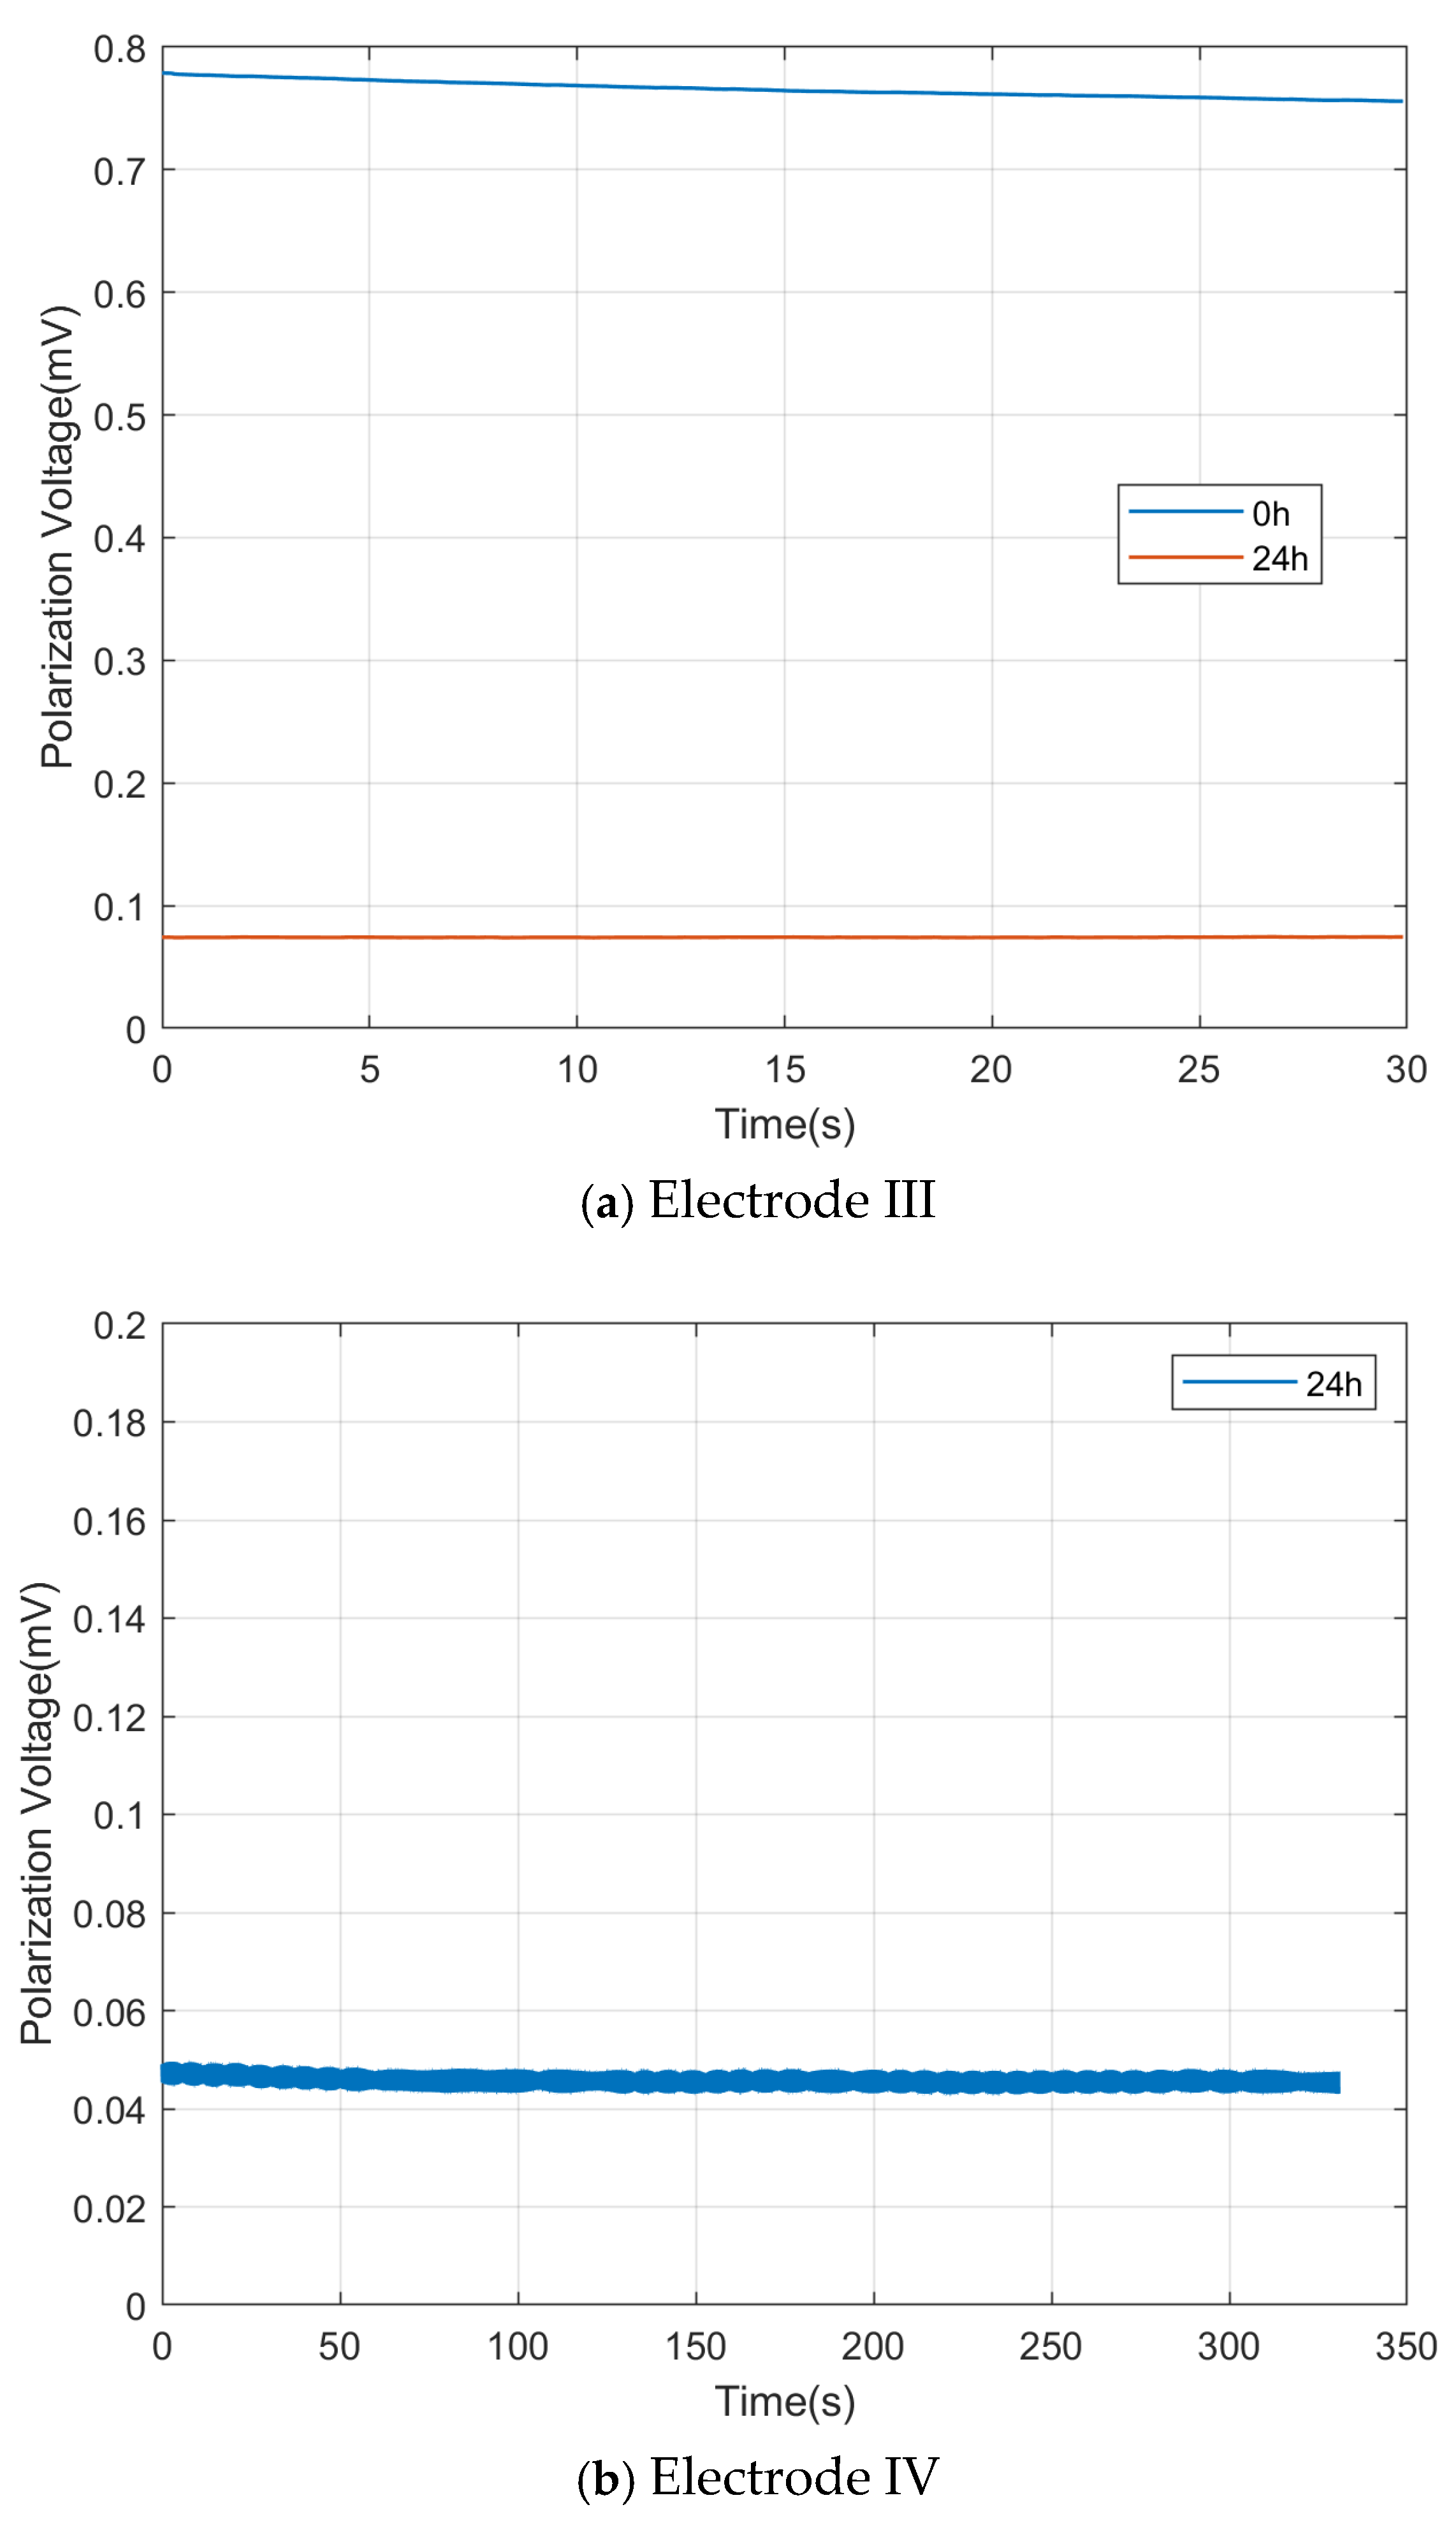
Electrodes III and IV were tested for potential difference, frequency response, and self-noise, three important parameters. For Electrode III, the potential difference before and after immersion was tested without the need for an excitation electric field. The test results are shown in
Figure 12a, with the average potential difference before and after immersion being 0.77 mV and 0.07 mV, respectively, and the standard root mean square (Standard Root Mean Square) being 0.0064 mV and 0.0001 mV, respectively. After the electrode was immersed in water, as the immersion time increased, the potential difference voltage gradually decreased, which can also be corroborated by the downward trend of the blue potential difference line over time. After the electrode was immersed for a sufficient period, such as 24 h, the potential difference became stable, which can also be corroborated by the essentially unchanged red potential difference line over time.
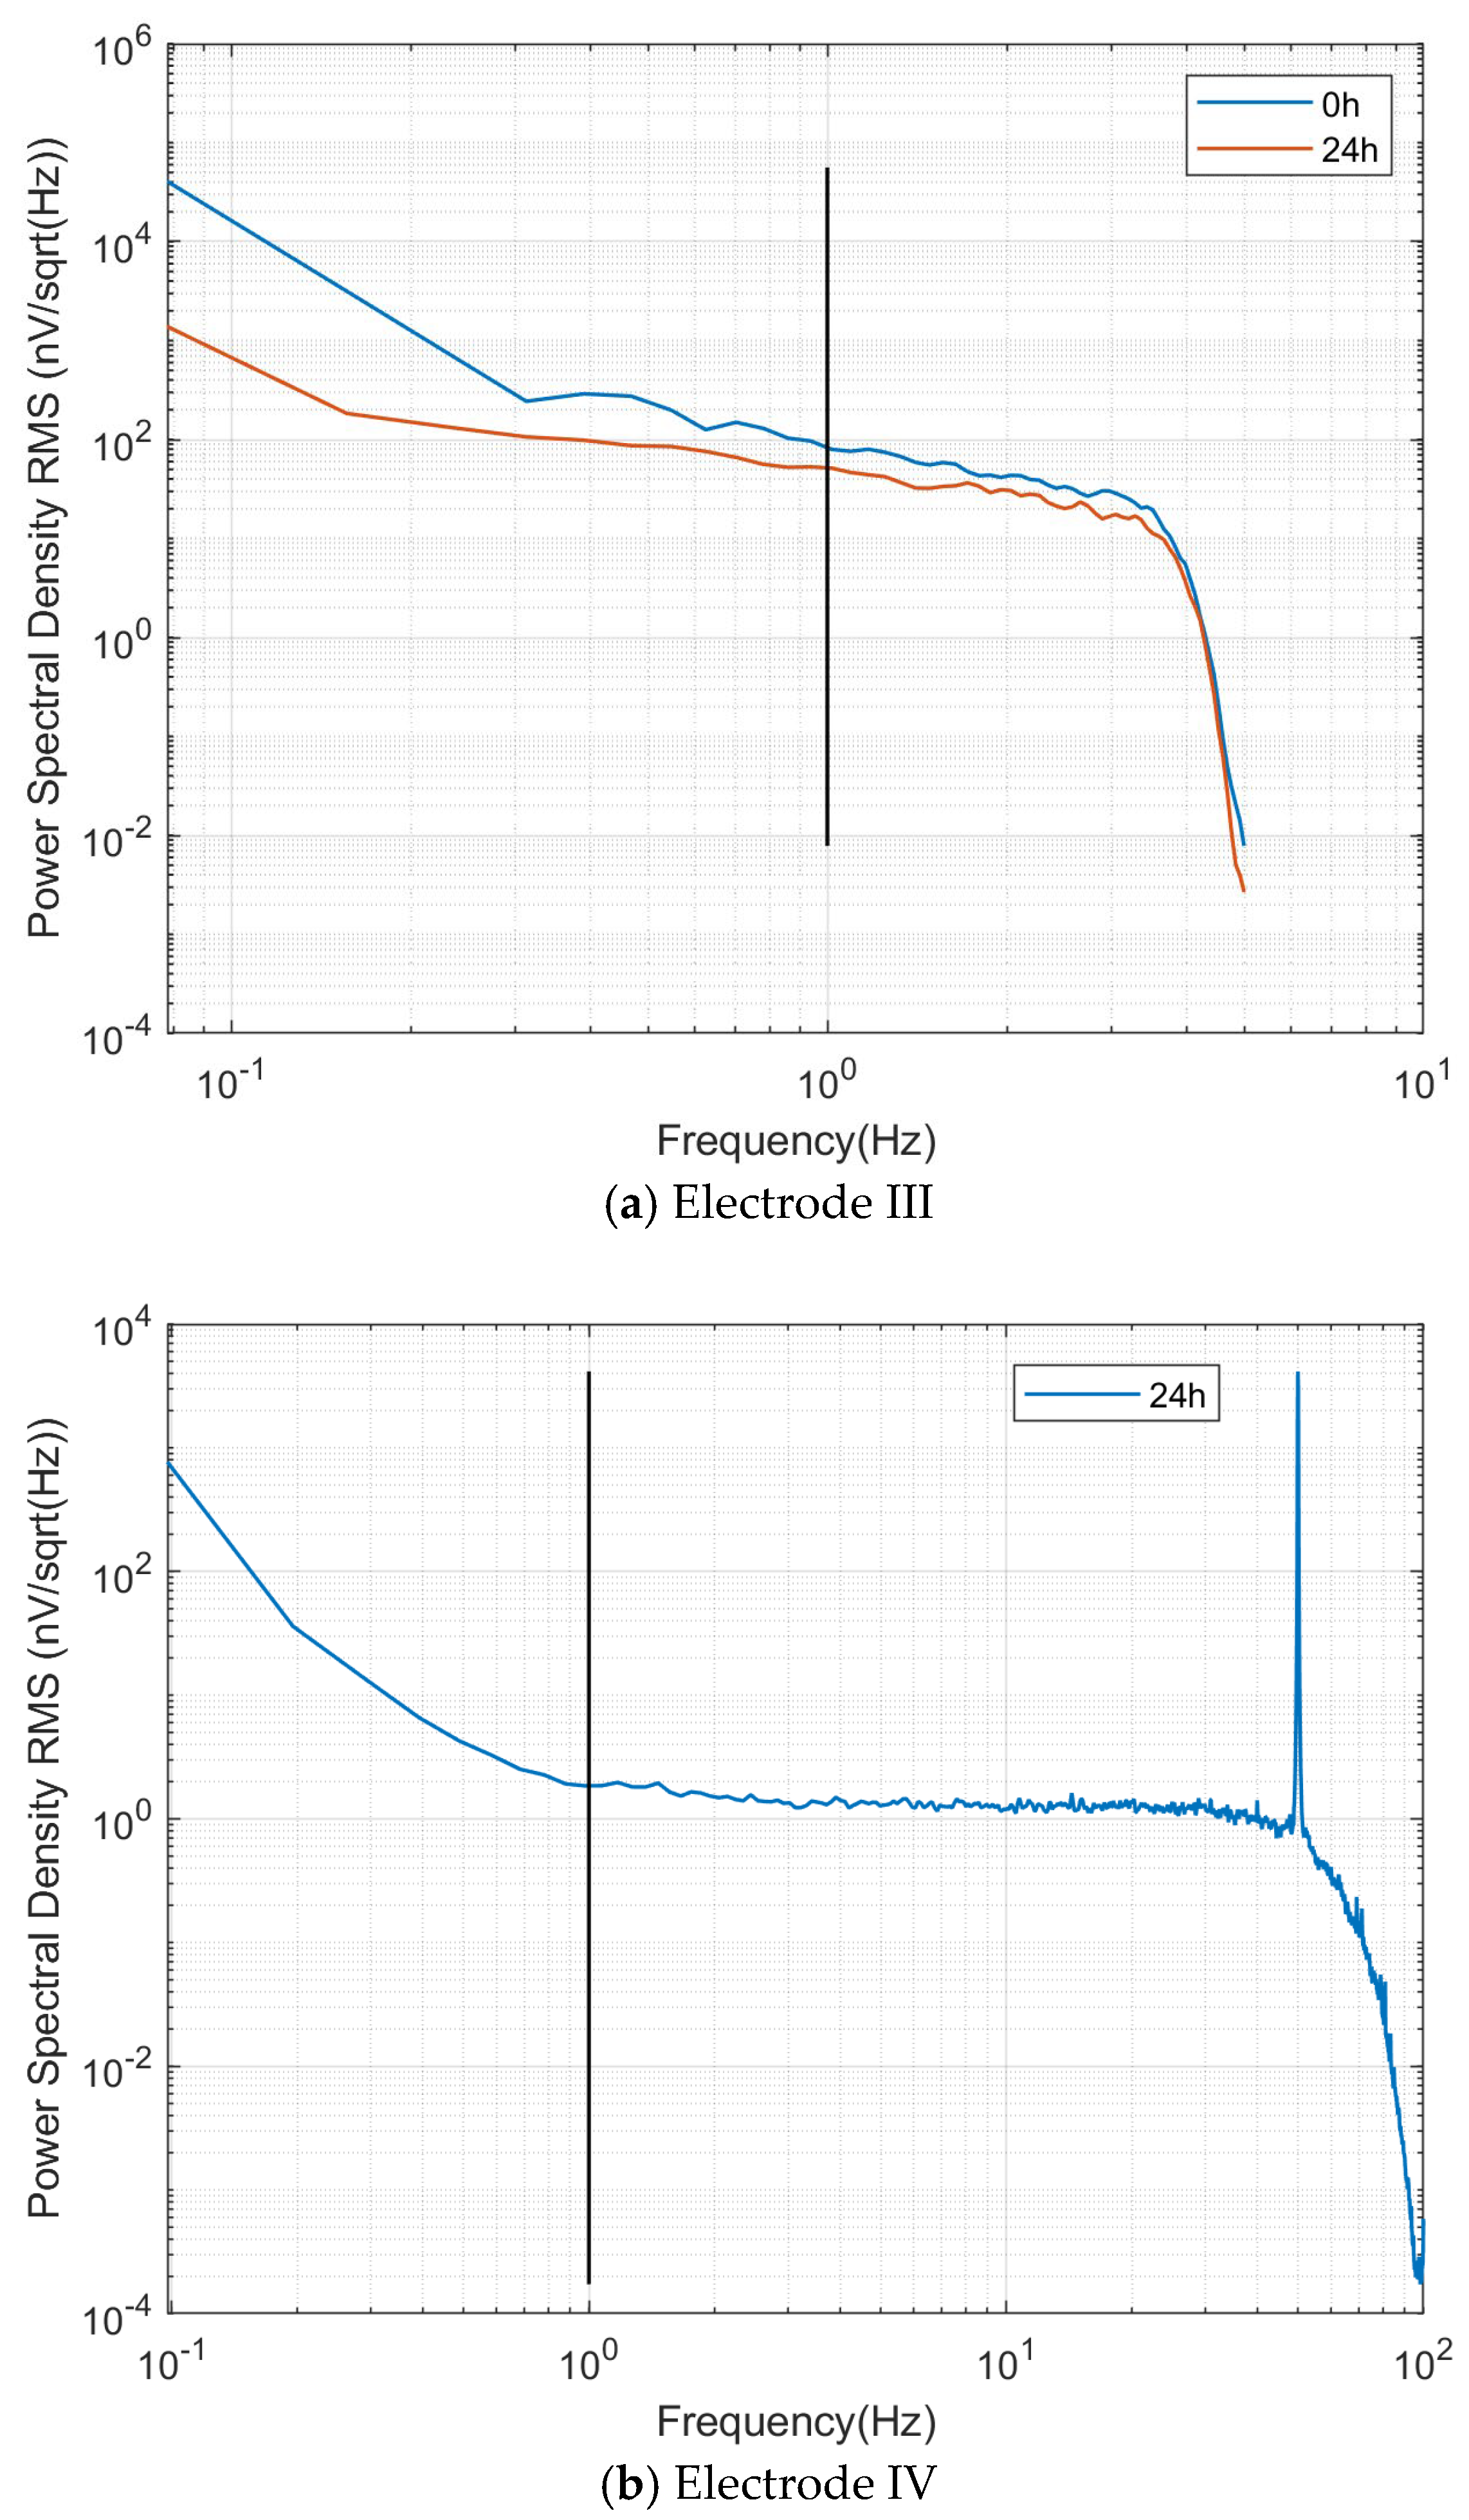
Figure 13a shows the power spectral root mean square noise, with the self-noise at 1 Hz frequency before and after immersion being 80 nV/√Hz and 51 nV/√Hz, respectively.
For Electrode IV, the potential difference after 24 h of immersion was tested without the need for an excitation electric field. The test results are shown in
Figure 12b, with the average potential difference during the measurement period after immersion being 0.0472 mV and the standard root mean square value (Standard Root Mean Square) being 0.0017 mV.
Figure 13b shows the power spectral root mean square noise, with the self-noise at the 1 Hz frequency being 2 nV/√Hz.
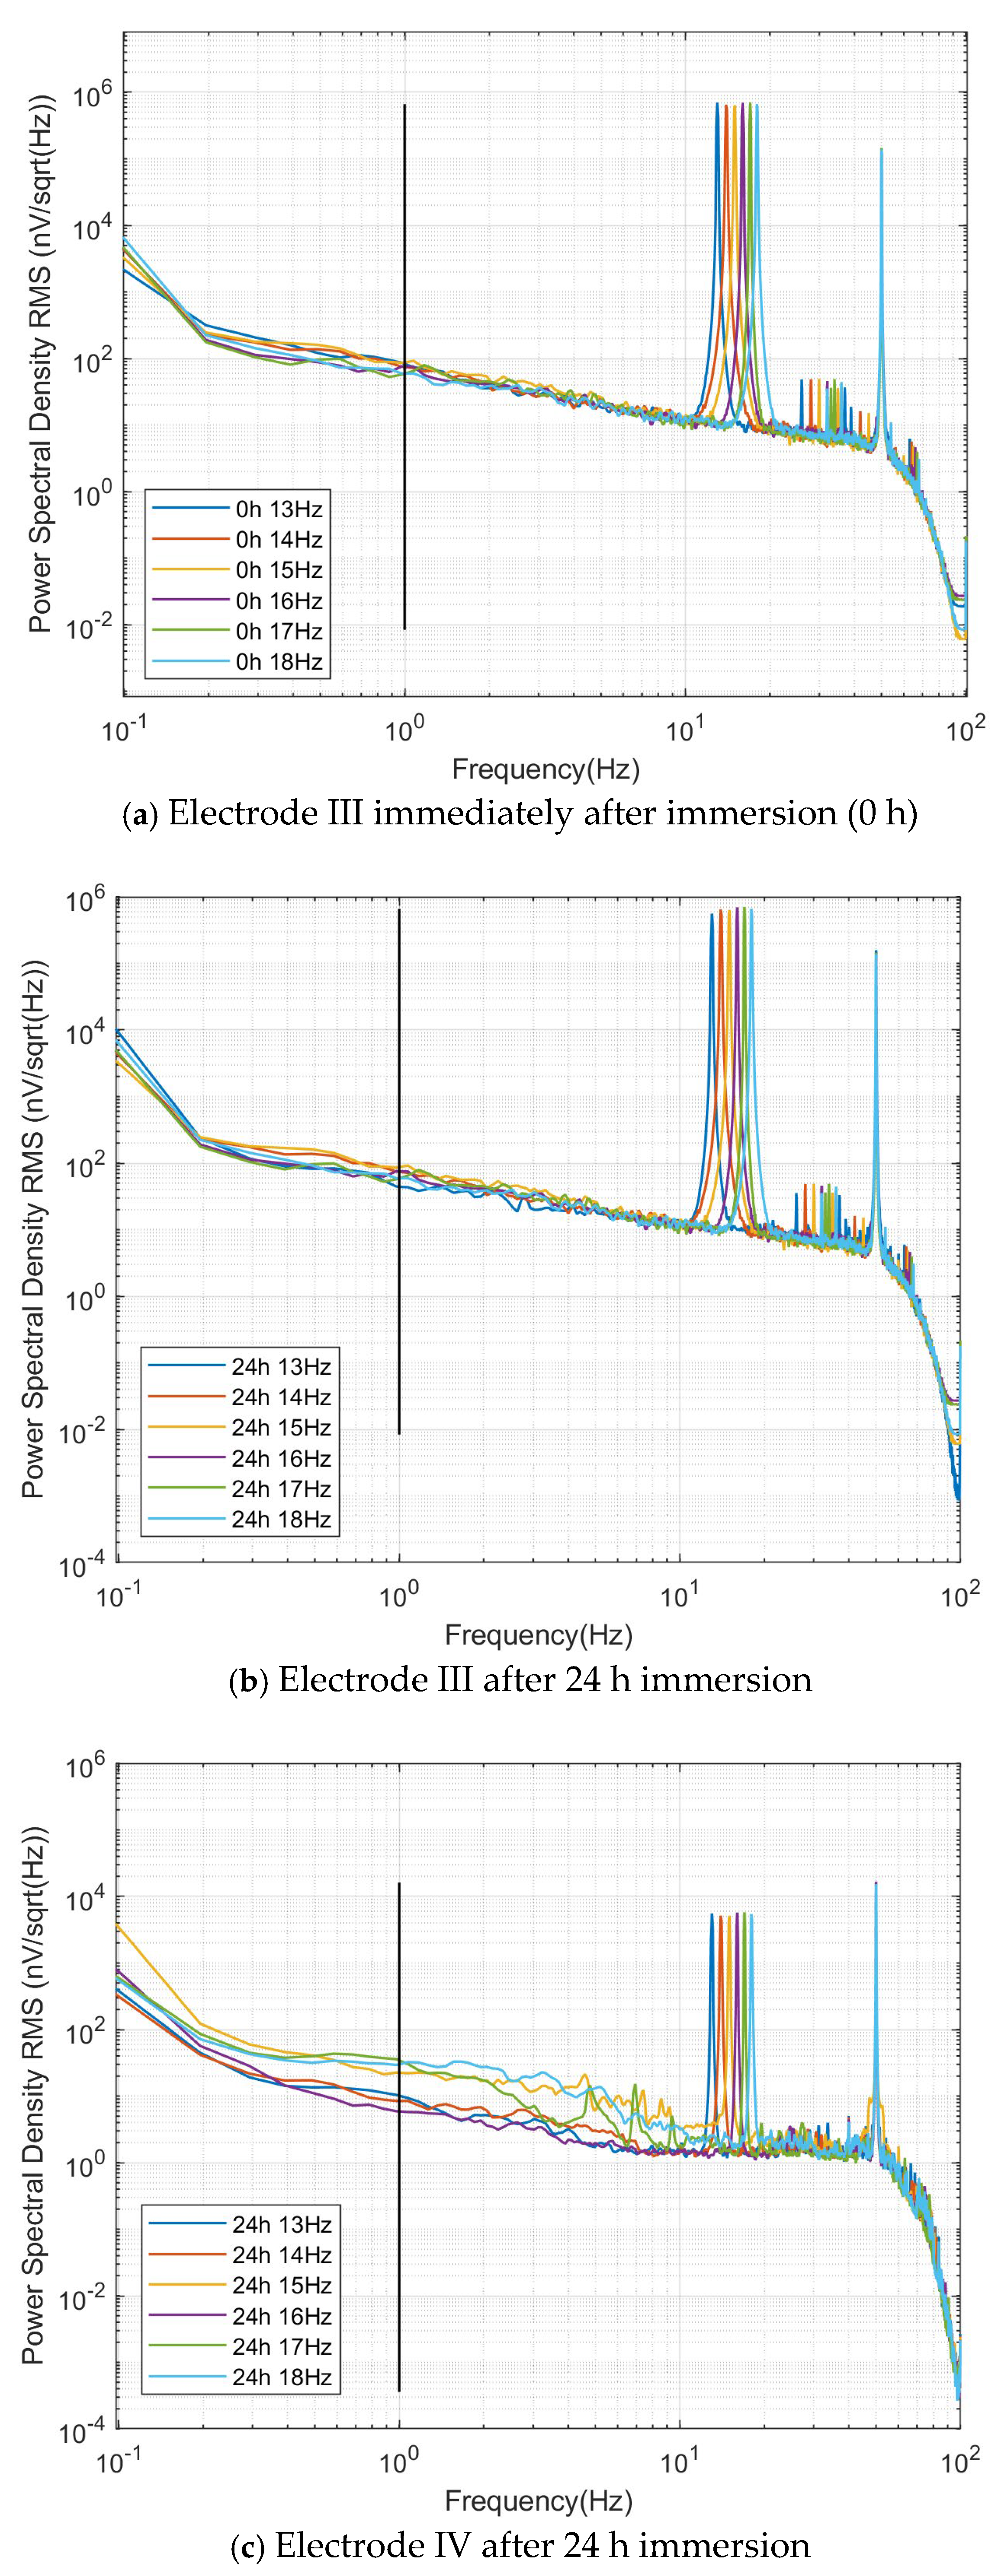
To systematically evaluate the frequency response characteristics, comparative experiments were conducted under three conditions: (1) Electrode III immediately after immersion (0 h), (2) Electrode III after 24 h immersion, and (3) Electrode IV after 24 h immersion. All tests employed external excitation electric fields with frequencies ranging from 13 to 18 Hz, covering the critical 16 Hz operational frequency for XCP applications [
17].
The RMS noise power spectra obtained under these three conditions consistently showed six distinct peaks corresponding to the applied excitation frequencies (13–18 Hz), along with a separate 50 Hz mains interference peak, as shown in
Figure 14. The complete spectral separation between the operational band and mains interference eliminated the need for any filtering or signal processing. In each spectrum, the black vertical line at 1 Hz intersects with all six excitation curves, and the power spectral density values at these intersection points represent the electrode’s self-noise—a key performance indicator where lower values indicate better performance.
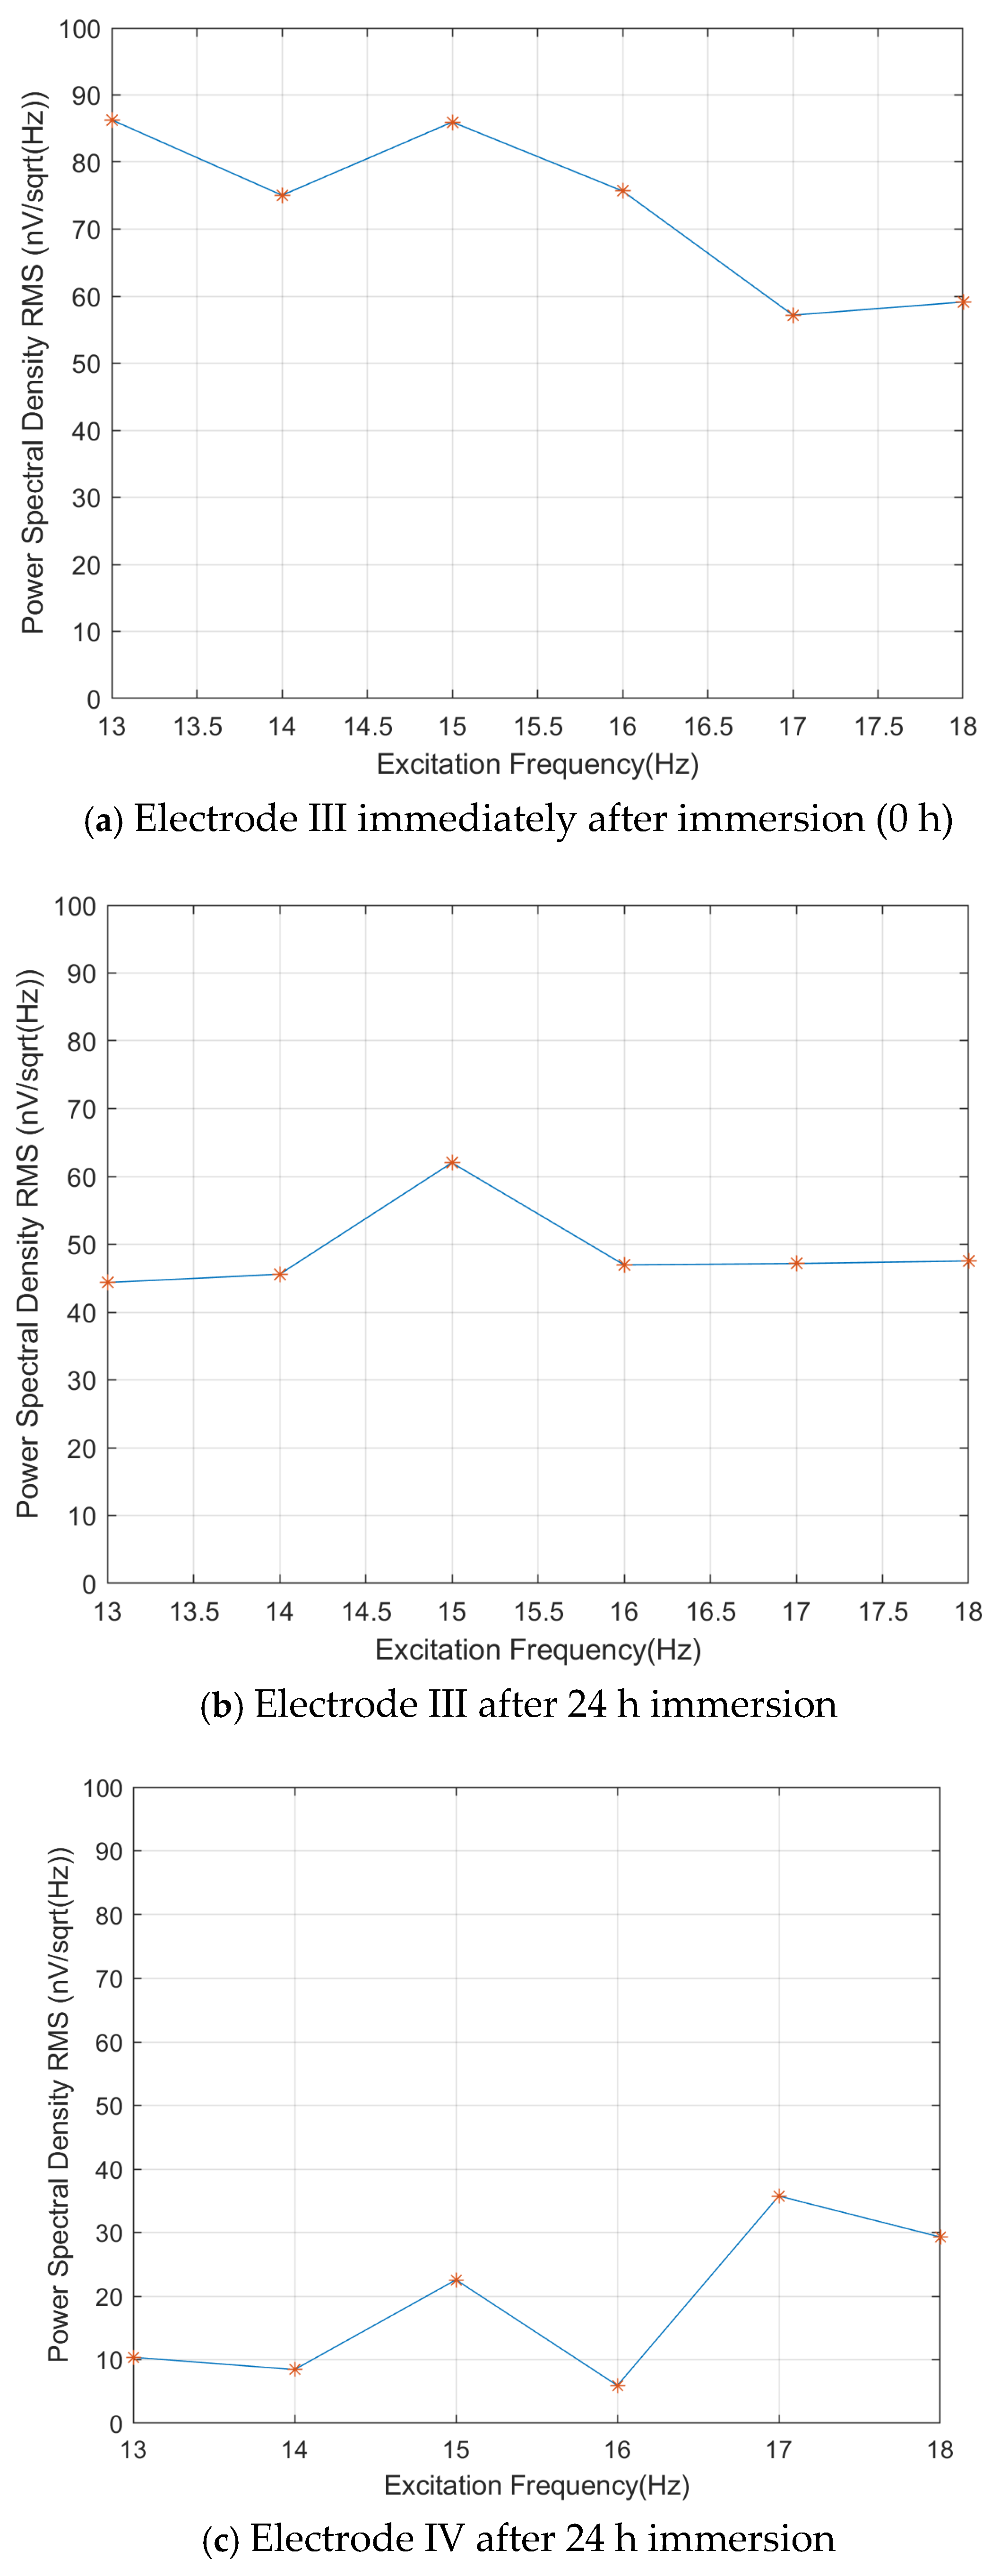
As shown in
Figure 15, the self-noise images of the three electrodes at 1 Hz under the external field excitation conditions from 13 to 18 Hz are plotted. For Electrode III in the freshly immersed state, the extracted 1 Hz self-noise values ranged from 57 to 87 nV/√Hz. After 24 h immersion, the noise levels improved to 44–62 nV/√Hz, showing an 18–29% reduction. In contrast, Electrode IV after 24 h immersion demonstrated superior performance, with self-noise levels between 6 and 36 nV/√Hz, representing a 45–82% improvement over the stabilized Electrode III.
3.3. Comparison of the Performances of the Four Electrodes
Based on the above analysis, it could be concluded that Electrode IV exhibited the best performance. The performance of Electrodes I and II was slightly inferior to Electrode IV, mainly manifested in their significant difference in frequency response below 10 Hz compared to Electrode IV and their lower stability. However, their overall performance still met the experimental requirements. Compared to the above three groups of electrodes, Electrode III showed a certain gap in both overall performance and experimental requirements. Each of the four pairs of electrodes had its own advantages and disadvantages but, in terms of overall performance and experimental requirements, Electrode IV more closely met the expected standards set in the early stages of the experiment.
4. Conclusions
This paper presented the development of nanovolt-level low-noise Ag-AgCl electrodes for XCP using the powder pressing method. The manufacturing process of the electrodes, the testing environment, and the testing procedures were described, along with the testing and analysis of four pairs of electrodes. Multiple experiments were conducted on each pair of electrodes to study their self-noise, power spectral density, and frequency response under different experimental conditions. The results indicated that, without an external electric field, the power spectral density at 1 Hz for Electrodes I, II, and III was in the range of tens of nV/√Hz. The performance of the self-developed improved Electrode IV was the best; without an external electric field, the power spectral density at 1 Hz was only in the range of a few nV/√Hz, and the frequency response in the 13!18 Hz range, which is of greatest concern to the XCP, was also essentially stable, meeting the requirements for XCP’s sea trial use. Among the four pairs of electrodes, Electrode IV had the best performance. Electrodes I and II performed slightly worse than Electrode IV, mainly showing a significant difference in the frequency response below 10 Hz compared to Electrode IV, and their stability was not as good as Electrode IV, but their comprehensive performance also met the experimental requirements. Electrode III still had a certain gap compared to the other three sets of electrodes in overall performance and experimental requirements. Each of the four pairs of electrodes had their advantages and disadvantages but, for overall performance and experimental requirements, Electrode IV was more in line with the expected standards in the early stages of the experiment.
This paper designed and tested high-precision nanovolt-level low self-noise Ag-AgCl electrodes suitable for XCP, but the manufacturing process of the electrodes inevitably relied to some extent on the manual experience during the production process. Therefore, a large number of trials and experiments need to be conducted during the electrode manufacturing process, and it is hoped that this will ultimately lead to the establishment of a standardized high-precision electrode manufacturing process.


