Review

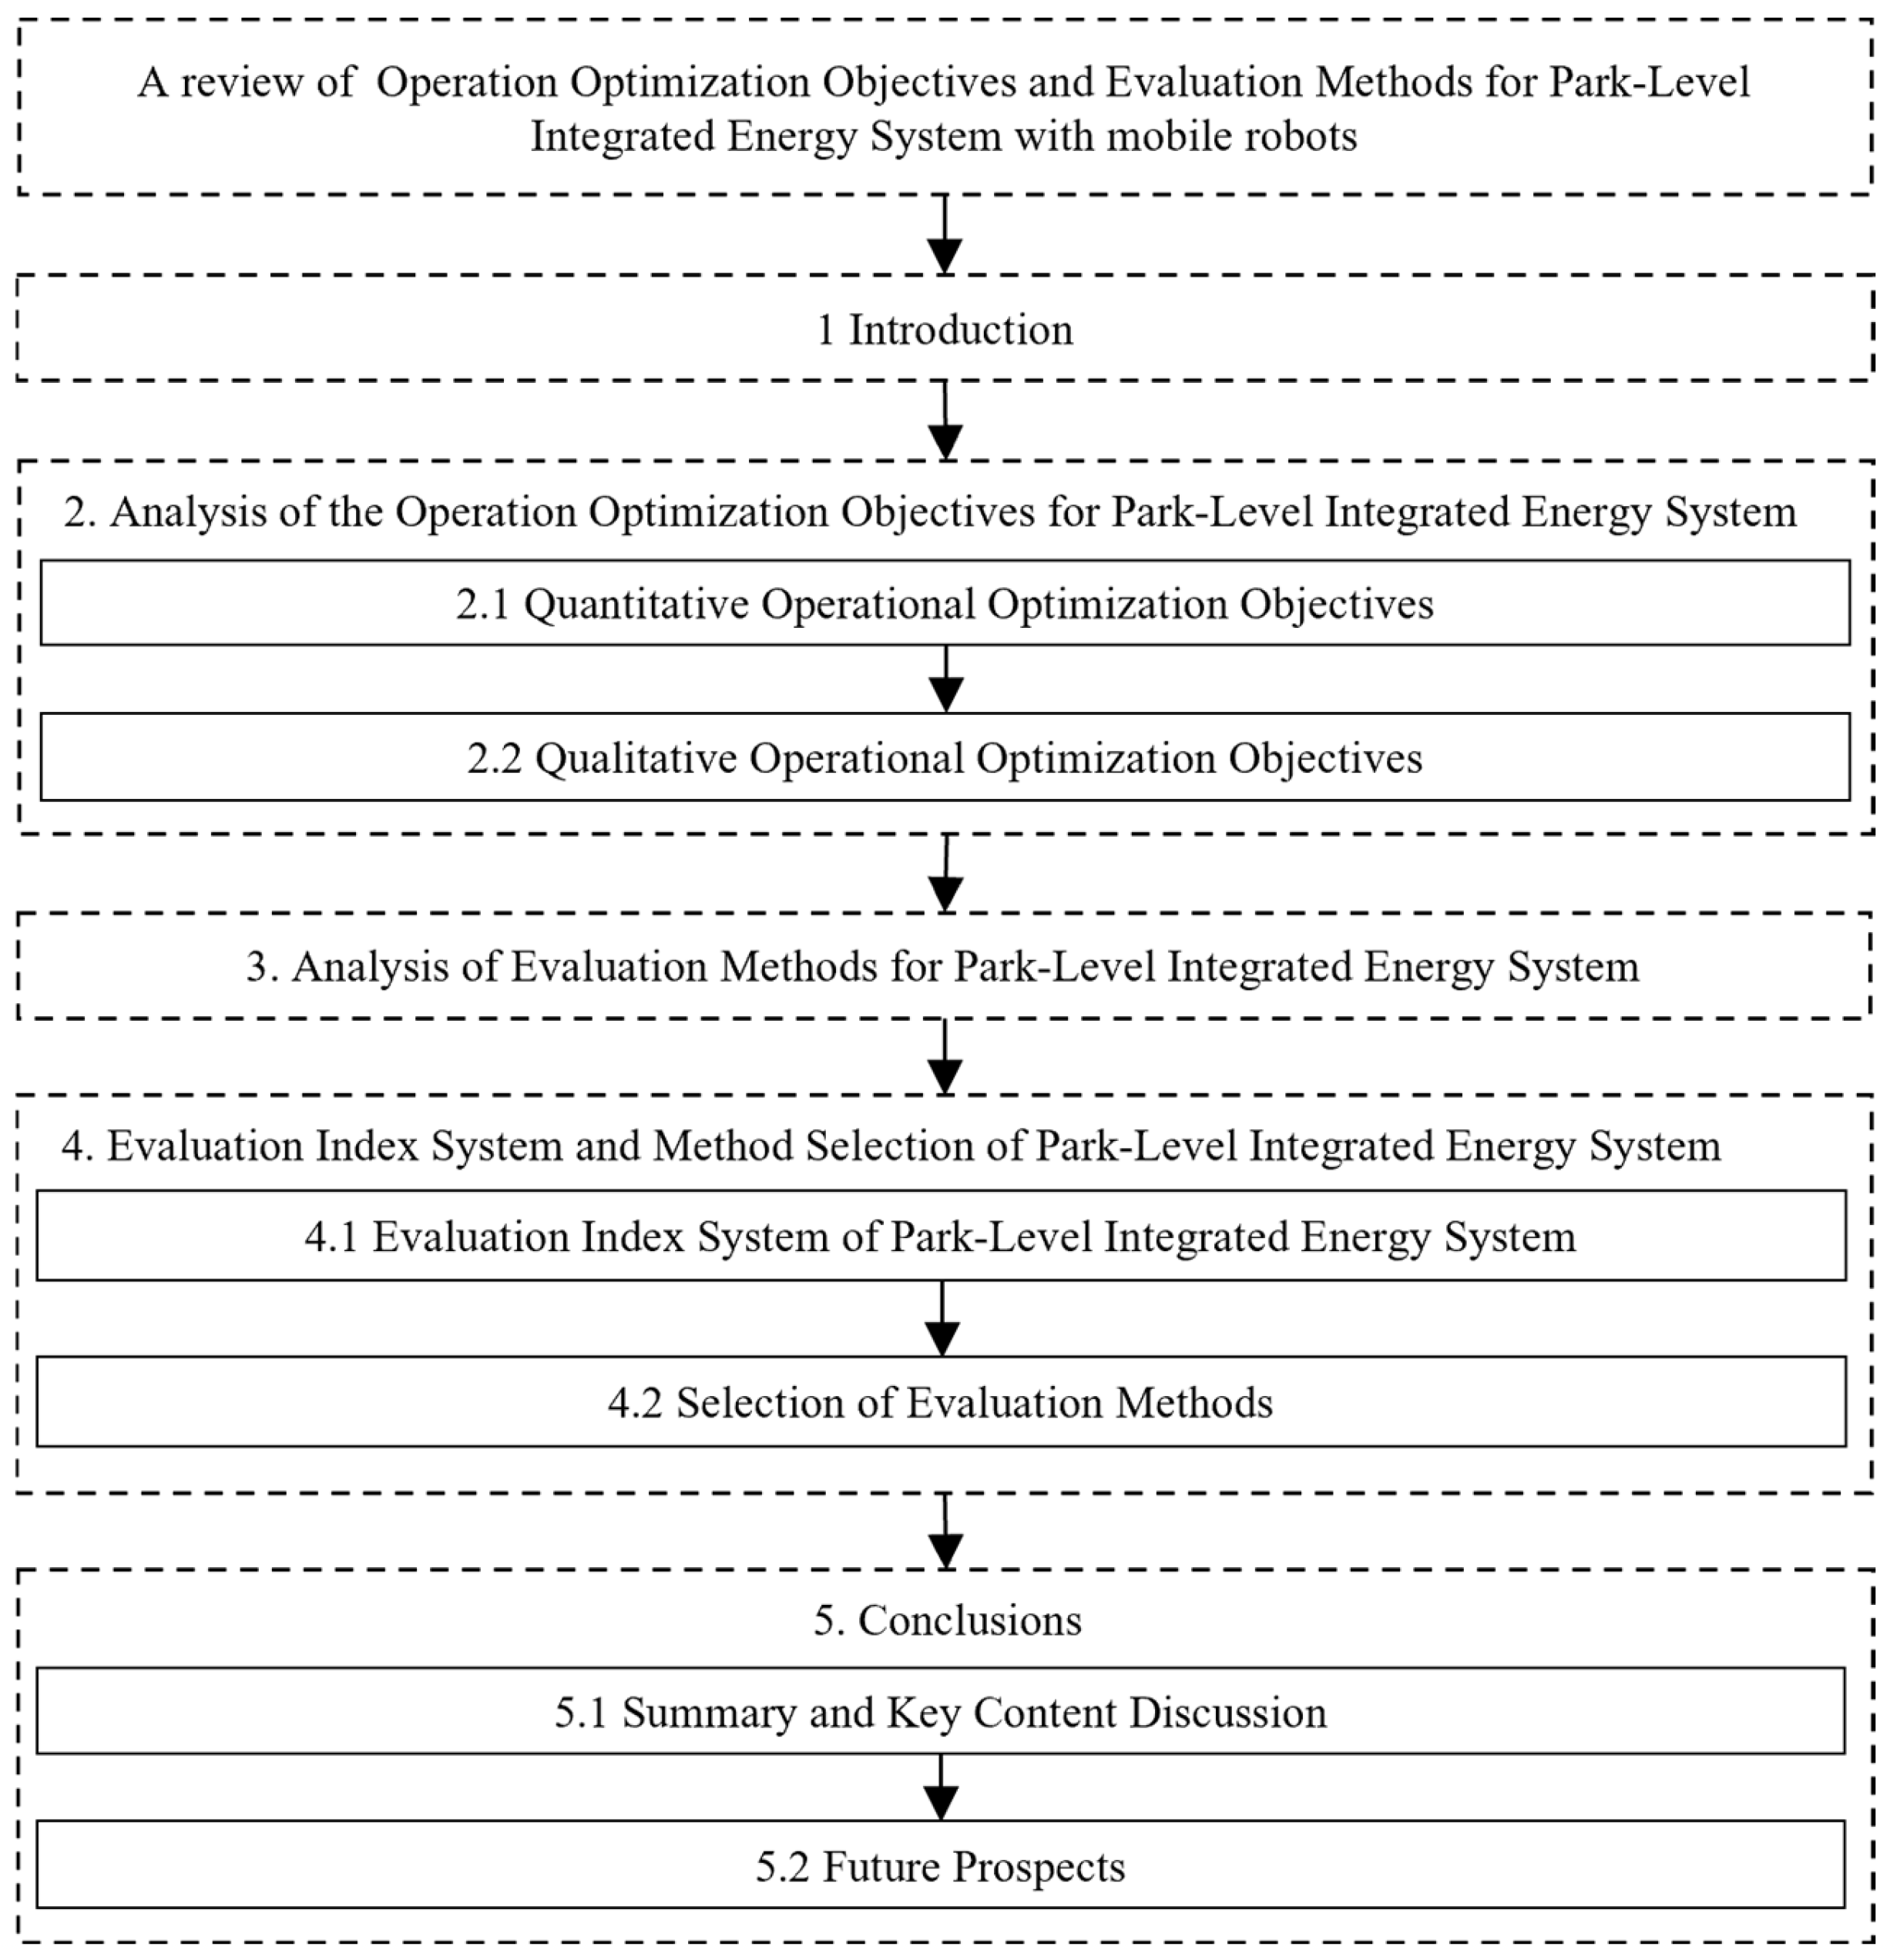
A Review of Operation Optimization Objectives and Evaluation Methods for Park-Level Integrated Energy System with Mobile Robots

1
State Grid Electric Power Research Institute Wuhan Energy Efficiency Evaluation, Wuhan 430074, China
2
Electric Power Research Institute of State Grid Zhejiang Electric Power Co., Ltd., Hangzhou 310014, China
*
Author to whom correspondence should be addressed.
Electronics 2025, 14(11), 2239; https://doi.org/10.3390/electronics14112239
Submission received: 8 May 2025 / Revised: 22 May 2025 / Accepted: 29 May 2025 / Published: 30 May 2025

Abstract

Aiming at the operation optimization and evaluation problems of a park-level integrated energy system with mobile robots, the current research status and main problems are reviewed from three aspects: classification of operation optimization objectives, sorting of evaluation methods, establishment of evaluation index system, and selection of evaluation methods. In terms of target classification, a clear taxonomy can be established by categorizing objectives into quantitative and qualitative indicators. From the perspectives of the economic, technical, environmental, and social dimensions, each indicator can be organized into three levels for systematic analysis and discussion. In terms of evaluation methods, the common evaluation methods of the park-level integrated energy system in the past ten years are summarized and organized. Then, the common secondary indicators are analyzed, the principle of the establishment of the evaluation index system is summarized, and suggestions are given for the selection of combined evaluation methods by discussing the common evaluation methods. Finally, the content is summarized and the research work on the operation optimization objectives and evaluation methods of the park-level integrated energy system is prospected.

1. Introduction

In 2020, China proposed the “3060” target, accelerating the transition towards low-carbon development in the energy sector [1]. Under the “dual carbon” context, improving energy utilization efficiency, exploring new energy sources, and achieving large-scale development of renewable energy have become inevitable choices for energy development. Consequently, the construction of Integrated Energy Systems (IESs) that cater to the diverse energy needs of end-users, including electricity, heating, cooling, and gas, and are characterized by the synergistic and efficient utilization of conventional and new energy sources, has emerged as an essential pathway for the transformation of the energy sector [2,3].
In recent years, with the integrated development of energy, research on optimization objectives and evaluation methods for the operation of park-level IESs has gradually increased both domestically and internationally [4,5]. In the domestic literature, reference [5] proposed a typical physical architecture for regional IESs, constructed physical and economic models for corresponding equipment, and organized a benefit evaluation index system and evaluation methods for IESs. Reference [6] reviewed and summarized the definitions and calculation methods of 41 performance evaluation indicators for integrated smart energy from four dimensions: energy utilization, environmental friendliness, economic society, and comprehensive intelligence. It distinguished similar indicators, pointed out their application scenarios, and highlighted the evaluation indicators that should be emphasized in the future. Reference [7], based on a case study of a park-level IES project, used the Analytic Hierarchy Process (AHP)-Entropy Weight Method (EWM) to determine the combined weights of indicators, integrated quantitative and qualitative indicators, and applied the fuzzy comprehensive evaluation method for comprehensive assessment, providing an overall performance score for the system. By analyzing the scoring results and influencing factors of 19 secondary indicators, it proposed directions and recommendations for optimizing the energy system. In the international literature, reference [8] proposed a decision support system to guide the site selection of solar power plants, employing the Fuzzy Analytic Hierarchy Process (FAHP) and the Technique for Order of Preference by Similarity to Ideal Solution (TOPSIS) for integrated analysis of qualitative and quantitative variables. Reference [9] explored the application of Multi-Attribute Decision-Making (MADM) methods in the evaluation of renewable energy applications, investigated the reasons and factors for adopting such methods, and concluded that the AHP, the Analytic Network Process (ANP), Elimination and Choice Translating Reality (ELECTRE) method, and Technique for Order Preference by Similarity to an Ideal Solution (TOPSIS) were the most widely used methods at the time.
The aforementioned articles conducted a certain degree of collation regarding the operational optimization objectives of IESs during the discussion. Based on this, they established an evaluation index system according to the needs and evaluated the existing evaluation methods for IESs. However, from an overall perspective, the existing research content still presents the following issues:
  • Lack of clarity in the classification of current park-level IES evaluation indicators. Although certain existing articles have organized and summarized various indicators, they are generally insufficiently comprehensive, and the classifications are unclear. There is no standardized or unified classification framework, which results in a rather disordered presentation of indicators and a lack of a clear systematic classification of evaluation indices.
  • Limited categorization and analysis of commonly used IES evaluation methods. There are numerous evaluation methods currently applied to park-level IESs, but only a few articles provide a comprehensive and systematic summary of these methodologies. Due to the varying contexts and objectives addressed by these methods, their frequency of use differs significantly, and there is a lack of detailed analysis or synthesis regarding their application and relevance.
  • Unclear relationship between evaluation index systems and evaluation method selection. While existing articles have developed evaluation index systems adapted to park-level IES and selected corresponding evaluation methods, few have conducted a holistic analysis of indicator selection. Furthermore, there is currently no standardized or universal process for evaluating park-level IESs, limiting consistent application in diverse scenarios.
To address the content and issues described above, this article aims to conduct a review focusing on three key aspects of park-level integrated energy systems: optimization objectives, evaluation methodologies, and evaluation index systems. In Section 2, the existing operational optimization objectives are discussed separately in terms of quantitative and qualitative aspects. Quantitative objectives will be further classified into four dimensions: economic, technical, environmental, and social; qualitative objectives will be categorized into technical, environmental, and social dimensions, with a three-level hierarchical framework to establish a unified classification structure. Section 3 classifies and organizes the commonly used evaluation methods for park-level IESs as presented in important domestic and international journal articles over the past decade, providing a statistical analysis of the frequency and application trends of these evaluation methods. Section 4 discusses an appropriate evaluation index system for park-level IESs based on the organized operational optimization objectives. Additionally, a universal evaluation process for a park-level IES is proposed, aiming to provide a reference for the optimization objectives, project evaluation, and subsequent operational maintenance of the park-level IES. Section 5 provides conclusions and the outlook. It is worth emphasizing that mobile robots, as one of the loads within an industrial park, may introduce dynamic power demand to the park, thereby increasing the complexity of energy management. Additionally, their reliance on batteries could have certain impacts on the park’s energy storage system. Given that, this paper focuses on the operational optimization objectives, evaluation methods, and evaluation index system of IESs, and mobile robots are discussed as a regular load within the park. The overall structure of the paper is shown in Figure 1.

2. Analysis of the Operation Optimization Objectives for Park-Level Integrated Energy System

The operation of a park-level IES usually revolves around one or more operational optimization objectives for optimization. Typically, operational optimization objectives are selected based on the actual situation of the park-level IES, and an evaluation index system for the park-level IES is established based on the selected objectives. There are many types of operational optimization objectives for the park-level IES, and they are divided into fine categories. Most of the operational optimization objectives can be analyzed quantitatively, with objective functions and constraint conditions listed, and advanced computational methods are used to bring in examples to calculate the optimal solution. However, some objectives can only be discussed through qualitative analysis. This section summarizes the existing operational optimization objectives and classifies and organizes them according to quantitative and qualitative aspects. Among them, quantitative objectives are divided into three levels and classified into four categories: economy, technicality, environmental friendliness, and sociality. Qualitative objectives are also divided into three levels and classified into three categories: technicality, environmental friendliness, and sociality.

2.1. Quantitative Operational Optimization Objectives

Currently, the optimization objectives selected by most industrial parks are predominantly quantitative. By integrating existing operational optimization data and evaluation indicators, the various quantitative optimization objectives have been systematically organized and categorized into four dimensions: economy, technicality, environmental friendliness, and sociality. Within these four categories, a total of 7 primary indicators, 27 secondary indicators, and 91 tertiary indicators have been identified. The detailed hierarchical structure of these indicators is presented in Table 1(a,b) [5,6,7,8,9,10,11,12,13,14,15,16,17,18,19,20,21,22,23,24,25,26,27,28,29,30,31,32,33,34,35,36,37,38,39,40,41,42,43,44,45,46,47,48,49,50,51,52,53,54,55,56,57,58,59,60,61,62,63,64,65,66,67,68].
An upward arrow following a first-level indicator signifies that a higher value of the indicator is preferable, whereas a downward arrow follows the same principle. The numbers preceding the third-level indicators correspond one-to-one with the numbers preceding the second-level indicators, indicating that the third-level indicators are associated with their respective second-level indicators as denoted by the matching numbers.
Upon further analysis, it is evident that, in terms of economy, the most frequently discussed operational optimization objective is minimizing the total system cost over a specific time scale. This objective encompasses a wide range of costs that must be taken into account, including initial investment costs, operation and maintenance costs over the equipment lifecycle, external energy purchase costs, operational penalty costs, and equivalent environmental costs. Among these, only government subsidy revenues are considered negative costs in the calculation. Another similar operational optimization objective is maximizing the comprehensive profit of the park-level IES. The content of this objective is largely consistent with that of minimizing total system costs. However, it additionally considers factors such as the distribution network profit, the net profit generated by each device within the park, and deferred construction benefits.
From a technical perspective, the most frequently discussed objectives are comprehensive energy efficiency and system reliability. In existing studies, the description of comprehensive energy efficiency objectives is diverse, including representative metrics such as integrated energy utilization rate, exergy efficiency, renewable energy curtailment rate, renewable energy absorption rate, and demand response level. Additionally, the coverage rate of energy information collection systems reflects energy efficiency objectives from a different angle, serving as an essential indicator for acquiring energy efficiency data. Furthermore, network losses, which are unavoidable, must also be considered in the analysis. Regarding system reliability, special attention is given to system adequacy under islanded operations. This is because, when the park-level IES operates in grid-connected mode, the external power grid stabilizes the power quality and reinforces the reliability of the park’s energy supply. However, when operating in islanded mode, the park-level IES must achieve autonomous stability, making its inherent robustness and reliability the key focus. As such, system operation in the grid-connected mode does not fully reflect the system’s standalone strength and reliability. Instead, the islanded mode should be adopted as the primary evaluation scenario [21]. Real-time extreme scenarios are also highlighted in the discussion, including sudden drops in wind power output and rapid increases in electrical load [35]. Other indicators focus primarily on the performance of devices and the overall system. The optimization of the system Energy Efficiency Ratio (EER) considers equipment energy efficiency ratios, with the energy consumption of various devices standardized by converting them into units of standard coal consumption for consistent measurement and comparison.
From an environmental perspective, the most frequently discussed metric is the annual equivalent environmental benefit. This primarily focuses on the emissions of various pollutants (such as carbides, sulfide, and nitrogen oxides) as well as carbon emissions (including carbon dioxide (CO2) and carbon particulates). It is worth noting that carbon particulates are considered both pollutants and carbon emissions, whereas CO2 is classified exclusively as a carbon emission and not a pollutant. Evaluating environmental benefits involves quantifying and minimizing the impacts of these emissions while promoting cleaner energy usage and enhancing overall sustainability. This dual focus on pollutant control and carbon reduction effectively aligns energy systems with environmental protection goals.
From a social perspective, discussions are relatively limited in the existing literature, with only the degree of load adjustability being quantitatively addressed. When a park-level IES participates in demand response initiatives, it guides users within the system to adjust their loads. These load adjustments directly impact users’ electricity usage experiences. In the classification of loads, shiftable loads and interruptible loads are eligible to participate in demand response and can be quantified. Metrics such as the proportion of these two load types in the total load, their activation status, and the maximum callable capacity are used to evaluate overall user satisfaction [65].

2.2. Qualitative Operational Optimization Objectives

The qualitative operation optimization objectives for park-level IESs are challenging to quantify due to the presence of subjective factors. Existing research rarely discusses these objectives comprehensively, and their classifications are often inconsistent. Based on the available literature, these qualitative indicators are reorganized into three main categories: technicality, environmental friendliness, and sociality. Across these three categories, the classification comprises 6 first-level indicators, 15 second-level indicators, and 24 third-level indicators. The structure is detailed in Table 2 [5,6,7,9,43,57,69,70,71,72,73].
From a technical perspective, the primary indicators include the technological development level and the operational assurance level. Secondary indicators reflecting the current level of technological development include the technological advancement level, demand-side interactivity, and technological maturity. The technological advancement level reflects research intensity and related technological achievements; demand-side interactivity relates not to the level of interaction but to technologies that support demand-side interactions, including the capability of integrating distributed energy and the prevalence rate of smart meters. Technological maturity specifically refers to the industrialization and practicality of various types of equipment, distinguishing it from the level of technological advancement. The aforementioned indicators reflect the impact of existing technologies on the operation of the park, while the operational assurance level focuses on the operation of the park itself, including safety and reliability and energy supply quality. Safety and reliability considers not only technical factors such as load location distribution, the degree of renewable energy utilization, the degree of energy storage utilization, and the accessibility of primary energy resources but also human factors like the professionalism and competency of the operation and maintenance personnel. Energy supply quality takes into account the quality of the supplied electricity, thermal energy, and gas.
From an environmental perspective, the primary indicators include environmental protection measures and environmental impact. Environmental protection measures refer to the actions taken by the park to reduce pollution to the surrounding environment, mainly indicating the configuration of purification equipment within the park, such as noise isolation equipment, air purification equipment, and water purification equipment. Environmental impact refers to the various effects the park may have on the surrounding environment, including noise, electromagnetic, atmospheric, water, and ecological impacts. The park should comply with relevant national standards and regulations.
In terms of social aspects, the primary indicators include external factors and social impact. External factors refer to macro factors influencing the park, including policy support and the state of social development. Policy support considers not only macro-control policies but also relevant industry policies. Social development encompasses the current state of the new round of electricity reform, current technological levels, and people’s energy demands. In addition to external factors affecting the park, the impact of the park on society should also be considered, which mainly includes the degree of contribution to the regional economy and the comfort level of end users. After the park begins operation, it is expected to bring certain benefits to local industries and employment. User comfort considers not only the hardware aspects such as the level of infrastructure development but also the satisfaction of users with energy supply and the overall service level.

3. Analysis of Evaluation Methods for Park-Level Integrated Energy System

In the development process of a park-level IES, a comprehensive evaluation of the system is indispensable to provide cases and support for subsequent system evaluations. The relevant evaluation methods can be divided into three categories according to their development process: single-index evaluation methods, multi-index comprehensive evaluation methods, and combined evaluation methods [31]. Among them, the multi-index comprehensive evaluation methods and combined evaluation methods are more frequently discussed. The multi-index comprehensive evaluation methods adopted in relevant literature from domestic key journals and some international publications over the past decade, along with the evaluation issues they address, are summarized in Table 3 [74,75,76,77,78,79,80,81,82,83,84,85].
The total number of articles is 45. In Table 3, the method numbers and problem type numbers in Table 3(b) and Table 3(c) respectively correspond to the adopted methods and problem type labels in Table 3(a). It can be seen from the table that with the development of technology, when evaluating IESs, most people will adopt the combined evaluation method. This is because it is difficult for a single evaluation method to reflect the overall state of IES. Multiple methods can complement each other and better achieve the overall evaluation of the system.
The occurrence frequencies of the adopted methods and problem types were counted, and the statistical results are shown in Figure 2 and Figure 3.
As can be seen from Figure 2, among the surveyed studies, the top three most frequently used methods are the entropy weight method, the analytic hierarchy process, and the fuzzy comprehensive evaluation method. Methods related to fuzzy mathematics and statistical analysis are often used in combination with other methods, so their occurrence frequencies are relatively high. The evaluation method combining the cloud model with other methods emerged in 2019, and its usage frequency is acceptable. Although other methods such as the DEMATEL method, grey relational degree method, and TOPSIS method are also used in a few cases, they are mostly used as auxiliary methods to other methods. There are many similar auxiliary methods, which may have affected the occurrence frequencies of the above-mentioned methods.
As can be seen from Figure 3, the evaluation of IESs encompasses diverse dimensions. Among the articles that conduct evaluations from a single perspective, site-selection evaluation and benefit evaluation are relatively more common than other perspectives. Overall, however, the cases of the comprehensive evaluation of IESs are the most numerous. Comprehensive evaluation does not merely consider one type of indicator. Instead, it starts from multiple dimensions and conducts a comprehensive assessment of IESs from economic, technological, environmental, social, and other perspectives, which can better reflect the overall situation of the system.
When selecting methods, the issues to be considered include whether the evaluation is a single-objective evaluation; if it is a comprehensive evaluation, whether the established indicator system is comprehensive; and if the indicator system is relatively comprehensive and complex, whether the selected method can uniformly handle various qualitative and quantitative indicators and achieve the goal of the final evaluation. Most of the existing IES evaluations are comprehensive evaluations. As known in Section 1, there are various types of qualitative and quantitative indicators. Therefore, how to establish an indicator system according to the system type and select an appropriate evaluation method is a major difficulty in the current comprehensive evaluation of IESs.

4. Evaluation Index System and Method Selection of Park-Level Integrated Energy System

After collation, there are 13 first-level indicators, 42 second-level indicators, and 115 third-level indicators for the quantitative and qualitative indicators of the park-level IESs. It is difficult to take all indicators into account when establishing an evaluation index system. Therefore, it is necessary to selectively establish an appropriate evaluation index system according to the characteristics of the park-level IES. At the same time, an appropriate evaluation method should be selected according to it. It is necessary to not only reduce the workload but also be able to handle various indicators in the indicator system and conduct an overall evaluation of the park-level IES.

4.1. Evaluation Index System of Park-Level Integrated Energy System

Based on the existing operation optimization objectives of the park-level IES, the frequently considered optimization objectives of the park-level IES can be known according to their occurrence frequencies, and these can be used as evaluation indicators to construct an evaluation index system. During the statistics, qualitative and quantitative indicators are counted separately, and secondary-level indicators are selected for statistics. The advantage of this selection is that it is possible to quickly locate the corresponding tertiary-level indicators based on the secondary-level indicators while taking all the primary-level indicators into account to ensure the comprehensiveness of the evaluation index system. Since the primary-level indicators are divided into four categories, namely, economy, technicality, environmental friendliness, and sociality, taking “initial investment cost” as an example, it is the first economic indicator among the quantitative indicators and is represented as “Eco1” on the horizontal axis of the statistical chart of quantitative indicators. The representation of other indicators is similar. A total of 52 articles were involved in the statistics, and the statistical results are shown in Figure 4 and Figure 5 [5,6,7,8,9,10,11,13,14,16,17,18,20,21,22,23,24,25,26,28,29,30,31,32,33,34,35,38,39,42,43,44,45,46,47,48,49,50,52,53,54,55,57,58,59,60,61,69,70,71,72,73].
As can be seen from Figure 4, among the quantitative indicators, the occurrence frequency of economic indicators is much higher than that of other types of indicators. Due to the large variety of technical indicators, the overall occurrence frequency of technical indicators is higher than that of environmental indicators. Although there are only two secondary-level environmental indicators, the occurrence frequency of each single environmental indicator is higher than that of any one of the technical indicators. The preceding content is annotated that currently, the most frequently considered factor in the park-level IES is the economic indicator, that is, the focus is on whether the total system cost of the park-level IES is relatively low. The next are the environmental and technical indicators, and the least considered are the social indicators. By screening with an occurrence frequency greater than five times, the frequently discussed quantitative indicators are shown in Table 4.
As can be seen from Figure 5, overall, the occurrence frequency of qualitative indicators is much lower than that of quantitative indicators. Specifically, technical indicators are considered more in general, followed by social indicators, and environmental indicators are considered the least. By screening with an occurrence frequency greater than or equal to 3 times, the frequently discussed quantitative indicators are shown in Table 5.
Through the statistics of the occurrence times of various indicators, a total of 18 evaluation indicators are obtained, including 11 quantitative indicators and 7 qualitative indicators. These indicators are quite common and representative at present. Different park-level IESs can make selections based on the above-mentioned indicators to establish corresponding evaluation index systems. This can not only reflect the characteristics of the park-level IES in a targeted manner, meet the various requirements of the current era for the park-level IES, but also cover economic, technical, environmental, and social aspects, thus achieving a comprehensive evaluation of the park-level IES.
When establishing an evaluation indicator system, the following aspects need to be considered:
  • The actual conditions of the park: Different parks may vary in terms of included electrical equipment, environment, energy types, and prioritized operational objectives. When selecting indicators based on the specific conditions of the park, it is necessary to adopt a practical and adaptive approach, aligning the evaluation index system with the park’s environment, needs, and operational optimization objectives.
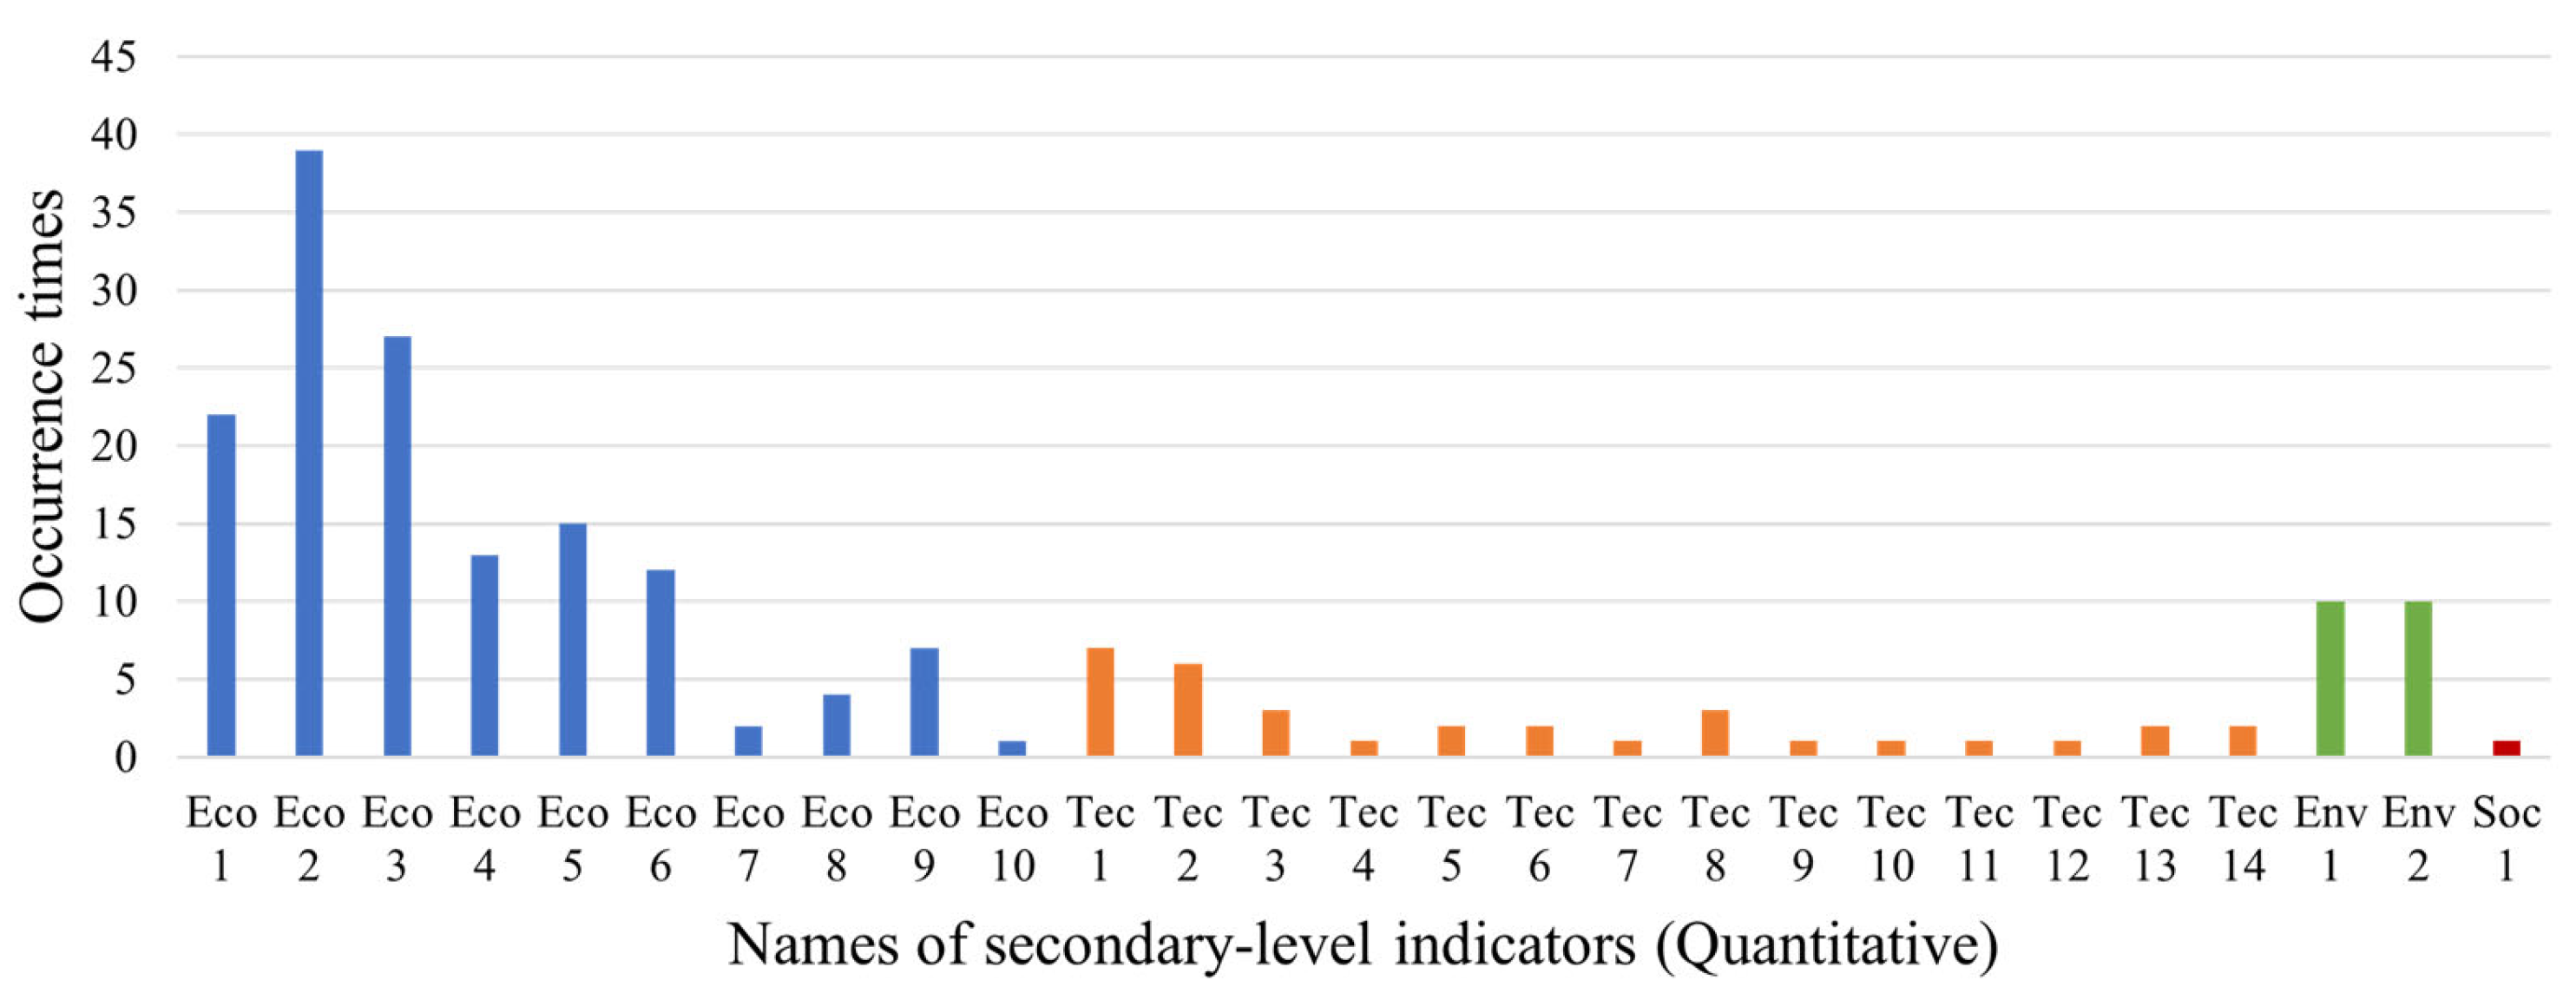
  • The comprehensiveness of indicator selection: As indicated by the classification of the aforementioned indicators, the current set of indicators is extensive and includes both quantitative and qualitative measures. Moreover, these indicators can be categorized into four types and three levels based on their classification. Therefore, when selecting indicators, all categories and levels should be considered to better reflect the overall state of the park. Generally, to balance the subjectivity and objectivity of the evaluation index system, the number of quantitative indicators is slightly higher than that of qualitative indicators. Additionally, based on the park’s prioritized operational optimization objective (economy-oriented, efficiency-oriented, or environment-oriented), the proportion of indicators corresponding to the prioritized objective should be slightly higher than for other objectives. To ensure comprehensiveness, after selecting secondary indicators according to their nature, tertiary indicators should be chosen based on the actual conditions of the park for inclusion in the evaluation index system.
  • The complexity of calculations: From another perspective, it is important to understand that the evaluation index system does not necessarily improve with an increasing number of indicators. While an extensive and comprehensive selection of indicators may result in evaluation outcomes better aligned with the park’s actual conditions, when the number of indicators exceeds a certain threshold, the workload required for calculations will increase exponentially, and some evaluation methods may no longer be applicable. In actual selection, it is necessary to balance practical needs with workload and corresponding time costs. While striving for a comprehensive evaluation, efforts should be made to minimize computational complexity and associated costs.

4.2. Selection of Evaluation Methods

In Section 2, a total of 35 evaluation methods used for park-level IESs within the past 10 years were organized. According to Figure 2, by screening with an occurrence frequency greater than or equal to five times, it can be seen that the more frequently used evaluation methods are AHP, the fuzzy mathematics method, FCE, EWM, statistical analysis methods, cloud model, and the matter-element extension analysis method. Among them, EWM is the method with the highest frequency of use. As an objective weighting method, it is often used in multi-index decision-making analyses. By determining weights based on the entropy of the data itself, EWM is characterized by high objectivity, effective handling of multidimensional data, and strong flexibility. As a data-driven decision-making method, EWM is highly efficient for refined analyses of quantitative indicators in scenarios involving high-quality data. Moreover, it can be conveniently implemented through computer software, further enhancing its utility. These attributes are particularly effective in scenarios dominated by quantitative indicators. However, EWM also has notable limitations. It requires accurate and complete data, and in situations where the data quality is poor or contains extreme values, the weight allocation derived from EWM may become unreasonable, thereby leading to distorted evaluation results. Furthermore, when EWM is applied independently, especially in cases involving subjective factors such as policies or user preferences, its reliance solely on data makes it challenging to account for user preferences or expert knowledge. This may result in evaluation outcomes that do not accurately reflect real-world requirements. Considering the aforementioned strengths and weaknesses, EWM exhibits a relatively high applicability to IESs. Firstly, IESs typically involve complex multi-criteria evaluation systems, where EWM is proficient in handling such intricate indicator frameworks. Secondly, IESs include substantial portions of objective evaluations that are data-dependent, making EWM suitable for accurately and objectively assessing these aspects. However, IESs also encompass subjective factors such as user preferences and policy orientations, which may require assigning higher weights to relevant indicators. Additionally, there exist highly correlated indicators within IESs, such as the significant negative correlation between energy utilization efficiency and carbon emissions. In such cases, EWM may assign incorrect weights due to its inherent limitations, potentially leading to a deviation between the evaluation results and actual scenarios.
However, as can be seen from Table 3, AHP is often used in combination with EWM in method selection. As a subjective weighting method, AHP makes decisions following the thinking mode of decomposition, comparison, and judgment. It is characterized by a clear framework, strong logical consistency, simplicity in principles and procedures, flexibility, and its ability to handle qualitative indicators. Nevertheless, AHP also has certain limitations. Its subjectivity makes it highly reliant on expert judgment, and when dealing with a relatively large number of indicators (e.g., more than 15 indicators), the complexity of the comparison matrix grows exponentially, which can render the evaluation process cumbersome and significantly reduce computational efficiency. Additionally, AHP requires consistency checks to ensure logical consistency in judgments, which may present challenges in highly complex evaluation frameworks with multiple hierarchical levels, making it difficult to satisfy strict mathematical requirements. Considering the aforementioned advantages and disadvantages, AHP also demonstrates considerable applicability to IESs. This is because IES evaluations require a combination of subjective and objective factors, and its operational objectives and decision logic are often relatively well-defined during the establishment of the evaluation framework. AHP allows consideration of subjective preferences and can convert qualitative indicators into quantitative analyses for processing. However, AHP alone struggles to handle the objective evaluation aspects of IESs. Thus, combining AHP with objective weighting methods, such as EWM, becomes essential to achieve a more comprehensive and holistic evaluation of IESs. When combined with EWM to form a subjective-objective weighting method, the advantages of both can cover multiple dimensions of the evaluation of park-level IESs, and they can handle both quantitative and qualitative indicators simultaneously, which can improve the scientificity and credibility of the evaluation results. In [118], the AHP method was first used to calculate the subjective weight, then the label weight was obtained through EWM, and finally, the two were combined to obtain the comprehensive coupling weight, and a comprehensive evaluation was carried out for the comprehensive evaluation index system of a park-level IES in the north.
The FCE method is an evaluation method based on the theory of fuzzy mathematics. It is applicable to evaluation problems that are difficult to describe with precise numerical values, especially when evaluation indicators are difficult to quantify or evaluation criteria are unclear. Compared with AHP, it can determine indicator weights by combining objective data. Through the membership function of fuzzy mathematics, the evaluation results are made more objective, scientific, and systematic, and the evaluation results are more intuitive. At the same time, when the evaluation indicator set is large, FCE can also handle hyper-fuzzy phenomena by combining the advantages of AHP. Therefore, it can be used alone or combined with EWM and AHP to form a new combined evaluation method. However, its limitations lie in the relatively complex computational process and the difficulty of directly interpreting how specific indicators influence the system, as the results are typically represented as a fuzzy score or a range of grades. Considering its strengths and weaknesses, this method demonstrates greater applicability when combined with other methods such as EWM and AHP, leveraging their complementary advantages. Such combinations make it suitable for operational evaluation scenarios in IESs. In the evaluation of existing park-level IESs, this type of method has already been partially adopted in practice. In [7], the quantitative indicators in the evaluation index system were first calculated, then the qualitative indicators were quantified and standardized, followed by normalizing the quantitative indicator data. After that, AHP-EWM was used to determine the weights of each indicator. Finally, based on FCE, a comprehensive evaluation calculation of a typical park-level IES was carried out to obtain the scores of each indicator.
The fuzzy mathematics methods adopted in the evaluation methods of park-level IESs mainly focus on the application of fuzzy sets and fuzzy numbers. Although these methods cannot be directly used for evaluation, they have a rather important application in the normalization processing of indicators. This type of method addresses the limitations of traditional mathematical approaches in handling uncertainty and non-quantifiable information by utilizing fuzzy sets and membership functions. Its characteristics enable it to effectively deal with the uncertainty and fuzziness of indicators, making it particularly advantageous for complex evaluation systems. In [113], according to the fuzzy set theory, the indicators were divided into two categories: cost-type and profit-type. Then, each indicator was fuzzed through the membership function, the membership function was obtained, and a comprehensive benefit indicator optimization function was obtained by weighted summation. Subsequently, the indicator weights were determined based on AHP and the inverse entropy weight method, and the combined weight was calculated. Finally, the score function was calculated to achieve a comprehensive evaluation of the multi-energy complementary new energy projects in two parks in a coastal province of China.
The function of the statistical analysis method is similar to that of the fuzzy mathematics method. Although it cannot be directly used for evaluation, the use of such methods is helpful for processing data such as weights. Methods such as regression analysis, correlation analysis, and multivariate fitting fall under this category, as they can uncover potential relationships among various indicators. Descriptive statistics (e.g., mean and variance), inferential statistics (e.g., hypothesis testing and confidence intervals), time series analysis, and multivariate statistical analysis (e.g., principal component analysis and clustering analysis) each serve distinct purposes. These characteristics reflect the high flexibility of these methods, allowing the selection of specific techniques to process data based on particular needs. Therefore, the integration of these methods with others for the operational evaluation of IESs is highly appropriate. In [120], when determining the weights for multi-indicator evaluation, the improved grey TOPSIS method was adopted to evaluate the distances between each scheme and the positive and negative ideal solutions. The least-squares method was used to combine the results of the entropy weight method and the coefficient of variation method for weight assignment. Finally, a comprehensive evaluation was carried out taking a certain industrial park as an example.
The application of the cloud model in the evaluation of integrated energy systems is relatively late, first emerging in 2019 [121]. Generally, it is also used as an auxiliary method to integrate the randomness and fuzziness of concepts, and can better solve problems under uncertain conditions. As a mathematical model that facilitates the transformation between qualitative and quantitative data, the cloud model effectively converts abstract qualitative concepts into quantitative data while preserving the fuzziness and randomness inherent in the information. For instance, in IESs, indicators often involve random fluctuations or uncertainties, such as changes in energy prices or user demand variations. The cloud model can effectively characterize such randomness and uncertainty through entropy and hyper-entropy parameters, making it a powerful tool in these scenarios. In [102], the fuzzy group analytic hierarchy process was used to consider the index weights for the benefit evaluation of the multi-energy complementary energy system. Then, the cloud model was adopted to replace the membership degree model in the general method to describe the overall quantitative attributes in qualitative concepts, obtaining a membership degree value. Finally, the evaluation result was obtained through summary calculation. This method was ultimately verified in a multi-energy complementary new energy project in a park in Zhejiang Province, China.
The matter-element extension analysis method is a multi-objective decision-making method proposed by Chinese scholars. This method is applicable to solving decision-making problems where the evaluation results of individual indicators are incompatible. For example, when the natures and interest pursuits of various participants in a regional integrated energy system are different, resulting in contradictory indicators, this method can better solve the multi-objective decision-making problem [69,122]. For example, when a balance issue emerges between economic efficiency and environmental protection in an IES, the matter-element extension analysis method can utilize extension theory to address internal contradictions within the system, offering solutions for multi-objective conflict problems. This method is particularly advantageous in handling complex multidimensional issues, combining qualitative and quantitative indicators, processing heterogeneous data, and providing intuitive results. However, the disadvantages include its strong reliance on the construction of the correlation functions, which requires robust theoretical foundations and specialized knowledge, as well as its dependency on high-quality data and relatively high computational complexity. In summary, this method demonstrates excellent applicability in scenarios involving multi-indicator evaluation, integration of qualitative and quantitative information, and multi-objective optimization problems in complex systems. Hence, it is also well-suited for operational evaluation in IESs. In [108], a combined weight-assignment method of “minimum weight deviation vector” was proposed. It integrated the AHP method, Delphi method, entropy weight method, and mean-square deviation method for weight integration. Then, the matter-element extension analysis method and the combined weight-assignment strategy were used to optimize the indicator weights. Finally, the comprehensive correlation degree of the plan was calculated to obtain the evaluation result. This method was applied to a park-level IES in southern China.
Based on the above-mentioned common methods and cases, it is found that the general process of the evaluation method for park-level IESs is as follows: construct a reasonable evaluation index system, provide a calculation formula for each quantitative index in the system, and give a clear definition for qualitative indicators. Then, according to the established evaluation index system, select an effective evaluation method to establish an object-oriented comprehensive evaluation model for park-level IESs. First, the model needs to determine the weights of evaluation indicators at all levels through a subjective weighting method, an objective weighting method, or a combination of subjective and objective weighting methods. Then, through the selected auxiliary methods and comprehensive evaluation methods, determine the comment set and range, calculate the membership degree of each indicator or other values, and summarize to obtain the final evaluation result. It can be seen that the entire process involves the selection and combination of weighting methods, auxiliary calculation methods, and comprehensive evaluation methods. When selecting methods, the choice of weighting methods should consider both subjectivity and objectivity. The auxiliary methods should consider the complexity of calculation and the difficulty level in practical applications. The evaluation method should consider the accuracy of the final evaluation result. At the same time, it is also necessary to consider whether the selected methods are compatible with each other and whether they are suitable for the selected scenario. Among the high-frequency evaluation indicators identified in Section 4.1, the evaluation system, for example, includes indicators such as initial investment costs, profits generated by each piece of equipment, comprehensive energy utilization rate, pollution emissions, carbon emissions, policy support, and end-user comfort level. This evaluation framework encompasses both quantitative indicators, such as initial investment costs and comprehensive energy utilization rate, and qualitative indicators, such as end-user comfort level. Therefore, when selecting an appropriate evaluation method, it is critical to adopt a weighting approach that combines both subjective and objective methods: subjective weighting methods address qualitative indicators, while objective weighting methods deal with quantitative indicators, ensuring a comprehensive evaluation of all types of factors within the system. Considering the seven indicators in the evaluation system, end-user comfort level inherently exhibits a degree of fuzziness. Furthermore, the selected indicators span multiple dimensions, including economic, technical, environmental, and social categories, and these indicators are further divided into corresponding tertiary sub-indicators, reflecting a multi-layered structure. Additionally, there is an absence of strong internal interdependencies among the indicators, making methods such as the ANP less applicable. Moreover, the objective of the evaluation is to score and assess the performance of a single system, as opposed to ranking multiple systems (as in DEA and TOPSIS) or extracting information and analyzing trend variations (as in GRA). In summary, considering the characteristics of the evaluation system, FCE is deemed the most suitable method.

5. Conclusions

5.1. Summary and Key Content Discussion

This paper focuses on the operation optimization objectives and evaluation methods of park-level IESs. Firstly, it discusses the common operation optimization objectives of park-level IESs. Based on the established classification framework, the existing quantitative and qualitative indicators are individually statistically analyzed and are classified in detail according to four categories, namely, economy, technicality, environmental friendliness, and sociality, with three levels. A total of 13 first-level indicators, 42 second-level indicators, and 115 third-level indicators are summarized. Subsequently, the evaluation methods of park-level IESs are statistically analyzed. The important domestic and foreign studies on IES evaluation methods in the past decade are summarized and organized, clarifying 35 methods commonly used in park-level IESs and eight types of evaluation problems. Finally, the establishment of the evaluation index system and the selection of evaluation methods are discussed and analyzed. The frequencies of occurrence of each evaluation indicator in more than 50 studies are counted, and a total of 18 most commonly used qualitative and quantitative indicators are summarized. Then, the methods with the highest frequency of occurrence are analyzed and discussed, clarifying the composition of the evaluation methods.
In Section 2, faced with the complexity of operational optimization objectives, a classification framework was adopted, which divides the objectives into two categories: quantitative and qualitative. These are further categorized based on economic, technical, environmental, and social aspects, with three hierarchical levels. Such a classification framework makes the structural system of operational optimization objectives clearer and more complete, and by employing a standardized classification method, it becomes more convenient for operation and maintenance parties to construct evaluation index systems. However, this framework also has certain disadvantages. The detailed classification and hierarchical structure may result in over-refinement during system analysis, potentially neglecting overall objectives and increasing analytical complexity. Some indicators may have relatively limited practical value, which adds to the complexity of using this framework. The classification of qualitative indicators might introduce subjective biases, leading to potential disputes under certain conditions. After classification, while emphasizing the independence of each indicator, the framework may overlook the fact that some indicators might simultaneously belong to other categories. For instance, the qualitative indicator “degree of regional economic contribution” can also be quantified through specific methodologies, which blurs the boundary between qualitative and quantitative objectives and raises similar debates. In addition, for certain specific scenarios, such as those involving mobile robots in a park, unique energy consumption objectives may exist, and this framework may fail to accommodate all special cases, thereby causing challenges in adapting to special scenarios.
In Section 3, a variety of evaluation methods applicable to industrial parks were reviewed in this section, but none of the summarized methods were integrated with Artificial Intelligence (AI). AI possesses powerful capabilities in data processing and model optimization. When applied to evaluation purposes, it can leverage fuzzy logic and expert systems to generate flexible evaluation schemes tailored to parks. Utilizing deep learning and neural network analysis models, qualitative indicators can be converted into quantifiable data, reducing the subjective bias that often arises from manually configured evaluation systems. Furthermore, through multi-task learning models, the interrelationships among multidimensional indicators can be analyzed, thereby enhancing the accuracy of evaluation results. AI can also automatically generate evaluation reports and analytical charts, thereby improving assessment efficiency and accuracy while reducing human efforts.
In Section 4, the frequency of occurrence of indicators was statistically analyzed and the most frequently used evaluation methods were discussed. It is evident that, when selecting indicators, quantitative indicators are chosen far more frequently than qualitative indicators. This undoubtedly reduces the subjectivity of evaluation results; however, it simultaneously diminishes the influence of qualitative indicators in the evaluation process. During the process of indicator selection, certain low-frequency indicators were excluded, yet in actual practice, the importance of some indicators cannot be entirely replaced by their frequency of occurrence. Specific analysis is required by consulting expert opinions, policy directives, and practical validation results. Likewise, as classification may reveal that certain indicators possess multiple attributes, indicator selection must also take into account the coupling relationships among indicators and the issue of overlapping coverage, which may cause information redundancy. When selecting methods, it is essential to align them with the proposed evaluation index system to ensure that the chosen methods are appropriately matched with the indicators.
Through this summary, we have clearly identified the operational optimization objectives, evaluation methods, and evaluation index system currently adopted by the park-level IESs. Here, the contents of two articles, Refs. [31,107] are discussed and compared as representative cases to further substantiate the key aspects of the paper.
The park-level IES in [31] is located in Tianjin, China, providing the integrated supply of cooling, heating, and electricity for the park. It includes various energy devices, such as photovoltaics, energy storage, ground source heat pumps, ice storage systems, heat storage electric boilers, and water chillers. The design philosophy emphasizes “energy-saving, environmental protection, ecology, and intelligence”, with the goal of building an “energy technology and service innovation” park. Thus, when constructing the evaluation index system, the evaluation was approached from three perspectives, namely, economic, technical, and environmental, with a total of 32 indicators divided into three hierarchical levels. Considering the evaluation model of the target system, the article utilized a combination of AHP and EWM to determine indicator weights and applied the fuzzy membership principle in the FCE method to process the indicator results, ultimately yielding the final evaluation score. Overall, the system’s evaluation concluded that its operational performance is good, with satisfactory economic outcomes, technical reliability challenges in aspects such as electrical power reliability and distribution network losses, and strong environmental performance. Based on the results, the evaluation methods and the evaluation index system successfully reflect the overall operational status of the park-level IES. However, the article also pointed out that the current evaluation scheme mainly focuses on the energy system level. For future energy internet-oriented applications, in addition to the energy system level, the information layer would also need consideration, which is not addressed in the current evaluation framework.
The IES described in [107] is located in a city in western China, set up as a wind–solar–CCHP system providing cooling, heating, and electricity for buildings. It incorporates diverse energy devices such as wind turbines, photovoltaics, gas boilers, gas turbines, solar collectors, and cooling equipment. The operational optimization objective is to enhance energy utilization efficiency while reducing operational costs. Accordingly, the evaluation index system was constructed from the economic, technical, and environmental perspectives with a total of six indicators, but without hierarchical classification. For the selected indicators, the article employed a combination of fuzzy-analytic hierarchy process, anti-entropy weight method, and Multi-Objective Decision-Making (MODM) based on game theory to calculate indicator weights, and finally used the fuzzy comprehensive evaluation method to analyze the system’s overall performance. Conclusions from the analysis indicated that the economic, technical, and environmental performance of the system is superior to typical CCHP systems; however, the initial investment and maintenance costs are relatively high. Based on the results, the evaluation index system effectively reflects the operational status of this IES, demonstrating its optimized performance within its type. Nonetheless, the article also noted that the relatively small number of selected indicators may not fully capture the comprehensive nature of the system, and the absence of energy storage systems has not been addressed.
By comparing the two cases, it is evident that the operational optimization objectives of IESs typically consider economic and technical indicators, with limited attention to environmental indicators; social indicators tend to receive less focus. The methods adopted primarily revolve around determining indicator weights and final scoring, often leveraging three to four combined approaches for comprehensive evaluation. The evaluation results generally cover the strengths and weaknesses of the systems, achieving an assessment that integrates both subjective and objective elements. However, it is also apparent that the current evaluation frameworks lack comprehensiveness, while the use of multiple methods often introduces challenges in balancing computational complexity with the comprehensiveness and objectivity of park evaluations. In practice, due to the varying characteristics of individual parks, the evaluation index systems differ considerably, which has led to the current absence of a unified framework or standard to regulate the evaluation of park-level IESs.

5.2. Future Prospects

Due to the structural diversity and the complexity of equipment operation in park-level IESs, the research on their operation optimization objectives and evaluation methods still needs further improvement. First, the current relevant operation optimization objectives and evaluation indicators mostly focus on various quantitative indicators in park-level IESs, but there are few systematic and clear classifications of various qualitative indicators, and few are incorporated into the evaluation index system for consideration. These qualitative indicators mainly cover the technical, environmental, and social aspects. Especially in the social aspect, it can greatly supplement the elements that cannot be considered by quantitative indicators and should be taken into account when establishing the evaluation indicator system. Second, there are few cases of comprehensive evaluation by combining artificial intelligence methods among the currently commonly used evaluation methods. In the comprehensive evaluation of park-level IESs, the system characteristics, behaviors, formation processes, and performances of park-level IESs all have important impacts on the evaluation results. Through artificial intelligence methods, combined with digital twin technology, the above-mentioned elements of park-level IESs can be accurately described and modeled, which helps to clarify the causes of the comprehensive evaluation results. Third, the establishment of the current evaluation index system mainly focuses on the respective and overall operation conditions of energy equipment in the park; however, there are few evaluation indicators for the electronic information equipment and technologies that control these devices. Against the backdrop of the widespread application of many intelligent devices and artificial intelligence technologies, a series of fundamental changes will occur in the architecture, operation and maintenance methods, and interactivity with the outside world of park-level IESs, which will also drive the further development of park-level IESs. The extent of its influence is currently unknown. Therefore, it is necessary to evaluate the value and influence brought by these intelligent devices and technologies to clarify their implicit benefits to park-level IESs.

Author Contributions

Conceptualization, K.W., M.Y., H.L. and J.C.; methodology, K.W., M.Y. and H.L.; software, K.W. and M.Y.; validation, K.W. and M.Y.; formal analysis, K.W. and M.Y.; investigation, H.L. and J.C.; resources, K.W., M.Y., H.L. and J.C.; data curation, K.W. and M.Y.; writing—original draft preparation, H.L. and J.C.; writing—review and editing, K.W. and M.Y.; visualization, K.W. and M.Y.; supervision, H.L. and J.C.; project administration, K.W., M.Y., H.L. and J.C.; funding acquisition, K.W. All authors have read and agreed to the published version of the manuscript.

Funding

This research was funded by the Science and Technology Project of State Grid Corporation (Grant No. 5400-202419199A-1-1-ZN).

Data Availability Statement

No new data were created or analyzed in this study. Data sharing is not applicable to this article.

Acknowledgments

The authors would like to thank the reviewers for their valuable comments and suggestions.

Conflicts of Interest

Authors Kaibin Wu and Mengmeng Yue were employed by the company State Grid Electric Power Research Institute Wuhan Energy Efficiency Evaluation, Wuhan, China. Authors Hongkun Lyu and Jiaying Chen were employed by the company Electric Power Research Institute of State Grid Zhejiang Electric Power Co., Ltd., Hangzhou, China. The authors declare no conflicts of interest.

References

  1. Zhang, X.; Jiang, K.; Zhao, Y.; Lu, Z.; Zhao, X.; Lu, X.; Huang, H.; Bai, K. Promoting interdisciplinary research on mechanisms and pathways for energy and climate co-governance. J. Glob. Energy Interconnect. 2021, 4, 1–4. [Google Scholar] [CrossRef]
  2. Jia, H.; Wang, D.; Xu, X.; Yu, X. Study on some key problems related to integrated energy systems. Autom. Electr. Power Syst. 2015, 39, 198–207. [Google Scholar] [CrossRef]
  3. Huang, Z.; He, G.; Yan, H.; Tang, Y. Overview and prospect of optimization model function for community-scale integrated energy system. Electr. Power Autom. Equip. 2020, 40, 10–18. [Google Scholar] [CrossRef]
  4. Zhu, J.; Liu, H.; Ye, H.; Chen, J.; Chen, L.; Mei, S. Review on optimal operation of park-level integrated energy system. High Volt. Eng. 2022, 48, 2469–2482. [Google Scholar] [CrossRef]
  5. Zeng, M.; Liu, Y.; Zhou, P.; Wang, Y.; Hou, M. Review and prospects of integrated energy system modeling and benefit evaluation. Power Syst. Technol. 2018, 42, 1697–1708. [Google Scholar] [CrossRef]
  6. Wang, Y.; Zhang, J.; Pan, C.; Yuan, X.; Wu, X.; Zhu, Y.; Jing, R.; Wang, Z.; Kang, L. Multi-dimensional performance evaluation index review of integrated and intelligent energy. J. Glob. Energy Interconnect. 2021, 4, 207–225. [Google Scholar] [CrossRef]
  7. Shen, M.; Zhang, G.; Zhang, K. Comprehensive evaluation method and application study of campus-level regional integrated energy system. J. Beijing Inst. Technol. (Soc. Sci. Ed.) 2022, 24, 52–65. [Google Scholar] [CrossRef]
  8. Kengpol, A.; Rontlaong, P.; Tuominen, M. A decision support system for selection of solar power plant locations by applying fuzzy AHP and TOPSIS: An empirical study. JSEA 2013, 6, 470–481. [Google Scholar] [CrossRef]
  9. Ilbahar, E.; Cebi, S.; Kahraman, C. A state-of-the-art review on multi-attribute renewable energy decision making. Energy Strategy Rev. 2019, 25, 18–33. [Google Scholar] [CrossRef]
  10. Cao, Y. Optimal Scheduling of Integrated Energy System Based on Multi-Energy Complementarity. Master’s Thesis, Xi’an University of Technology, Xi’an, China, 2021. [Google Scholar] [CrossRef]
  11. Ji, X. Operation Characteristics and Optimization of Multi-Energy Complementary Region Energy Supply System Based on Phase Change Heat Storage. Master’s Thesis, Northeast Electric Power University, Jilin, China, 2024. [Google Scholar] [CrossRef]
  12. Wang, J.; Tian, H.; Zhao, E.; Shu, Z.; Wan, Z. Low-carbon operation control on park-level integrated energy systems considering shared energy storage devices for electric vehicles. Integr. Intell. Energy 2024, 46, 16–26. [Google Scholar]
  13. Li, J.; Liu, C. Optimal scheduling of multi-park integrated energy system considering carbon emission and demand response. Electrotech. Appl. 2024, 43, 20–28. [Google Scholar]
  14. Wang, Y.; Xiang, H.; Guo, L.; Hou, H.; Chen, X.; Wang, H.; Liu, Z.; Xing, J.; Cui, C. Research on planning optimization of distributed photovoltaic and electro-hydrogen hybrid energy storage for multi-energy complementarity. Power Syst. Technol. 2023, 48, 564–576. [Google Scholar] [CrossRef]
  15. Li, P.; Wang, J.; Li, C.; Wang, Z.; Yin, Y.; Han, Z.; Pan, Y.; Wen, M. Collaborative optimal scheduling of the community integrated energy system considering source-load uncertainty and equipment off-design performance. Proc. CSEE 2023, 43, 7802–7812. [Google Scholar] [CrossRef]
  16. Zhou, X.; Han, X.; Li, T.; Wei, B.; Li, Y. Master-slave game optimal scheduling strategy for multi-agent integrated energy system based on demand response and power interaction. Power Syst. Technol. 2022, 46, 3333–3346. [Google Scholar] [CrossRef]
  17. Zhou, C.; Zheng, J.; Jing, Z.; Wu, Q.; Zhou, X. Multi-objective optimal design of integrated energy system for park-level microgrid. Power Syst. Technol. 2018, 42, 1687–1697. [Google Scholar] [CrossRef]
  18. Zheng, G.; Li, H.; Zhao, B.; Wu, B.; Huo, X.; Tang, W. Comprehensive optimization of electrical/thermal energy storage equipment for integrated energy system near user side based on energy supply and demand balance. Power Syst. Prot. Control 2018, 46, 8–18. [Google Scholar]
  19. Zhao, H. Research on the Optimization of the Integrated Energy System of the Eco-Industrial Park Considering Uncertainties. Ph.D. Thesis, North China Electric Power University, Beijing, China, 2020. [Google Scholar] [CrossRef]
  20. Zhao, H.; Miao, S.; Li, C.; Zhang, D.; Tu, Q. Research on optimal operation strategy for park-level integrated energy system considering cold-heat-electric demand coupling response characteristics. Proc. CSEE 2022, 42, 573–589. [Google Scholar] [CrossRef]
  21. Zhang, S.; Lv, S. Evaluation method of park-level integrated energy system for microgrid. Power Syst. Technol. 2018, 42, 2431–2439. [Google Scholar] [CrossRef]
  22. Yu, B.; Wu, L.; Lu, X.; Zhang, P. Optimal dispatching method of integrated community energy system. Electr. Power Constr. 2016, 37, 70–76. [Google Scholar]
  23. Xu, Y.; Zhang, J.; Zhang, H. Case analysis on site-selection capacity-determination planning of park integrated energy system with cold, hot, electricity and gas. Acta Energiae Solaris Sin. 2022, 43, 313–322. [Google Scholar] [CrossRef]
  24. Xiong, Y.; Chen, L.; Zheng, T.; Si, Y.; Mei, S. Optimal configuration of hydrogen energy storage in low-carbon park integrated energy system considering electricity-heat-gas coupling characteristics. Electr. Power Autom. Equip. 2021, 41, 31–38. [Google Scholar] [CrossRef]
  25. Wang, C.; Lv, C.; Li, P.; Li, S.; Zhao, K. Multiple time-scale optimal scheduling of community integrated energy system based on model predictive control. Proc. CSEE 2019, 39, 6791–6803, 7093. [Google Scholar] [CrossRef]
  26. Zhu, S.; Liu, H.; Tang, Y.; Wang, H.; Tang, J. Modeling and collaborative optimal operation strategy for multiple energy stations of regional integrated energy system. Power Demand Side Manag. 2019, 21, 60–66. [Google Scholar]
  27. Shi, J.; Tan, T.; Guo, J.; Liu, Y.; Zhang, J. Multi-task learning based on deep architecture for various types of load forecasting in regional energy system integration. Power Syst. Technol. 2018, 42, 698–707. [Google Scholar] [CrossRef]
  28. Lu, S. Research on Planning Design and Smart Control Optimization of Integrated Energy System. Master’s Thesis, Zhejiang University, Hangzhou, China, 2019. [Google Scholar]
  29. Lu, J.; Yan, L.; La, Z.; Liu, X.; Ren, H. Real-time optimal scheduling strategy for integrated energy system based on digital twins and dynamic energy efficiency model. Power Syst. Technol. 2023, 47, 226–238. [Google Scholar] [CrossRef]
  30. Liu, T.; Lu, J.; He, C.; Xie, Y. Day-ahead economic dispatch of multi-energy parks considering integrated thermo-electric demand response and high penetration of renewable energy. Electr. Power Autom. Equip. 2019, 39, 261–268. [Google Scholar] [CrossRef]
  31. Liu, J. Comprehensive Evaluation of Integrated Energy System Based on Measured Data. Master’s Thesis, Beijing Jiaotong University, Beijing, China, 2020. [Google Scholar]
  32. Liu, H.; Zhao, Y.; Liu, X.; Zhang, Q.; Ge, S.; Liu, J. Comprehensive energy efficiency assessment of park-level multi-energy system considering difference of energy grade. Power Syst. Technol. 2019, 43, 2835–2843. [Google Scholar] [CrossRef]
  33. Li, P.; Wu, D.; Li, Y.; Liu, H.; Wang, N.; Zhou, X. Optimal dispatch of multi-microgrids integrated energy system based on integrated demand response and stackelberg game. Proc. CSEE 2021, 41, 1307–1321, 1538. [Google Scholar] [CrossRef]
  34. Guo, M.; Mu, Y.; Xiao, Q.; Jia, H.; Yu, X.; He, W. Optimal configuration of electric/thermal hybrid energy storage for park-level integrated energy system considering battery life loss. Autom. Electr. Power Syst. 2021, 45, 66–75. [Google Scholar]
  35. Guo, Z. Research on Optimal Operation of Integrated Energy System Considering Source-Grid-Load-Storage Resources. Ph.D. Thesis, North China Electric Power University, Beijing, China, 2020. [Google Scholar] [CrossRef]
  36. Ge, L.; Li, J.; Li, C.; Liu, H. Overview of integrated energy system optimal operation technology for zero-carbon parks. Power Syst. Technol. 2024, 48, 1821–1835. [Google Scholar] [CrossRef]
  37. Gu, J.; Zhang, H.; Ruan, H.; Luo, C.; Liu, X.; Wang, M. Exploration on the transformation of energy supply enterprises to integrated energy service providers in industrial parks. Integr. Intell. Energy 2022, 44, 62–67. [Google Scholar]
  38. Fang, S.; Zhou, R.; Xu, F.; Feng, J.; Cheng, Y.; Li, B. Optimal operation of integrated energy system for park micro-grid considering comprehensive demand response of power and thermal loads. Proc. CSU-EPSA 2020, 32, 50–57. [Google Scholar] [CrossRef]
  39. Chen, Z.; Hu, Z.; Weng, C.; Li, T. Multi-stage planning of park-level integrated energy system based on ladder-type carbon trading mechanism. Electr. Power Autom. Equip. 2021, 41, 148–155. [Google Scholar] [CrossRef]
  40. Chen, Y.; Zhang, N.; Li, J.; Fang, Z.; Wu, S.; Mei, S.; Chen, L. Review and prospect of zero carbon park research. Proc. CSEE 2024, 44, 5496–5516. [Google Scholar] [CrossRef]
  41. Wu, M.; Ren, X.; Zhou, D.; Su, J.; Kou, L.; Liang, H. Optimal allocation method for capacity of power supply system in industrial park under new electricity market reform. Autom. Electr. Power Syst. 2018, 42, 2–8. [Google Scholar]
  42. Zeng, A.; Zou, Y.; Hao, S.; Ning, J.; Ni, L. Comprehensive demand response strategy of industrial users in the park considering the stepped carbon trading mechanism. High Volt. Tech. 2022, 48, 4352–4363. [Google Scholar] [CrossRef]
  43. Zhou, J.; Wu, Y.; Wu, C.; Deng, Z.; Xu, C.; Hu, Y. A hybrid fuzzy multi-criteria decision-making approach for performance analysis and evaluation of park-level integrated energy system. Energy Convers. Manag. 2019, 201, 112134. [Google Scholar] [CrossRef]
  44. Zhang, C.; Jiao, Z.; Liu, J.; Ning, K. Robust planning and economic analysis of park-level integrated energy system considering photovoltaic/thermal equipment. Appl. Energy 2023, 348, 121538. [Google Scholar] [CrossRef]
  45. Xiong, Z.; Zhang, D.; Wang, Y. Optimal operation of integrated energy systems considering energy trading and integrated demand response. Energy Rep. 2024, 11, 3307–3316. [Google Scholar] [CrossRef]
  46. Wang, Y.; Li, R.; Dong, H.; Ma, Y.; Yang, J.; Zhang, F.; Zhu, J.; Li, S. Capacity planning and optimization of business park-level integrated energy system based on investment constraints. Energy 2019, 189, 116345. [Google Scholar] [CrossRef]
  47. Wang, M.; Zheng, J.H.; Li, Z.; Wu, Q.H. Multi-attribute decision analysis for optimal design of park-level integrated energy systems based on load characteristics. Energy 2022, 254, 124379. [Google Scholar] [CrossRef]
  48. Li, Y.; Ma, W.; Bu, F.; Yang, Z.; Wang, B.; Han, M. Deep reinforcement learning-driven cross-community energy interaction optimal scheduling. Electr. Power Constr. 2024, 45, 59–70. [Google Scholar]
  49. Gao, M.; Han, Z.; Zhao, B.; Li, P.; Wu, D. Cooperative optimization and operational strategies for multi-type energy storage in regional integrated energy systems. Electr. Power 2024, 57, 205–216. [Google Scholar]
  50. Wang, L.; Lin, J.; Dong, H.; Wang, Y.; Zeng, M. Demand response comprehensive incentive mechanism-based multi-time scale optimization scheduling for park integrated energy system. Energy 2023, 270, 126893. [Google Scholar] [CrossRef]
  51. Mu, Y.; Wang, C.; Cao, Y.; Jia, H.; Zhang, Q.; Yu, X. A CVaR-based risk assessment method for park-level integrated energy system considering the uncertainties and correlation of energy prices. Energy 2022, 247, 123549. [Google Scholar] [CrossRef]
  52. Mu, Y.; Chen, W.; Yu, X.; Jia, H.; Hou, K.; Wang, C.; Meng, X. A double-layer planning method for integrated community energy systems with varying energy conversion efficiencies. Appl. Energy 2020, 279, 115700. [Google Scholar] [CrossRef]
  53. Lyu, X.; Liu, T.; Liu, X.; He, C.; Nan, L.; Zeng, H. Low-carbon robust economic dispatch of park-level integrated energy system considering price-based demand response and vehicle-to-grid. Energy 2023, 263, 125739. [Google Scholar] [CrossRef]
  54. Wang, Z. Research on Collaborative Planning and Optimal Operation of Integrated Energy System with Multi Communities. Ph.D. Thesis, North China Electric Power University, Beijing, China, 2023. [Google Scholar] [CrossRef]
  55. Zhou, B.; Xia, H.; Zang, T. Station and network coordinated planning of park integrated energy system considering energy cascade utilization. Electr. Power Autom. Equip. 2022, 42, 20–27. [Google Scholar] [CrossRef]
  56. Zheng, Y.; Zhang, A.; Zhang, Y.; Zhang, C.; Gou, L. Energy efficiency model of park-level integrated energy system considering time variation of equipment. Smart Power 2022, 50, 103–109. [Google Scholar]
  57. Qu, X.; Wu, M.; Li, Q.; Ding, B.; Zhao, F.; Kou, L. Review on comprehensive evaluation of multi-energy complementary integrated energy systems. Electr. Power 2021, 54, 153–163. [Google Scholar]
  58. Xiao, Q.; Yang, K.; Song, Z. Scheduling strategy of industrial parks integrated energy system considering carbon trading and electric vehicle charging load. High Volt. Eng. 2023, 49, 1392–1401. [Google Scholar] [CrossRef]
  59. Sun, Q.; Xie, D.; Nie, Q.; Zhang, L.; Chen, Q.; Chen, J. Research on economic optimization scheduling of park integrated energy system with electricity-heat-cool-gas load. Electr. Power 2020, 53, 79–88. [Google Scholar]
  60. Ma, Y.; Xie, J.; Zhao, S.; Wang, Z.; Luo, Z. Multi-objective optimal dispatching for active distribution network considering park-level integrated energy system. Autom. Electr. Power Syst. 2022, 46, 53–61. [Google Scholar]
  61. Zhao, X.; Chen, Y.; Liu, K.; Xu, G.; Chen, H.; Liu, W. Design and operation of park-level integrated energy systems in various climate zones in China. Sustain. Cities Soc. 2023, 96, 104705. [Google Scholar] [CrossRef]
  62. Du, D.; Pang, Q.; Wu, Y. Modern Comprehensive Evaluation Methods and Selected Case Studies; Tsinghua University Press: Beijing, China, 2008. [Google Scholar]
  63. Niu, D.; Li, J. Comprehensive Evaluation Theory of Electric Power Energy; China Electric Power Press: Beijing, China, 2015. [Google Scholar]
  64. Ren, D.; Liu, Z.; Gao, F.; Gao, C.; Song, G. Electrothermal coordinated operation optimization of park integrated energy system considering carbon trading mechanism and demand response. Therm. Power Gener. 2022, 51, 119–130. [Google Scholar] [CrossRef]
  65. De, G. Research on Source Load Storage Collaborative Optimization and Benefit Evaluation Model for Park Integrated Energy System. Ph.D. Thesis, North China Electric Power University, Beijing, China, 2021. [Google Scholar] [CrossRef]
  66. Du, L.; Sun, L.; Chen, H. Multi-index evaluation of integrated energy system with P2G planning. Electr. Power Autom. Equip. 2017, 37, 110–116. [Google Scholar] [CrossRef]
  67. Guo, Y.; Wu, Q.; Cheng, L.; Huang, H.; Gao, S. Efficiency analysis model of integrated energy system based on the exergy efficiency. Renew. Energy Resour. 2017, 35, 1387–1394. [Google Scholar] [CrossRef]
  68. Li, L.; Wang, R.; Li, X. Grey fuzzy comprehensive evaluation of regional financial innovation ability based on two types weights. Grey Syst. Theory Appl. 2016, 6, 187–202. [Google Scholar] [CrossRef]
  69. Huang, W.; Guo, Z.; Hua, L. Comprehensive evaluation of regional integrated energy system considering multi-participant interest coordination. Electr. Power Constr. 2019, 40, 81–89. [Google Scholar]
  70. Ma, L.; Zhang, T.; Lu, Z.; Yang, L. Comprehensive evaluation of regional integrated energy system based on variable weight extension cloud model. Trans. China Electrotech. Soc. 2022, 37, 2789–2799. [Google Scholar] [CrossRef]
  71. Cao, S.; Wu, Y.; Cao, K.; Chen, M. Service evaluation of the integrated energy system based on EMW and AHP. Bull. Sci. Technol. 2021, 37, 56–60. [Google Scholar] [CrossRef]
  72. Tian, L. Research on Operation Optimization and Comprehensive Evaluation of Integrated Energy System Based on Carbon Trading Mechanism and Demand Response. Master’s Thesis, Beijing University of Civil Engineering and Architecture, Beijing, China, 2024. [Google Scholar]
  73. Chen, B.; Liao, Q.; Liu, D.; Wang, W.; Wang, Z.; Chen, S. Comprehensive evaluation indices and methods for regional integrated energy system. Autom. Electr. Power Syst. 2018, 42, 174–182. [Google Scholar]
  74. Zhang, F.; Liu, Z. Combined evaluation methods: A literature review. J. Syst. Eng. 2017, 32, 557–569. [Google Scholar] [CrossRef]
  75. Deng, W.; Wang, G.; Zhang, X. A novel hybrid water quality time series prediction method based on cloud model and fuzzy forecasting. Chemom. Intell. Lab. Syst. 2015, 149, 39–49. [Google Scholar] [CrossRef]
  76. Liu, Y.; Zhou, C. Application of catastrophe theory to comprehensive evaluation of safety of levee construction. Hydro-Sci. Eng. 2011, 1, 60–65. [Google Scholar] [CrossRef]
  77. Zhang, Q.; Zhong, M. Using multi-level fuzzy comprehensive evaluation to assess reservoir induced seismic risk. JCP 2011, 6, 1670–1676. [Google Scholar] [CrossRef]
  78. Shen, J.; Du, S.; Luo, Y.; Luo, J.; Yang, Q.; Chen, Z. Method and application research on fuzzy comprehensive evaluation based on cloud model. Fuzzy Syst. Math. 2012, 26, 115–123. [Google Scholar]
  79. Huang, J. Multi-Lever Fuzzy Comprehensive Evaluation of Financial. Master’s Thesis, Wuhan University of Technology, Wuhan, China, 2017. [Google Scholar]
  80. Su, Y.; Ji, C.; Zhang, Y.; Li, R. An integrated evaluation method for water resource management based on cloud model—A case study of Huizhou city. China Rural Water Hydropower 2017, 12, 53–58. [Google Scholar]
  81. Mancarella, P. MES (Multi-Energy Systems): An overview of concepts and evaluation models. Energy 2014, 65, 1–17. [Google Scholar] [CrossRef]
  82. Kienzle, F.; Ahcin, P.; Andersson, G. Valuing investments in multi-energy conversion, storage, and demand-side management systems under uncertainty. IEEE Trans. Sustain. Energy 2011, 2, 194–202. [Google Scholar] [CrossRef]
  83. Favre-Perrod, P.; Kienzle, F.; Andersson, G. Modeling and design of future multi-energy generation and transmission systems. Int. Trans. Elec. Energy Syst. 2010, 20, 994–1008. [Google Scholar] [CrossRef]
  84. Yuan, K.; Li, J.; Song, Y.; Mu, Y.; Sun, C.; Xu, Y.; Hu, D.; Chen, W. Review and prospect of comprehensive evaluation technology of regional energy internet. Autom. Electr. Power Syst. 2019, 14, 41–52, 64. [Google Scholar]
  85. Li, C.; Wang, N.; Dou, X.; Yang, Z.; Wang, L.; Yang, Y. Review and prospect on the system integration of distributed energy system with the complementation of multiple energy sources. Proc. CSEE 2023, 18, 7127–7150. [Google Scholar] [CrossRef]
  86. Liu, H.; You, J.; Chen, Y.; Fan, X. Site selection in municipal solid waste management with extended VIKOR method under fuzzy environment. Environ. Earth Sci. 2014, 72, 4179–4189. [Google Scholar] [CrossRef]
  87. Xu, L.; Zhang, Y.; Zhang, B.; Chen, L. Based on hybrid multi-attribute group decision making method of evaluation of integrated energy system efficiency. J. Ind. Technol. Econ. 2014, 3, 52–57. [Google Scholar]
  88. Xue, G.; Yuan, Y.; Wang, S. Research on fuzzy comprehensive evaluation method of renewable energy system. Comput. CD Softw. Appl. 2014, 1, 22–23. [Google Scholar]
  89. Liang, W.; Ji, P.; Tang, W.; Zhang, X. Research on a comprehensive evaluation methodology to reduce the risk of decision-making errors in regional renewable electricity energy planning. Electrotech. Appl. 2014, 21, 89–94. [Google Scholar]
  90. Zhang, L.; Zhang, B. Evaluation of the integrated energy system effectiveness based on the normal distribution interval number method. Energy Constr. 2015, 2, 41–45. [Google Scholar] [CrossRef]
  91. Zhang, T.; Zhu, T.; Gao, N.; Wu, Z. Optimization design and multi-criteria comprehensive evaluation method of combined cooling heating and power system. Proc. CSEE 2015, 35, 3706–3713. [Google Scholar] [CrossRef]
  92. Hu, D.; Zhang, X.; Chen, N.; Zhang, J.; Yu, Y. Research on multi-dimensional post evaluation methodology of new energy power generation projects. Power Syst. Prot. Control 2015, 4, 10–17. [Google Scholar]
  93. Han, Z.; Sun, Q. Comprehensive energy efficiency based on energy, economy and environment subsystems. China Popul. Resour. Environ. 2015, 1, 38–41. [Google Scholar]
  94. Wu, Y.; Zhang, J.; Yuan, J.; Geng, S.; Zhang, H. Study of decision framework of offshore wind power station site selection based on ELECTRE-III under intuitionistic fuzzy environment: A case of China. Energy Convers. Manag. 2016, 113, 66–81. [Google Scholar] [CrossRef]
  95. Dong, F.; Zhang, Y.; Shang, M. Multi-criteria comprehensive evaluation of distributed energy system. Proc. CSEE 2016, 36, 3214–3223. [Google Scholar] [CrossRef]
  96. Jiang, L.; Yuan, Y.; Wang, Z.; Wang, S. Evaluation index system and comprehensive evaluation method of energy internet in innovative demonstration area of smart grid. Proc. CSU-EPSA 2016, 1, 39–45. [Google Scholar]
  97. Zeng, J.; Xu, D.; Guo, H.; Li, C.; Liu, J. Renewable energy-oriented micro-grid power quality characteristic analysis and comprehensive evaluation. Power Syst. Prot. Control 2016, 19, 10–16. [Google Scholar]
  98. Zhang, C.; Tang, Q.; Yan, W.; Wei, J.; Hou, K.; Wang, Y.; He, Z. Reliability evaluation of integrated community energy system based on particle-swarm-interior-point hybrid optimization algorithm. Electr. Power Constr. 2017, 38, 104–111. [Google Scholar]
  99. Gao, C.; Niu, D.; Ma, M.; Wang, N.; Gai, X. Accommodating capability analysis and comprehensive assessment method of large-scale new energy areas interconnected. Electr. Power 2017, 7, 56–63. [Google Scholar]
  100. Wu, Y.; Wang, J.; Hu, Y.; Ke, Y.; Li, L. An extended TODIM-PROMETHEE method for waste-to-energy plant site selection based on sustainability perspective. Energy 2018, 156, 1–16. [Google Scholar] [CrossRef]
  101. Wu, Y.; Zhou, J.; Hu, Y.; Li, L.; Sun, X. A TODIM-based investment decision framework for commercial distributed PV projects under the energy performance contracting (EPC) business model: A case in east-central China. Energies 2018, 11, 1210. [Google Scholar] [CrossRef]
  102. Xin, H. The Synergetic Optimal Scheduling and Benefit Equilibrium Model for Clean Energy Absorptive Considering Multi-Energy Hybrid. Ph.D. Thesis, North China Electric Power University, Beijing, China, 2020. [Google Scholar] [CrossRef]
  103. Xia, X.; Fang, J.; Xie, Y.; Ying, Y.; Li, J.; Cai, Z. Comprehensive benefit evaluation of multi-energy complementary engineering project based on analytic hierarchy process and gray fuzzy comprehensive evaluation. J. Univ. Jinan (Sci. Technol.) 2020, 34, 76–84. [Google Scholar] [CrossRef]
  104. Dong, W.; Tian, K.; Chen, Y.; Xu, Y.; Lan, M.; Zeng, M. Evaluation method of comprehensive energy system based on game theory & evidence theory under energy internet. Smart Power 2020, 7, 73–80. [Google Scholar]
  105. Huang, W.; Yang, Z.; Liu, S. Comprehensive energy system evaluation of new energy featured towns based on matter-element extension model. Mod. Electr. Power 2020, 5, 448–457. [Google Scholar] [CrossRef]
  106. Zhao, P.; Fan, Y.; Zhou, X.; Li, Y.; Liu, F. Evaluation method for park integrated energy system. Chin. J. Power Sources 2020, 9, 1379–1382, 1390. [Google Scholar]
  107. Qian, J.; Wu, J.; Yao, L.; Mahmut, S.; Zhang, Q. Comprehensive performance evaluation of wind-solar-CCHP system based on emergy analysis and multi-objective decision method. Energy 2021, 230, 120779. [Google Scholar] [CrossRef]
  108. Zhao, P.; Zhou, M.; Gao, J.; Pan, L.; Liu, Z.; Xie, H. Evaluation method for park-level integrated energy system based on electric power substitution. Electr. Power 2021, 4, 130–140. [Google Scholar]
  109. Zhao, L.; Wang, L.; Wan, C.; Wu, M.; Yuan, K.; Song, Y. Segmented energy efficiency evaluation of urban integrated energy system based on data envelopment analysis method. Autom. Electr. Power Syst. 2022, 17, 132–141. [Google Scholar]
  110. Zhu, Y.; Liu, X.; Mu, X.; Dai, F.; Xu, W.; Qian, W. Multi-index comprehensive evaluation of multi-station integrated energy system based on analytic hierarchy process and risk entropy weight. Electr. Meas. Instrum. 2022, 4, 128–136, 143. [Google Scholar] [CrossRef]
  111. Li, Z.; Wang, J.; Zhou, H.; Zong, X.; Sun, Y.; Xiong, J. Evaluation method for park-level integrated energy system planning considering the interaction of multiple indices. Electr. Power Constr. 2022, 10, 98–110. [Google Scholar]
  112. Liang, S.; Wang, Y. Evaluation of an integrated energy system planning scheme for an industrial park based on an improved cloud matter-element model. Power Syst. Prot. Control 2023, 9, 165–176. [Google Scholar] [CrossRef]
  113. Hu, J.; Zhang, X.; Yan, X.; Hou, Q.; Zeng, J.; Zou, Z. Benefit evaluation method of comprehensive energy system based on subjective and objective weighting method. Guangdong Electr. Power 2023, 1, 1–8. [Google Scholar]
  114. Jin, L.; He, W.; Yan, H.; He, G. Comprehensive evaluation method for benefits of township integrated energy system based on improved TOPSIS. Electr. Meas. Instrum. 2023, 2, 1–9. [Google Scholar] [CrossRef]
  115. Zhang, W.; Wu, J.; Zhang, H.; Yang, J. Comprehensive performance evaluation of RE-CCHP system based on AHP-CRITIC method and scorecard model. Mod. Electron. Tech. 2023, 5, 139–144. [Google Scholar] [CrossRef]
  116. Sheng, S.; Zhang, J.; Li, R. Demand response benefit evaluation of integrated energy system based on combination weighting and gray cloud model. J. North China Electr. Power Univ. 2024, 2, 41–54. [Google Scholar]
  117. Huang, Y.; Wang, S.; Yang, N.; Chen, C. Evaluation of park integrated energy system based on comprehensive weighting and cloud entropy optimization. J. Electr. Power Sci. Technol. 2024, 39, 201–214. [Google Scholar] [CrossRef]
  118. Liang, C.; Ma, X.; Dong, X.; Li, Y.; Luo, L.; Xu, R. An evaluation method of technology popularization and application of integrated energy system based on digital portrait. Sci. Technol. Rev. 2024, 17, 97–110. [Google Scholar]
  119. Li, Z.; Li, Y.; Liu, S. Evaluation of integrated energy system based on improved game theory combination and weighted TOPSIS method. Mod. Electr. Power 2024, 5, 926–934. [Google Scholar] [CrossRef]
  120. Lian, W.; Cui, S.; Li, Y.; Qiu, H. Comprehensive energy efficiency evaluation of regional integrated energy system based on improved TOPSIS. Renew. Energy Resour. 2024, 10, 1355–1362. [Google Scholar] [CrossRef]
  121. Zhang, L.; Xin, H.; Yong, H.; Kan, Z. Renewable energy project performance evaluation using a hybrid multi-criteria decision-making approach: Case study in Fujian, China. J. Clean. Prod. 2019, 206, 1123–1137. [Google Scholar] [CrossRef]
  122. Yang, C.; Cai, W. Study on extension engineering. Eng. Sci. 2000, 12, 90–96. [Google Scholar]
Figure 1. The overall structure of the article.
Electronics 14 02239 g001
Figure 2. Statistics on the number of occurrences of adopted methods.
Electronics 14 02239 g002
Figure 3. Statistics on types of issues.
Electronics 14 02239 g003
Figure 4. Statistical count of occurrences for quantitative secondary indicators.
Electronics 14 02239 g004
Figure 5. Statistical count of occurrences for qualitative secondary indicators.
Electronics 14 02239 g005
Table 1. Quantitative indicators classification of park-level IES.
(a) Primary and Secondary Indicators
Categories/Indicator GradeLevel 1 IndicatorsLevel 2 Indicators
Economic indicatorsSystem total cost/
Equivalent Annual cost ↓
1. Initial investment costs
2. Operation and maintenance costs over the equipment life cycle
3. External energy purchase costs
4. Operational penalty costs
5. Equivalent environmental costs
6. Government subsidy revenues
7. Equipment utilization rate
Economic benefit ↑8. Distribution network profit
9. Profit generated by each equipment
10. Deferred construction benefits
Technical indicatorsSystem energy efficiency ratio ↑1. Equipment energy efficiency ratios
Comprehensive energy efficiency target ↑2. integrated energy utilization rate
3. Exergy efficiency
4. Renewable energy curtailment rate
5. Renewable energy absorption rate
6. Demand response level
7. Coverage rate of energy information collection system
8. Network losses
System reliability ↑9. System adequacy under islanded operation
10. Operational deviation in real-time extreme scenarios
11. Average equipment failure rate
12. System average downtime
13. System energy supply reliability rate
14. System energy downtime rate
Environmental indicatorsAnnual equivalent environmental benefit ↓1. Pollution emissions (carbides, sulfide, nitrogen oxides)
2. Carbon emissions (carbon dioxide, carbon dust)
Social indicatorsUser comprehensive satisfaction ↑1. Load adjustability level
(b) Tertiary Indicators
Categories/Indicator GradeLevel 3 Indicators
Economic indicators1. Number of pieces of equipment, rated capacity of equipment, unit investment cost of equipment
2. Labor costs for operation and maintenance of each piece of equipment, equipment start-up and shutdown costs, fuel costs, carbon tax cost, equipment residual value
3. Time-of-use electricity price, heat, and gas purchase price, purchased power capacity
4. Penalty unit price for power and heat load loss, penalty coefficient for wind and solar curtailment, power and heat load loss, wind and solar curtailment power
5. Carbon trading cost, pollutant emission costs for electricity and gas purchases, pollutant treatment costs, pollutant emissions per unit output, types of pollutants
6. Renewable energy generation subsidy revenue, subsidy revenue for user participation in demand response
7. Actual operating time of equipment, planned operating time of equipment, energy supplied by equipment
8. Economic compensation, types of electrical, thermal, and cooling loads, electricity selling price of distribution network and park
9. After-tax energy sales revenue
10. Costs arising from active and reactive power fluctuations at nodes, active and reactive power fluctuation values
Technical indicators1. Equipment area, equipment capacity, standard coal consumption for primary energy conversion
2. System electricity, heat, gas, and cooling consumption, externally purchased electricity, heat, and gas volumes, actual stored energy after losses in electricity, heating and cooling storage devices, output of energy conversion equipment, network loss rate
3. Exergy values of various loads, domestic hot water, external input energy, and equipment power/heat generation
4. Curtailed wind and solar power, actual available renewable energy
5. Comprehensive utilization rate of renewable energy generation during the operating cycle, actual renewable energy utilization power, ultra-short-term forecasted output of renewable energy
6. Grid purchased power before and after user participation in demand response, grid purchased power that users should reduce
7. Energy forms, number of users covered by the system for a specific energy type, number of users for a specific energy type in the target system
8. Total actual electricity consumption, external power supply to the target system, pipeline length, heat loss per unit pipeline length, actual heating time, heating supply, cooling loss per unit pipeline length, actual cooling time, cooling supply
9. Supply deviation of user electrical, thermal, and cooling loads, park electricity, heat, and cooling demand
10. Source–load–network side deviation of the system in real-time phase, maximum acceptable deviation of the system
11. Failure duration of various energy equipment, total operational duration of various energy equipment
12. Average downtime of system electricity, heating and cooling, number of downtime events, number of affected users, total number of users in the target system
13. System average downtime, energy supply time, types of energy
14. Energy dissipation of system energy source, the number of dissipation occurrences for each energy source, total energy supply of system
Environmental indicators1. Types of pollutants, total pollutant emissions, life cycle of each device, pollutant emissions of each device during its life cycle/specific period, equipment usage, the sum of pollutant emissions per unit of electricity, pollutant emission intensity
2. Types of carbon emissions, total carbon emissions, life cycle of each device, carbon emissions of each device during its life cycle/specific period, equipment usage, the sum of carbon emissions per unit of electricity, carbon emission intensity
Social indicators1. Proportion of interruptible loads and transferable loads, dispatching status of interruptible loads and transferable loads, maximum dispatchable amount of interruptible loads and transferable loads
Table 2. Qualitative indicators classification of park-level IES.
(a) Primary and Secondary Indicators
Categories/Indicator GradeLevel 1 IndicatorsLevel 2 Indicators
Technical indicatorsTechnical development level1. Technological advancement level
2. Demand-side interactivity
3. Technological maturity
Operational assurance level4. Safety and reliability
5. Energy supply quality
Environmental indicatorsEnvironmental protection measures1. Configuration of purification equipment
Environmental impact2. Noise environmental impact
3. Electromagnetic environmental impact
4. Impact on atmospheric environmental quality
5. Water environment evaluation
6. Ecological environmental impact
Social indicatorsExternal factors1. Policy support
2. Social development status
Social impact3. Degree of regional economic contribution
4. End-user comfort level
(b) Tertiary Indicators
Categories/Indicator GradeLevel 3 Indicators
Technical indicators1. Research efforts of industry and social investment and related technological achievements
2. Distributed energy integration capability, smart meter prevalence rate
3. The degree of industrialization and practicality in terms of energy supply equipment technology level, process flow, supporting resources, and technology lifecycle
4. Load location distribution, degree of renewable energy utilization, degree of energy storage utilization, accessibility of primary energy resources, professionalism and competency of the operation and maintenance personnel
5. Power quality, thermal energy quality, gas quality
Environmental indicators1. Configuration of noise isolation equipment, air purification equipment, and water purification equipment
2–6. Provisions of relevant national standards
Social indicators1. Project in relation to national macro-control policies, relevant industry policies
2. Current development status of the new round of electricity reform, current technological levels, energy demand
3. Industrial benefits, employment benefits
4. Level of infrastructure development, energy supply satisfaction, service level
Table 3. Statistics on evaluation methods and problems of related literature at home and abroad in the past 10 years.
(a) Statistics on Year, Article Number, Methodology, and Type of Issue
YearArticle NumberMethodologyType of Issue
2014[86]6, 11(2)
[87]26(3)
[88]12(1)
[89]27(1)
2015[90]11, 13(3)
[91]14, 15(1)
[92]9, 12, 16, 17(1)
[93]1, 28(4)
2016[94]3, 11(2)
[95]1, 14(1)
[96]1, 10(1)
[97]12(1)
2017[98]17, 18(6)
[99]17(1)
2018[21]1, 6, 14(1)
[73]2, 8, 14, 17(1)
[100]3, 11, 19(2)
[101]2, 14, 19(7)
2019[43]7, 11, 14, 19(1)
[69]14, 24, 29(1)
[102]1, 11, 12, 20(1)
2020[31]1, 12, 14(1)
[103]1, 12, 16(3)
[104]1, 12, 14, 21(1)
[105]14, 24, 29(1)
[106]2, 8, 14, 17(1)
2021[65]12, 20(3)
[71]1, 14(8)
[107]1, 12, 22(1)
[108]1, 8, 14, 17, 24(5)
2022[7]1, 12, 14(1)
[70]2, 14, 20, 23, 34(1)
[109]9, 30(4)
[110]1, 14(1)
[111]6, 11(5)
2023[112]7, 20, 24, 25(5)
[113]1, 11, 14, 31(3)
[114]1, 4, 7, 14(3)
[115]1, 25, 32, 33(1)
2024[72]1, 12, 14(3)
[116]1, 16, 20, 25(3)
[117]7, 14, 20, 24, 34(1)
[118]1, 14(2)
[119]4, 35(1)
[120]4, 16, 17, 23(4)
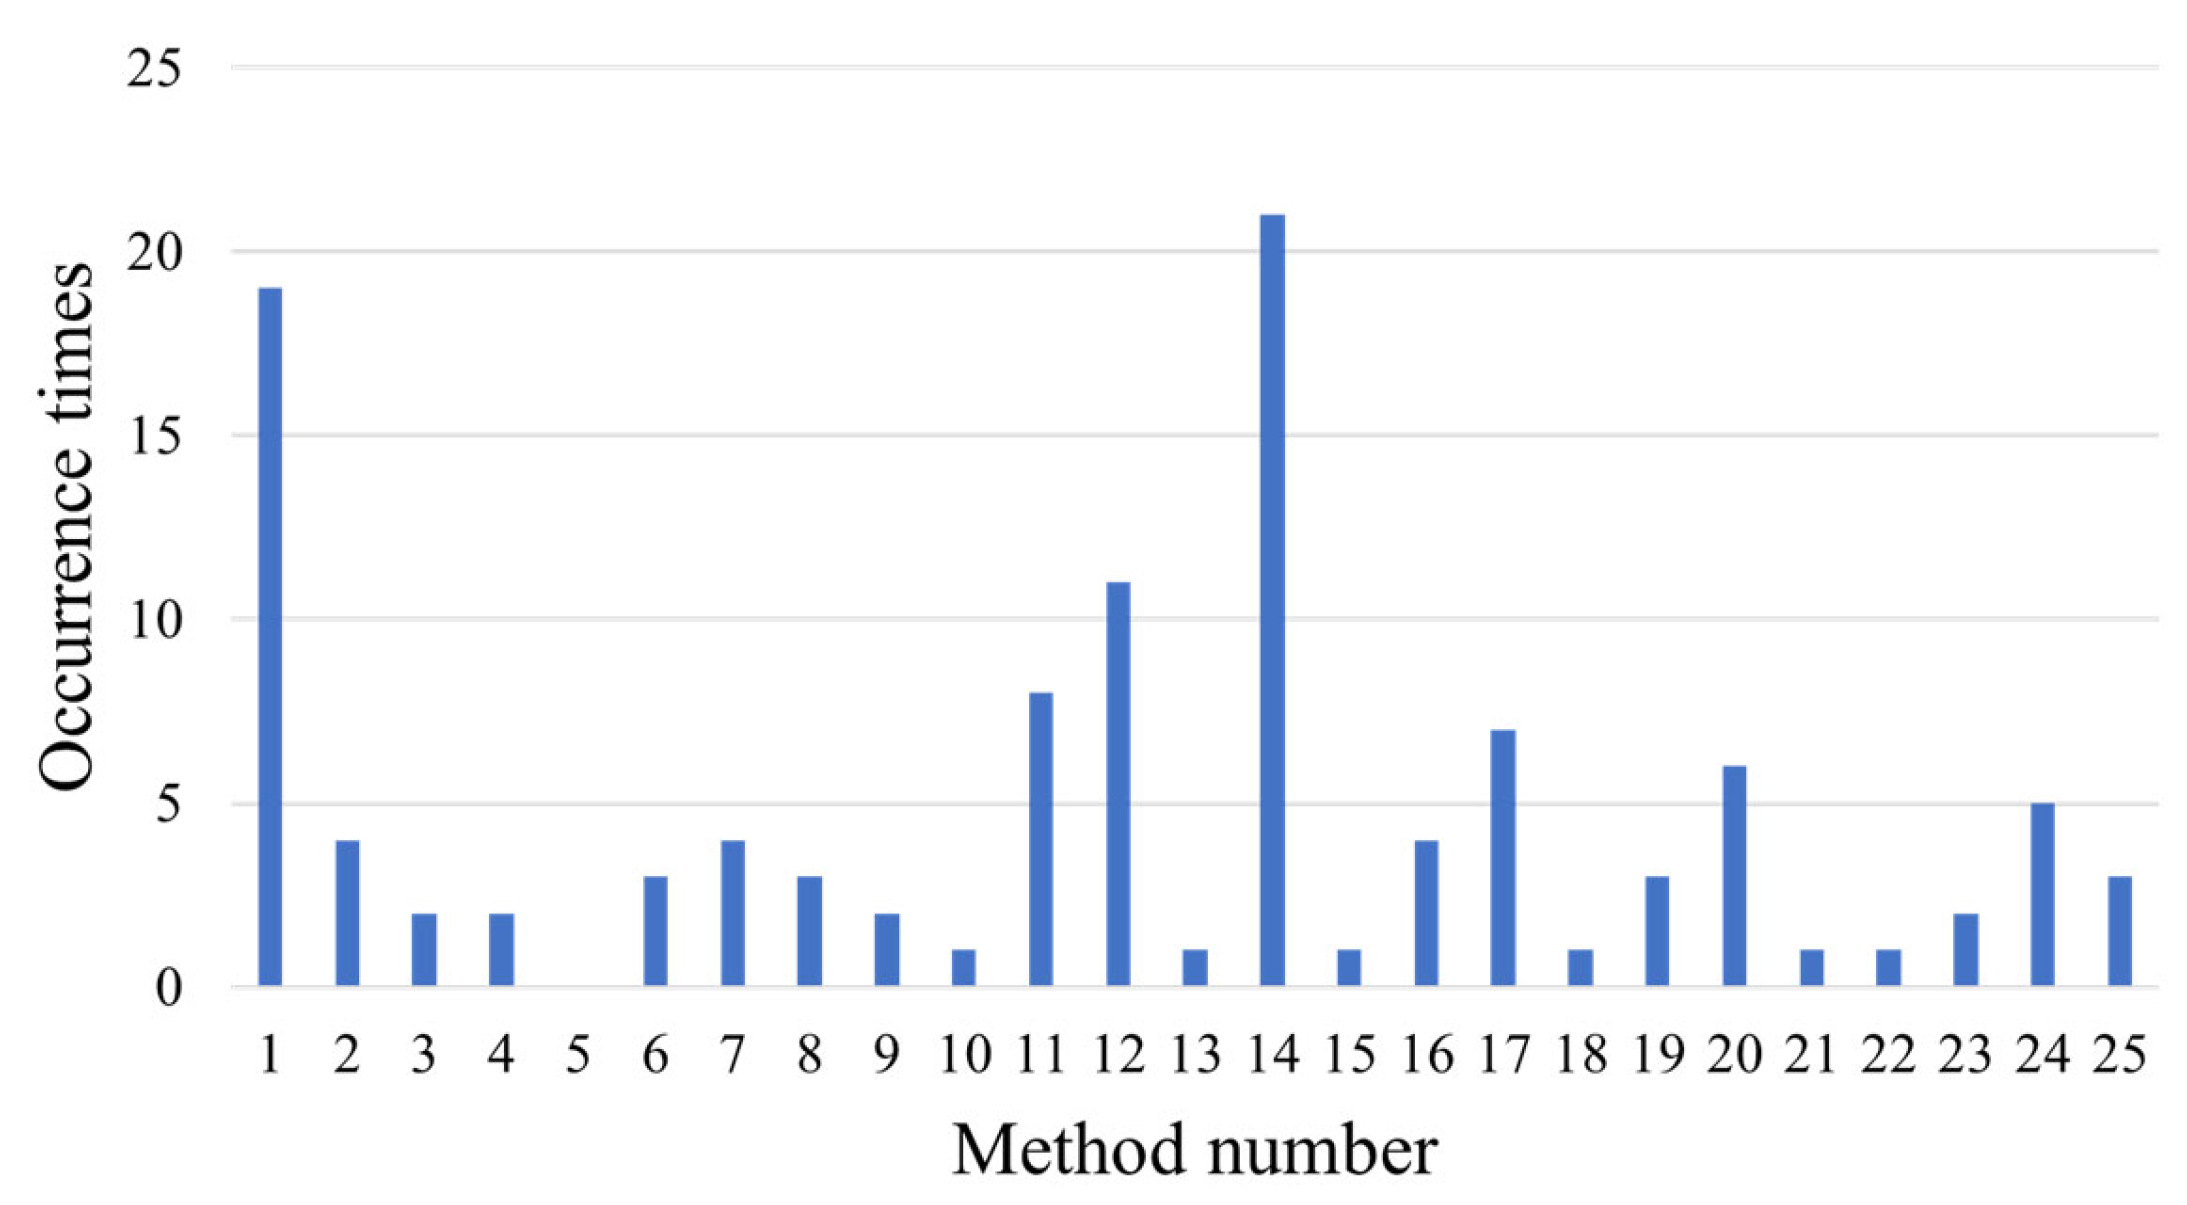
(b) Statistics on Adopted Methods
NumberMethods
1Analytic Hierarchy Process (AHP)
2Analytic Network Process (ANP)
3Elimination and Choice Translating Reality (ELECTRE)
4Technique for Order Preference by Similarity to Ideal Solution (TOPSIS)
5Preference Ranking Organization Method for Enrichment Evaluations (PROMETHEE)
6VIseKriterijumska Optimizacija I Kompromisno Resenje (VIKOR)
7Decision-making Trial and Evaluation Laboratory (DEMATEL)
8Delphi method
9Data envelopment analysis (DEA)
10Interpretative Structural Modeling Method (ISM)
11Fuzzy mathematics methods
12Fuzzy Comprehensive Evaluation (FCE)
13Mean-variance criterion
14Entropy Weight Method (EWM)
15Expert evaluation method
16Grey Relation Analysis (GRA)
17Statistical analysis methods
18Mathematical calculation methods
19Target Oriented Decision Making (TODIM)
20Cloud model
21Theory of evidence
22Kendall’s correlation coefficient method
23Coefficient of variation
24Matter-element extension analysis method
25Criteria Importance Through Inter-criteria Correlation (CRITIC)
26Hybrid multi-attribute group decision-making method based on dominance degree
27Planning scheme evaluation method considering influence set
28Weighted method of multi-objective linear function
29Multilevel Set-Valued Iterative Method
30correlation network
31Classification quantification method
32Dynamic combination weighting method
33Scorecard model
34Variable Weighting Method
35Combined weighting method based on improved game theory
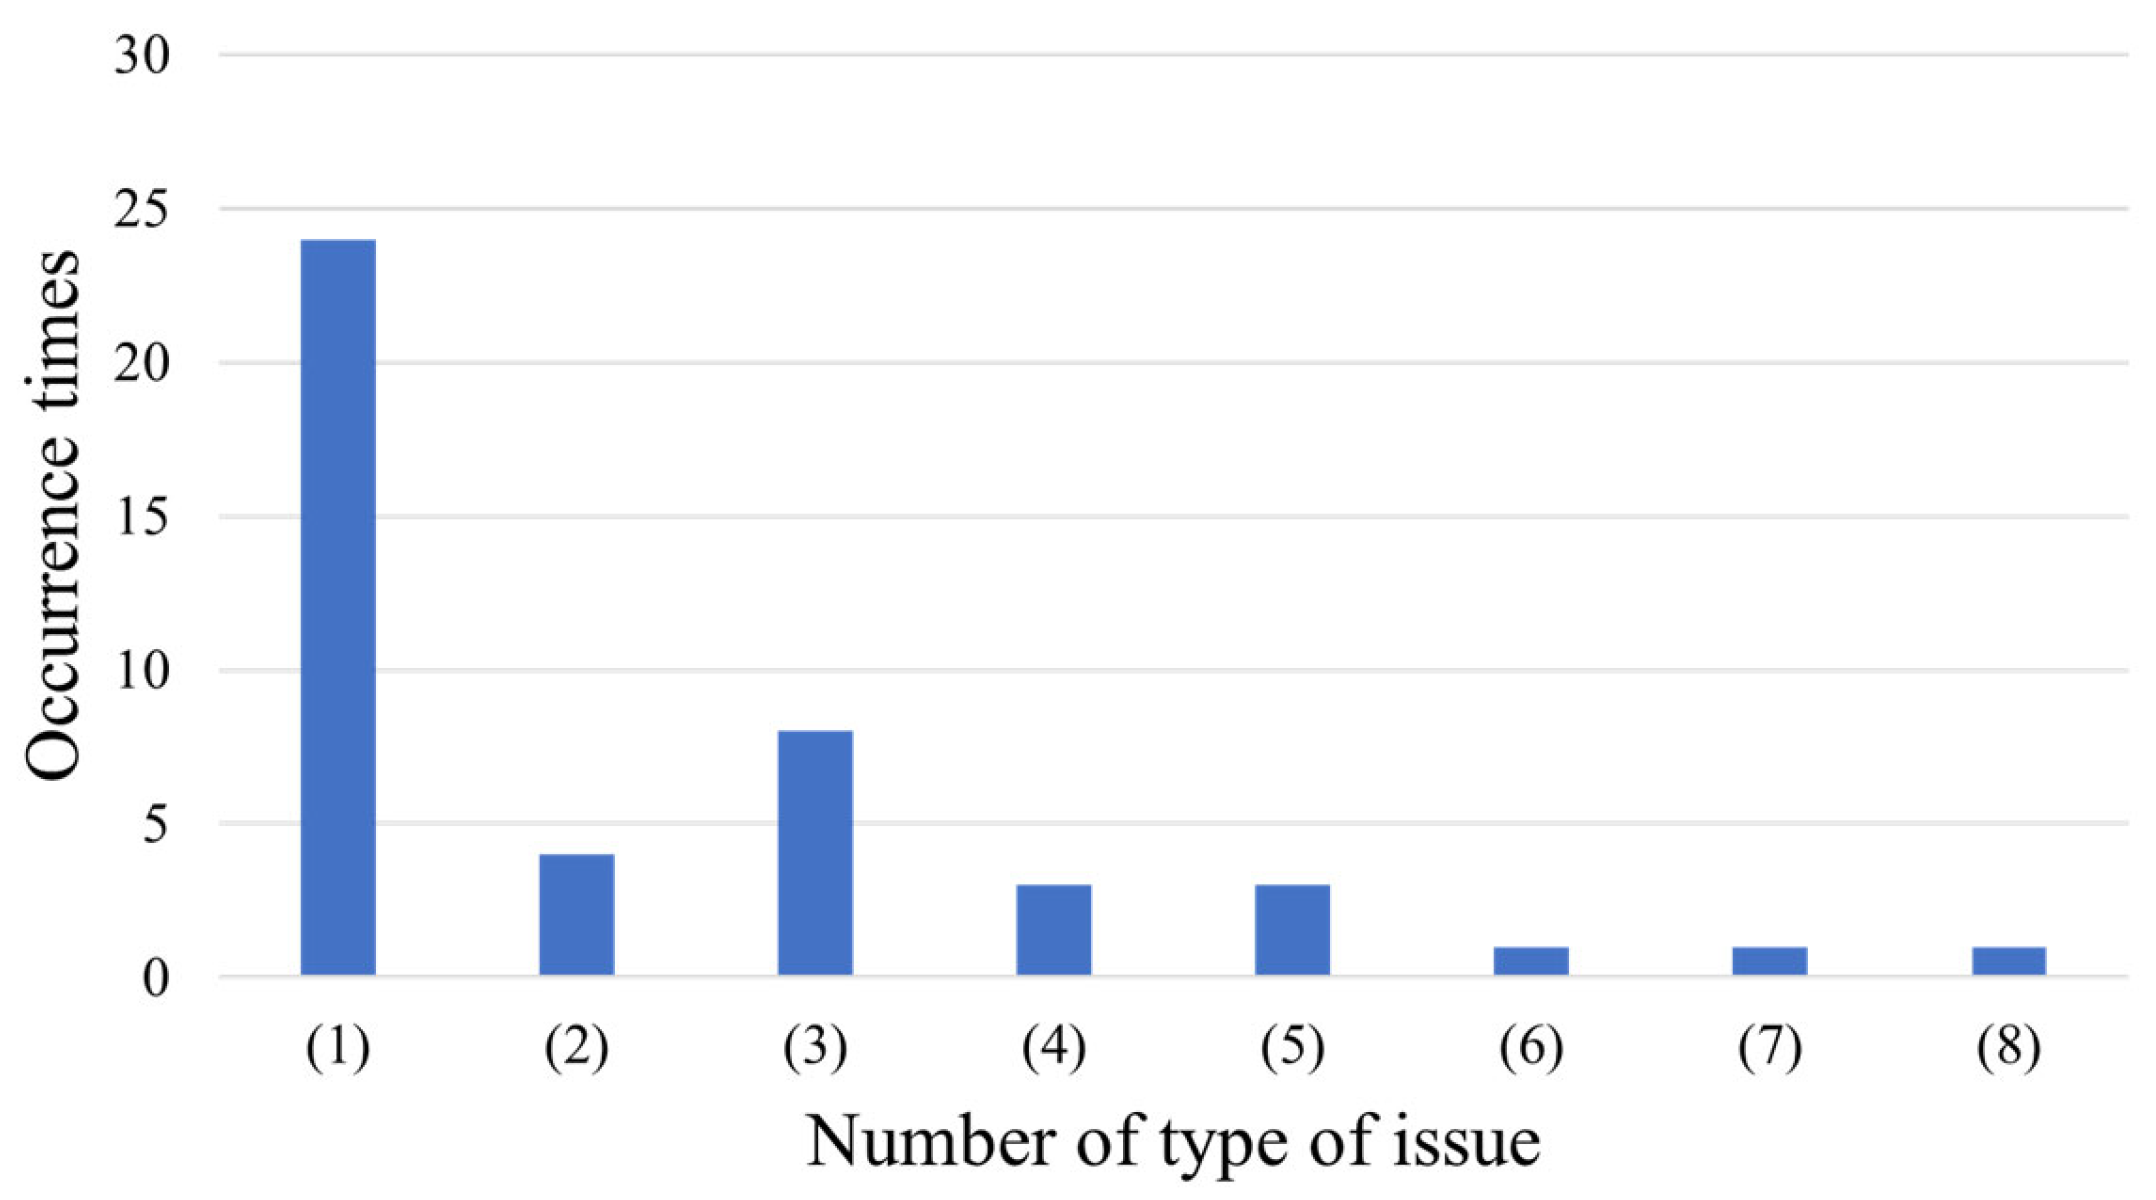
(c) Statistics on Types of Issues
NumberType of Issue
(1)Comprehensive evaluation of integrated energy systems
(2)Site-selection evaluation of integrated energy systems
(3)Benefit evaluation of integrated energy systems
(4)Energy efficiency evaluation of integrated energy systems
(5)Planning evaluation of integrated energy systems
(6)Reliability evaluation of integrated energy systems
(7)Investment evaluation of integrated energy systems
(8)Operation service evaluation of integrated energy systems
Table 4. Summary of quantitative indicators with high frequency of occurrence.
CategoriesIndicators
Economic indicatorsInitial investment cost
Equipment Operation and maintenance cost over life cycle
External energy purchase cost
Operational penalty cost
Equivalent environmental cost
Government subsidy revenue
Profit generated by each piece of equipment
Technical indicatorsEquipment energy efficiency ratio
Comprehensive energy utilization rate
Environmental indicatorsPollution emissions (carbides, sulfides, nitrogen oxides)
Carbon emissions (CO2, carbon dust)
Table 5. Summary of qualitative indicators with high frequency of occurrence.
CategoriesIndicators
Technical indicatorsTechnological maturity
Safety and reliability
Energy supply quality
Environmental indicatorsEcological environmental impact
Social indicatorsPolicy support
Degree of regional economic contribution
End-user comfort level
Disclaimer/Publisher’s Note: The statements, opinions and data contained in all publications are solely those of the individual author(s) and contributor(s) and not of MDPI and/or the editor(s). MDPI and/or the editor(s) disclaim responsibility for any injury to people or property resulting from any ideas, methods, instructions or products referred to in the content.

