Article

Estimation of Respiratory Signals from Remote Photoplethysmography of RGB Facial Videos

1
The Seoul Institute, Seoul 06756, Republic of Korea
2
Department of Human-Centered Artificial Intelligence, Sangmyung University, Seoul 03016, Republic of Korea
*
Author to whom correspondence should be addressed.
These authors contributed equally to this work.
Electronics 2025, 14(11), 2152; https://doi.org/10.3390/electronics14112152
Submission received: 30 April 2025 / Revised: 15 May 2025 / Accepted: 20 May 2025 / Published: 26 May 2025

Abstract

:
Recently, technologies monitoring users’ physiological signals in consumer electronics such as smartphones or kiosks with cameras and displays are gaining attention for their potential role in diverse services. While many of these technologies focus on photoplethysmography for the measurement of blood flow changes, respiratory measurement is also essential for assessing an individual’s health status. Previous studies have proposed thermal camera-based and body movement-based respiratory measurement methods. In this paper, we adopt an approach to extract respiratory signals from RGB face videos using photoplethysmography. Prior research shows that photoplethysmography can measure respiratory signals, due to its correlation with cardiac activity, by setting arterial vessel regions as areas of interest for respiratory measurement. However, this correlation does not directly reflect real-time respiratory components in photoplethysmography. Our new approach measures the respiratory rate by capturing changes in skin brightness from motion artifacts. We utilize these brightness factors, including facial movement, for respiratory signal measurement. We applied the wavelet transform and smoothing filters to remove other unrelated motion artifacts. In order to validate our method, we built a dataset of respiratory rate measurements from 20 individuals using an RGB camera in a facial movement-aware environment. Our approach demonstrated a similar performance level to the reference signal obtained with a contact-based respiratory belt, with a correlation above 0.9 and an MAE within 1 bpm. Moreover, our approach offers advantages for real-time measurements, excluding complex computational processes for measuring optical flow caused by the movement of the chest due to respiration.

1. Introduction

Continuous physiological monitoring and health status assessment are of critical importance. While contact-based biosignal monitoring technologies are available for this purpose, they can be inconvenient for users, limited by the environment in which measurements are taken, and costly in the context of continuous monitoring. However, recent progress in video technology has led to the development of various non-contact-based techniques for physiological signals, overcoming the limitations of traditional contact-based devices [1]. Progress has been made in research on monitoring physiological signals using cameras and displays in consumer electronics, with remote patient monitoring (RPM) being a notable example. Studies supporting the clinical benefits of RPM have increased, especially due to the COVID-19 pandemic. For instance, Coffey et al. (2021) published a study indicating lower rates of urgent care visits and hospital admissions in patients enrolled in RPM programs [2]. Marrugo et al. (2019) proposed a new RPM that analyzes the progress of diseases and diagnoses health status through blood pressure and blood oxygen saturation measurements [3]. These techniques are particularly useful for patients requiring continuous treatment, such as those with hypertension. RPM, therefore, has proven to be valuable for the management of both chronic and acute conditions, and it enables the evaluation of a patient’s condition when face-to-face treatment is not possible. Real-time patient monitoring and data collection can be adjusted to improve treatment outcomes, especially for chronic treatments. Examples of health monitoring systems are shown in Figure 1. One noteworthy physiological signal that can be estimated using these non-contact-based techniques is the respiratory rate. It is a key measurement among the essential health indicators that reflect the body’s status and function. Research trends indicate that various non-contact methods are being developed and utilized for estimating the respiratory rate. Among thermographic camera-based approaches, Takahashi et al. (2021) proposed a method that detects facial regions using a thermographic camera and automatically selects respiratory-related areas, using the respiratory quality index (RQI) to estimate the respiratory rate [4]. Jakkaew et al. (2020) suggested a non-contact method that does not require facial landmark detection for respiratory monitoring in uncontrolled sleep environments [5]. This method utilizes temperature sensing to automatically detect regions of interest and extracts respiratory motion, integrating the respiratory signal while also detecting body movements. These thermographic camera-based methods have the advantage of being unaffected by lighting variations if the respiratory-related areas are reliably detected. However, high-resolution thermographic cameras are expensive, and resolution greatly affects performance.
In terms of motion-based methods, Romano et al. (2021) utilized RGB cameras to automatically select regions of interest related to chest movement caused by respiration and proposed a method to detect and remove non-respiratory movements [6]. Guo et al. (2021) proposed a method that utilizes convolutional neural networks to extract optical flow induced by subtle upper body movements during periodic inhalation and exhalation [7]. This method enables measurement using low-cost cameras. However, it is vulnerable to motion noise and is influenced by personal factors, such as clothing and background, which can affect the respiratory pattern. Additionally, using optical flow-based techniques requires exploring every pixel in the image, resulting in a longer processing time. Furthermore, remote photoplethysmography (PPG)-based methods include the work of van Gastel et al. (2016), who proposed a contactless approach capable of functioning in both light and dark environments [8]. They extracted respiratory signals by analyzing respiratory characteristics in the pulsatile blood volume changes, measured through variations in blood pressure. Park et al. (2022) proposed a method that extracts respiratory signals from the Cg color difference component [9]. They defined the area of the cheek near the nose as the region of interest (ROI), where variations in skin tone caused by arterial blood flow are observed in relation to respiration. Their approach enables measurement using low-cost cameras and is robust against motion noise when obtaining the average respiratory rate through frequency conversion. However, the underlying principles for estimating respiration using their method have not been fully elucidated. These studies present various approaches for estimating respiratory rates using non-contact- or camera-based techniques. Every method has its own set of benefits and drawbacks, and choosing the most appropriate one depends on the particular situation. In recent years, advancements in contactless physiological monitoring have led to the introduction of deep learning techniques that significantly enhance the accuracy of rPPG-based signal estimation. For instance, Chen et al. (2024) presented a comprehensive review of state-of-the-art rPPG systems for non-contact vital sign monitoring, emphasizing the integration of deep learning and computer vision for robust estimation under diverse environmental conditions [10]. Similarly, Miao et al. (2025) proposed RespDiff, an end-to-end diffusion model using multi-scale RNNs to estimate respiratory waveforms from PPG signals, achieving accurate predictions without the need for handcrafted feature extraction [11]. These recent developments highlight a growing trend toward real-time, camera-based respiratory monitoring using learning-based methods. Our approach aligns with this trend by providing a lightweight, interpretable signal-processing framework that leverages luminance-driven rPPG signals, focusing on computational efficiency and transparency. Table 1 presents a comparison of the existing studies. Our suggested approach presents three contributions in contrast to prior studies.
  • First, we aim to clarify the rationale for respiration measurement using remote photoplethysmography (rPPG).
  • Second, we demonstrate the feasibility of respiration measurement through rPPG, which is governed by motion artifacts induced by respiration, rather than the influence of skin color changes caused by arterial blood flow.
  • Third, we employ the luminance component to extract signals in order to confirm the presence of such motion artifacts for respiration measurement.
In addition, hardware-based systems for non-invasive ventilation have been proposed for clinical and home applications [12]. In contrast, our approach focuses on software-based estimation using visual data only.

2. Methods

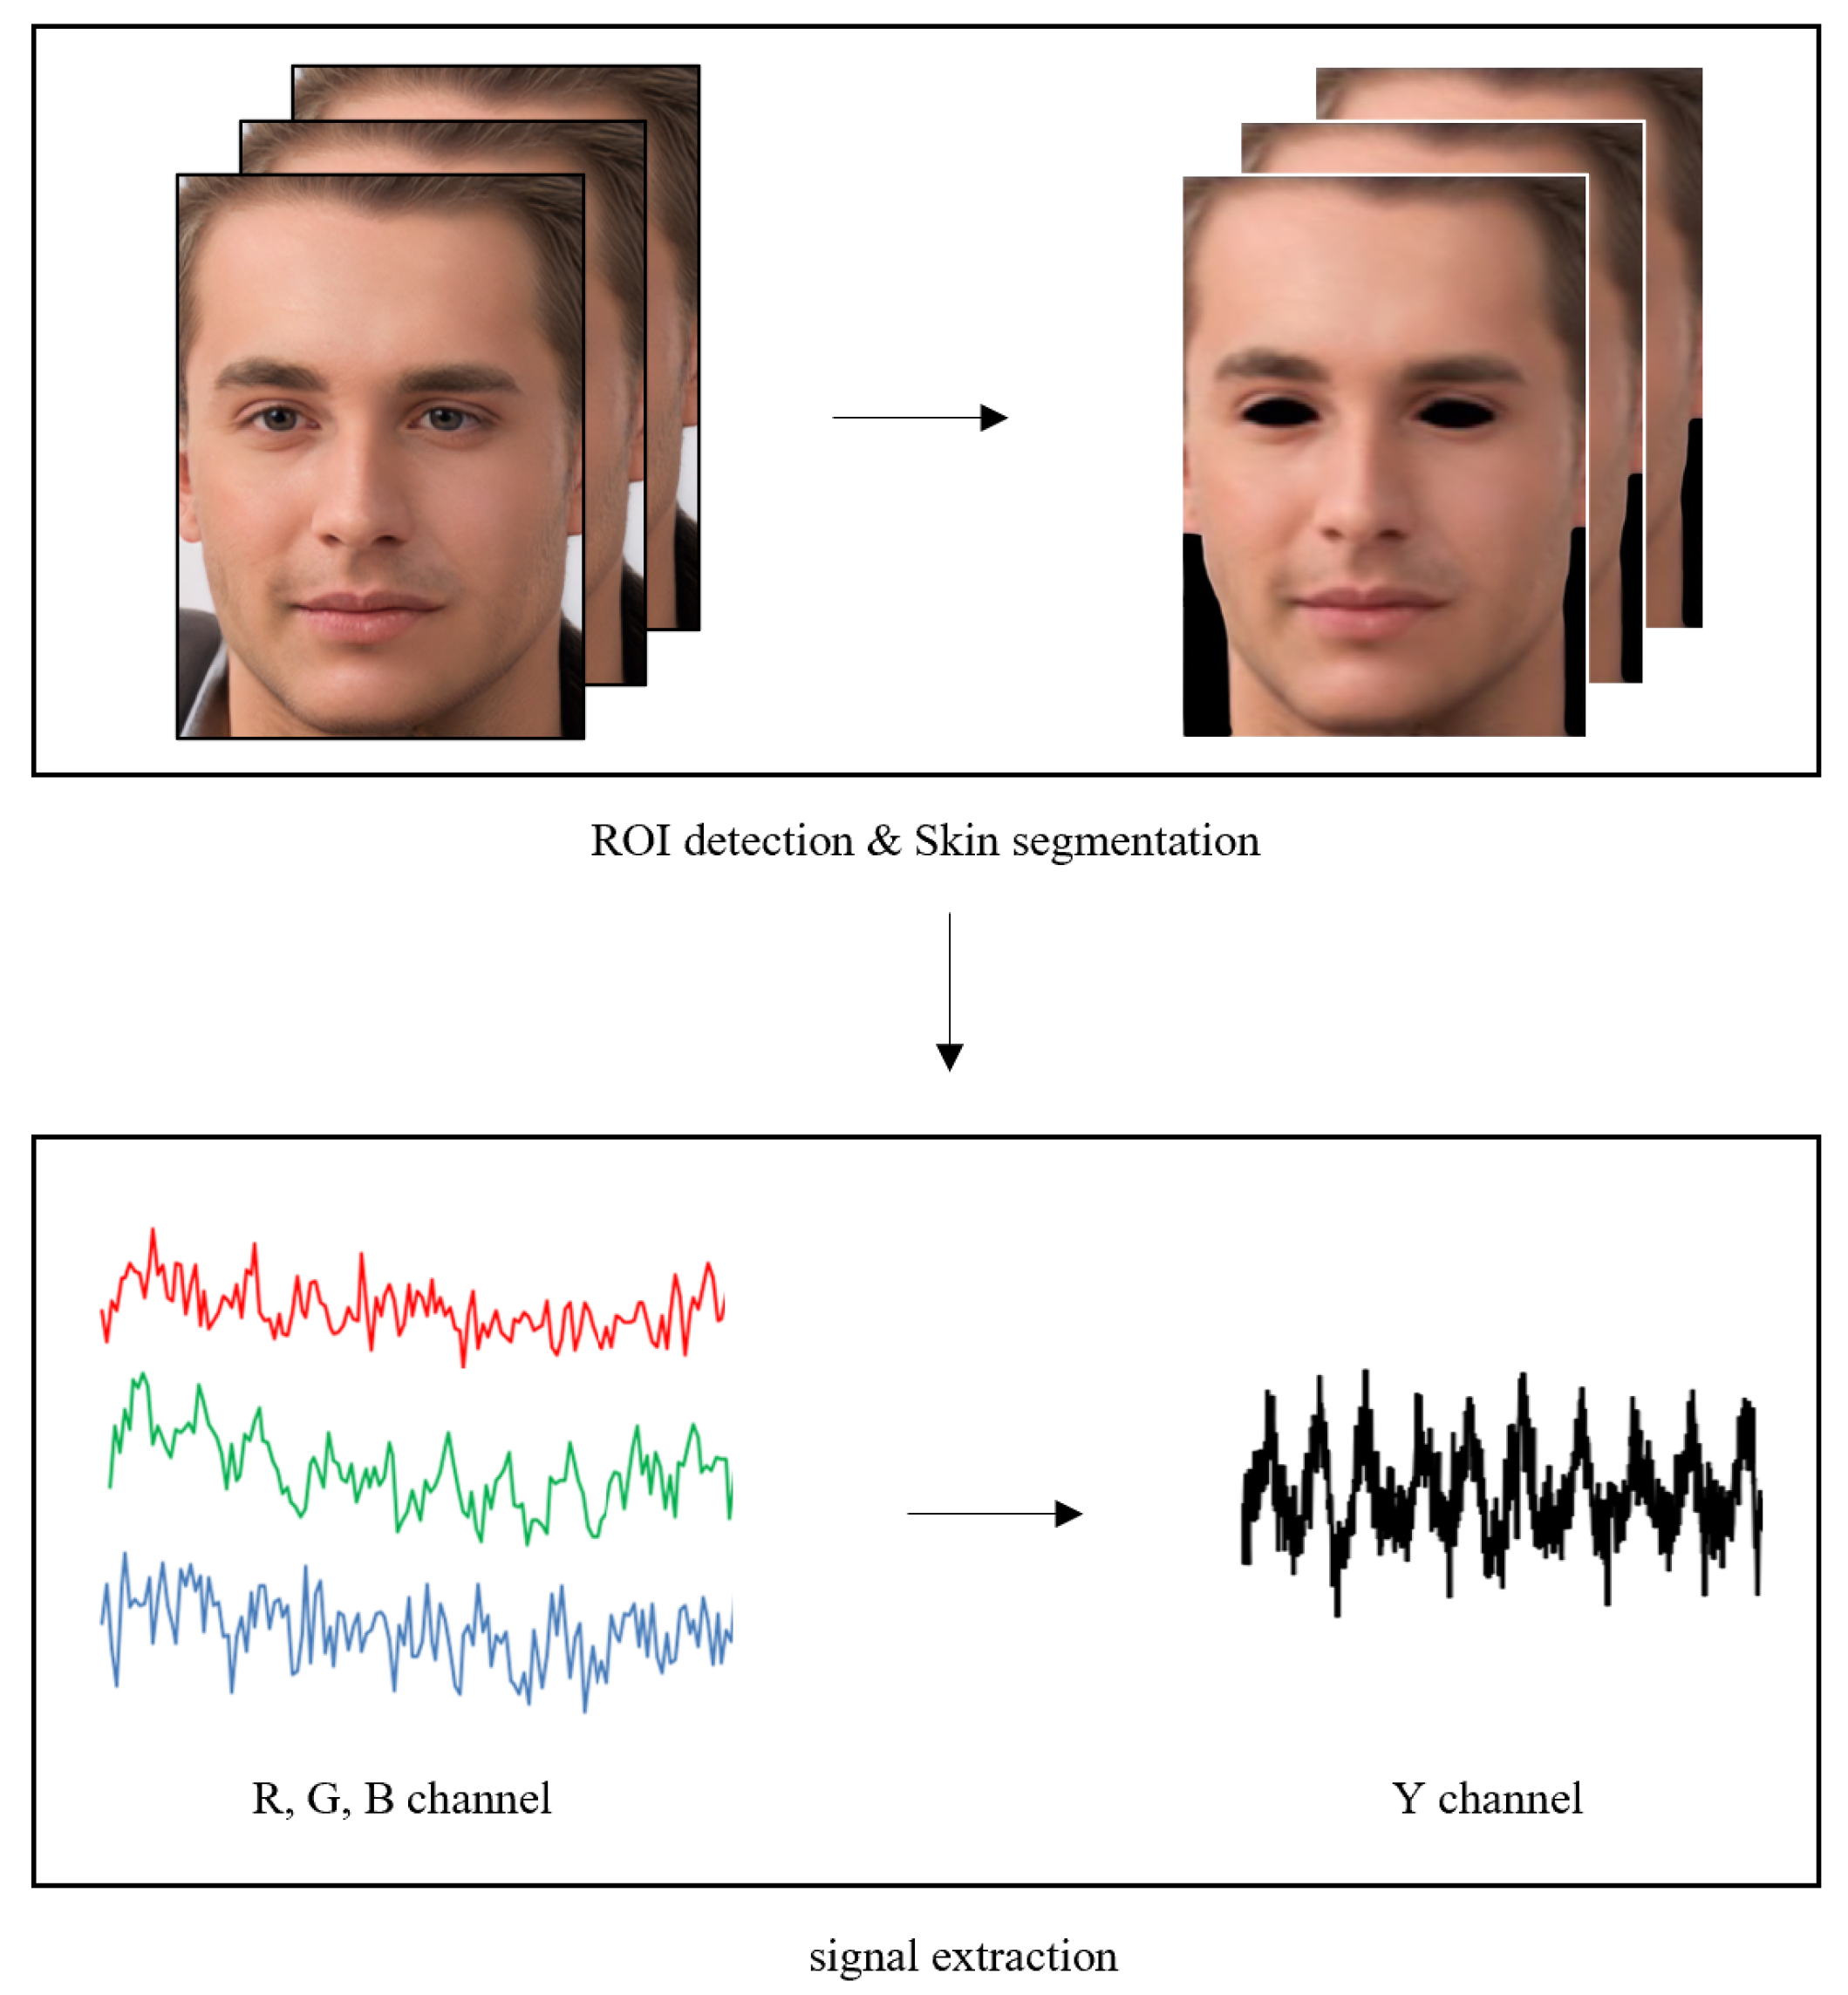
2.1. Remote Photoplethysmography Signal Extraction

We utilized the principle of rPPG for respiratory rate measurement. The principle of rPPG relies on the fact that blood takes in more light than the nearby tissue [13]. In fact, this phenomenon can be observed by tracking pixels in skin areas. For heart rate measurements, it is necessary to remove luminance components to reduce noise caused by facial movement and lighting changes. However, for respiratory measurements, luminance components can be used, as the brightness value of the image changes due to subtle facial movements during respiration. The rPPG extraction process used in this research, as shown in Figure 2, was performed as follows. The Mediapipe algorithm was used to detect facial regions of interest (ROIs) in image frames, and skin areas were detected through skin segmentation [14].
RGB images extracted by the camera were converted to the YCbCr color space to independently separate the luminance and chrominance components. We utilized only the Y component, which is the luminance component, as the signal value to estimate the respiratory rate through the rPPG signal. A one-time-series signal for the target image was constructed in each frame by obtaining the average value of all pixels in the target face region. In addition, band-pass filtering was performed within the frequency interval between 0.08 Hz and 0.66 Hz (equivalent to between 5 bpm and 40 bpm), considering the general respiratory rate. To isolate respiratory signals, we applied band-pass filtering in the range of 0.08–0.66 Hz, effectively excluding cardiac-related components typically found at around 1 Hz.

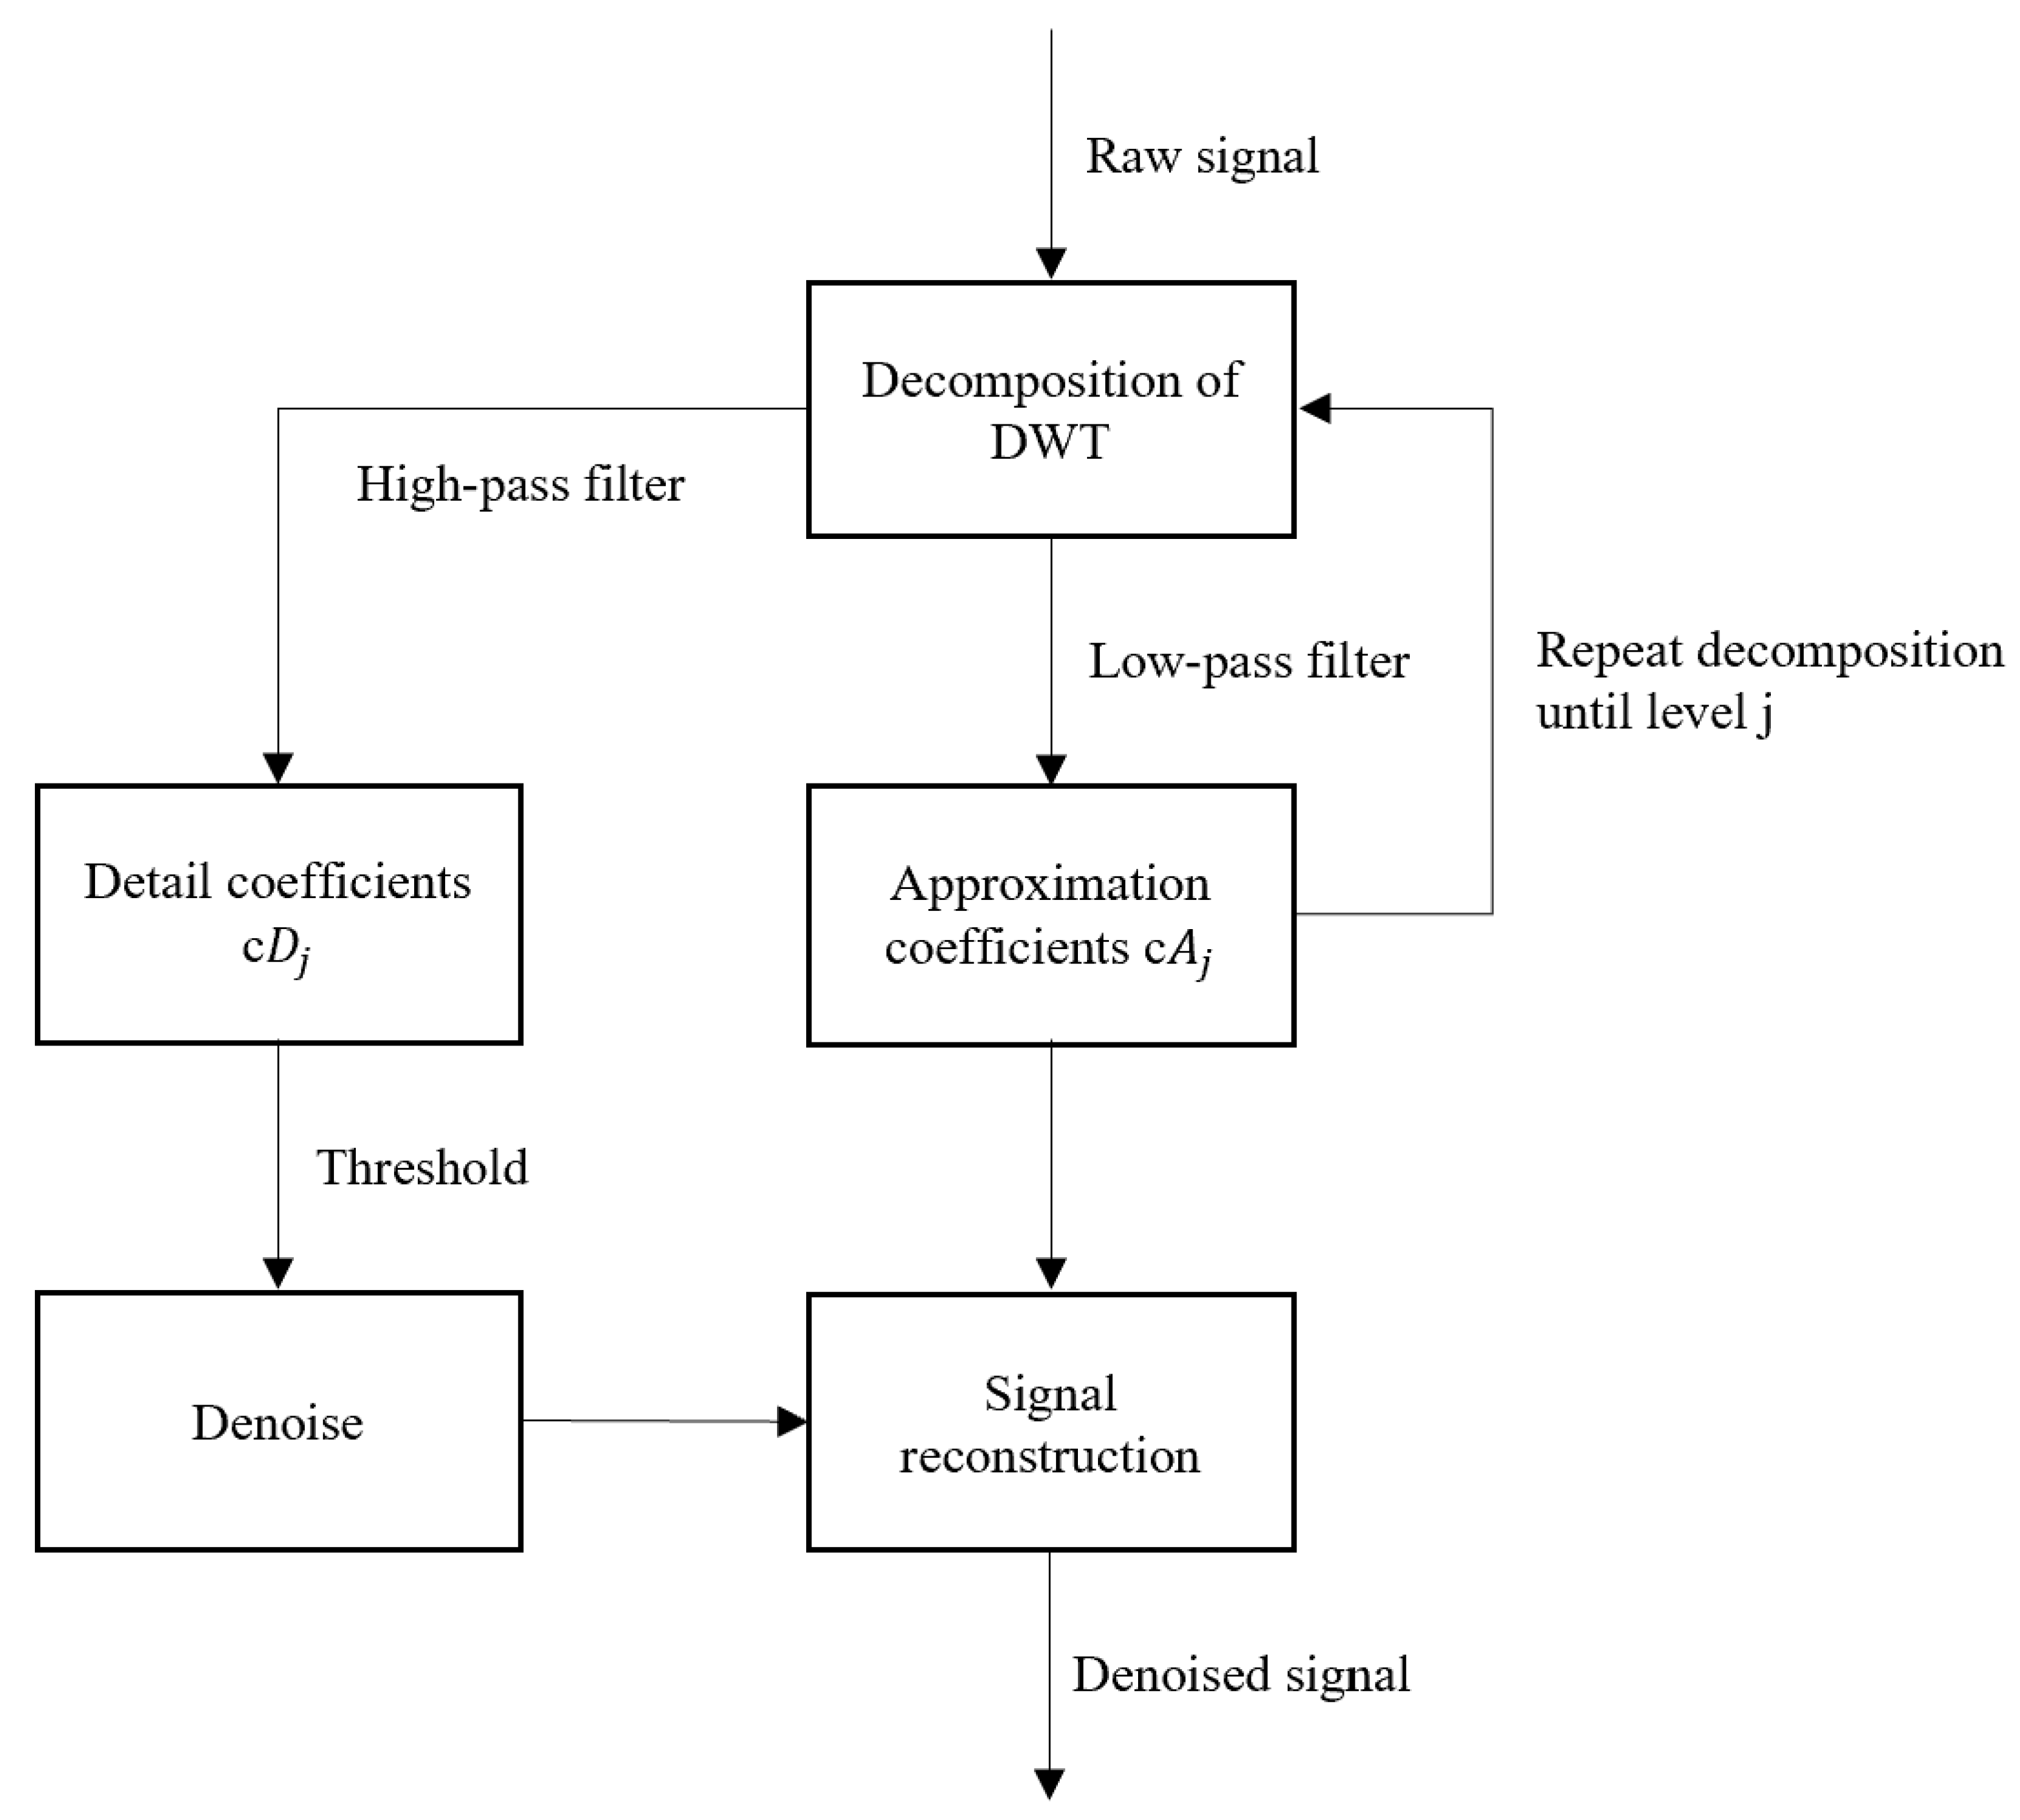
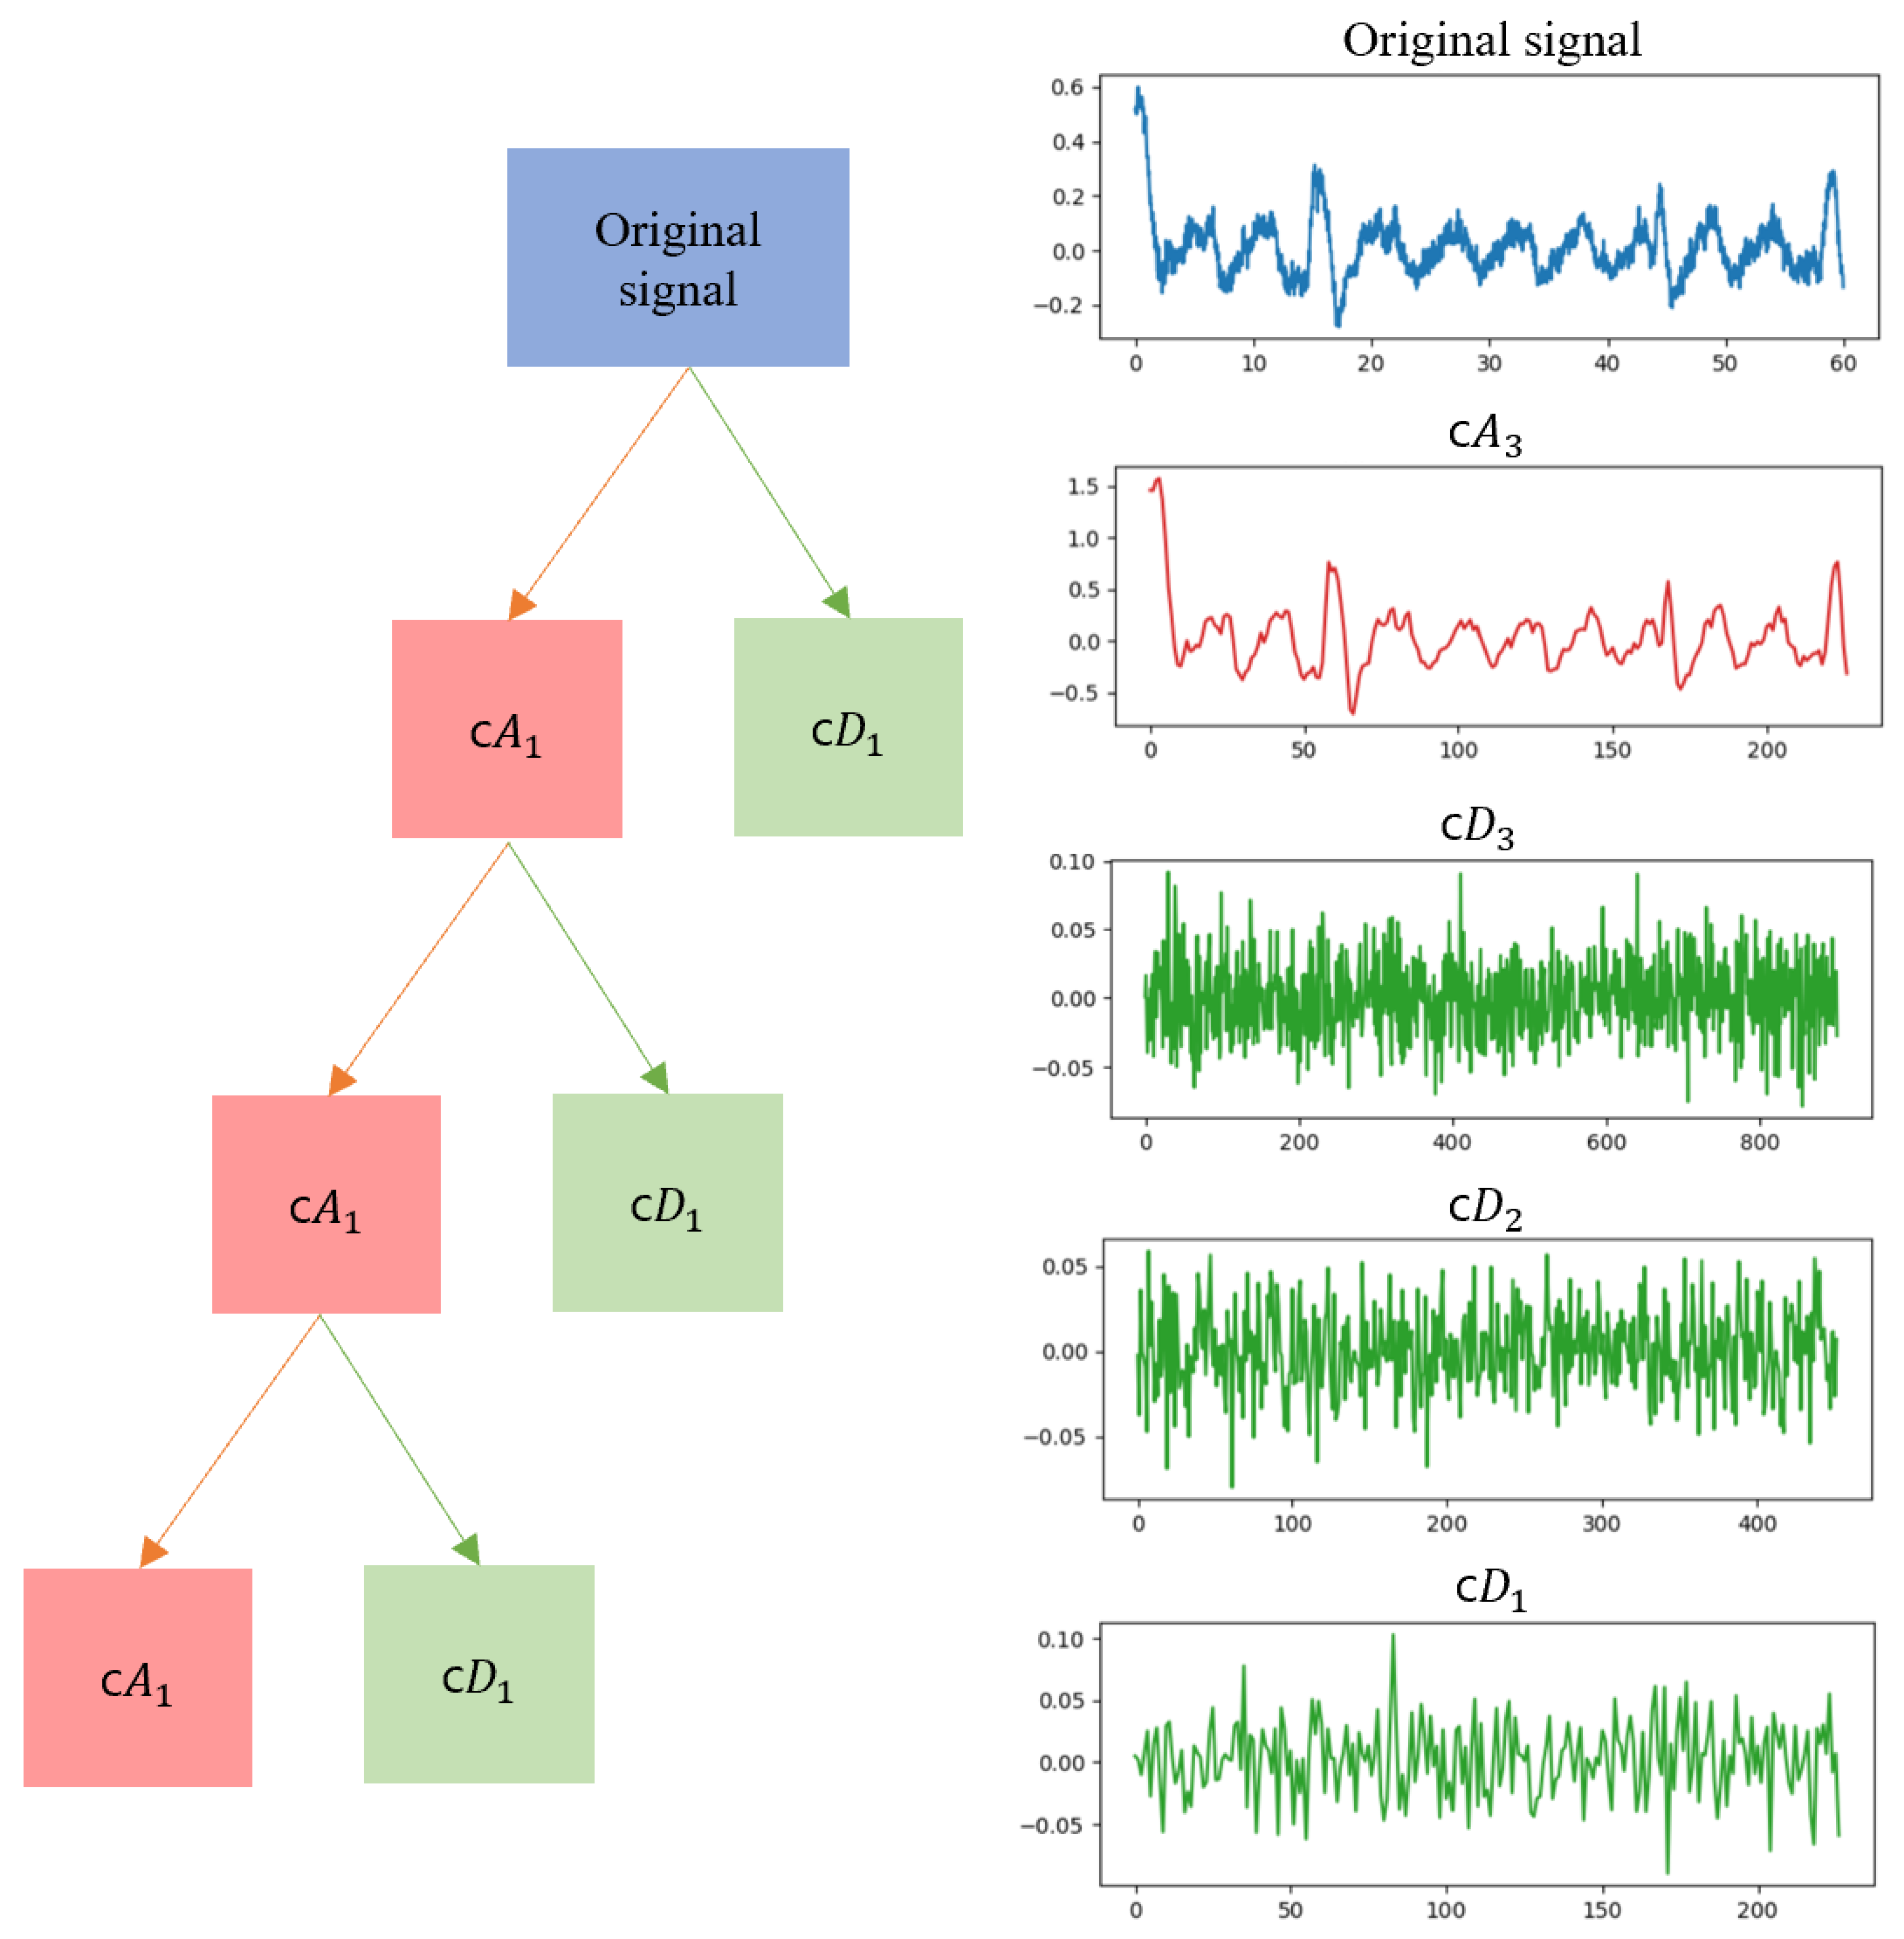
2.2. Removal of Unrelated Motion Artifacts

In this study, a threshold-based noise reduction method was applied using the discrete wavelet transform (DWT) to remove motion artifacts that may occur due to facial movement and changes in skin brightness [15,16]. Since such noise can have a greater impact during the process of extracting signals using brightness components rather than color components, it is necessary to effectively remove the noise and reconstruct the signal. An overview of these noise removal methods is represented in Figure 3.
The original signal is separated into approximate coefficients and detail coefficients, which are also called wavelet coefficients, using the discrete wavelet transform. In this process, wavelet coefficients with larger amplitudes represent more important components of the original signal, while coefficients with smaller amplitudes are generally related to noise. In the threshold-based noise removal method, an appropriate threshold value is determined, and wavelet coefficients are filtered based on this value. Wavelet coefficients that exceed the threshold value are preserved, while those below the threshold value are eliminated. The noise-removed signal is reconstructed using processed wavelet coefficients. Wavelet noise removal can act as a low-pass filter. This method has the property of maintaining low-frequency components of the signal while removing high-frequency noise, enabling the extraction of the original signal’s features and combining them with low-pass filtering. Consequently, the wavelet transform is a suitable method to suppress the interference of high-frequency noise and effectively distinguish low-frequency information from high-frequency noise. The decomposition process using the discrete wavelet transform are expressed in Equations (1) and (2).
x ( j + 1 ) , L [ n ] = i = 0 K 1 x ( j , L ) [ 2 n i ] g [ i ] ,
x ( j + 1 ) , H [ n ] = i = 0 K 1 x ( j , L ) [ 2 n i ] h [ i ] .
Discrete input signals, x [ n ] , with a length of N, can be filtered using a low-pass filter g [ n ] to remove high-frequency components or through a high-pass filter h [ n ] to remove low-frequency components. Theoretically, wavelet transforms can be decomposed to a maximum level of j = log 2 n , where n is the length of the signal. As the decomposition level of the wavelet transform increases, the distinction between signal and noise becomes clearer. However, the possibility of reconstruction error also increases with a higher number of decomposition levels.
Therefore, it is crucial to perform matched noise verification on the detail coefficients in the discrete wavelet transform (DWT) to promote signal–noise separation while minimizing signal distortion and achieving optimal noise reduction. We experimented with different levels of decomposition, considering factors such as signal length and noise level. Through this process, we empirically determined the level that provides the best performance. The approximation and detail coefficients that apply the level 3 discrete wavelet transform are shown in Figure 4. This approach enhances the overall signal-processing performance by optimizing both signal quality and noise removal.
After applying the DWT, the Savitzky–Golay (SG) filter was utilized for smoothing [17,18]. This filter was designed to achieve a similar effect to calculating a regression model for each time step’s window using the impulse response. The SG filter effectively reduces noise while preserving the shape and amplitude of waveform peaks and increases data precision without distorting the signal’s tendency. Through parameter testing, optimal values for the most well-filtered signal were determined, utilizing a window length of 90 and a polynomial order of 3. The SG filter is defined in Equation (3).
y [ n ] = m = n M n + M h [ n m ] x [ m ] ,
where h [ n ] is the impulse response and x [ n ] are original signals with a length of 2M + 1. By utilizing the impulse response, we performed smoothing on the original signals through the process of convolution. After applying the SG filter, the results still contained small peaks. Therefore, a simple moving average (SMA) calculation was performed to detect only the desired peaks and remove smaller peaks [19]. When calculating the moving average, we set the window size to 60, considering the signal characteristics and noise level. Within this window size, the arithmetic mean of the input signal was calculated. The window was moved one step at a time and averaged to generate a moving average signal throughout the entire data array. The moving average is defined in Equation (4), as follows:
y [ n ] = 1 2 M + 1 m = n M n + M x [ m ] .
By undertaking this noise removal process, it is possible to determine respiratory peaks even in the presence of noise, such as facial movements. Figure 5 shows the result of removing noise from the respiratory signal measured when there is facial movement.

2.3. Evaluating Signal Quality

Note that 1 Hz corresponds to 60 breaths per minute (bpm); thus, the respiratory frequency range of 5–40 bpm is equivalent to 0.08–0.66 Hz.

2.3.1. SNR (Signal-to-Noise Ratio)

To compare the signal quality when extracting respiratory signals from both luminance and chrominance components, we measured the SNR of respiratory signals in the frequency domain [20]. The first step of this process involves converting the respiratory signals collected in the time domain to the frequency domain utilizing the fast Fourier transform (FFT) algorithm. By transforming the signals to the frequency domain, we can examine the frequency characteristics of the original signals, regardless of the magnitudes of individual frequency components. In this study, a signal between 5 bpm and 40 bpm, which is the range of the general respiratory rate per minute, was considered a normal breathing signal. These signals were defined as target signals, while signals in other frequency regions were considered to be noise signals. We calculated the average power density of each target and noise signal, and the SNR can be derived through these values, as expressed in Equation (5). The SNR indicates the degree of separation between the meaningful components of the respiratory signals and the background noise. Therefore, a higher SNR suggests a more accurate extraction of the original respiratory signals.
SNR = 10 log 10 P signal P noise .

2.3.2. RQI (Respiratory Quality Index)

To assess the quality of the preprocessed signals, we calculate the RQI by considering aspects such as the accuracy, variability, and stability of the breathing pattern [21,22]. In this context, three derived modulations, including respiratory-induced intensity variation (RIIV), respiratory-induced frequency variation (RIFV), and respiratory-induced amplitude variation (RIAV), are extracted from the original signal to quantify the quality of respiratory signals. There are four different methods to calculate the RQI, which is based on FFT, autoregression, autocorrelation, and Hjorth parameters. The respiratory signal has temporal correlation with itself, which can be measured using an autocorrelation function. To exploit this property, the quality of the signal is quantified through the autocorrelation RQI. The autocorrelation function is defined using Equation (6):
r k = 1 N 1 n = 1 N k ( x ( n ) x ¯ ) ( x ( n + k ) x ¯ ) c 0 ,
where r k is the autocorrelation value and c 0 , N, k, and x ¯ are the sample variance, total length of the sample, the sample lag, and the mean of the sample, respectively. The autocorrelation is calculated within a respiratory range of 0.08 to 0.66 Hz for the window x ( n ) at every lag time to identify repeating patterns. RQI is defined as the maximum autocorrelation value, and a higher RQI value indicates a better-quality signal. This approach enables the identification of any region-specific differences in signal quality, facilitating a comprehensive analysis of respiratory signals.

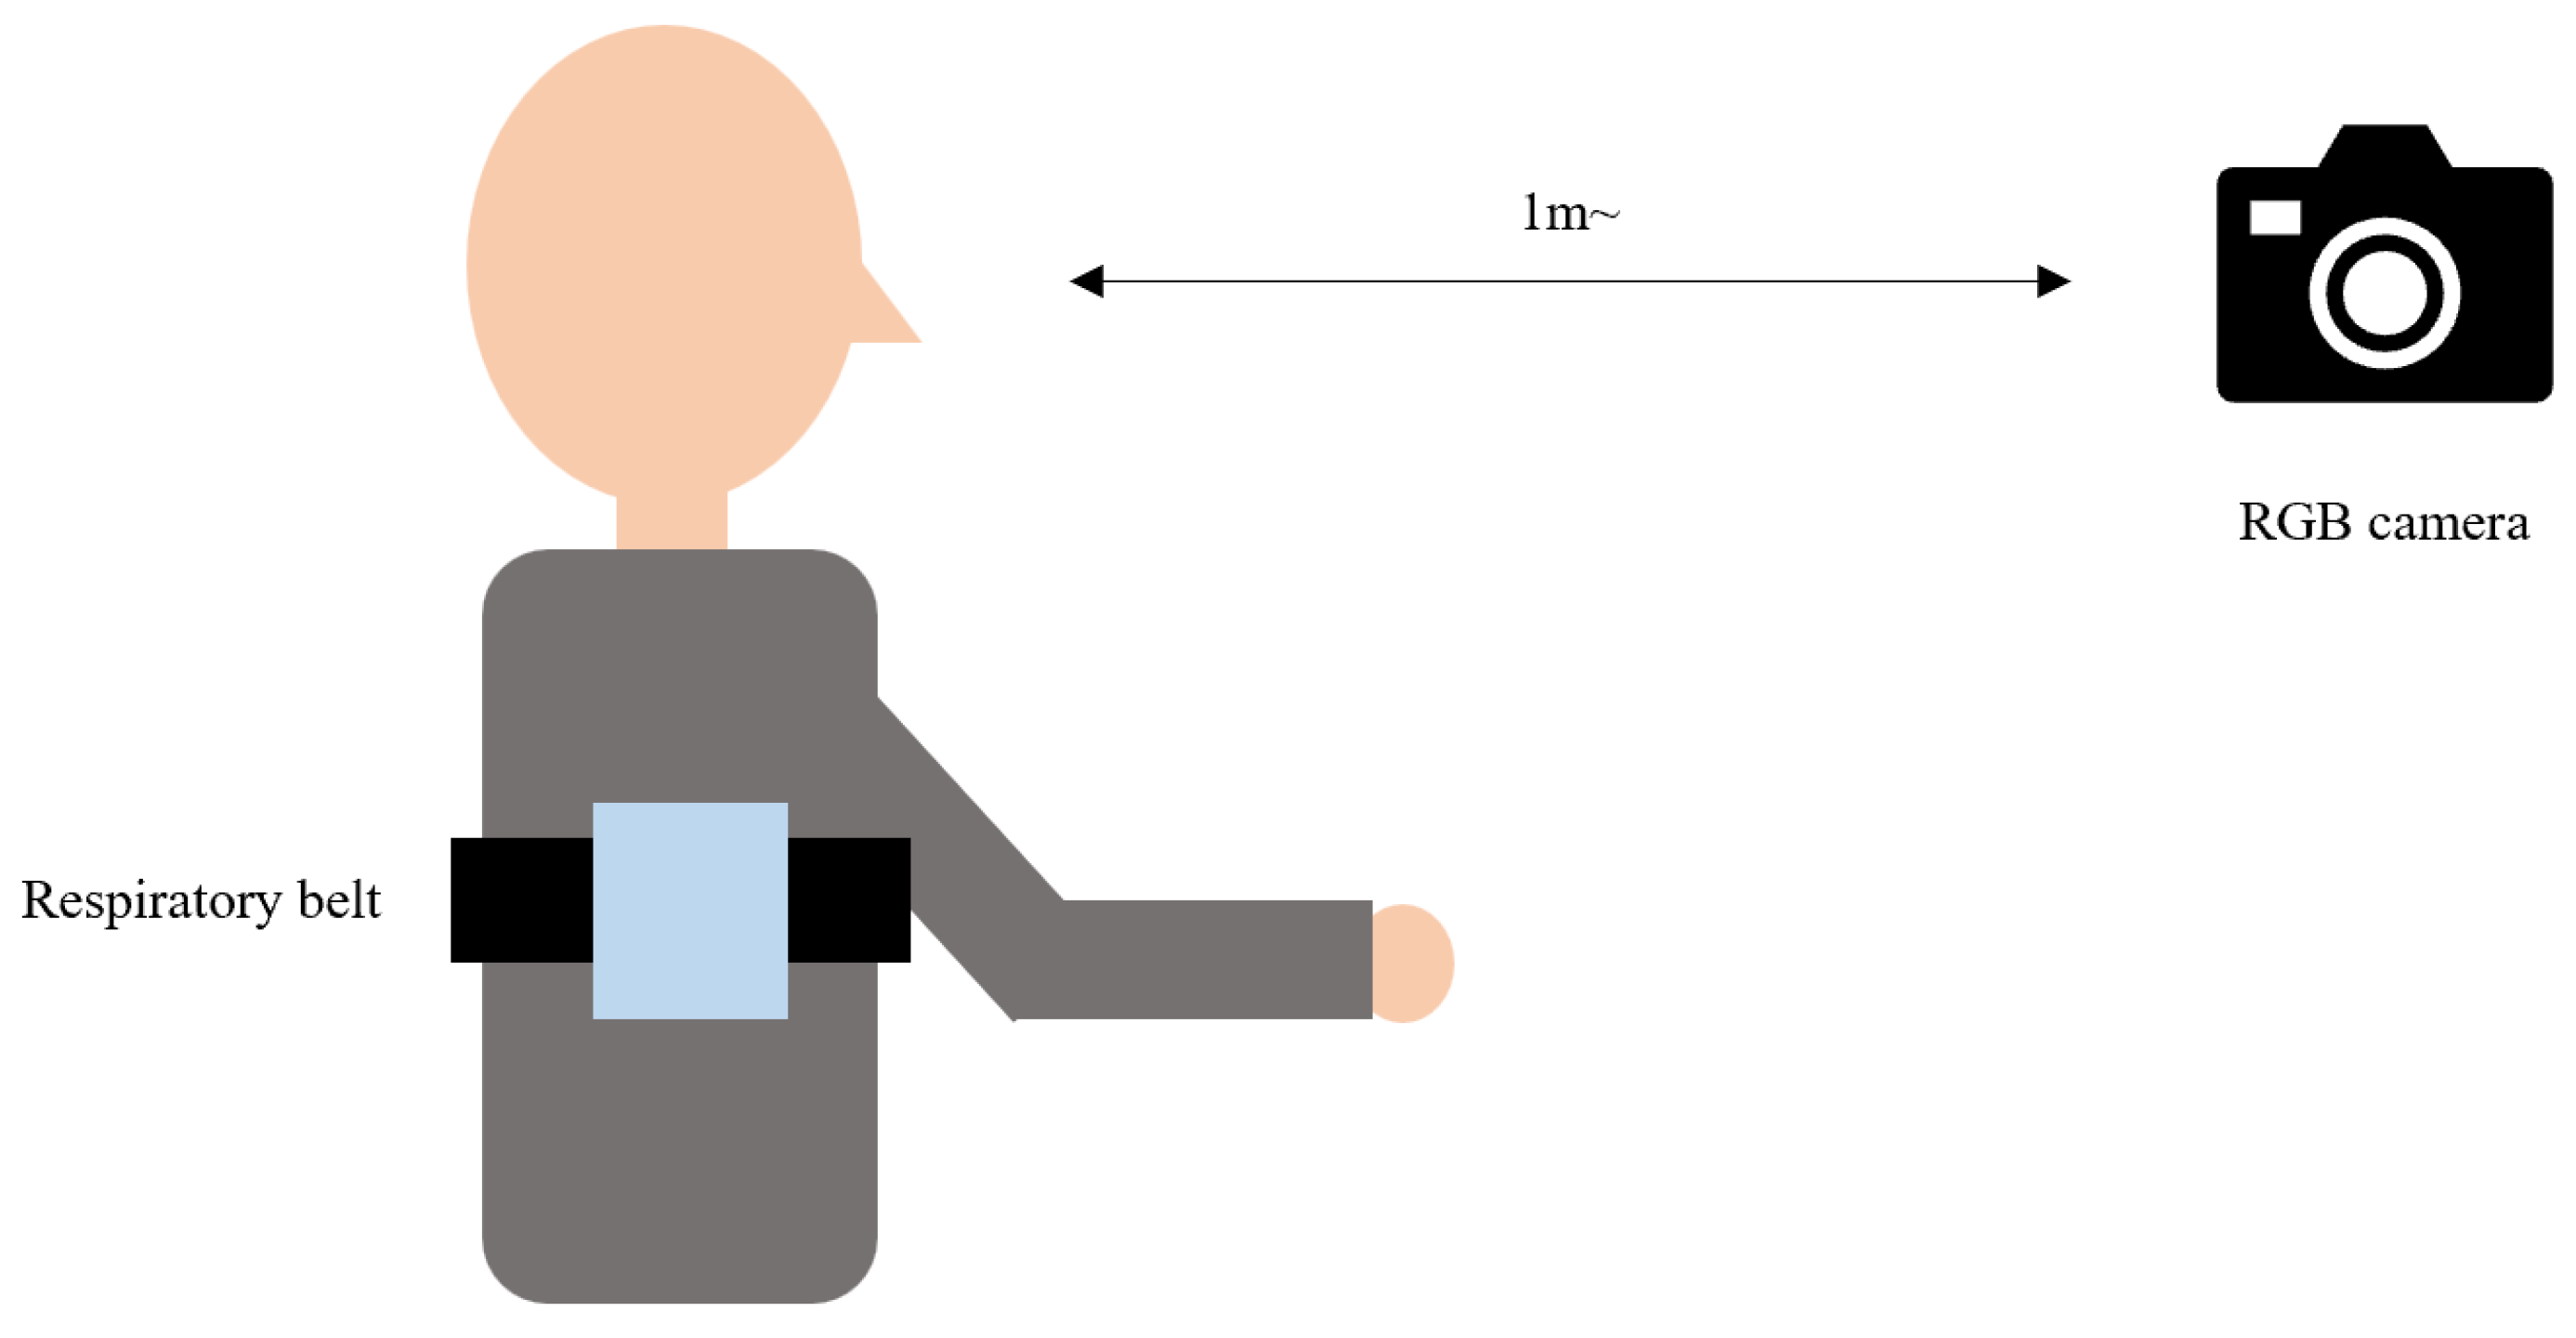
2.4. Experimental Setup

To account for noise related to movement during respiratory measurements, experiments were conducted during the following two scenarios: Experiment 1, where participants maintained a still position and focused on the front, and Experiment 2, where facial movements were allowed. The proposed method was employed to measure the signal using an RGB camera, and a contact-type respiratory belt was worn concurrently to obtain the reference signal. An example of this setup is shown in Figure 6. After explaining the research, informed consent was obtained before acquiring the experimental data. A total of 20 participants (12 males and 8 females) were involved in the study, and data were extracted for 60 s. Facial video data were captured using a Logitech HD Webcam C920 with a resolution of 640 × 480 pixels and a frame rate of 30 fps. Predicted respiratory signals were extracted from the captured facial videos. As a reference signal for respiration, a Bernier respiration belt (GDX-RB) was used, providing a resolution of 0.01 N and sampling at a rate of 20 samples per second.

3. Results

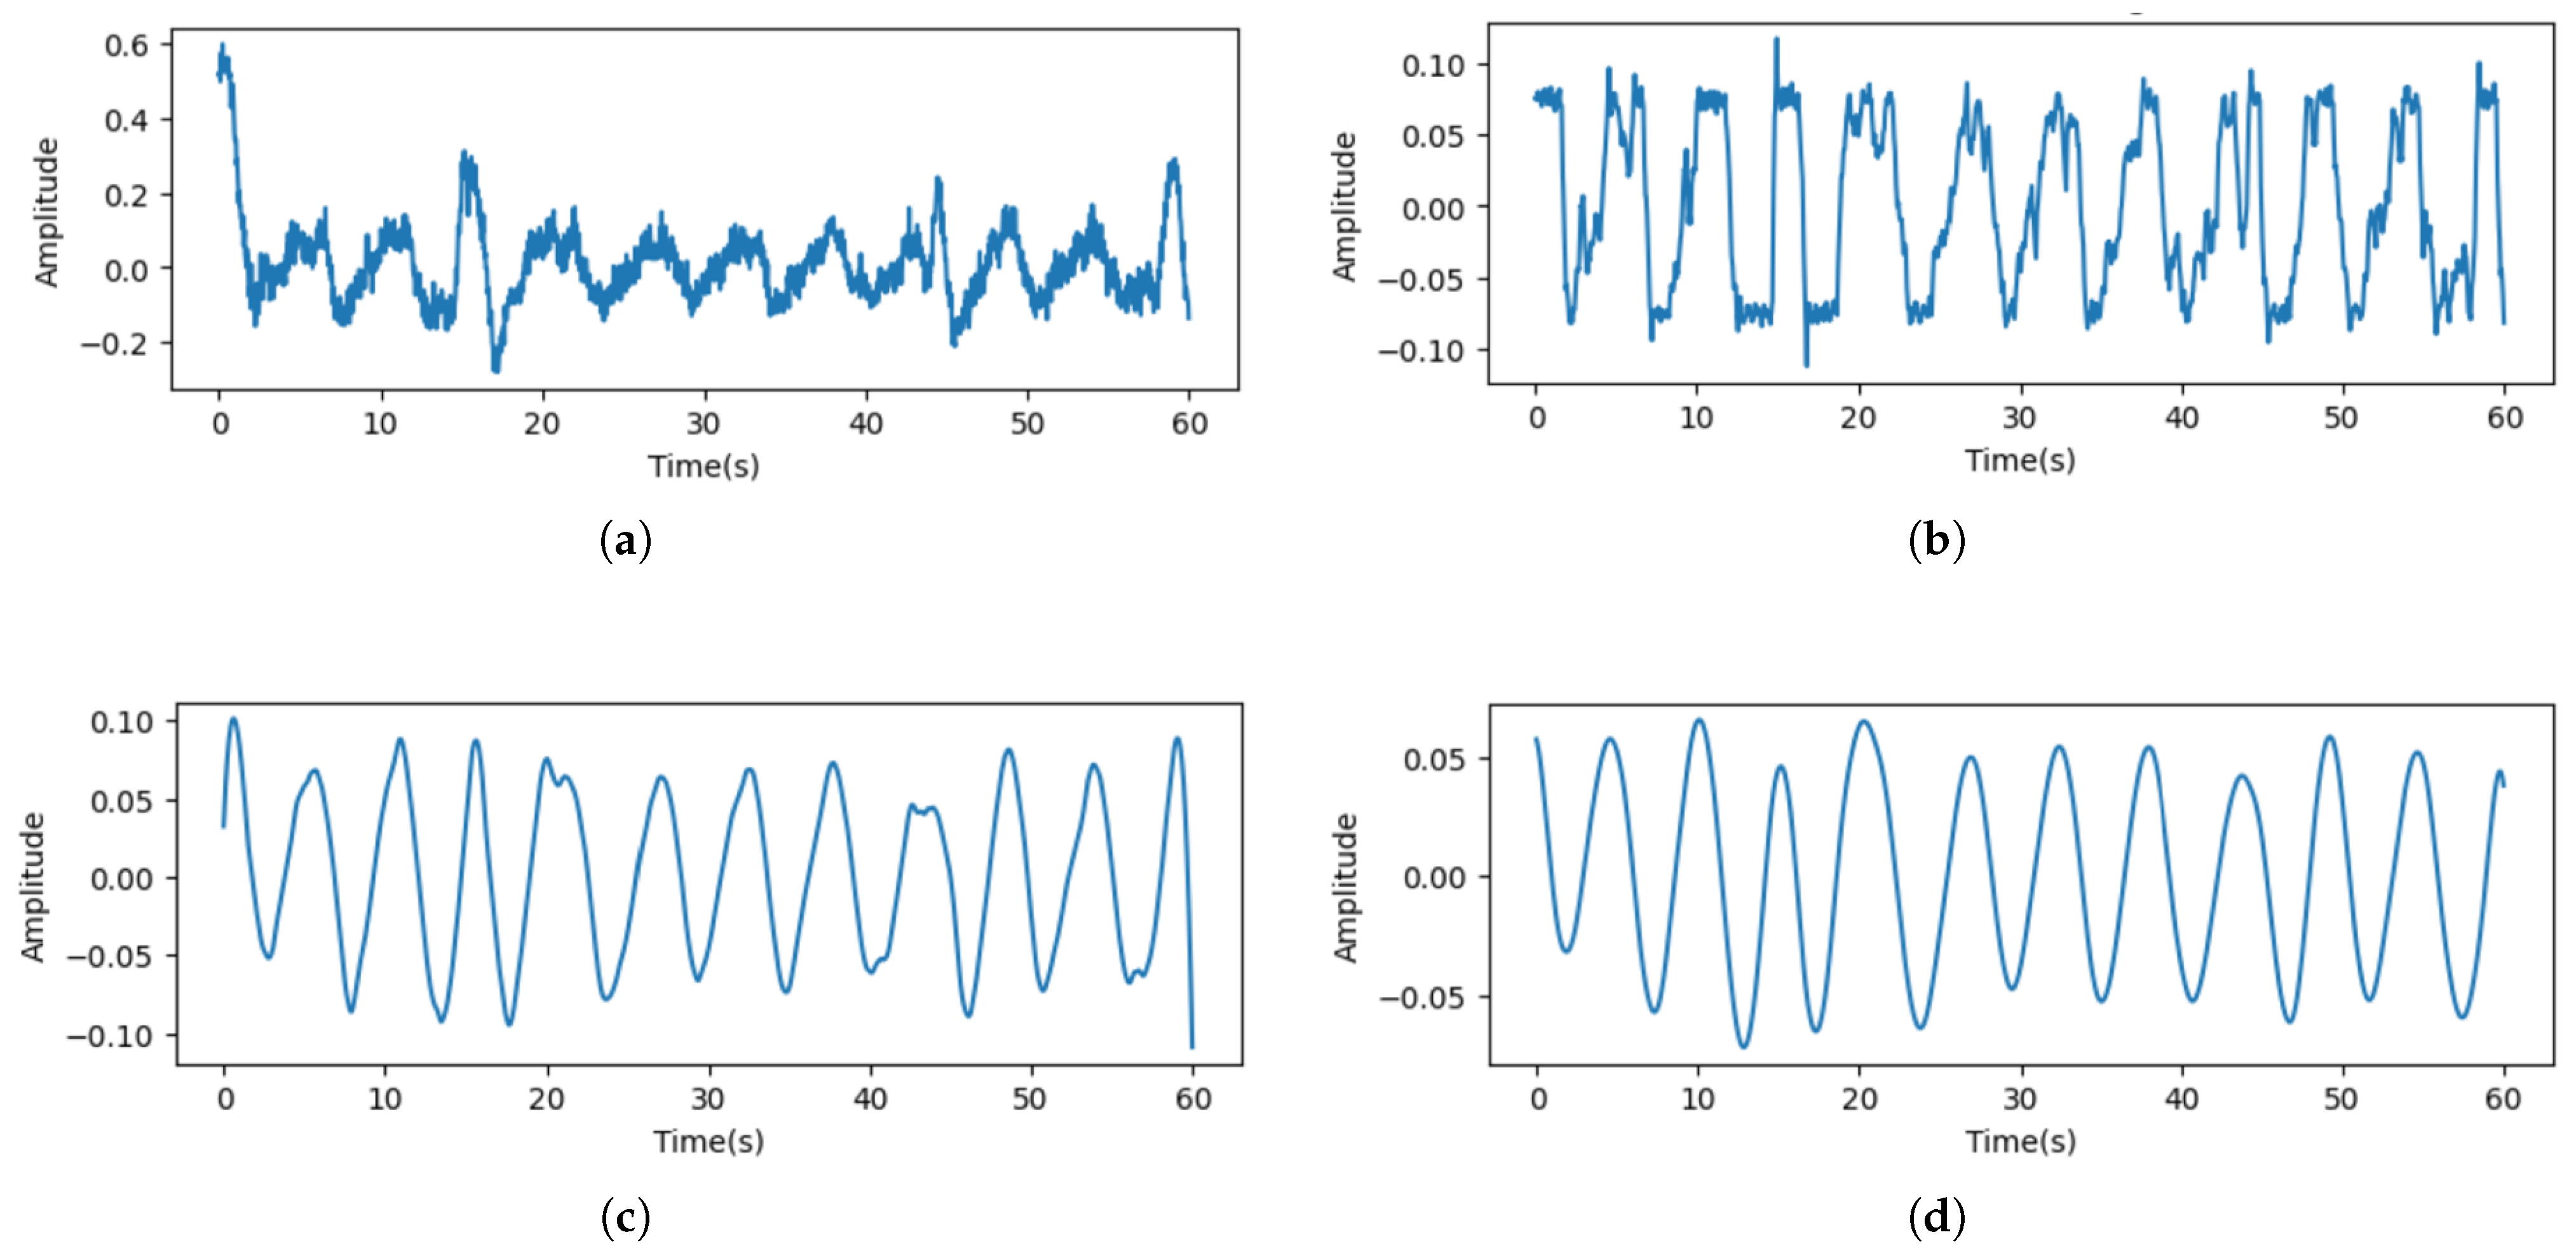
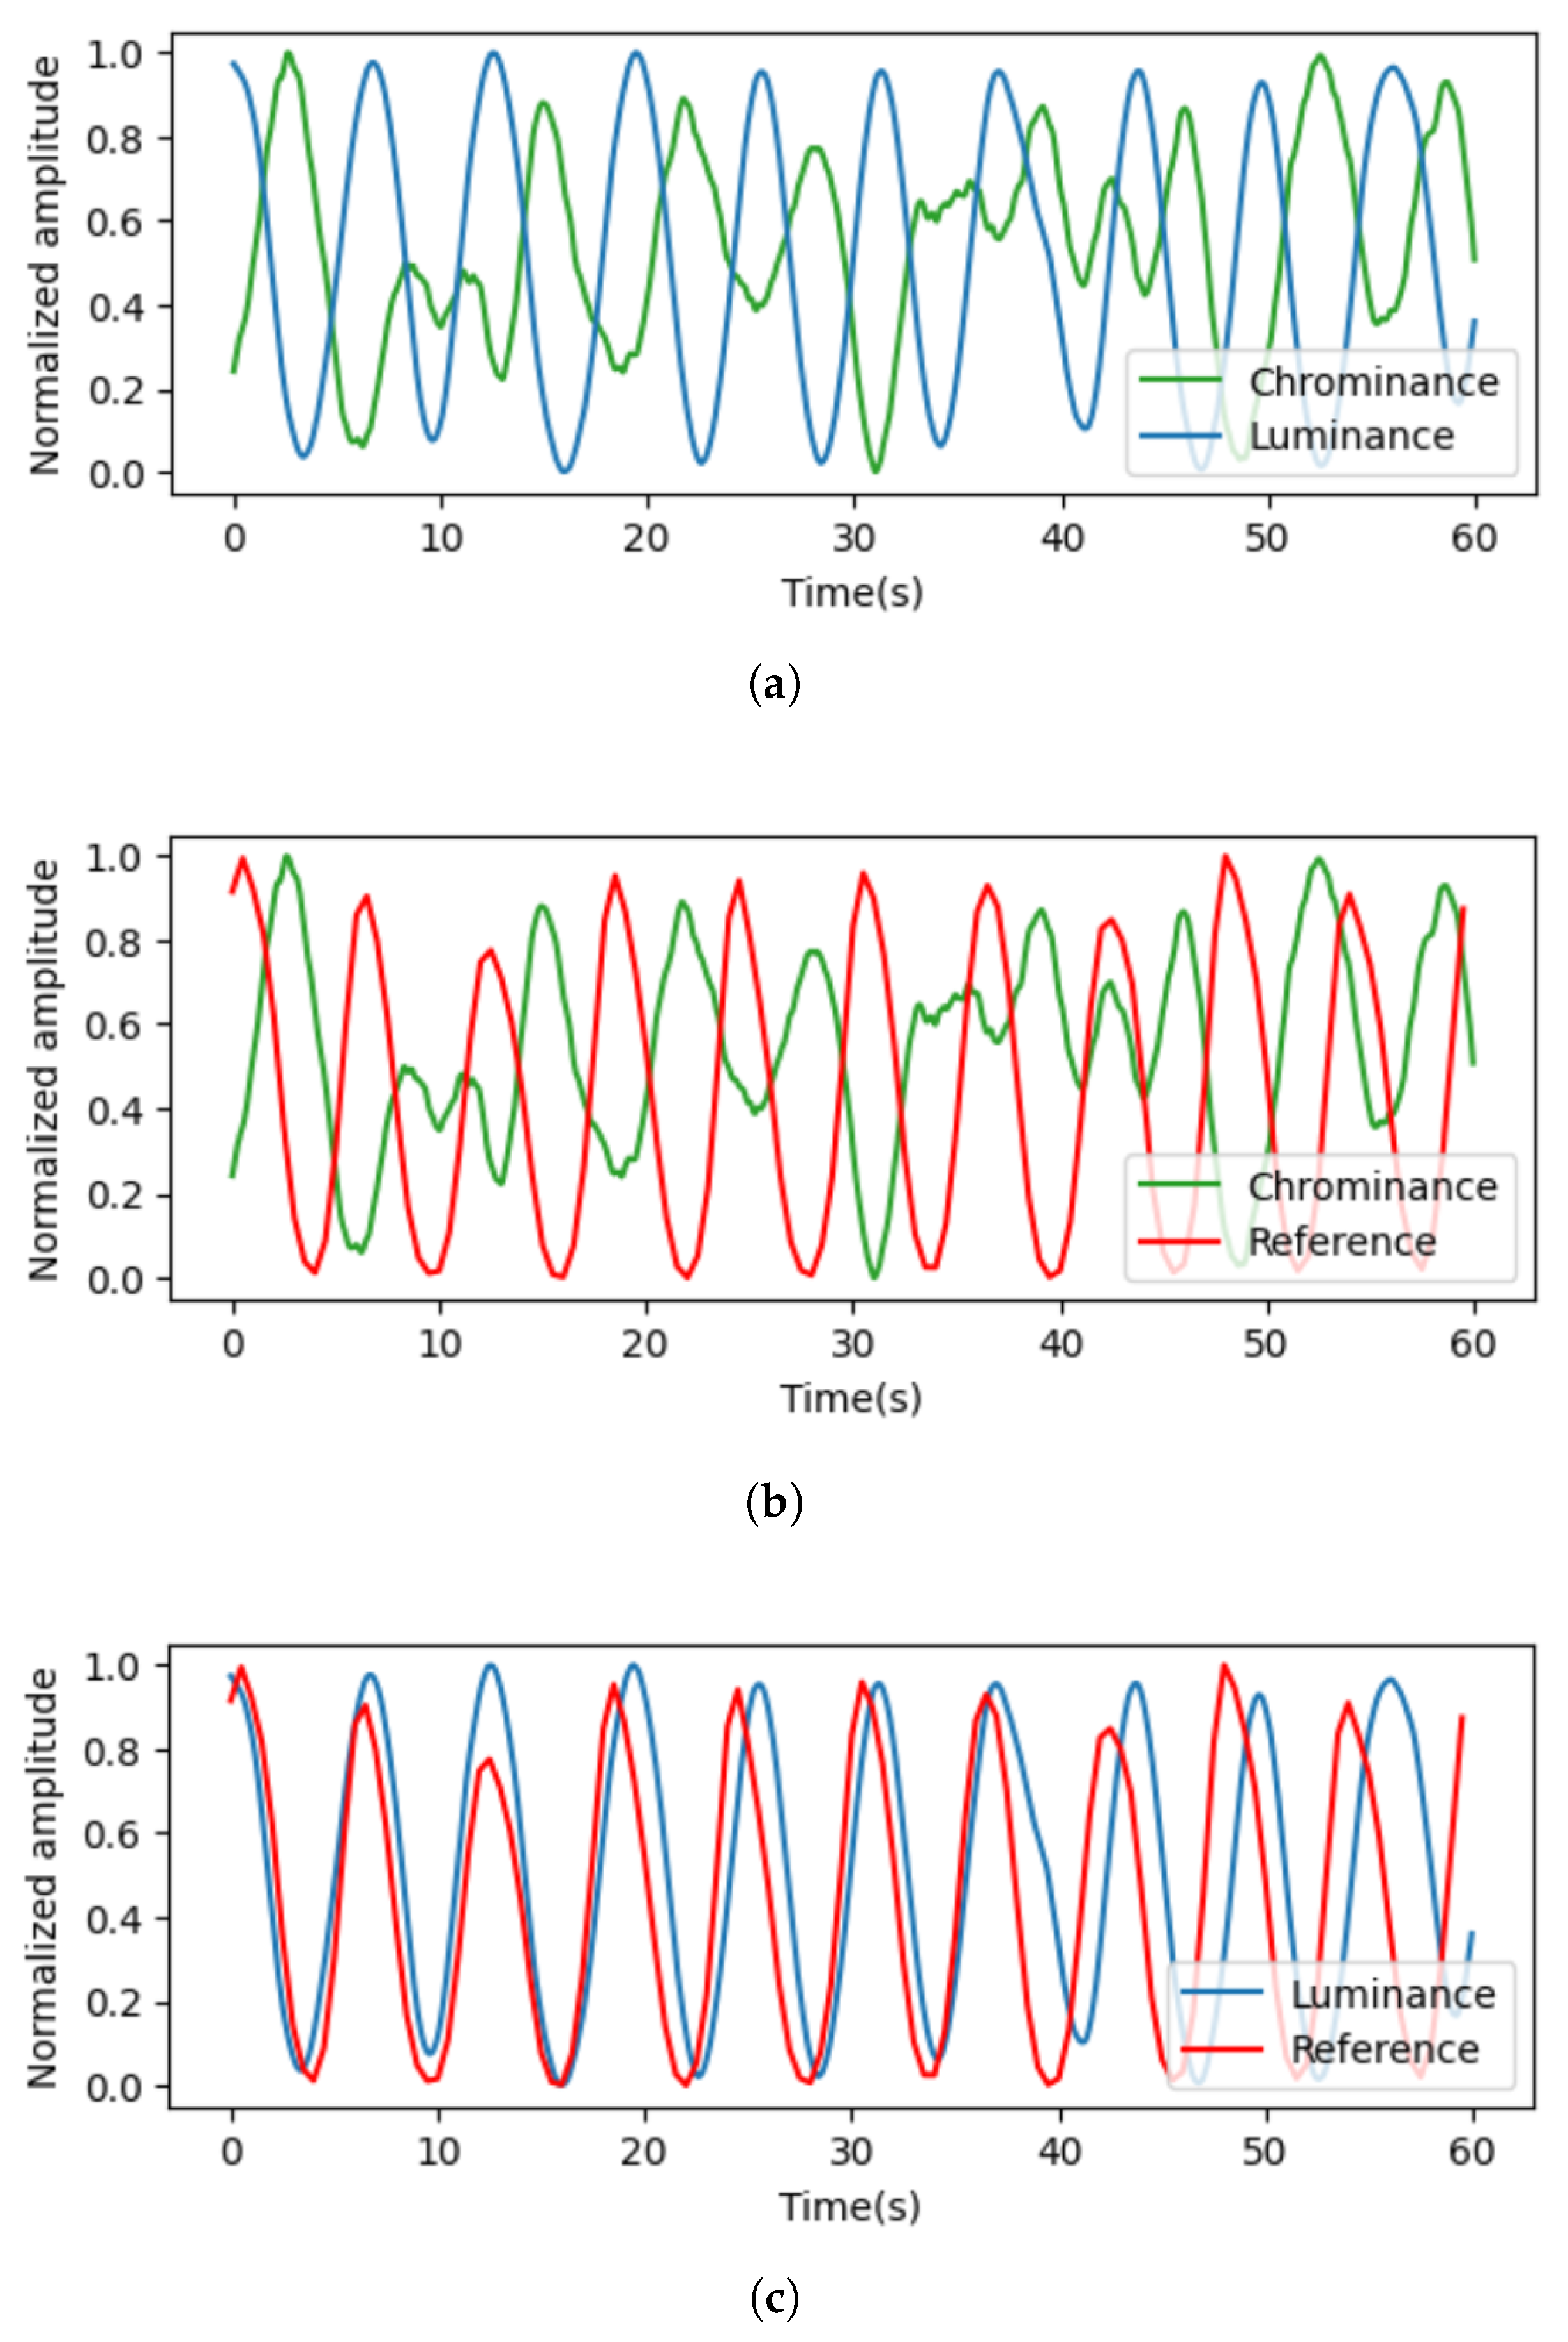
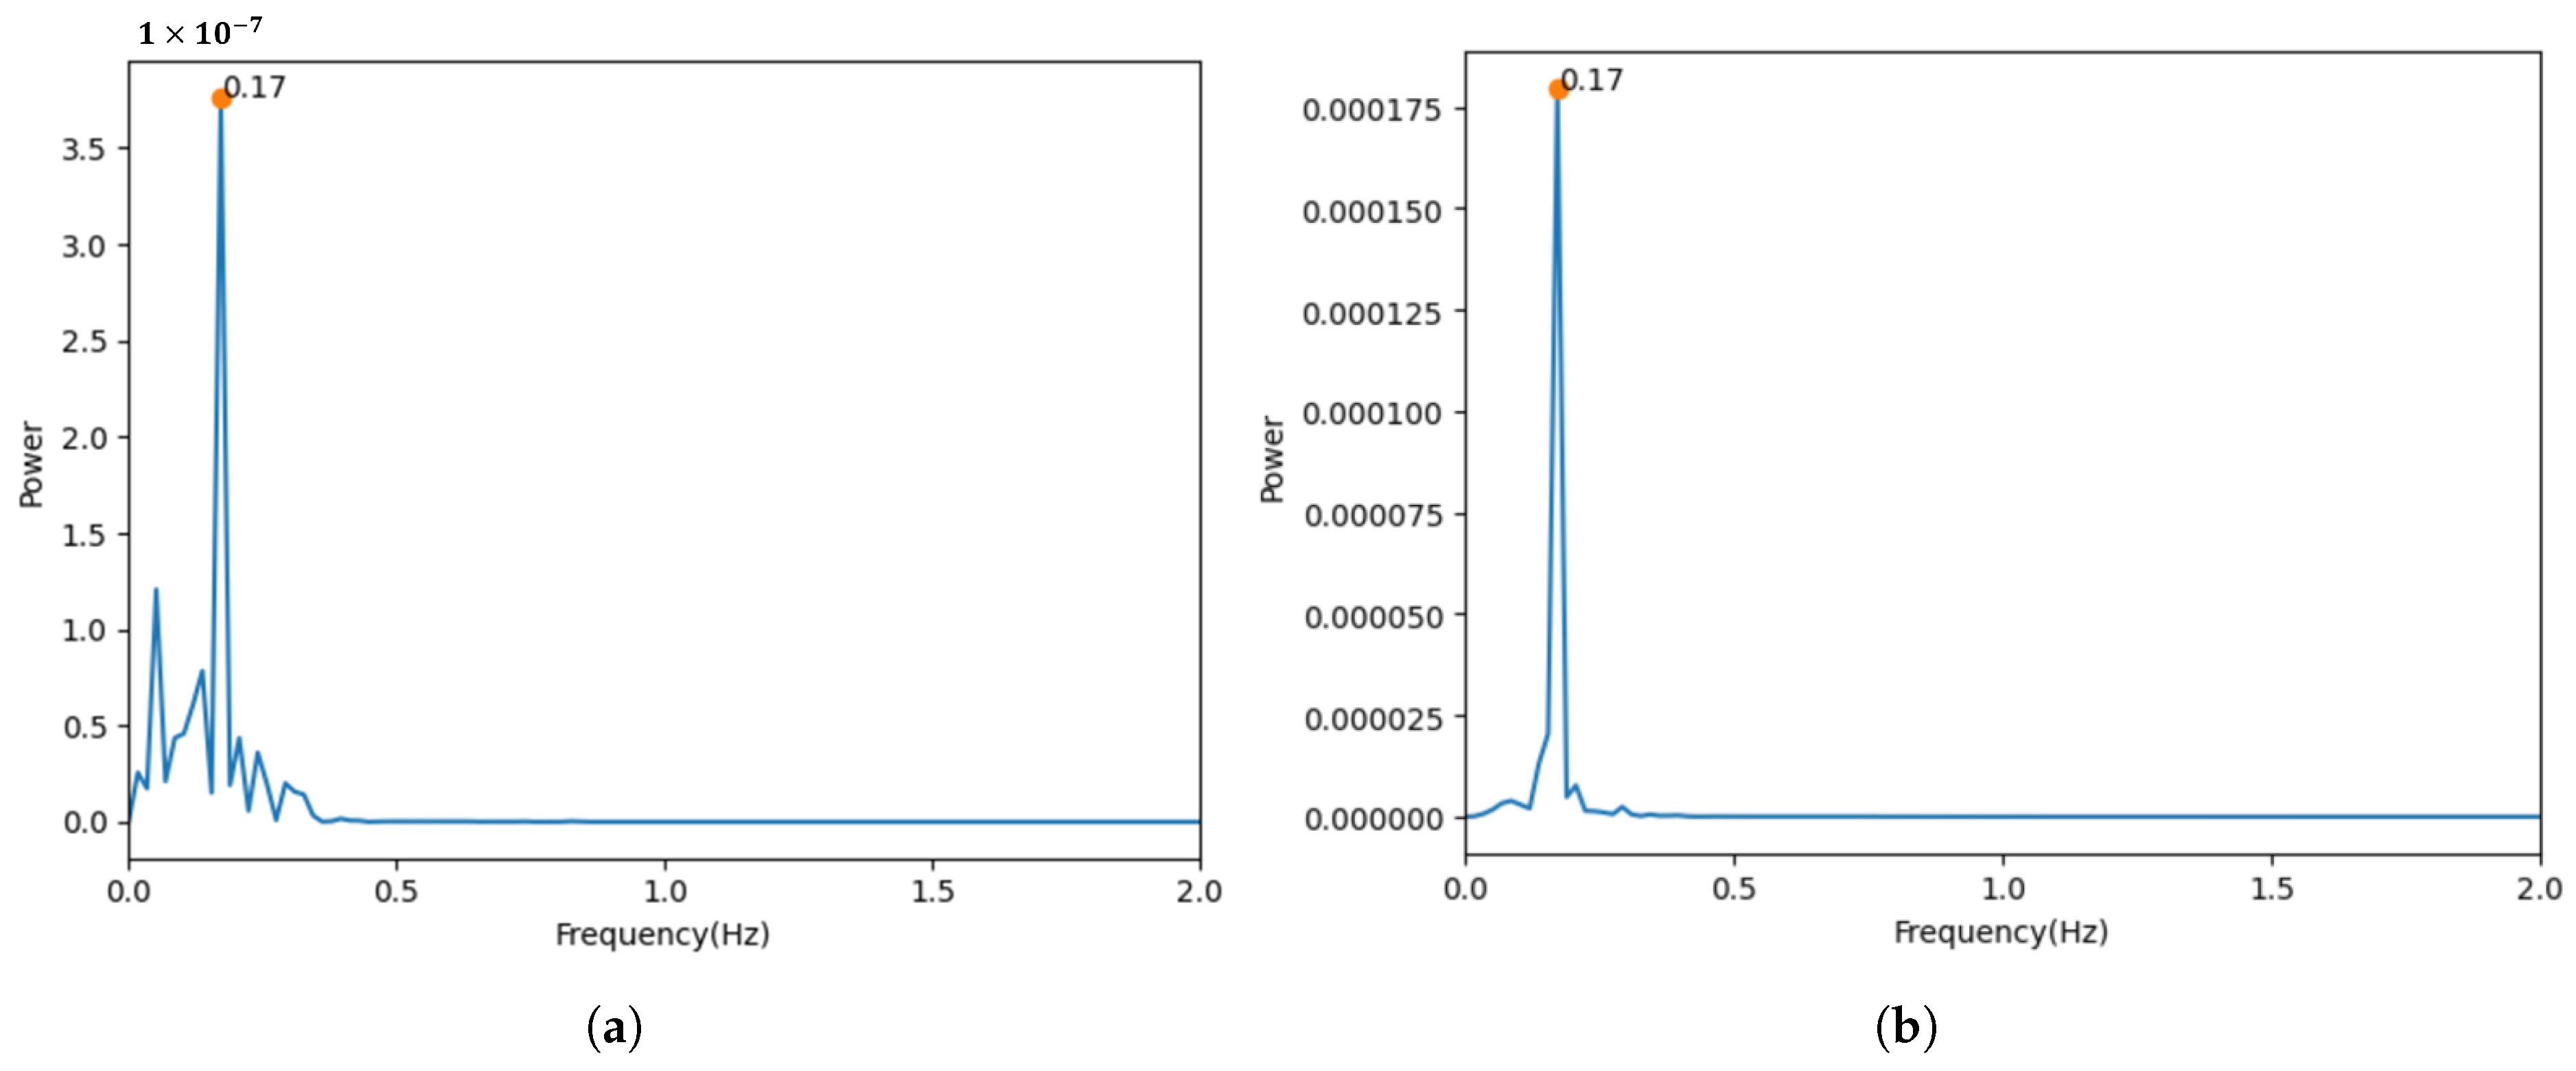
3.1. Comparison of Measurements in Luminance and Chrominance Components

In our approach, the PPG signals were extracted using the luminance component instead of the chrominance component, which is commonly employed in traditional heart rate measurement techniques. To demonstrate the potential benefits and improvements of the proposed method over conventional approaches by highlighting the effectiveness of using the luminance component for PPG signal extraction, the signal extracted from the luminance component and the signal extracted from the color component were compared.
Figure 7 visualizes the signals extracted from the color and luminance components. When compared to the reference signal, it can be observed that the signal extracted from the luminance component is more similar. Moreover, Figure 8 shows the results of the transformation of the time domain signals to the frequency domain. The results for both signals showed a maximum power frequency in the frequency interval between 0.08 and 0.66 Hz, considering the general respiratory rate per minute. However, the signal extracted from the color component had more noise unrelated to the respiratory signal.
For quantitative evaluation, we computed the SNR for the extracted PPG signals. A comparison of the SNR values provides insights into the overall signal quality and the reliability of the extracted respiratory parameters. The SNR values are shown in Table 2, and it can be observed that the signal extracted from the luminance component exhibited a higher SNR. This indicates that the information related to respiratory signals is more pronounced relative to the background noise.

3.2. Comparison of Respiration Signal Quality for Each Facial Region of Interest (ROI)

In light of previous research suggesting that capturing signals from regions of interest (ROIs) containing blood vessels can yield higher-quality measurements, we computed the respiratory quality index (RQI) for different ROIs to verify this opinion. Figure 9 shows the specific facial regions where the RQI was measured. Table 3 presents the results of the RQI values for the signals extracted from the four regions of interest, and no significant differences were found among the various regions. These findings support the assumption that respiratory measurements are primarily influenced by motion artifacts caused by respiration rather than by arterial blood flow.
Consequently, this result reinforces our approach of measuring a single signal from the entire facial region, rather than dividing the face into separate regions for signal acquisition. This methodology contributes to the efficiency and simplicity of respiratory monitoring techniques while maintaining the accuracy and reliability of the obtained measurements.

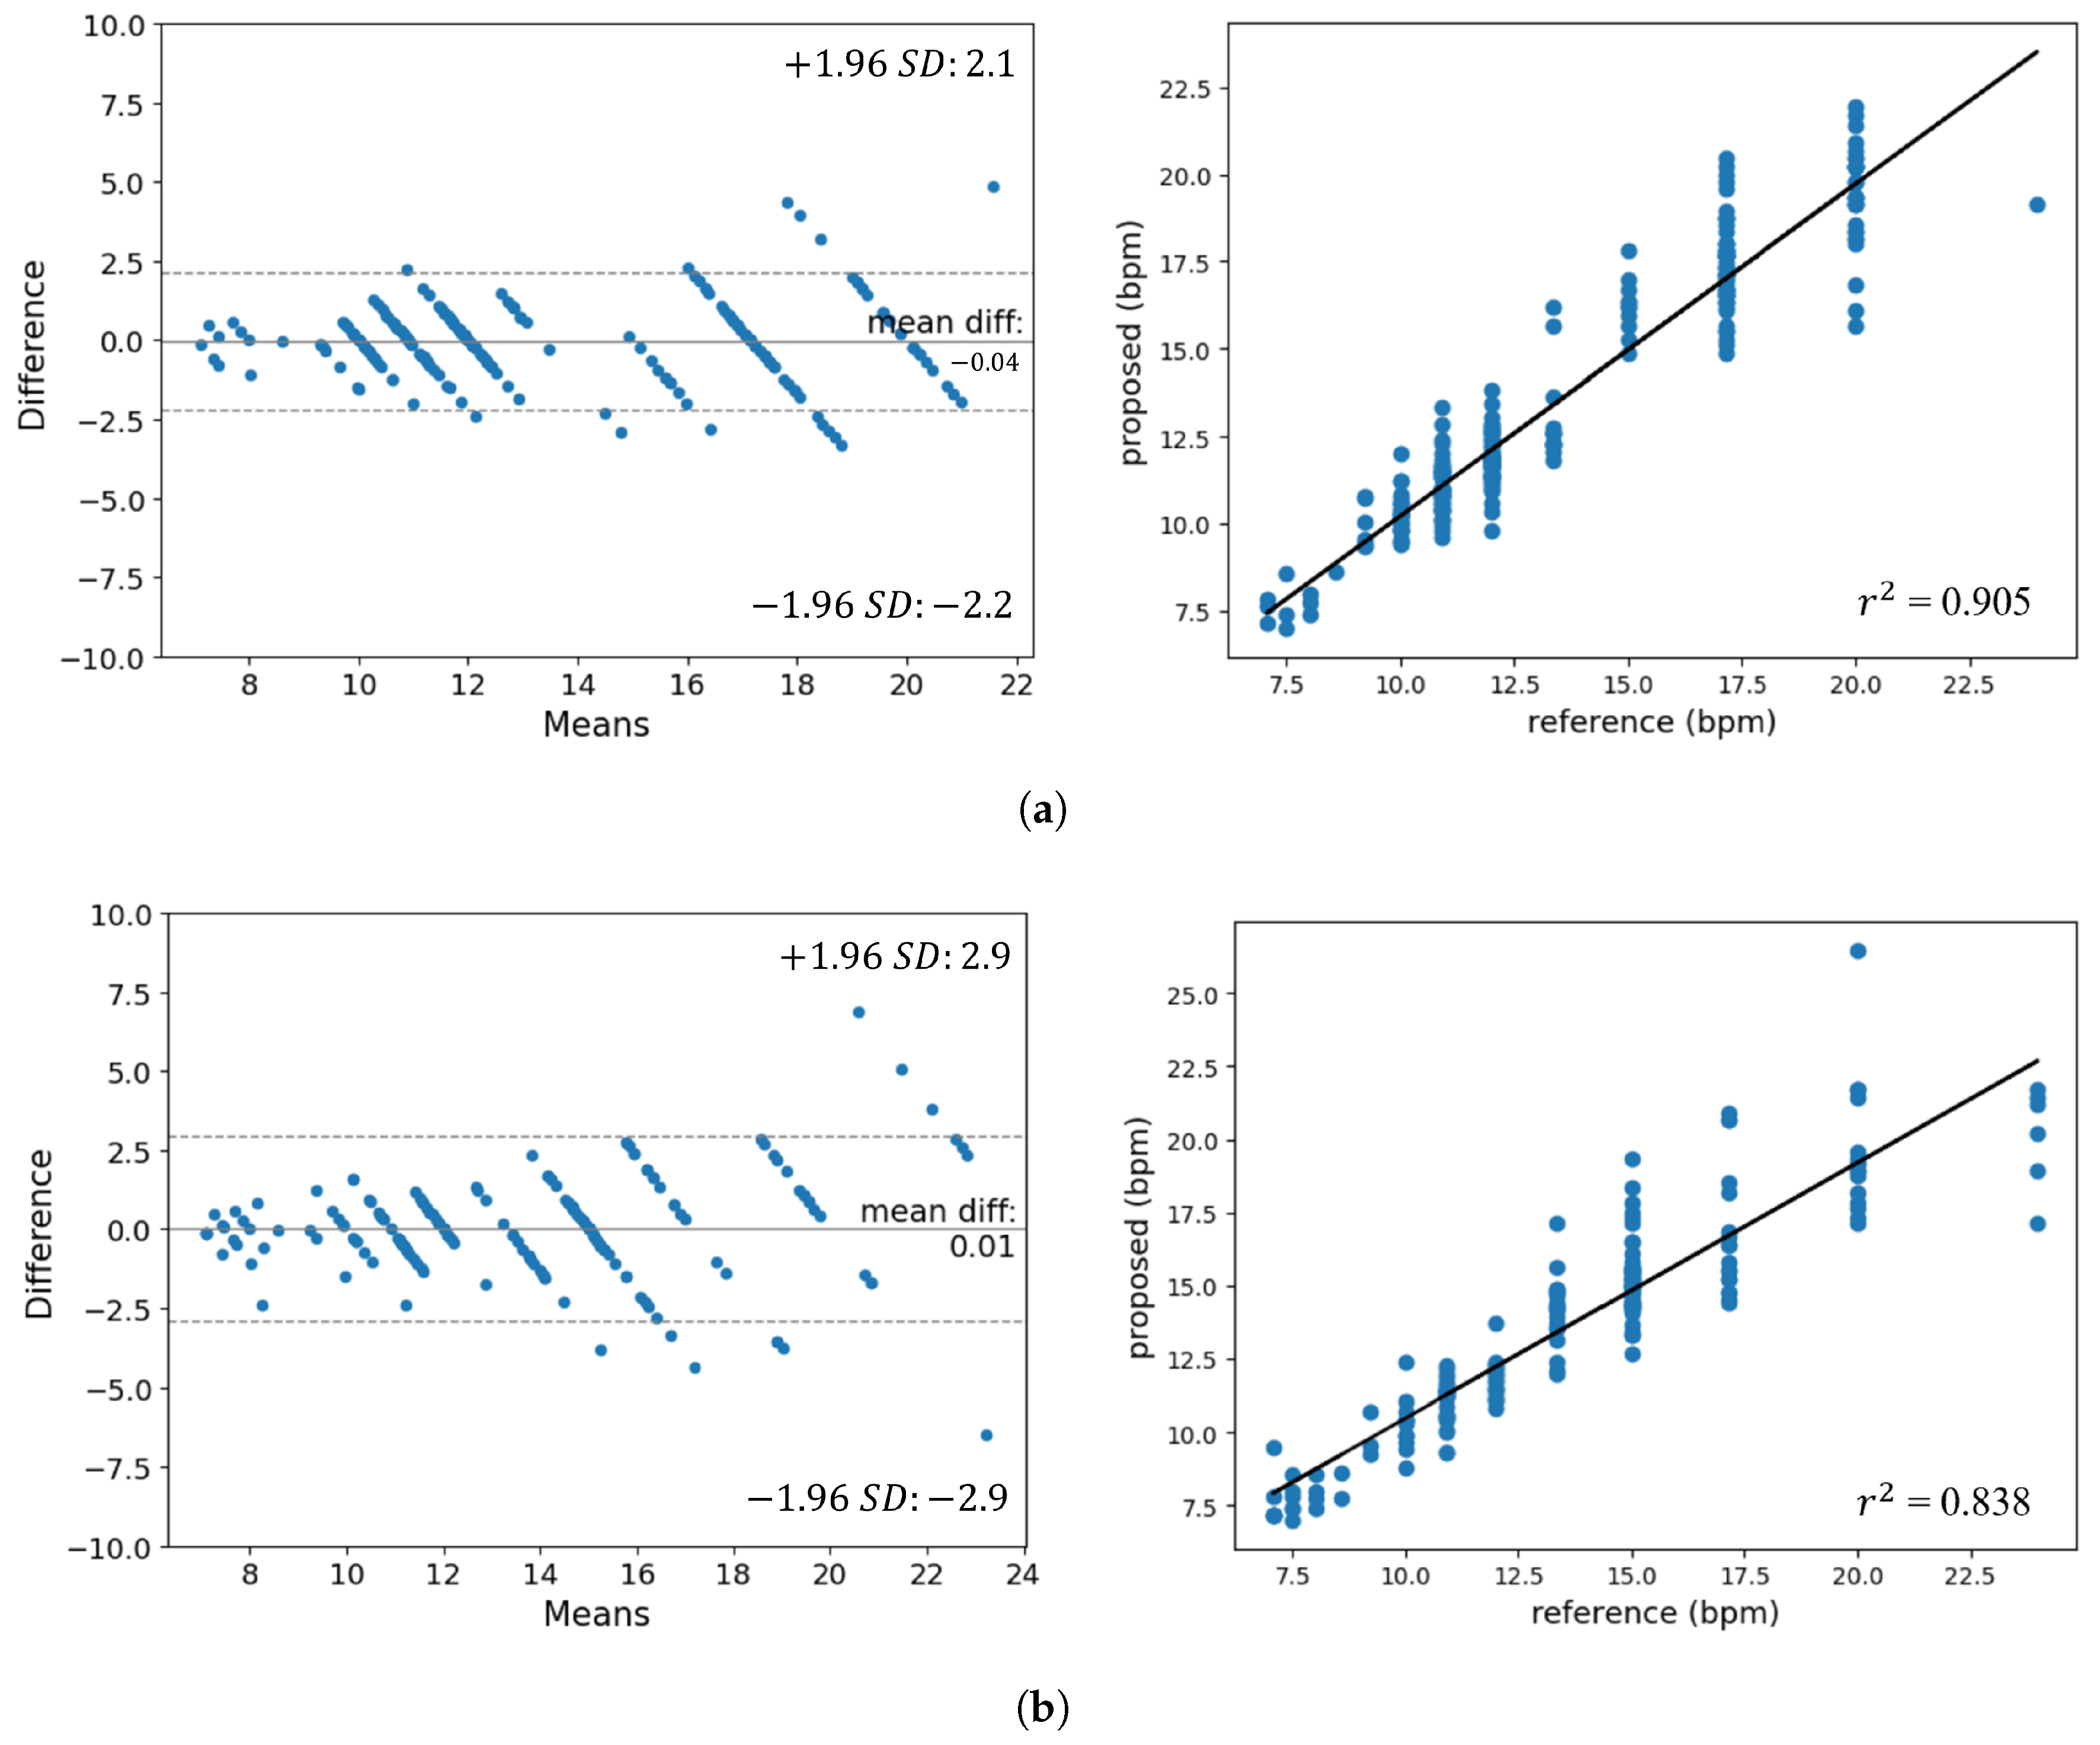
3.3. Performance Evaluation

In order to assess the efficacy of our approach, we compared predicted signals derived from the video images with the reference signals acquired from contact sensors. Peak-to-peak intervals (PPIs) of the predicted signals were used to calculate the respiratory rate per minute (RR), which is represented by Equation (7) below:
R R ( bpm ) = 1 peak ( i + 1 ) peak ( i ) × 60 .
By comparing the calculated bpm values of the two signals, we obtained various performance measures, such as the Pearson correlation coefficient, the coefficient of determination (R2), and the mean absolute error (MAE). In addition, a Bland–Altman plot analysis was performed to show the average and difference when comparing the actual signal to the predicted signal [23]. This allowed us to identify systematic differences between measurements, such as fixed biases or potential outliers.
The plot shows the mean of difference (MOD) representing the estimated bias and the standard deviation (SD) of the difference, measuring the random variation around this mean. It is common to calculate the 95% limit of agreement (LoA) for each comparison, which is the typical discrepancy ±1.96 multiplied by the variability of the differences. This represents the extent to which measurements by the two methods are likely to differ for most individuals. These metrics provide a comprehensive understanding of the effectiveness and impact of our approach for respiration signal estimation compared to conventional contact sensor approaches.
In Table 4, the performance results of our approach for each experiment are summarized, while Figure 10 displays the Bland–Altman plots and the results of the regression analysis. The Pearson correlation comparing the predicted signal to the actual signal for Experiment 1 was 0.953, and, for Experiment 2, it was 0.916, indicating a high level of similarity. Evaluating the MAE, MOD, and LoA of the bpm derived from the predicted signal revealed that our approach performed satisfactorily.
Observing the Bland–Altman plot, the majority of points are clustered within the LoA range of ± 2.1 to ± 2.9 . The absence of distribution bias as the bpm changes allows us to infer the performance consistency for respiration rates. Furthermore, the regression analysis chart shows that the gradient of the regression line is nearly 1 and that the obtained R 2 values are 0.905 and 0.838. In addition, it can be seen that the performance of Experiment 2, which is significantly affected by facial movement noise, is lower than that of Experiment 1.

4. Conclusions

In this research, we introduced an approach for estimating respiratory rates by capturing the subtle changes in skin brightness due to facial movements during respiration, rather than measuring the skin color changes caused by blood flow. Instead of designating a specific region of interest (ROI), we used the entire facial region after skin segmentation to extract rPPG signals using the Y component of the YCbCr channel. Noise was removed to estimate respiratory signals. The similarity between the contact-based sensor and the camera-based method results was confirmed through the mean square error (MSE) and correlation coefficients.
However, while the brightness change-based method using RGB cameras is generally simple, it heavily relies on accurately defining the skin region, and it has limitations in terms of not fully considering the brightness changes due to other movements or background noise. Moreover, since the experiments were conducted only in indoor environments, further research is needed in different environments, such as outdoors or inside vehicles, to develop robust respiratory measurement methods that are flexible against various types of noise.
The plans for future research based on the current study are as follows:
  • Investigate and apply techniques to improve the reliability of the respiratory measurement approach against other movements, background noise, and various lighting conditions.
  • Broaden the scope of respiratory rate estimation research to include diverse settings, such as outdoors and inside vehicles, to better evaluate the approach’s effectiveness and generalizability.
  • Conduct experiments that take into account factors such as facial expressions and talking.
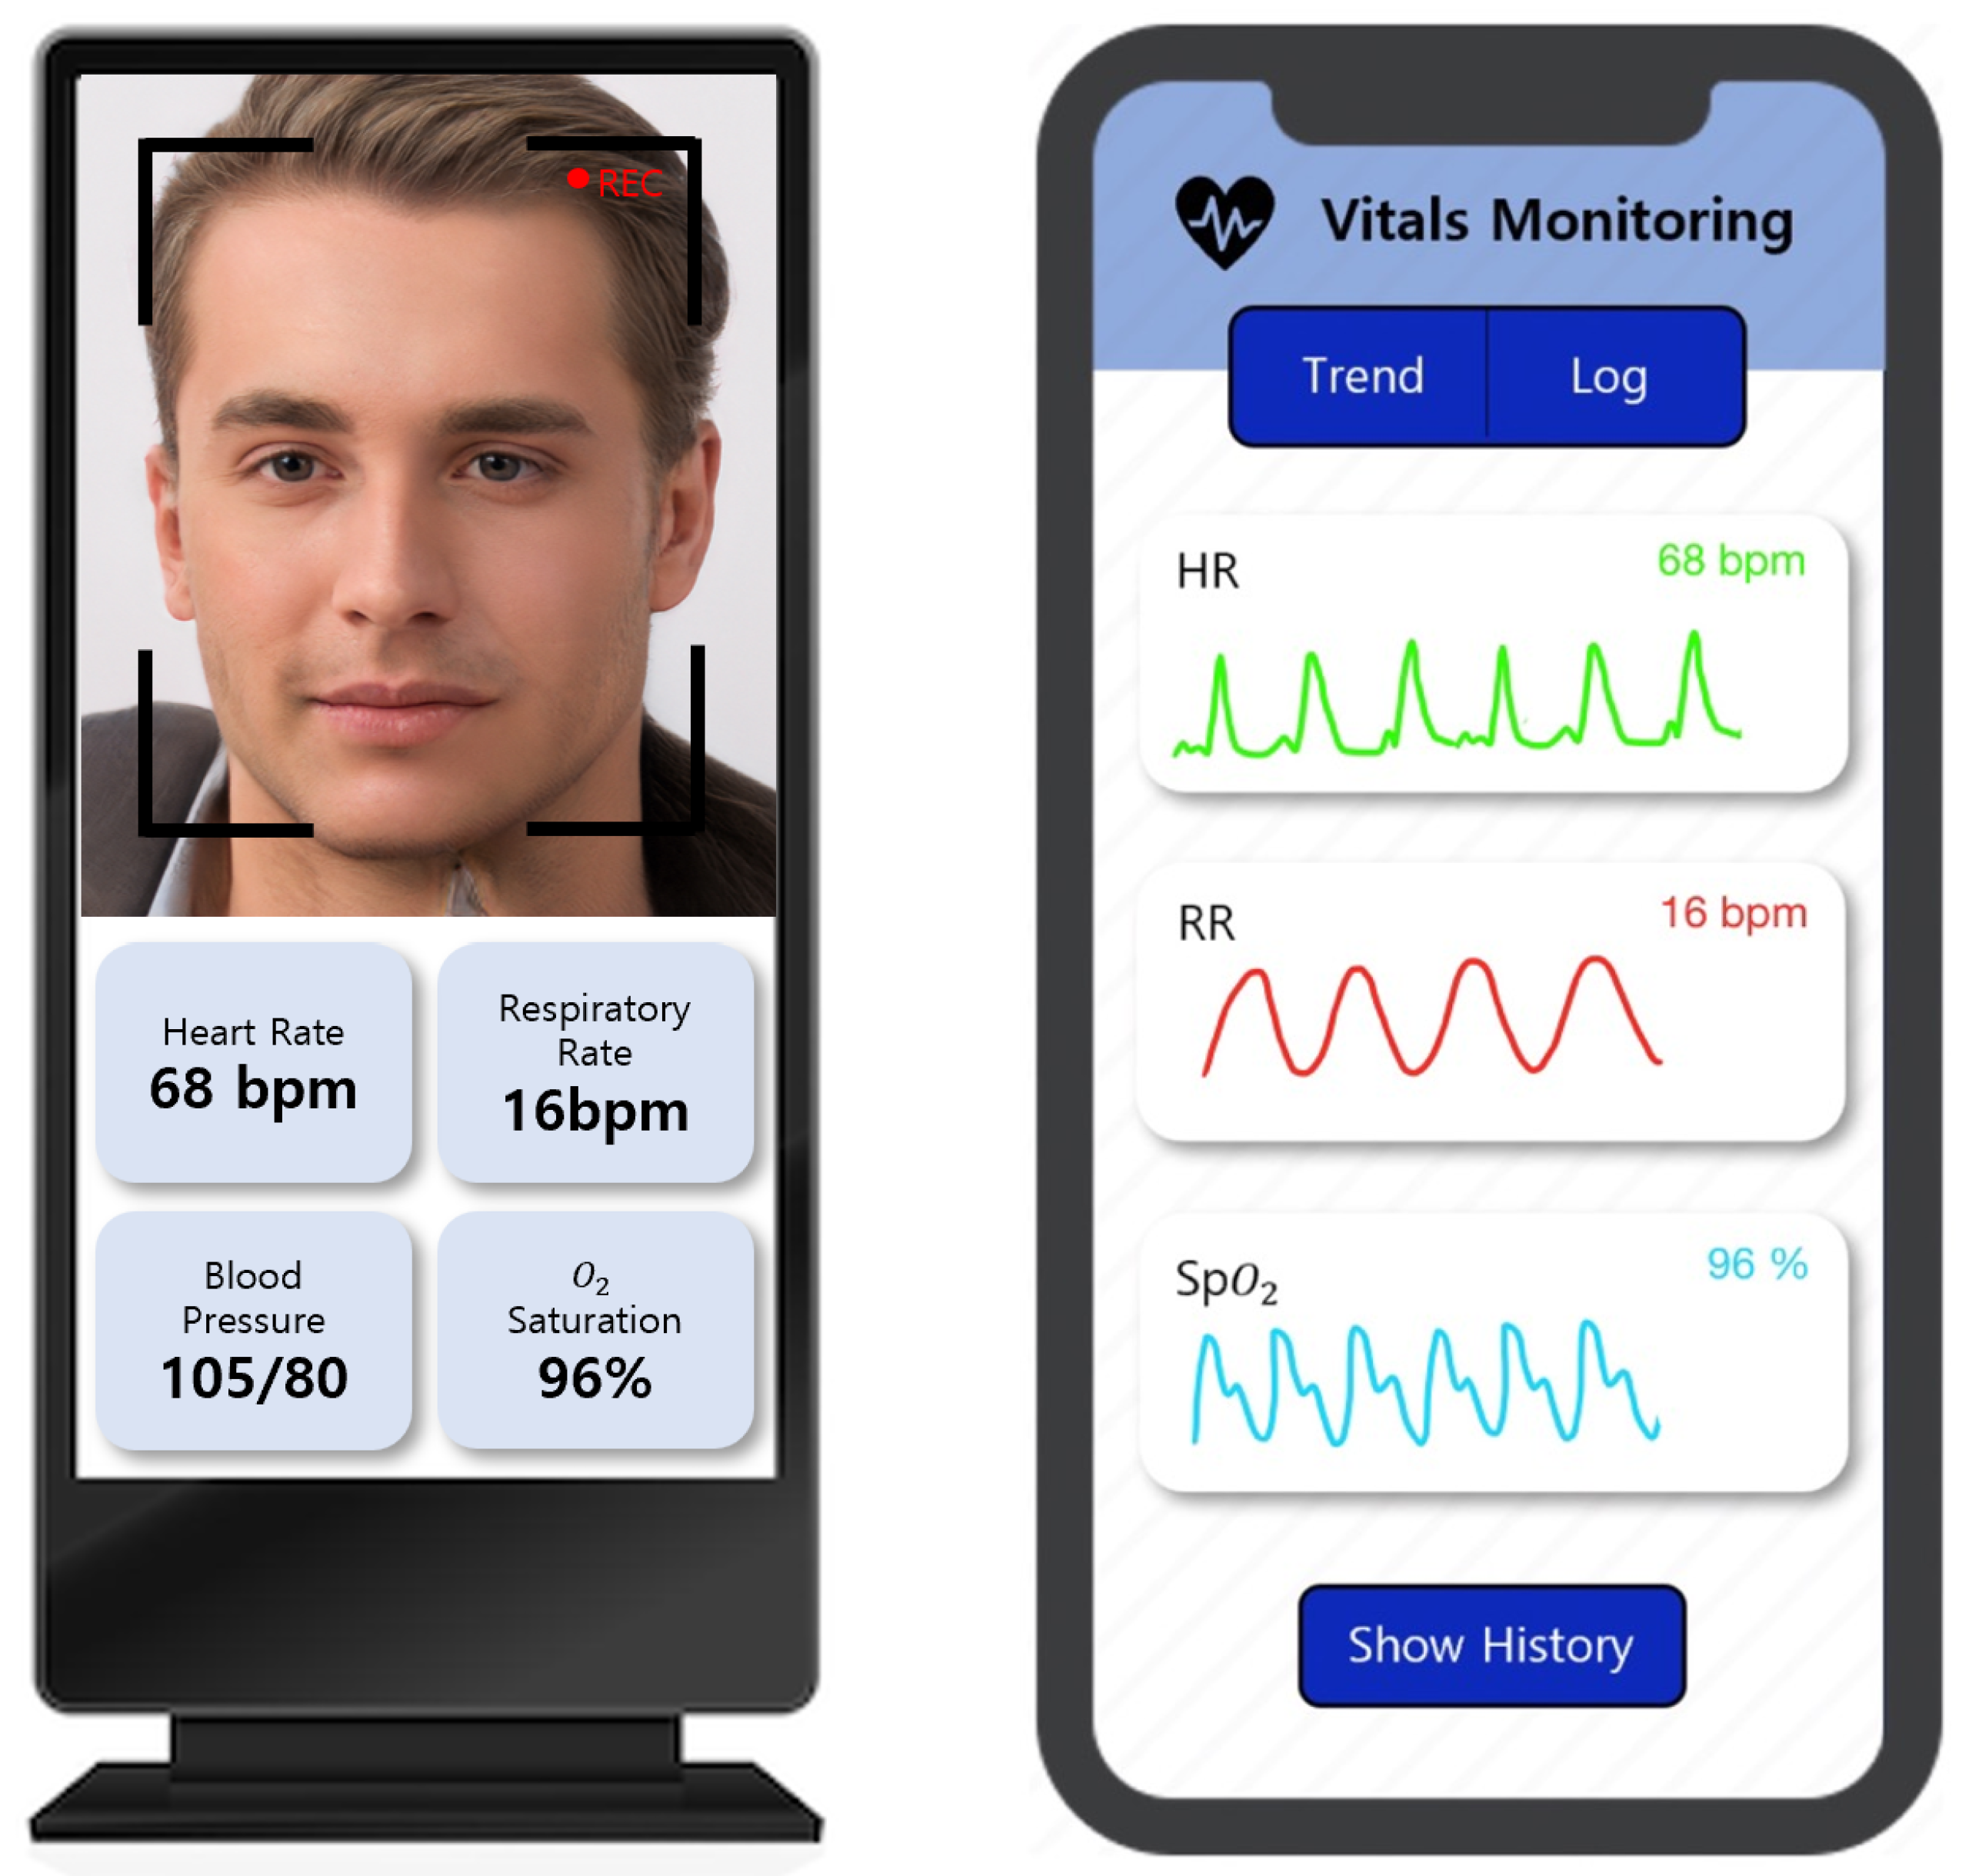
  • Explore the potential of combining the proposed respiratory rate estimation method with other contact or non-contact physiological monitoring systems, such as heart rate or blood oxygen saturation (SpO2), to develop comprehensive remote health monitoring solutions.

Author Contributions

Conceptualization, H.S., S.K. and E.C.L.; methodology, H.S., S.K. and E.C.L.; software, H.S.; validation, H.S.; formal analysis, H.S. and S.K.; investigation, H.S.; resources, H.S.; data curation, H.S.; writing—original draft preparation, S.K.; writing—review and editing, S.K. and E.C.L.; visualization, S.K.; supervision, E.C.L.; project administration, E.C.L.; funding acquisition, E.C.L. All authors have read and agreed to the published version of the manuscript.

Funding

This work was supported by the NRF (National Research Foundation) of Korea, funded by the Korean government (Ministry of Science and ICT) (Grant No. RS-2024-00340935).

Institutional Review Board Statement

The study was conducted in accordance with the Declaration of Helsinki and approved by the Institutional Review Board of Sangmyung University Institutional Bioethics Review Board: SMUIBR (protocol code S-2024-013 and 4 July 2024 of approval).

Informed Consent Statement

Informed consent was obtained from all subjects involved in the study.

Data Availability Statement

Due to the nature of this research, the participants of this study did not agree for their data to be shared publicly; therefore, supporting data are not available.

Conflicts of Interest

The authors declare no conflicts of interest.

References

  1. Al-Naji, A.; Gibson, K.; Lee, S.H.; Chahl, J. Monitoring of cardiorespiratory signal: Principles of remote measurements and review of methods. IEEE Access 2017, 5, 15776–15790. [Google Scholar] [CrossRef]
  2. Coffey, J.D.; Christopherson, L.A.; Glasgow, A.E.; Pearson, K.K.; Brown, J.K.; Gathje, S.R.; Sangaralingham, L.R.; Carmona Porquera, E.M.; Virk, A.; Orenstein, R.; et al. Implementation of a multisite, interdisciplinary remote patient monitoring program for ambulatory management of patients with COVID-19. NPJ Digit. Med. 2021, 4, 123. [Google Scholar] [CrossRef] [PubMed]
  3. Marrugo, P.P.; Franco, E.M.; Ribón, J.C.R. Systematic review of platforms used for remote monitoring of vital signs in patients with hypertension, asthma and/or chronic obstructive pulmonary disease. IEEE Access 2019, 7, 158710–158719. [Google Scholar] [CrossRef]
  4. Takahashi, Y.; Gu, Y.; Nakada, T.; Abe, R.; Nakaguchi, T. Estimation of respiratory rate from thermography using respiratory likelihood index. Sensors 2021, 21, 4406. [Google Scholar] [CrossRef]
  5. Jakkaew, P.; Onoye, T. Non-contact respiration monitoring and body movements detection for sleep using thermal imaging. Sensors 2020, 20, 6307. [Google Scholar] [CrossRef]
  6. Romano, C.; Schena, E.; Silvestri, S.; Massaroni, C. Non-contact respiratory monitoring using an RGB camera for real-world applications. Sensors 2021, 21, 5126. [Google Scholar] [CrossRef]
  7. Guo, T.; Lin, Q.; Allebach, J. Remote estimation of respiration rate by optical flow using convolutional neural networks. Electron. Imaging 2021, 8, 1–267. [Google Scholar] [CrossRef]
  8. Van Gastel, M.; Stuijk, S.; De Haan, G. Robust respiration detection from remote photoplethysmography. Biomed. Opt. Express 2016, 7, 4941–4957. [Google Scholar] [CrossRef]
  9. Park, J.; Hong, K. Robust pulse rate measurements from facial videos in diverse environments. Sensors 2022, 22, 9373. [Google Scholar] [CrossRef]
  10. Chen, W.; Yi, Z.; Lim, L.J.R.; Lim, R.Q.R.; Zhang, A.; Qian, Z.; Huang, J.; He, J.; Liu, B. Deep learning and remote photoplethysmography powered advancements in contactless physiological measurement. Front. Bioeng. Biotechnol. 2024, 12, 1420100. [Google Scholar] [CrossRef]
  11. Miao, Y.; Chen, Z.; Li, C.; Mandic, D.P. RespDiff: An End-to-End Multi-scale RNN Diffusion Model for Respiratory Waveform Estimation from PPG Signals. In Proceedings of the ICASSP 2025—2025 IEEE International Conference on Acoustics, Speech and Signal Processing (ICASSP), Hyderabad, India, 6–11 April 2025; pp. 1–5. [Google Scholar]
  12. Menniti, M.; Laganà, F.; Oliva, G.; Bianco, M.; Fiorillo, A.S.; Pullano, S.A. Development of Non-Invasive Ventilator for Homecare and Patient Monitoring System. Electronics 2024, 13, 790. [Google Scholar] [CrossRef]
  13. Suh, K.H.; Lee, E.C. Contactless physiological signals extraction based on skin color magnification. J. Electron. Imaging 2017, 26, 063003. [Google Scholar] [CrossRef]
  14. Lugaresi, C.; Tang, J.; Nash, H.; McClanahan, C.; Uboweja, E.; Hays, M.; Zhang, F.; Chang, C.L.; Yong, M.G.; Lee, J.; et al. Mediapipe: A framework for building perception pipelines. arXiv 2019, arXiv:1906.08172. [Google Scholar]
  15. Du, B.; Fernandez-Reyes, D.; Barucca, P. Image processing tools for financial time series classification. arXiv 2020, arXiv:2008.06042. [Google Scholar]
  16. Li, W.; Piao, M.L.; Alam, M.A.; Kim, N. Noise reduction in digital hologram using wavelet transforms and smooth filter for three-dimensional display. IEEE Photonics J. 2013, 5, 6800414. [Google Scholar]
  17. Schafer, R.W. What is a savitzky-golay filter? [lecture notes]. IEEE Signal Process. Mag. 2011, 28, 111–117. [Google Scholar] [CrossRef]
  18. Ma, D.; Shang, X.; Ridler, N.M.; Wu, W. Assessing the impact of data filtering techniques on material characterization at millimeter-wave frequencies. IEEE Trans. Instrum. Meas. 2021, 70, 1–4. [Google Scholar] [CrossRef]
  19. Hyndman, R. Moving Averages. Int. Encycl. Stat. Sci. 2010, 01, 866–869. [Google Scholar]
  20. Matsumura, K.; Toda, S.; Kato, Y. RGB and near-infrared light reflectance/transmittance photoplethysmography for measuring heart rate during motion. IEEE Access 2020, 8, 80233–80242. [Google Scholar] [CrossRef]
  21. Birrenkott, D. Respiratory Quality Index Design and Validation for ECG and PPG Derived Respiratory Data; Report for Transfer of Status; Department of the Engineering Science, University of Oxford: Oxford, UK, 2015. [Google Scholar]
  22. Birrenkott, D.A.; Pimentel, M.A.; Watkinson, P.J.; Clifton, D.A. A robust fusion model for estimating respiratory rate from photoplethysmography and electrocardiography. IEEE Trans. Biomed. Eng. 2017, 65, 2033–2041. [Google Scholar] [CrossRef]
  23. Bland, J.M.; Altman, D.G. Measuring agreement in method comparison studies. Stat. Methods Med. Res. 1999, 8, 135–160. [Google Scholar] [CrossRef] [PubMed]
Figure 1. Examples of health monitoring systems embedded in consumer electronics: (left) kiosks and (right) smartphones.
Electronics 14 02152 g001
Figure 2. Overview of the used rPPG signal extraction approach.
Electronics 14 02152 g002
Figure 3. Flow diagram of signal denoising using DWT.
Electronics 14 02152 g003
Figure 4. Discrete wavelet transform decomposition into approximation coefficients and detailed coefficients. The original signal is decomposed into c A 3 , c D 3 , c D 2 , and c D 1 .
Electronics 14 02152 g004
Figure 5. Results of removing unrelated motion artifacts. (a) Raw signal. (b) Denoised signal. (c) Signal that utilized the Savitzky–Golay (SG) filter. (d) Signal that utilized a moving average.
Electronics 14 02152 g005
Figure 6. Example of the experimental setup for the study.
Electronics 14 02152 g006
Figure 7. Results of signal comparison. (a) Signals extracted from luminance and chrominance components; (b) signals extracted from luminance components and reference signals; (c) signals extracted from chrominance components and reference signals.
Electronics 14 02152 g007
Figure 8. Results from transforming the time domain signal into the frequency domain. (a) Signal measured using chrominance components. (b) Signal measured using luminance components.
Electronics 14 02152 g008
Figure 9. Overview of approach for obtaining the RQI, comprising the extraction of signals from both cheeks, under the nose, and the chin among facial areas.
Electronics 14 02152 g009
Figure 10. Bland–Altman plot and results of regression analysis. (a) Experiment 1. (b) Experiment 2.
Electronics 14 02152 g010
Table 1. Comparison of the strengths and weaknesses of previous research.
MethodStrengthsWeaknesses
Thermal camera-basedOnce the ROI is reliably recognized, it is unaffected by variations in illumination.Advanced thermographic cameras are costly, and their resolution significantly affects their performance.
Body movement-basedMeasurement is available with a low-cost camera without the need for additional devices.Motion noise and individual factors like clothing and background can affect measurement. Optical flow-based techniques may result in longer processing times.
Remote photoplethysmography (PPG)-basedMeasurement is available with a low-cost camera. Utilizing frequency transformation methods enhances its resilience to other types of noise.The underlying principle of respiratory measurement using rPPG remains only partially understood, particularly regarding signal separation and physiological interpretation.
Table 2. SNR results.
ChrominanceLuminance
SNR0.97623.7623
Table 3. Results of RQI values for the signals in Figure 9.
R1R2R3R4
RQI0.95670.95870.96130.9608
Table 4. Performance results for each experiment.
MAE R 2 CorrelationMODLoA
Experiment 10.7890.9050.953−0.04 ± 2.1
Experiment 21.0240.8380.9160.01 ± 2.9
Disclaimer/Publisher’s Note: The statements, opinions and data contained in all publications are solely those of the individual author(s) and contributor(s) and not of MDPI and/or the editor(s). MDPI and/or the editor(s) disclaim responsibility for any injury to people or property resulting from any ideas, methods, instructions or products referred to in the content.

