Article

Uncertain Shape and Deformation Recognition Using Wavelet-Based Spatiotemporal Features

by
Haruka Matoba
1,
Takashi Kusaka
2,*,
Koji Shimatani
3 and
Takayuki Tanaka
2
1
Graduate School of Information Science and Technology, Hokkaido University, Sapporo 060-0814, Japan
2
Faculty of Information Science and Technology, Hokkaido University, Sapporo 060-0814, Japan
3
Faculty of Health and Welfare, Prefectural University of Hiroshima, Mihara 723-0053, Japan
*
Author to whom correspondence should be addressed.
Electronics 2025, 14(11), 2131; https://doi.org/10.3390/electronics14112131
Submission received: 2 April 2025 / Revised: 15 May 2025 / Accepted: 21 May 2025 / Published: 23 May 2025

Abstract

This paper proposes a wavelet-based spatiotemporal feature extraction method for recognizing uncertain shapes and their deformations. Uncertain shapes, such as hand gestures and fetal movements, exhibit individual and trial-dependent variations, making their accurate recognition challenging. Our approach constructs shape feature vectors by integrating wavelet coefficients across multiple scales, ensuring robustness to rotation and translation. By analyzing the temporal evolution of these features, we can detect and quantify deformations effectively. Experimental evaluations demonstrate that the proposed method accurately identifies shape differences and tracks deformations, outperforming conventional approaches such as template matching and neural networks in adaptability and generalization. We further validate its applicability in tasks such as hand gesture recognition and fetal movement analysis from ultrasound videos. These results suggest that the proposed wavelet-based spatiotemporal feature extraction technique provides a reliable and computationally efficient solution for recognizing and tracking uncertain shapes in dynamic environments.

1. Introduction

Recognizing and analyzing uncertain shapes, such as hand gestures and fetal movements, is essential in various fields, including human–computer interaction and medical diagnostics. For example, accurate recognition of hand gestures can enhance sign language communication by providing an intuitive and efficient interaction method for both signers and non-signers [1]. Similarly, fetal movement monitoring from ultrasound video plays a crucial role in assessing fetal health, as decreased movements can be an early indicator of complications during pregnancy [2].
However, these shapes exhibit significant individual variations and trial-dependent differences, resulting in ambiguous and uncertain target shapes and deformations. Consequently, capturing them accurately with conventional shape recognition techniques remains challenging. Template matching, while useful for simple, predefined shapes, struggles with variations, requires prior information, is sensitive to transformations and occlusions, and involves high search costs [3,4]. Basic neural networks often lack generalization capabilities for unseen shape variations [5,6]. Feature-based methods also present difficulties; for example, SIFT features are robust to scale but not to deformation [7,8], and geometric moments can be sensitive to noise and may overlook fine local details [9]. Recently, deep learning (DL)-based methods, including Convolutional Neural Networks (CNNs) [10], Recurrent Neural Networks (RNNs) [11], Graph Deep Learning (GDL) [12], and Transformers [13], have achieved high accuracy and become mainstream in shape recognition. While DL can automatically learn powerful features from data, achieving high generalization performance and robustness against uncertain shapes and unknown deformation patterns typically requires vast amounts of labeled data and high-performance computational resources. Generalization to transformations not present in the training data heavily relies on data augmentation and specific architectural designs, and the black-box nature of these models poses challenges in interpretability. Approaches to achieve invariance in deep learning also exist, but they usually learn invariance from data, thus presupposing the availability of large datasets [14]. Overall, these existing methods generally presuppose large training datasets and struggle to efficiently compute meaningful shape features for unlearned shapes or unknown deformation patterns. Furthermore, frequency-based methods, such as the discrete cosine transform (DCT) and Fast Fourier Transform (FFT), fail to provide features that are invariant to rotation and translation, further complicating shape recognition [15,16].
To address these challenges, we propose a wavelet-based spatiotemporal feature extraction method that effectively captures shape structures while maintaining robustness to geometric transformations. By integrating wavelet coefficients across multiple scales, our method constructs shape feature vectors that provide an adaptive and generalizable representation of uncertain shapes. Furthermore, analyzing the temporal evolution of these features enables reliable shape deformation detection without requiring extensive training data.
The proposed method offers two major advantages: (1) it captures shape characteristics comprehensively by decomposing edges, curves, and outlines into frequency components [17,18,19,20], and (2) it provides robust shape features that remain invariant to rotation and translation by averaging spatial frequency components across scales. These properties make it particularly suitable for dynamic shape analysis tasks where traditional methods fail.
In this study, we validate the proposed method through experiments on both synthetic and real-world datasets, demonstrating its effectiveness in distinguishing between different shapes and tracking their deformations. Additionally, we explore its application in hand gesture recognition [1] and fetal movement analysis [2], illustrating its potential impact in medical and human–computer interaction fields. The rest of this paper is organized as follows: Section 2 describes the proposed method in detail, Section 3 presents experimental results, Section 4 discusses key findings and applications, and Section 5 concludes the study with future directions.

2. Methods

In this study, we propose a feature set that quantitatively represents uncertain shapes of objects in an image to recognize their deformations. Uncertain shapes, such as those observed in hand gestures and fetal movements, exhibit significant individual variations and trial-dependent ambiguities, making their precise recognition challenging. To address this, we introduce a method for quantitatively handling the abstract features of shape deformation by capturing these changes as a time-series variation in the extracted shape features from video data. Figure 1 shows the overall flow of the proposed method.
The shape of an object in this study is defined as a region in an image with a distinct intensity value. These regions are considered object shapes, and their deformations are observed as temporal variations in their edge structures. Importantly, only changes in the shape itself are considered, while positional and orientation changes, such as translations and rotations relative to the image frame, are not treated as shape deformations. In the following section, we design features that uniquely represent the absolute shape of an object, regardless of its position or angle within the image.
To achieve this, we employ a wavelet-based approach that decomposes spatial frequency components at multiple scales, allowing us to extract robust shape features that remain invariant to geometric transformations. The input image for our method is assumed to contain a clearly defined object that is large and well-separated from other regions of the frame. Even if the background exhibits strong edge components, as long as these remain constant over time, they do not interfere with the calculation of the shape feature values.

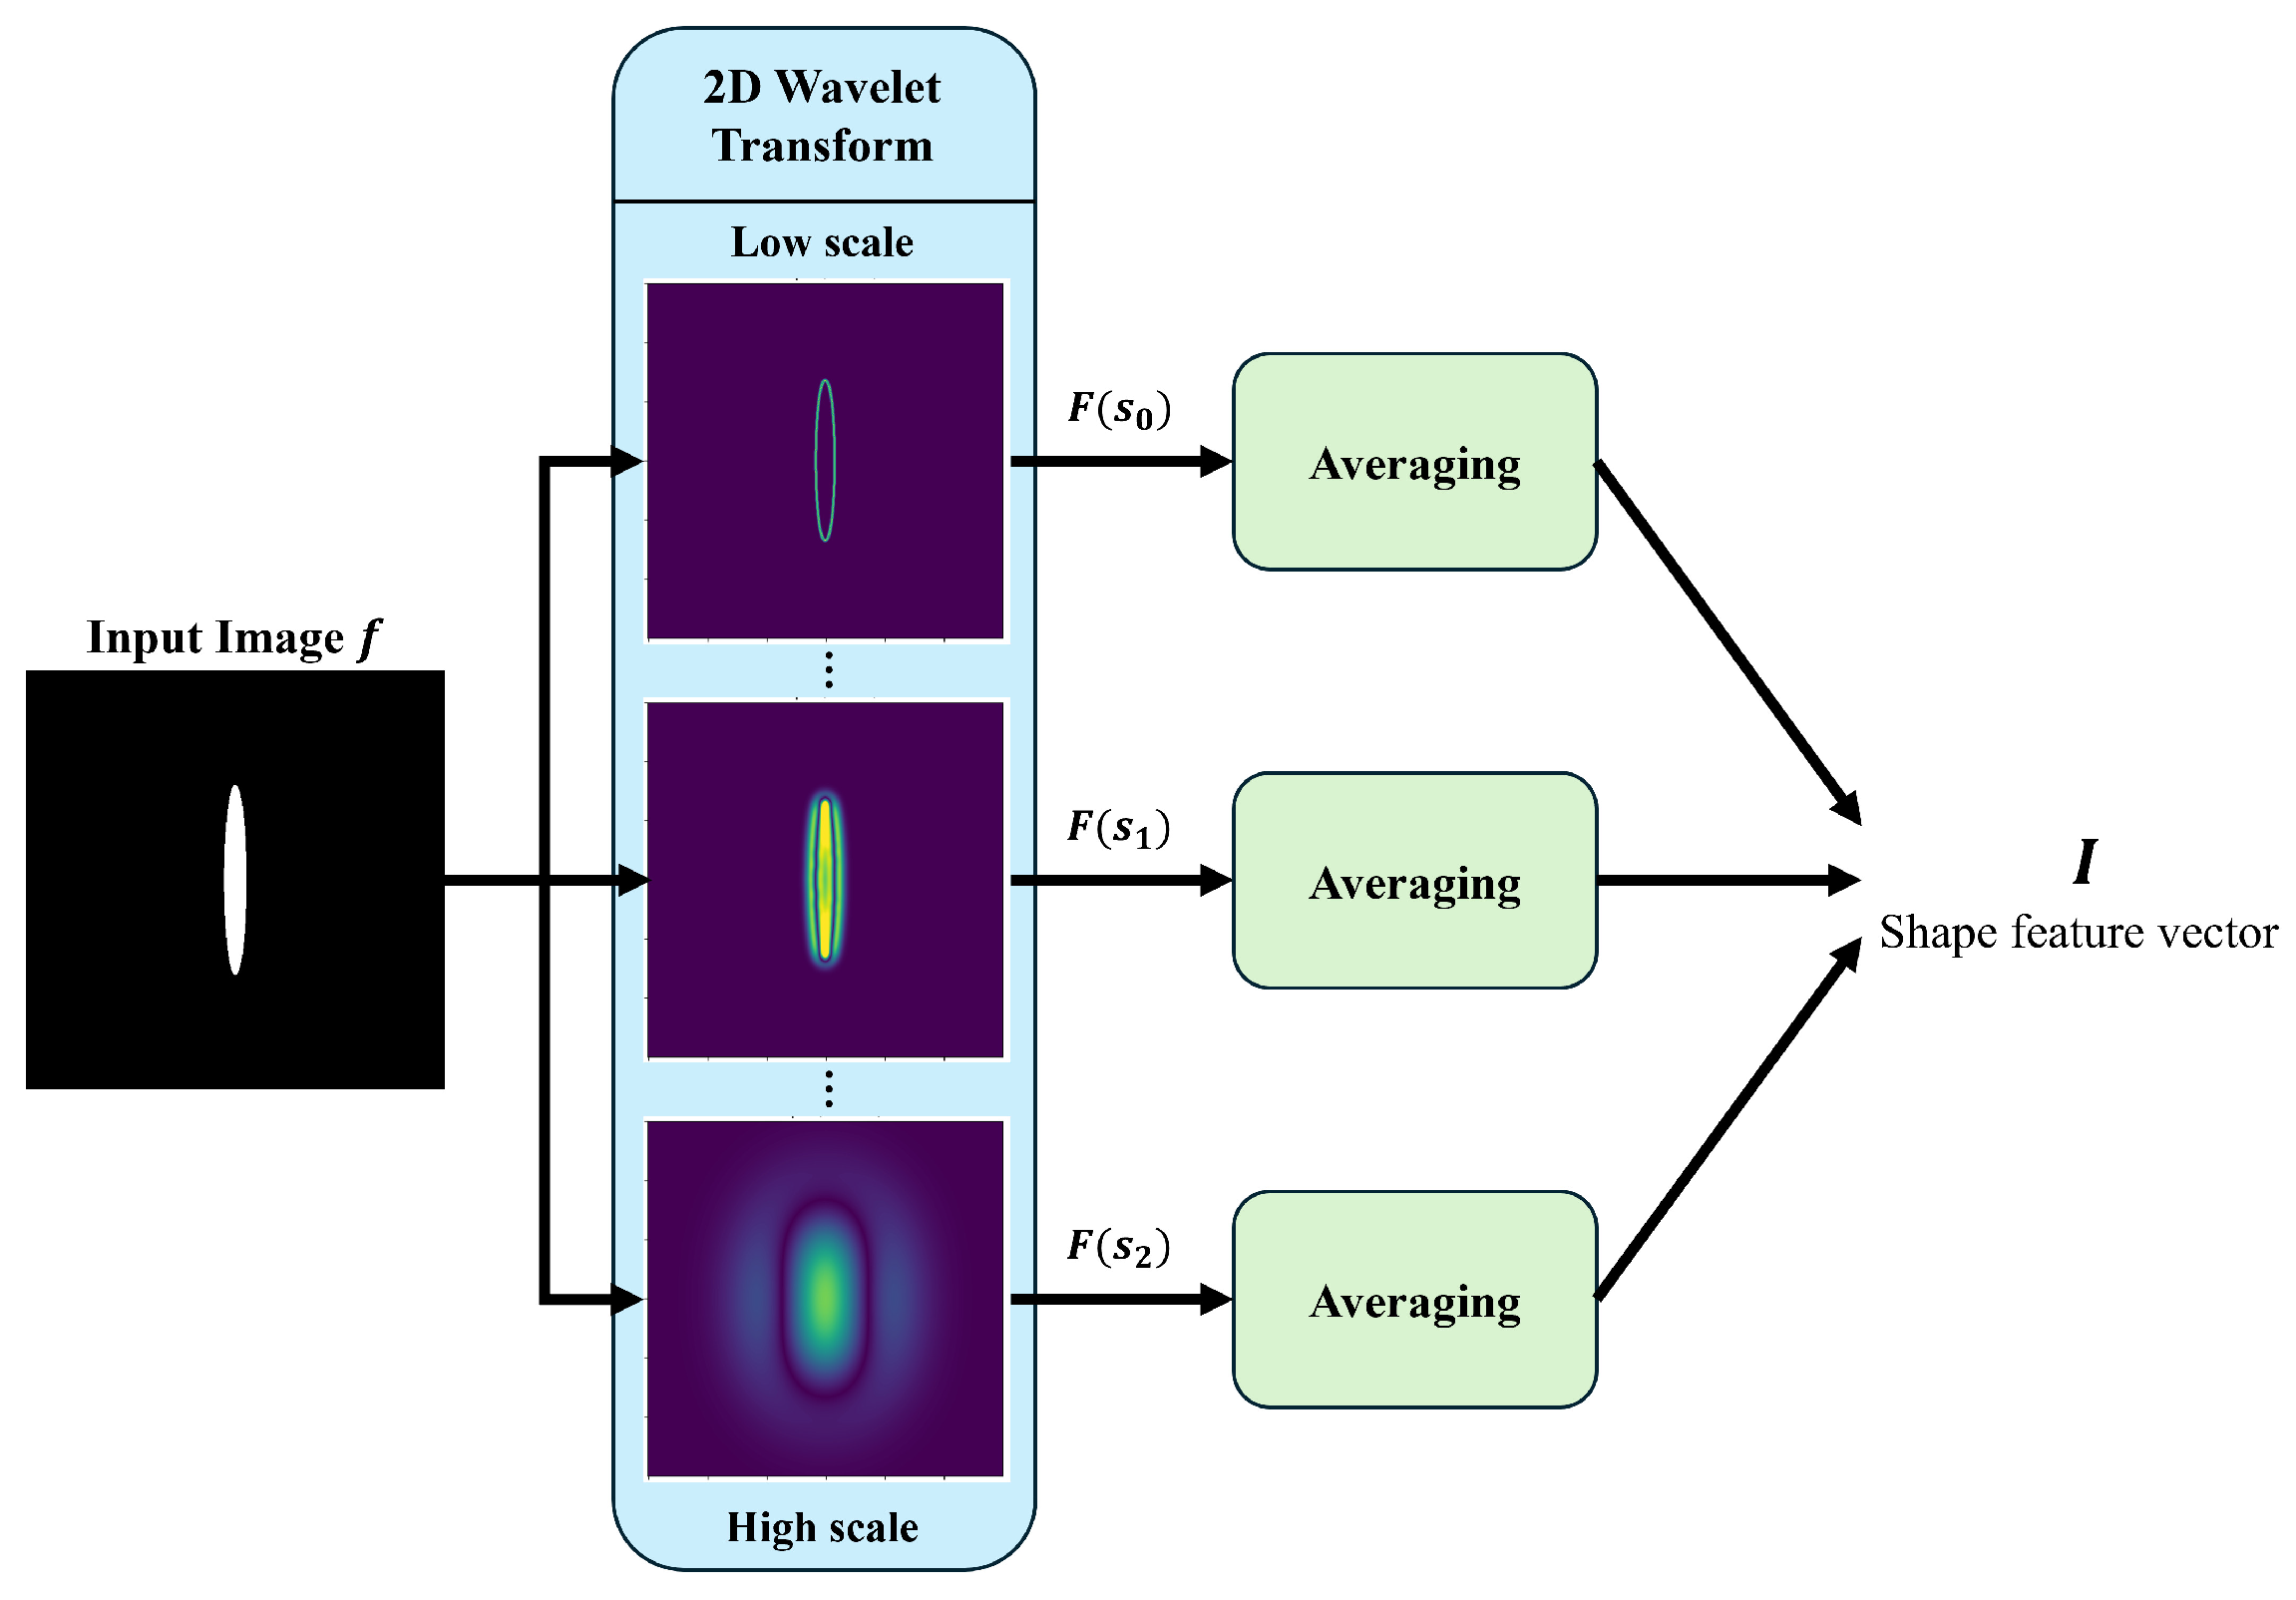
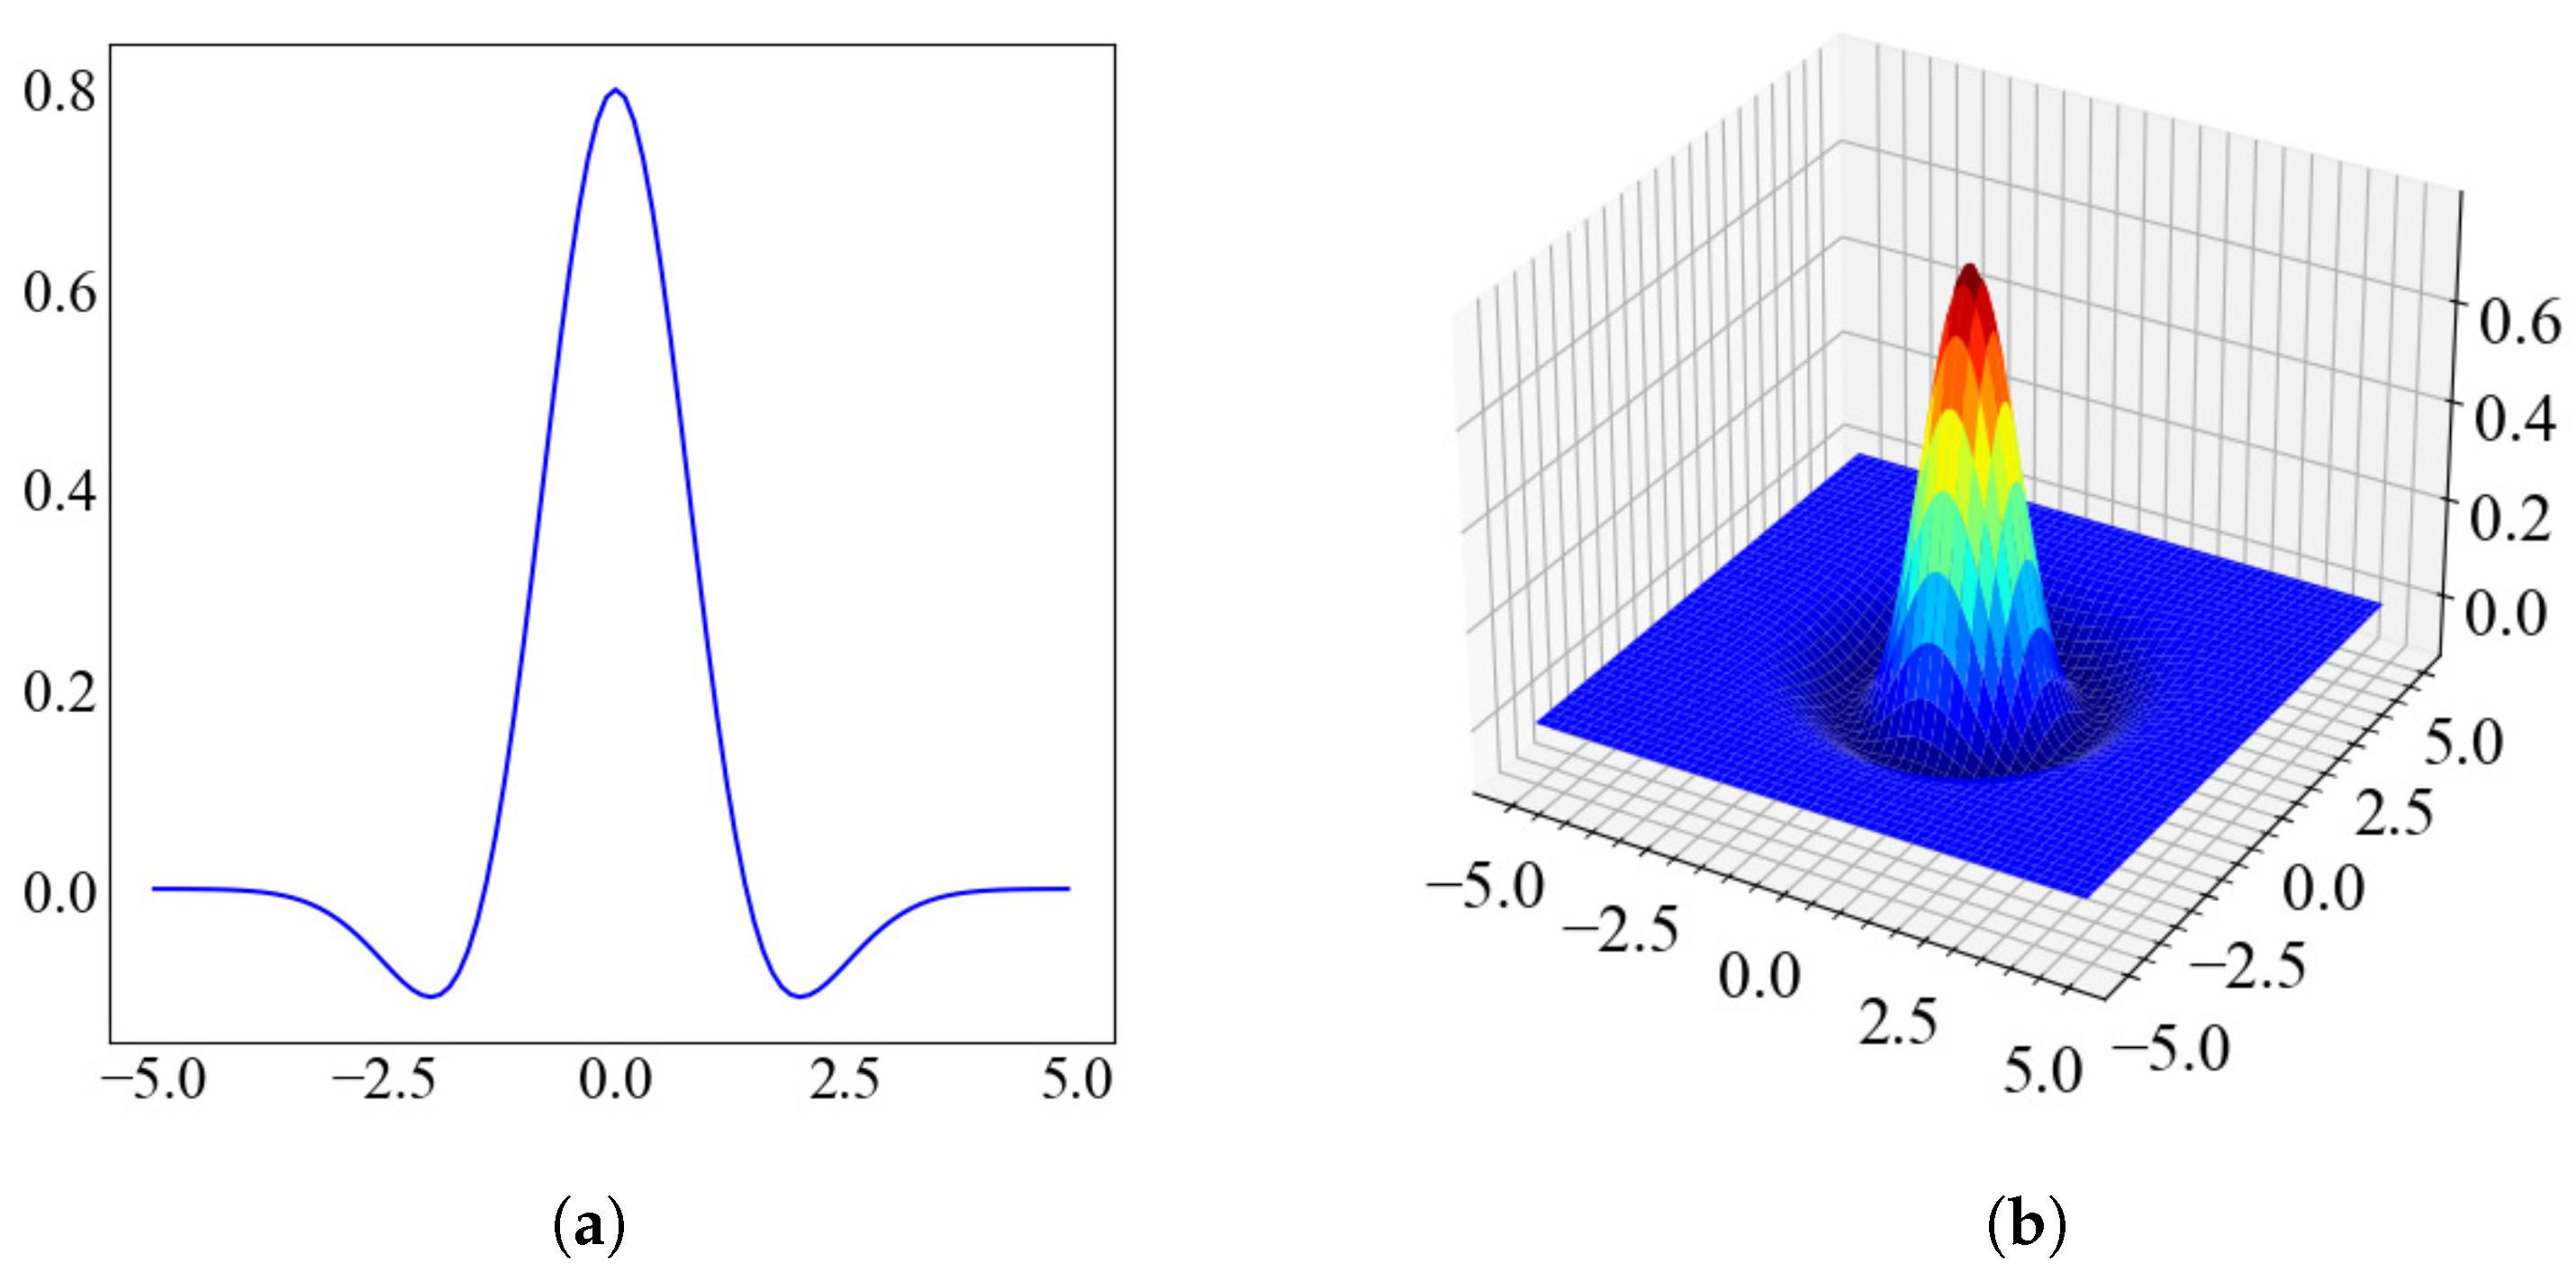
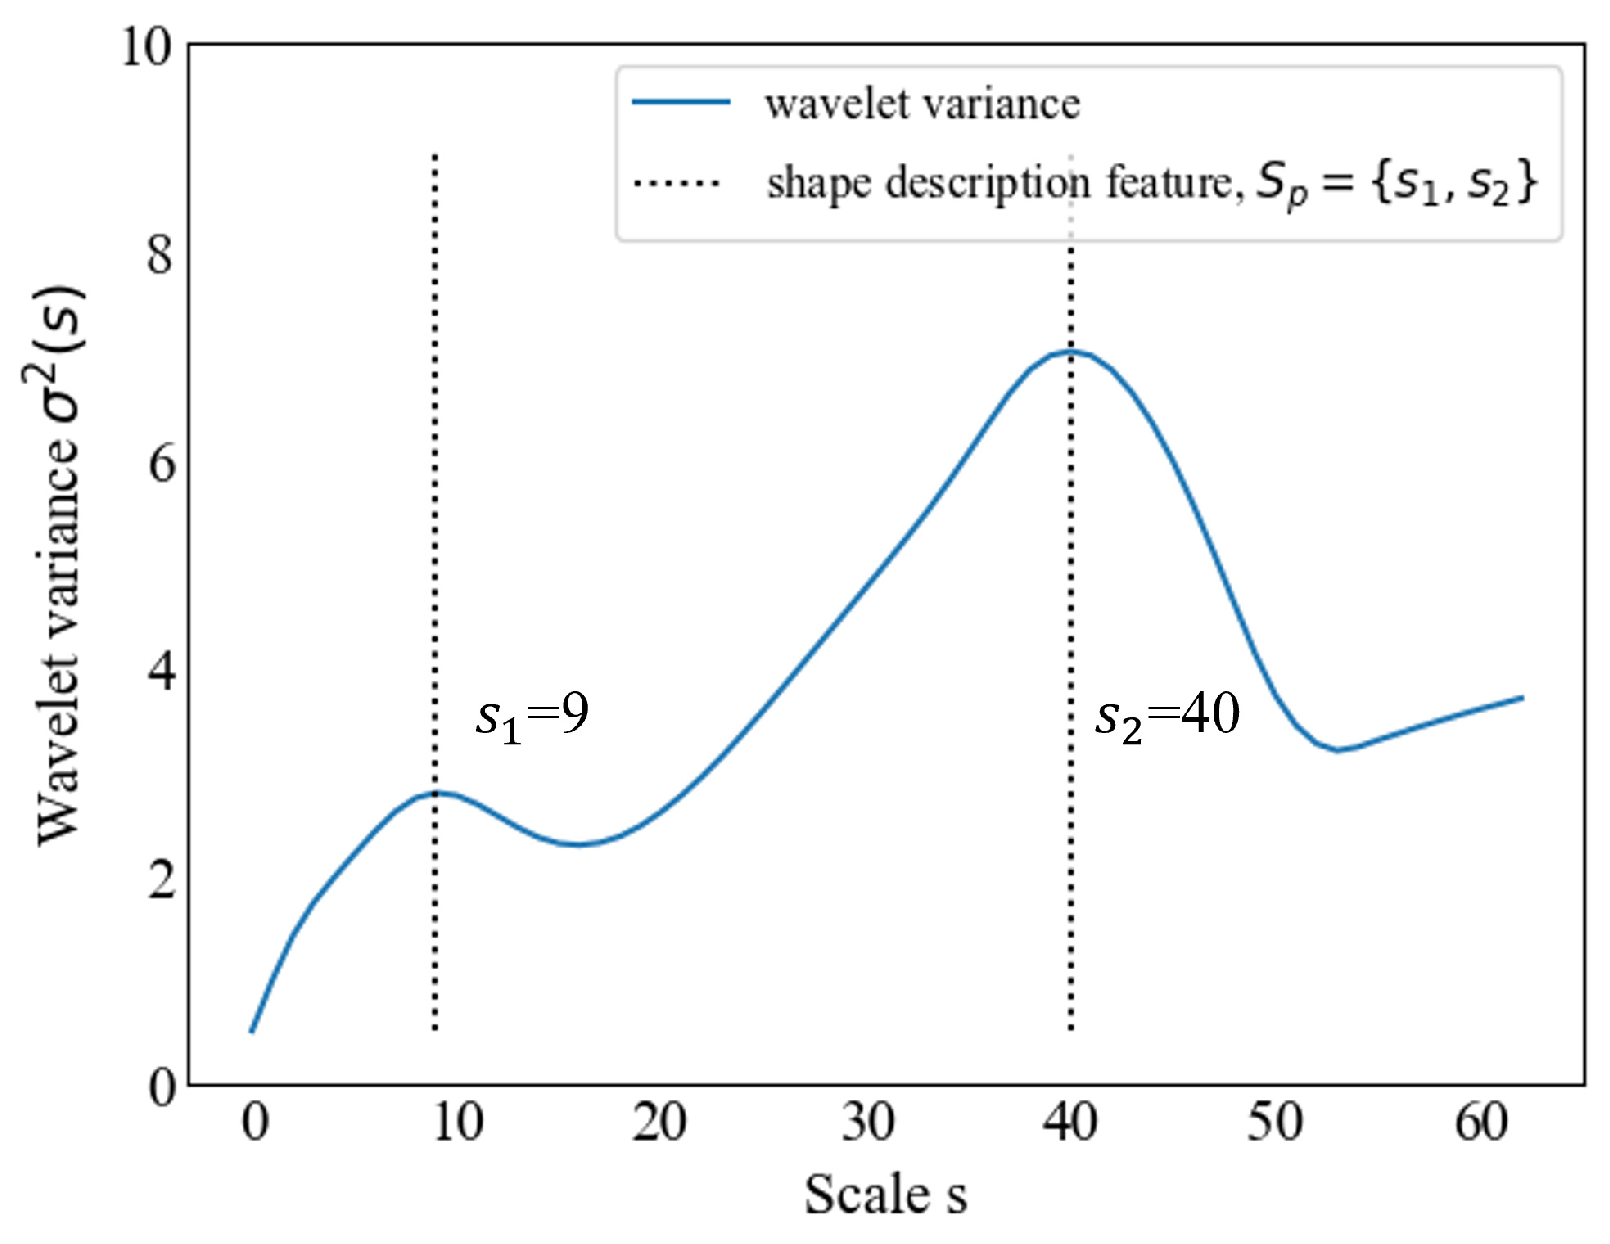
2.1. Robust Features for Uncertain Shapes Using Wavelet Kernels

As mentioned above, the shape features considered in this study are regions that exist locally within an image. One conventional method for representing such features involves the convolution of predefined kernels, such as those used in pattern matching, to obtain feature correlations. This approach effectively extracts specific spatial patterns but relies on predefined kernel designs or learned representations. However, conventional kernel-based methods rely heavily on predefined patterns or learned representations, making them less effective for capturing highly variable or uncertain shapes. Alternatively, when analyzing entire image properties, methods like FFT or DCT are applied, treating the image as a two-dimensional signal waveform. However, these methods struggle to capture localized shape variations and gradual deformations.
To address these challenges, we employ wavelet kernel-based features to effectively capture uncertain and deforming shapes that appear locally within an image. Since wavelet transforms allow multi-resolution analysis, this method can effectively capture gradual shape deformations over time, making it suitable for tracking dynamic deformations.
In this approach, we utilize an isotropic wavelet, specifically the Mexican Hat wavelet, defined by the following equation:
ψ ( s , x , y ) = 1 s 2 2 π 1 x 2 + y 2 2 exp x 2 + y 2 2
This equation satisfies the condition that it can be a mother wavelet [21]. This Mexican hat wavelet is very suitable for shape feature extraction because it maintains robustness to rotation and translation. This is because its symmetric waveform expands and contracts uniformly along both axes as the scale parameter s changes. Despite the simple structure of the wave being a single, isotropic Gaussian function base, it is particularly effective at detecting local edges and highlighting low-frequency components, making it suitable for uncertain shape analysis.
Unlike FFT and DCT, which analyze the entire image as a signal, the wavelet transform enables localized shape analysis, making it particularly effective for recognizing uncertain and deforming shapes. The surface ψ at scale s = 1 is shown in Figure 2.
By convolving the entire image with this wavelet kernel, we can capture local shape structures effectively. The wavelet transform using this kernel is expressed as:
F ( s , t , w , h ) = 1 H 1 W f t , x , y ψ s , x w s , y h s d x d y
where f ( t , x , y ) represents the input image, t is the frame number, s is the scale parameter, and ( w , h ) correspond to the pixel shift in the x and y directions, respectively. This transformation allows multi-resolution analysis, adjusting scale s to capture shape features effectively, even when the target pattern is unknown.
The wavelet transform’s capability to fully recover the original signal by inverse transformation makes it ideal for the representation of shape features. However, in its basic form, the transformation does not inherently provide a unique feature representation that is invariant to positional changes within an image frame. By integrating wavelet coefficients across scales, this method generates shape features that remain stable even under transformations, ensuring reliable recognition of uncertain and deforming shapes.

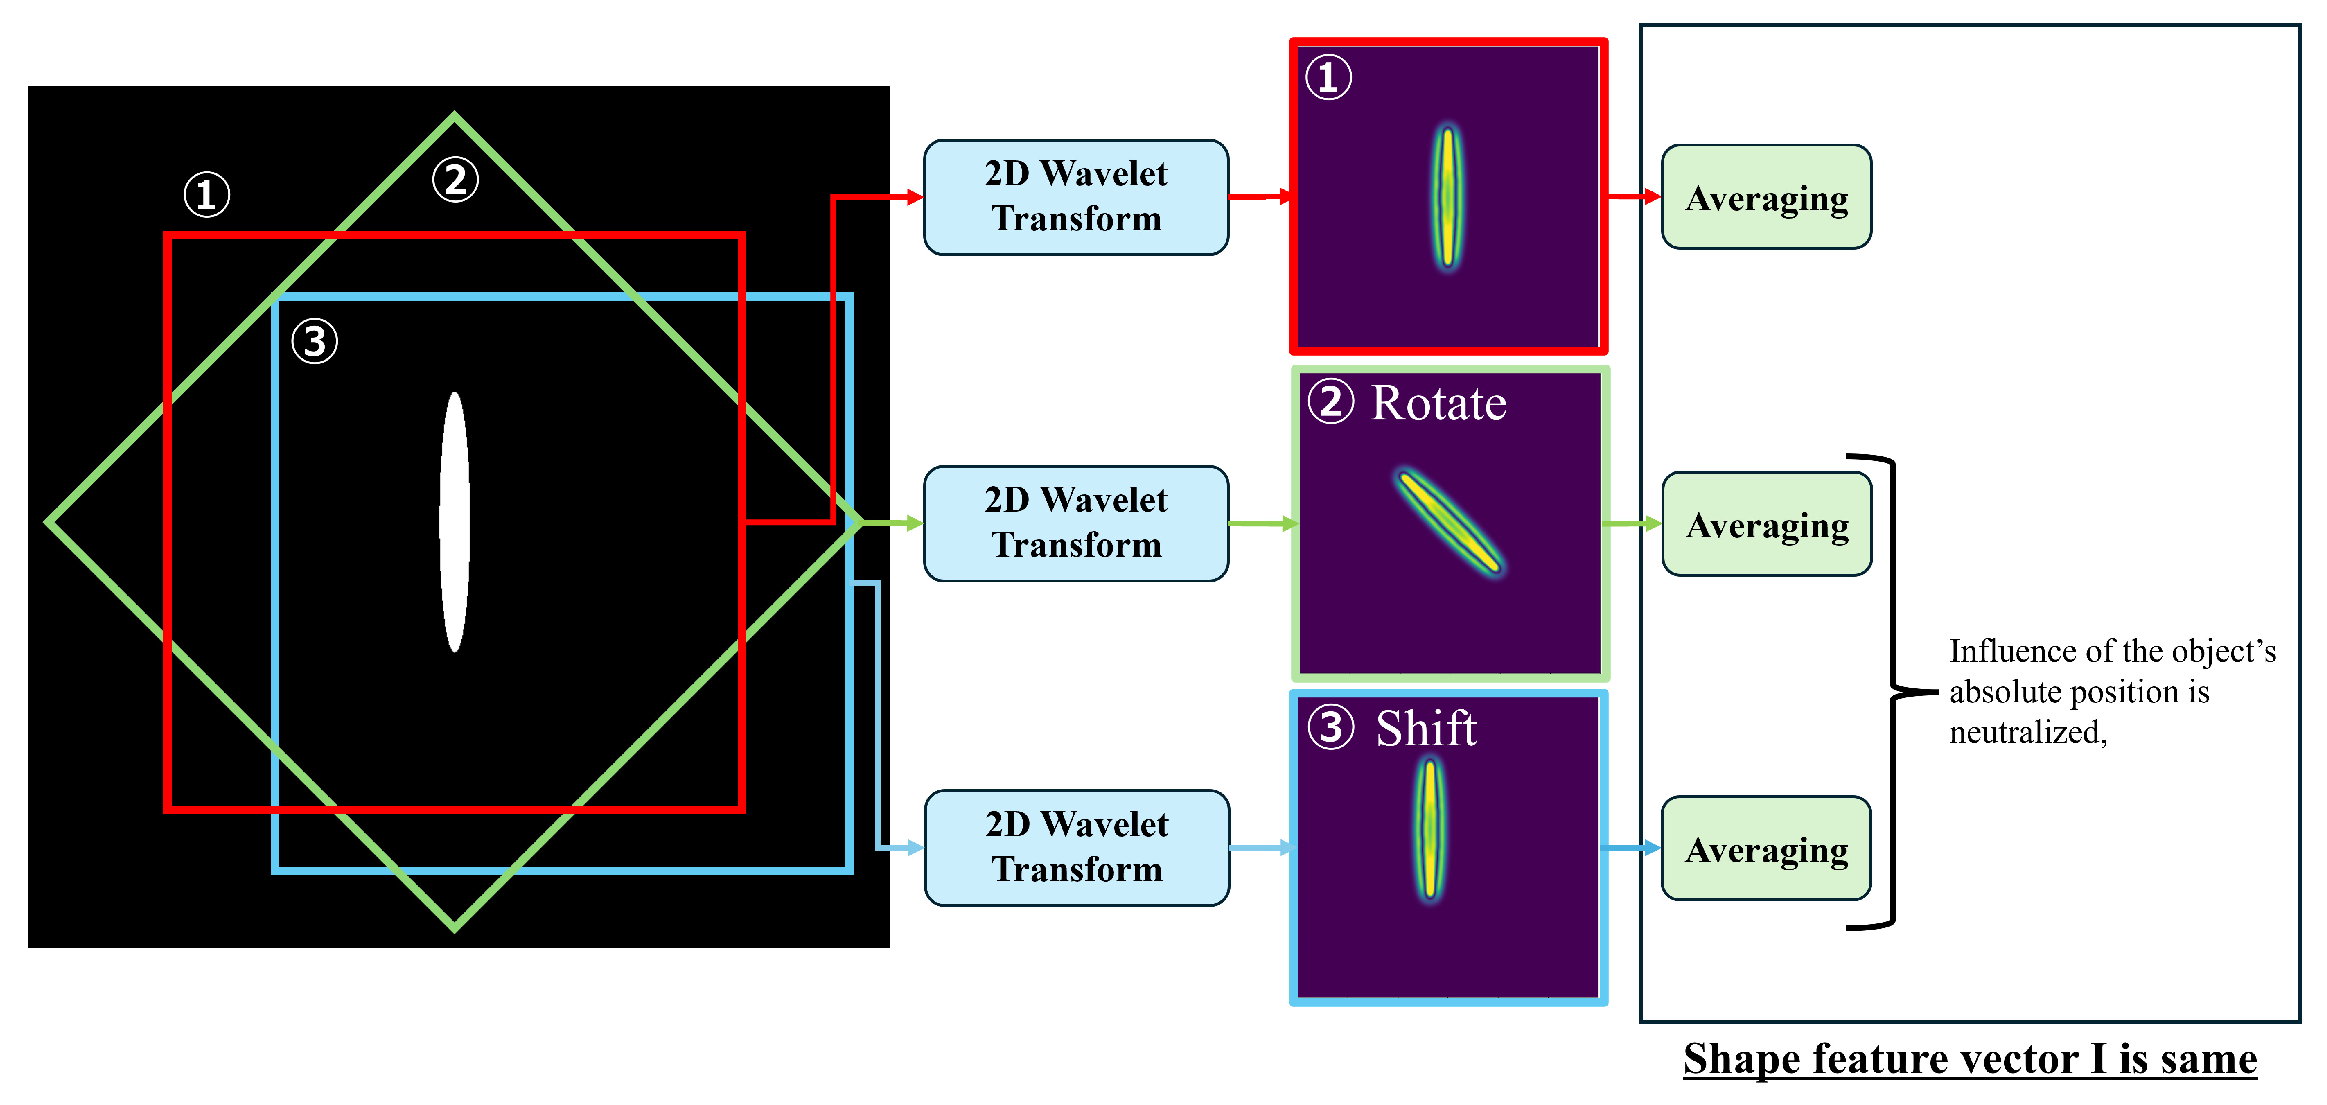
2.2. Translation-Invariant and Rotation-Invariant Shape Features for Recognizing Uncertain and Deforming Shapes

Although the wavelet transform provides a rich representation of shape features, the wavelet coefficients F ( s , t , w , h ) are dependent on the positional relationship between the object shape and the image frame. This dependence hinders a one-to-one correspondence between the extracted features and actual shape characteristics. In many shape recognition tasks, the same object may appear at different positions and orientations within an image. To ensure consistent recognition, it is essential to derive features that remain stable under such transformations. Since uncertain shapes may exhibit variations in contour and structure across different instances, a robust feature representation must capture essential shape characteristics independent of absolute position and orientation. To address this issue, we propose a method to derive absolute shape features that remain invariant to translation and rotation.
To ensure translation invariance, we integrate the wavelet coefficients over the entire image domain as follows:
I ( s , t ) = 1 W · H h = 1 H w = 1 W | F ( s , t , w , h ) |
where I ( s , t ) for each scale is a vector whose elements are defined as the vector of shape features. The calculation algorithm is summarized in Appendix A. Shape feature vectors represent the translation-invariant and rotation-invariant features, as shown in Figure 3, and W and H denote the width and height of the image, respectively.
By integrating the wavelet coefficients over the entire image, the influence of the object’s absolute position is neutralized, ensuring that the extracted features depend only on the shape itself. Also, since the mother wavelet is rotation-invariant, the spatial arrangement of F rotates with the rotation of f, but the magnitude is unaffected. Thus, this operation also ensures rotational invariance.
Unlike conventional approaches that rely on absolute spatial relationships, our method ensures that uncertain and deforming shapes are consistently represented regardless of their positional or rotational variations. Through these two transformations, the obtained features provide a unique representation of the shape, allowing for robust recognition of uncertain and deforming objects regardless of their position and orientation within the image frame.
In addition, the computational complexity of this method when N ( = W × H ) is the input image size is shown. In this study, we employed the Continuous Wavelet Transform (CWT) in a preliminary study. The computation for CWT acts as the bottleneck for the entire process, resulting in a complexity of O ( N 2 ) . While the subsequent processes of integrating and averaging the wavelet coefficients themselves have a complexity of O ( N ) , the dominant CWT computation leads to an overall complexity of O ( N 2 ) for the entire feature extraction process in the current implementation. However, there is potential to reduce the computational complexity to O ( N ) by adopting the Discrete Wavelet Transform (DWT) in future work. If DWT is used, our method is expected to be more computationally efficient than the Fast Fourier Transform (FFT), which has a complexity of O ( N log N ) . Furthermore, even with the current O ( N 2 ) implementation, the proposed method is considered to hold advantages, particularly in terms of inference cost, when compared with deep learning models, which often involve complex architectures, a vast number of parameters, and require extensive training data and computational resources.

3. Experiments and Results

The proposed method is capable of extracting shape features that are robust to rotations and translations. A simple figure is used to verify whether the extracted shape feature vectors are distinguishable from those of other shapes and whether they remain stable under rotations and translations. In this experiment, shape feature vectors are computed for scales up to 100.

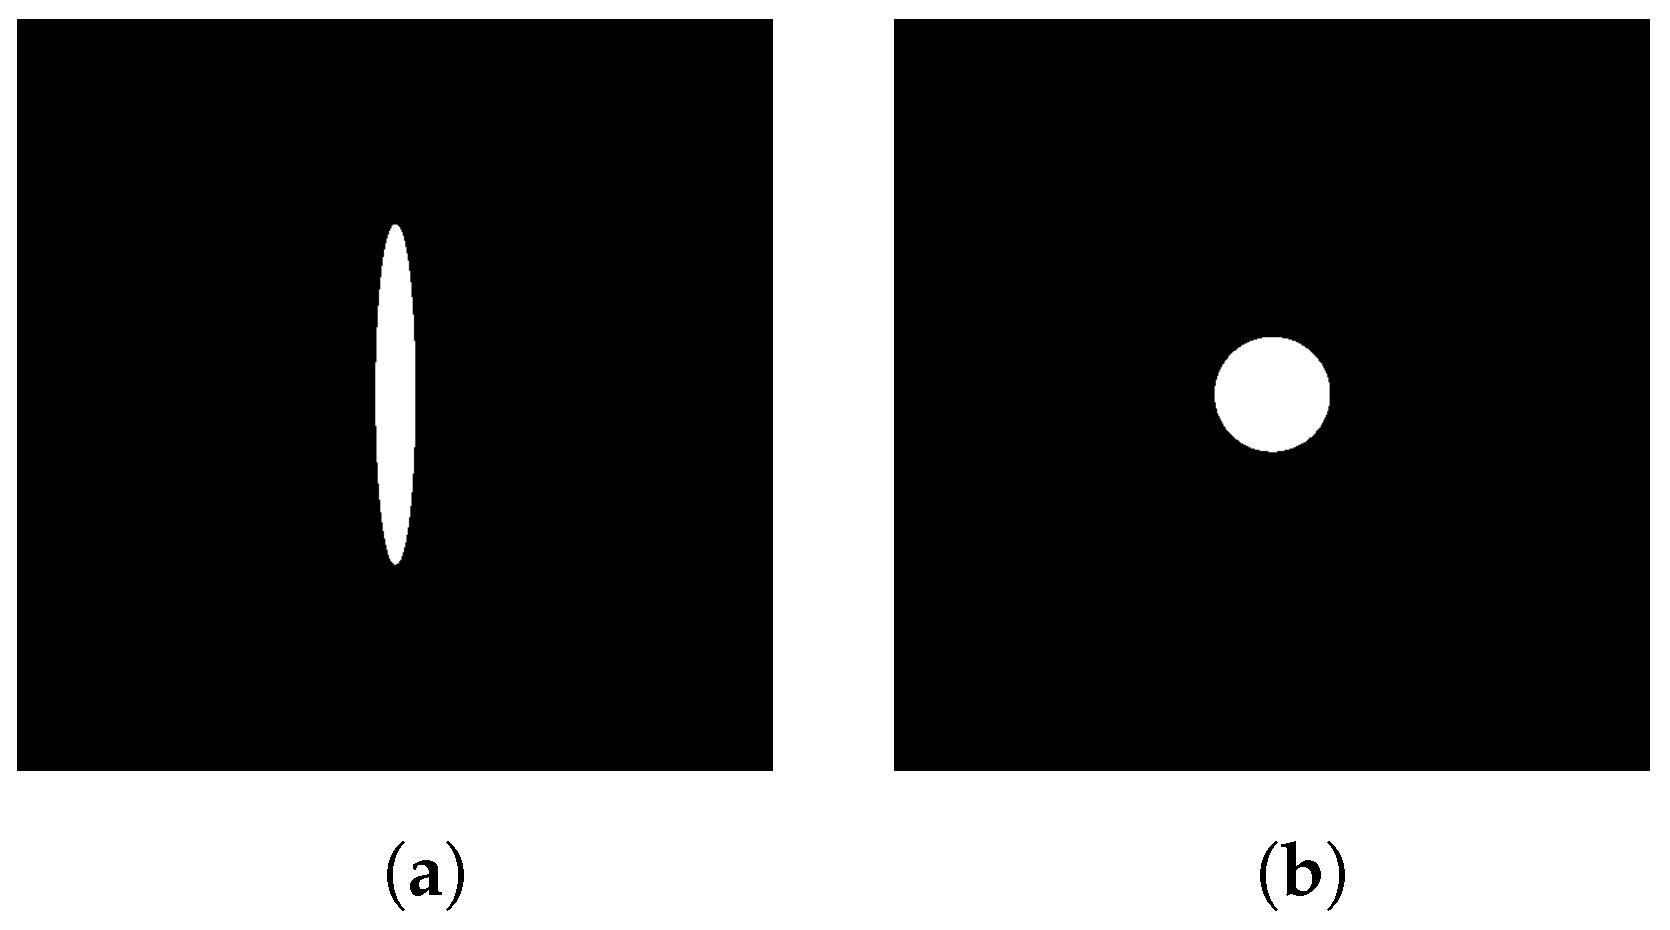
3.1. Shape Representation of an Ellipse and a Circle

The ability to distinguish between different shapes is fundamental to effective shape recognition. Before assessing the robustness of the proposed method to geometric transformations, we first evaluate whether it can differentiate distinct shapes.
An ellipse and a circle were selected for comparison, as shown in Figure 4. The ability to distinguish between different shapes is fundamental to effective shape recognition. Before assessing the robustness of the proposed method to geometric transformations, we first evaluate whether it can differentiate distinct shapes.
An ellipse and a circle were selected for comparison, as shown in Figure 5a, and shape feature vectors for each shape subtracted with respect to Shape 1 are shown in Figure 5b. The maximum difference between Shape 1 and Shape 2 was 3.42. To evaluate the uniformity of variance of each element of the shape feature vector, the F-test was used with the null hypothesis that there is no difference in the distribution of the shape feature vectors for circle and ellipse. The results show that there was a statistically significant difference between the two shapes (p < 0.01).

3.2. Shape Representation Under Ellipse Rotation

This experiment evaluates the stability of the shape feature vectors under rotation. We examine whether the feature vectors remain consistent when an ellipse is rotated around the image center.
Shape feature vectors are calculated for the ellipses shown in Figure 6a,b as they rotate around the image center. To demonstrate this effect, we compare the feature vectors obtained from images with rotation angles of 0 and 45 degrees, as shown in Figure 6. The scale of the ellipse remains constant throughout all images.
Shape feature vectors corresponding to each rotation are shown in Figure 7. The maximum difference between each element of the shape feature vectors for the two images was 0.08, indicating that the feature representation remains stable under rotation.

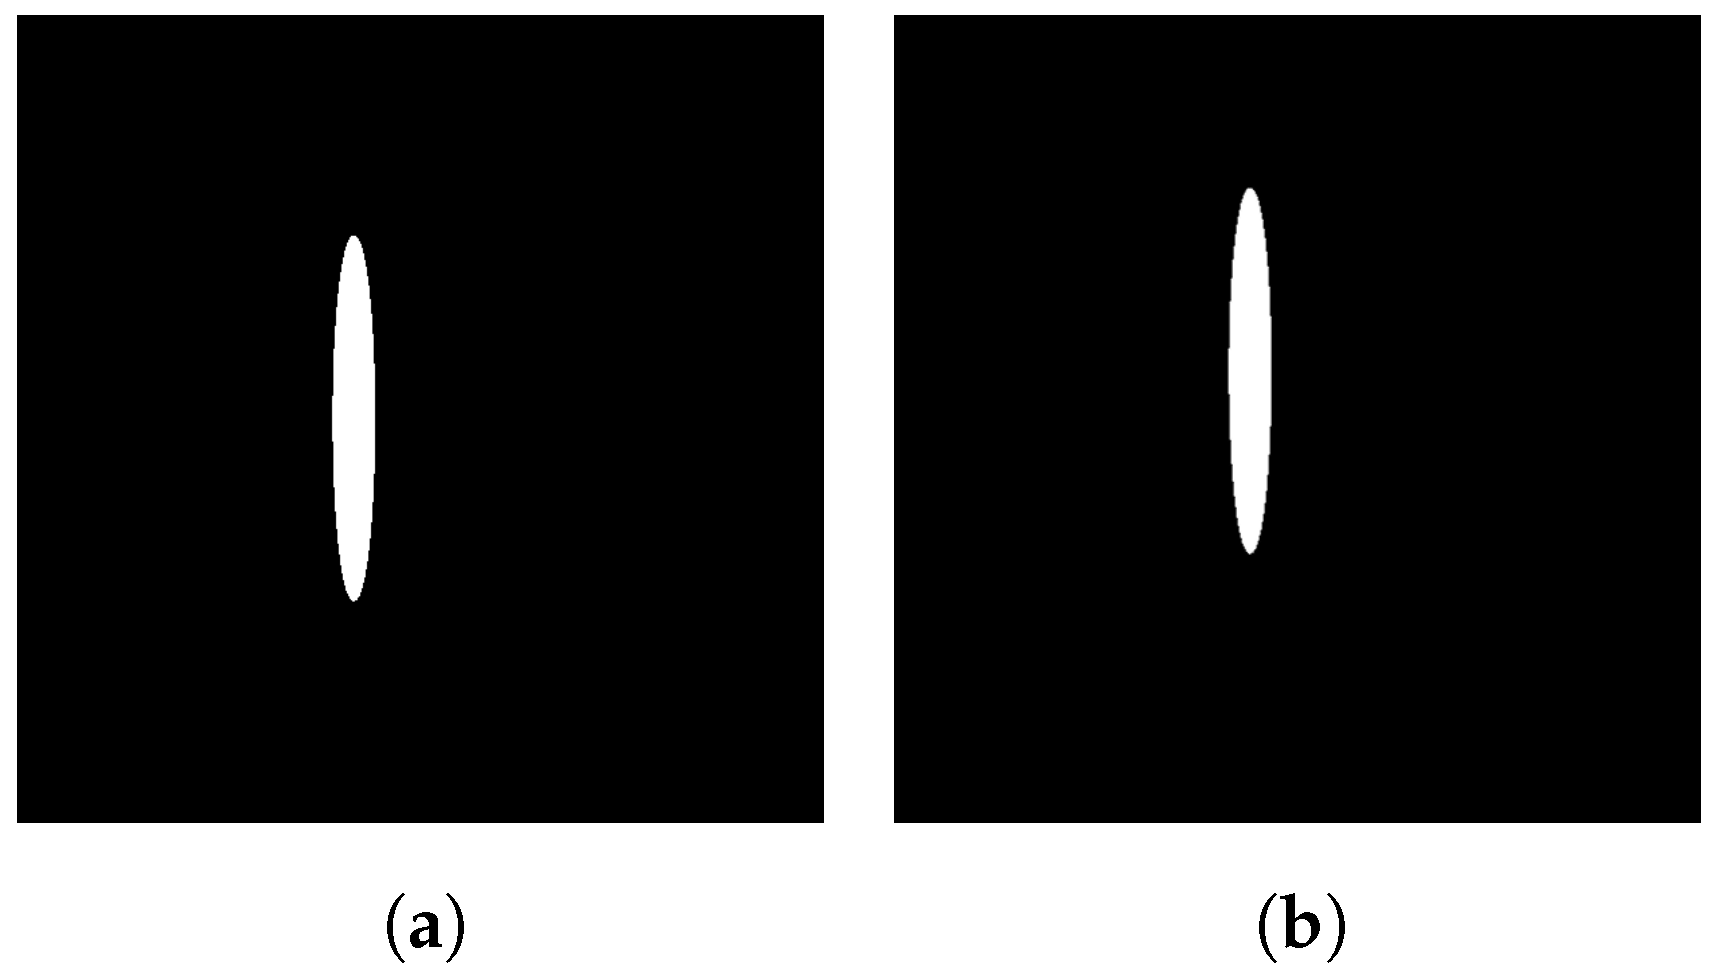
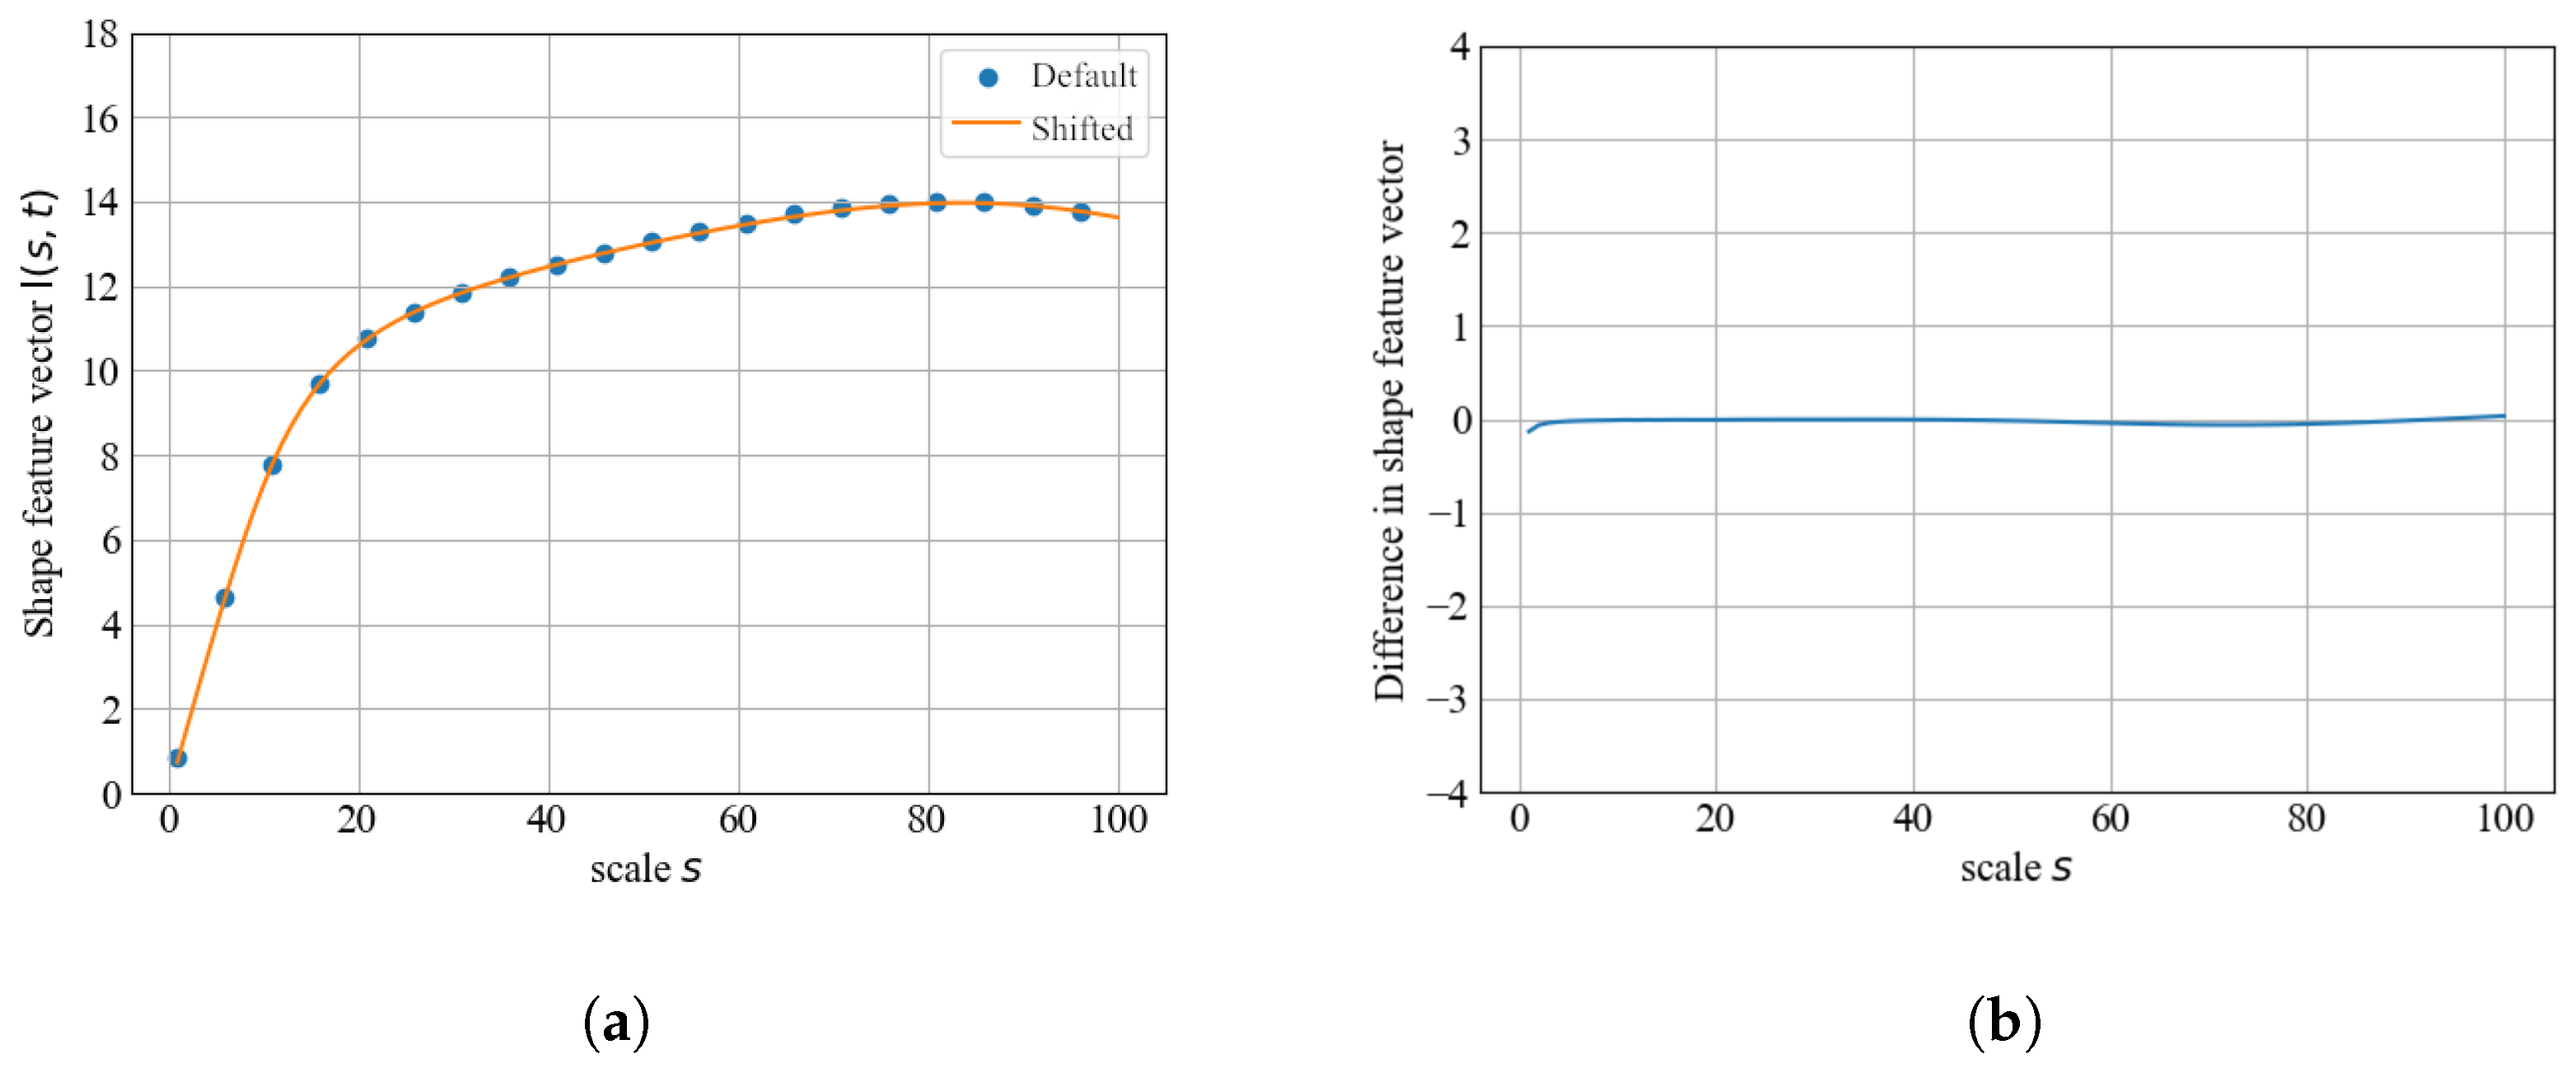
3.3. Shape Representation Under Ellipse Translation

This experiment evaluates the stability of shape feature vectors under translation. We examine whether the feature vectors remain consistent when an ellipse is translated within the image.
Shape feature vectors are calculated for the ellipse shown in Figure 8 as it is translated concentrically around the image center. To demonstrate this effect, we compare the feature vectors obtained from images with translation displacements of 0 and 50 pixels, as shown in Figure 8. The scale of the ellipse remains constant across all images.
Shape feature vectors corresponding to each translation are shown in Figure 9. The maximum difference between each element of the shape feature vectors for the two images was 0.13, indicating that the feature representation remains stable under translation.
These results indicate that the proposed method exhibits higher robustness to rotation (maximum difference of 0.08) than to translation (maximum difference of 0.13). This suggests that positional shifts introduce more variability in the feature representation compared with rotational changes.

4. Discussion and Application

Section 4.1 describes a discussion based on the results of the experiments in Section 3. Section 4.2 shows an application example of shape discrimination and shape change recognition using shape feature vectors.

4.1. Discussion

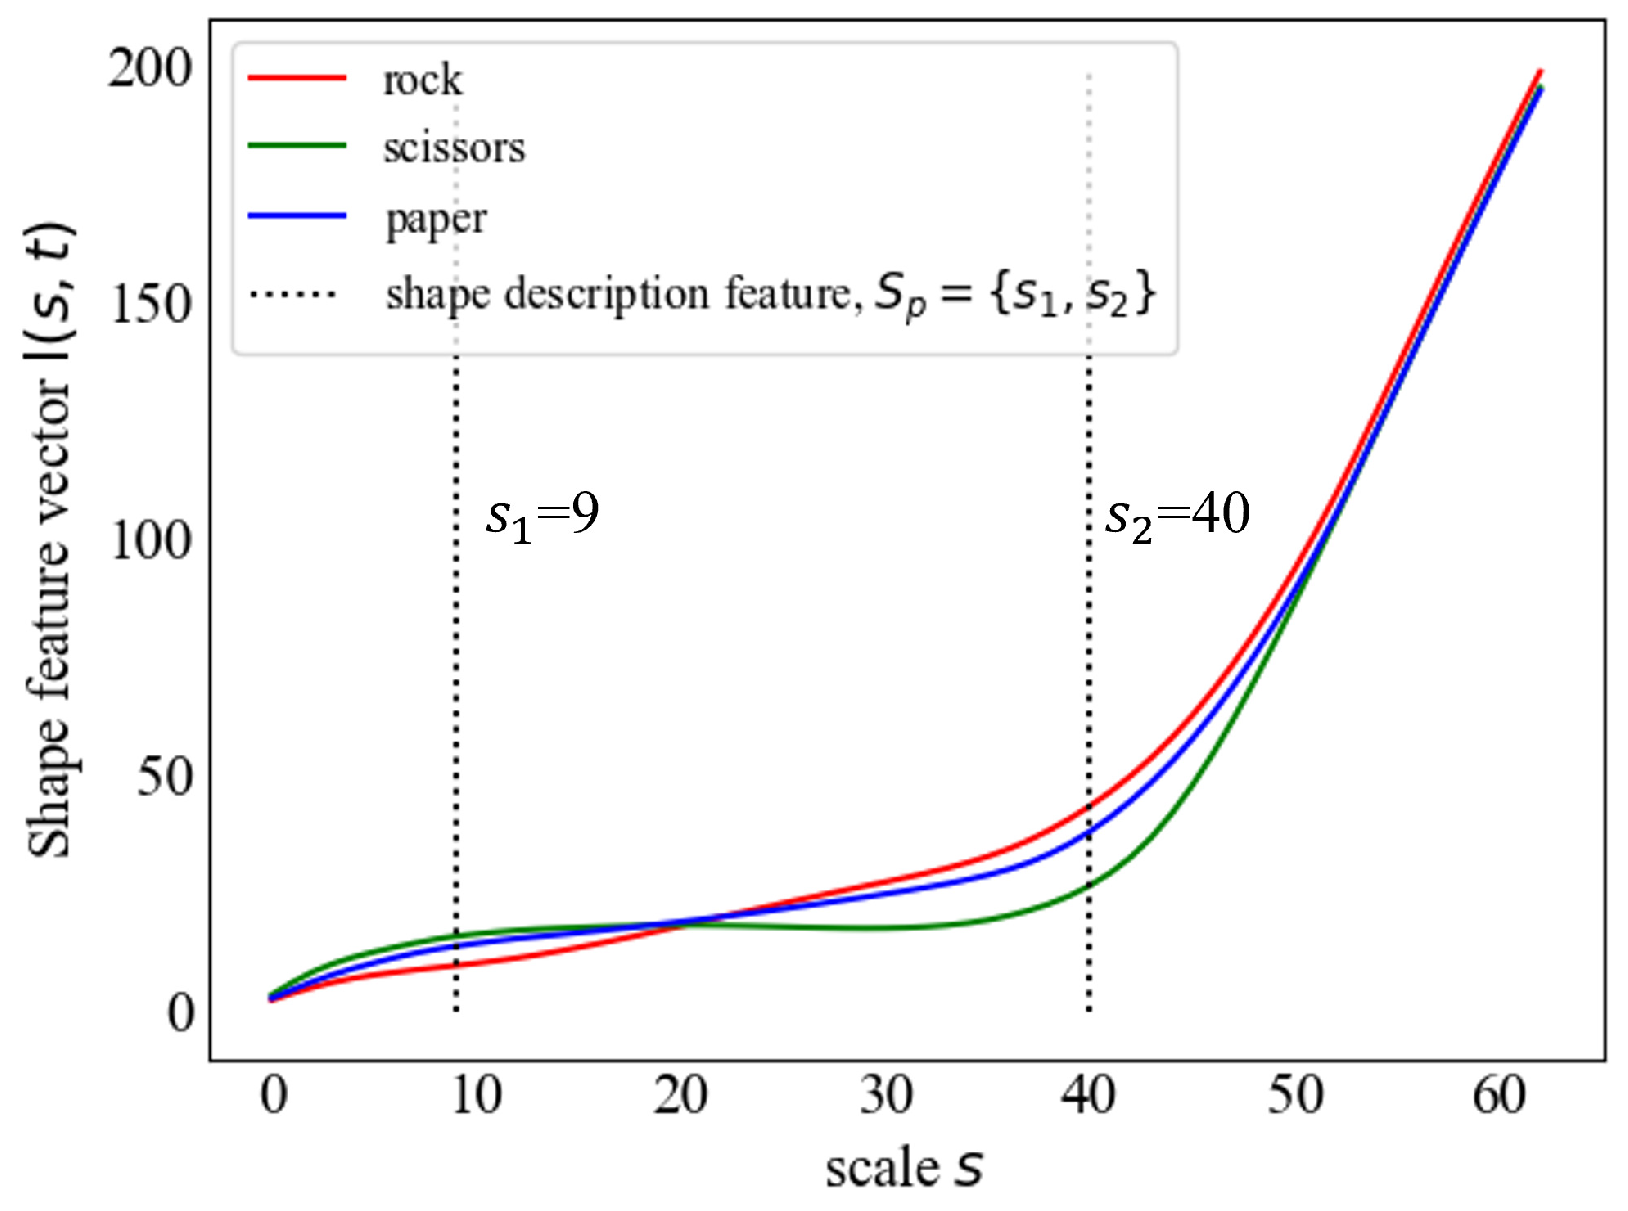
Shape Feature Vectors of Different Shape

The experiment results in Section 3.1 show that the proposed method is able to represent the features of the shape. The method lacks the perfect restoration property of the wavelet inverse transform due to the summation used to compute the features. However, the features can represent the characteristics of the shape because they are a convenient transformation of the wavelet coefficients, which exhibit a unique relation between the shape and the wavelet coefficients. Figure 10 shows an example of the same shape feature vectors for two different shapes. The maximum difference of each element of the shape feature vectors of the two images is 0.68, and the F-test yielded a non-significant result (p > 0.01).
As a measure to improve this limitation, weighting the wavelet coefficients during the integration is considered an effective approach.
When the shape feature vectors of the circles were compared with reference to the ellipse, a clear difference was observed: the high-frequency component decreased, and the low-frequency component increased. As shown in Figure 5b, this change is attributed to the decrease in the high-frequency component that constitutes the short side of the ellipse and the increase in the component with a scale corresponding to the diameter of the circle. Thus, the capability to describe the shapes of two different objects in terms of frequency components indicates that the proposed method is effective in characterizing the shapes.

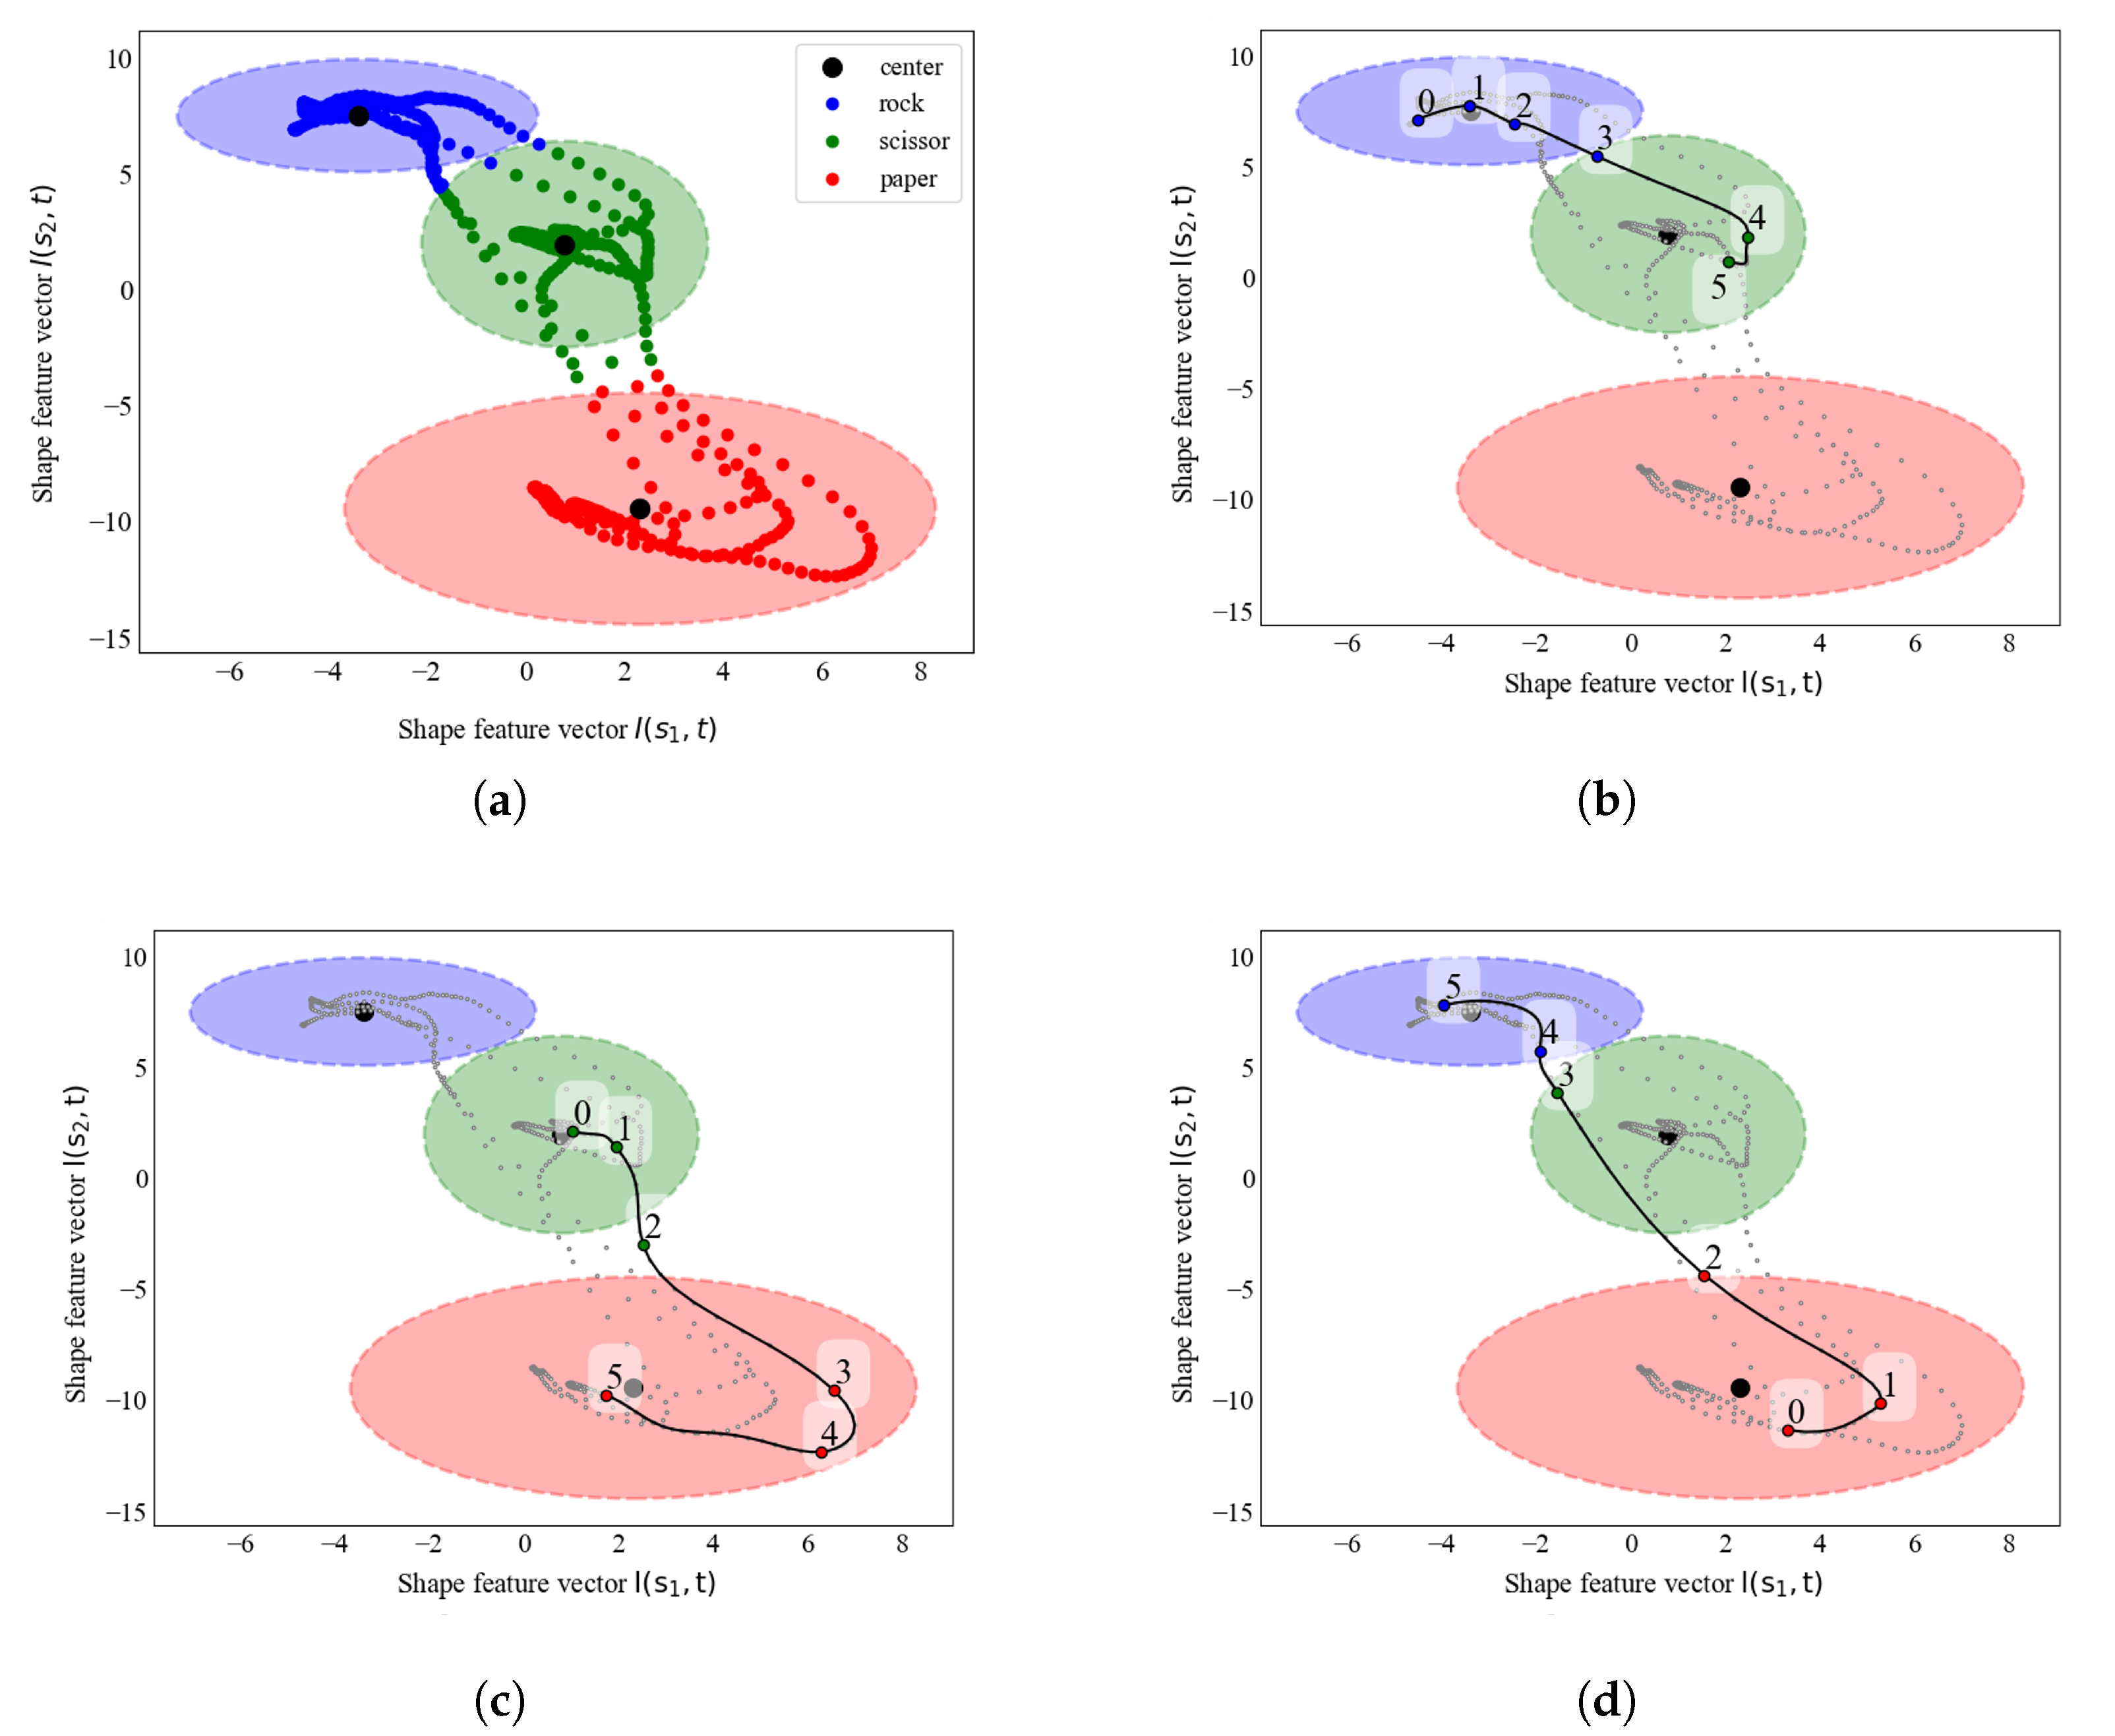
4.2. Rotation-Invariant and Translation-Invariant Shape Feature Vectors

Section 3.2 and Section 3.3 report maximum elemental differences in the shape feature vectors of 0.08 and 0.13, respectively. This is substantially smaller than the experimental result of 3.42 shown in Section 3.1. These results indicate that the extracted feature vectors are highly invariant to shape rotations and translations. This invariance is achieved by averaging the wavelet coefficients. Because the wavelet transform captures local features of the shape, the distribution of the wavelet coefficients changes with rotation and translation.
Conversely, by averaging the wavelet coefficients, these variations are canceled out, and the global features of the shape are extracted. The slight inconsistencies observed are thought to be due to factors such as image resolution limitations, changes in the position and number of pixels composing the shape during rotation and translation, and changes in the distance relationship between image edges and object edges. However, these differences are negligible compared with the shape difference between a circle and an ellipse and do not pose a practical issue for the shape discrimination applications intended in this study. If this error is unacceptable for more detailed shape discrimination, these problems can be mitigated by techniques such as increasing image resolution, applying window functions, or performing circular clipping of images.
Therefore, the method proposed in this study enables the description of shape feature vectors that are invariant to both rotation and translation. This is an important aspect for many applications in image retrieval and object recognition, and we were able to design features that satisfy rotation-invariant and translation-invariant properties with a simple process.

4.3. Application

Recognition of Multiple Shapes Using Shape Feature Vector

This section presents shape discrimination using shape feature vectors. If the elements of the shape feature vectors at a certain scale differ significantly from each other throughout the time series or the entire dataset, it is possible to capture the differences in shape by comparing the elements of the shape feature vectors at that scale. Therefore, the shape feature vectors are an important indicator for shape discrimination. Consequently, we extract from the shape feature vectors the features of the scale that especially show significant differences among the shapes, and perform shape discrimination. This operation condenses the data features, enabling effective shape classification despite the low-dimensional representation. The scale at which the shape feature vectors fluctuate significantly when the shape changes is defined as the shape description feature.
To quantitatively evaluate this shape description feature, this study employs the wavelet variance, denoted as σ 2 ( s ) , which is calculated based on the temporal variation of the shape feature vector. The wavelet variance σ 2 ( s ) serves as an index representing the dispersion of shape feature vectors at each scale, and its calculation method is expressed by the following equation:
σ 2 ( s ) = 1 T t = 0 T ( I ( s , t ) μ ( s ) ) 2
Here, μ ( s ) represents the average of the shape feature vectors at each scale, and it is calculated using the following equation:
μ ( s ) = 1 T t = 0 T I ( s , t )
In these equations, s denotes the scale parameter, t is the variable representing the image number, and T corresponds to the total number of images. By utilizing wavelet variance, it becomes possible to identify scales that are highly sensitive to changes in shape, thereby enabling the extraction of effective features for shape discrimination.
Furthermore, when the wavelet variance is arranged for each scale, scales exhibiting a relatively large wavelet variance compared with others are extracted as shape description features. A characteristic of wavelet variance is that its value tends to increase with higher scales. Consequently, extracting only the scale with the maximum wavelet variance might fail to capture essential low-scale information necessary for shape discrimination. Therefore, scales possessing a local maximum, which represents a peak in the wavelet variance across scales, are extracted as shape description features. S p represents the shape description feature, and it is calculated using the following equation:
S p = s d d s ( σ 2 ( s ) ) = 0 , d 2 d s 2 ( σ 2 ( s ) ) < 0
Then, clustering using S p creates a scale space in which shape discrimination is possible.
The shape discrimination of the hand signs in the video is performed according to these procedures. The video used in the experiment is constructed based on the transitions of rock–paper–scissors hand signs. Figure 11 shows some of the transitions. The number written at the bottom of each image is the frame number. The video covers each of the three hand-sign combinations and transitions. The frame rate is 30 fps, the number of frames is 550, and the distance between the hand and the camera is constant throughout the video. All of the images are of the same person’s hands, and all fingers are captured so that they fit in the frame. The wavelet variance was computed up to a scale of 63 to extract the frequency components corresponding to half of the image width.
Figure 12 shows the change in wavelet variance. The shape description feature is indicated by the vertical line in this figure. Figure 13 shows the variation in wavelet variance at each scale. The shape feature vectors for all frames are distributed by scale, and the wavelet variance represents the distribution of shape features for each scale across the entire dataset, including the three gestures. The shape description features 9 and 40 were extracted. The red band in Figure 13 shows rock, green shows scissors, and blue shows paper. The difference between scale 9 and scale 40 is smaller in the scissors state than in the other states, and in the paper state, scale 9 has a larger value and scale 40 has a smaller value. As shown above, the shape feature vectors extracted by the proposed method show similar patterns for the same shape regardless of the passage of time. The smaller shape description feature corresponds to the finger joint width, while the larger scale corresponds to the palm length. This confirms that the scale corresponding to the number of fingers and whether the palm is open or not was automatically extracted as a necessary feature to discriminate the rock–paper–scissors hand signs. In this case, palm length scale discrimination is binary, whereas finger discrimination is multi-class. The more classes there are of the shape to be discriminated, the more the shape description feature must be increased. Otherwise, the possibility of passing through a class that is not the destination or source of the deformation will increase, causing misclassification. Therefore, when discriminating n classes of shapes, the stability of accuracy depends on whether the number of shape description features selected is greater than [ n ] .
The values of the shape feature vectors corresponding to the shape description feature were used to perform a three-class classification using the k-means method. The clustering results yield the centers and variances of each class. Figure 14 shows the representative shape feature vectors for each class.
Therefore, the difference between the representative values of each class at the points of the shape description feature is larger, and it is reasonable to use the value of the shape description feature in shape discrimination.
Figure 15 shows these class centers (black dots), the distribution of shape feature vectors in the space around the shape description feature, and the distribution range of each class (colored ellipses: within-class mean ± 3 × within-class standard deviation). This ellipse corresponds to the range containing approximately 99.7% of the data, assuming that the data follows a normal distribution. The numbers in the figure correspond to the frame number.
Since two shape description features were extracted in this study, the x and y axes represent the corresponding shape description feature of shape feature vectors. In Figure 13, multiple time intervals are indicated as color-coded bands along the time axis. In contrast, Figure 15 shows ellipses of the same colors plotted in the feature space, each representing the distribution of the parameters during the corresponding time interval in Figure 13. In other words, each color band in Figure 13 corresponds one-to-one with a colored ellipse in Figure 15, providing a visual representation of the relationship between temporal changes and the behavior in the feature space. Since two shape description features were extracted in this study, the x and y axes represent the shape feature vectors of the corresponding shape description features. Figure 15d captures the transition of the shape feature vectors in Figure 11a (transition from rock to scissors), Figure 11b (transition from scissors to paper), and Figure 11c (transition from paper to rock), respectively. In the figure, blue represents the rock, green the scissors, and red the paper class. The number of each label in Figure 11a–c corresponds to the number in Figure 15b–d.
In the clustering results, transient class transitions, such as those occurring during shape change transitions, which passed through other classes, were excluded in the post-processing phase. Subsequently, when the clustering results obtained through visual inspection were used as the truth data, the clustering accuracy of the proposed method was found to be 100% across all transitions.
Therefore, by classifying the shape feature vectors based on the scale at which the differences between shapes are large, shape discrimination can be achieved with a low dimensionality.
For comparison, we also performed shape discrimination using Hu moments, which are classical shape descriptors with translation, rotation, and scale invariance. 84% of the features extracted from Hu moments were classified into three classes by the k-means method, as in the proposed method. In particular, the low-frequency components, such as “rock” and “scissors” in rock–paper–scissors, did not change significantly, and the Hu moments tended to be insufficient to distinguish between classes with different finger shapes. This may be attributed to the fact that while Hu moments are superior in capturing global shape characteristics, they have less discriminative power for local and detailed shape changes, such as the number of fingers. The proposed method can capture both the local finger shape (scale corresponding to joint width) and the global palm shape (scale corresponding to palm length) as shape description features by taking advantage of the multi-scale nature of the wavelet transform, and thus has higher discriminative power than the Hu moments.
In addition, the movement of the shape feature vectors during the transition of each hand sign showed that the transition from rock to paper, as shown in Figure 11c, was often traced through the class of scissors. This indicates that the transition occurs not by a direct change between the shapes of rock and paper in the shape space but by passing through a shape similar to the scissors once. Therefore, it is suggested that the natural movement of the human hand deformation can be recognized as a deformation transition.

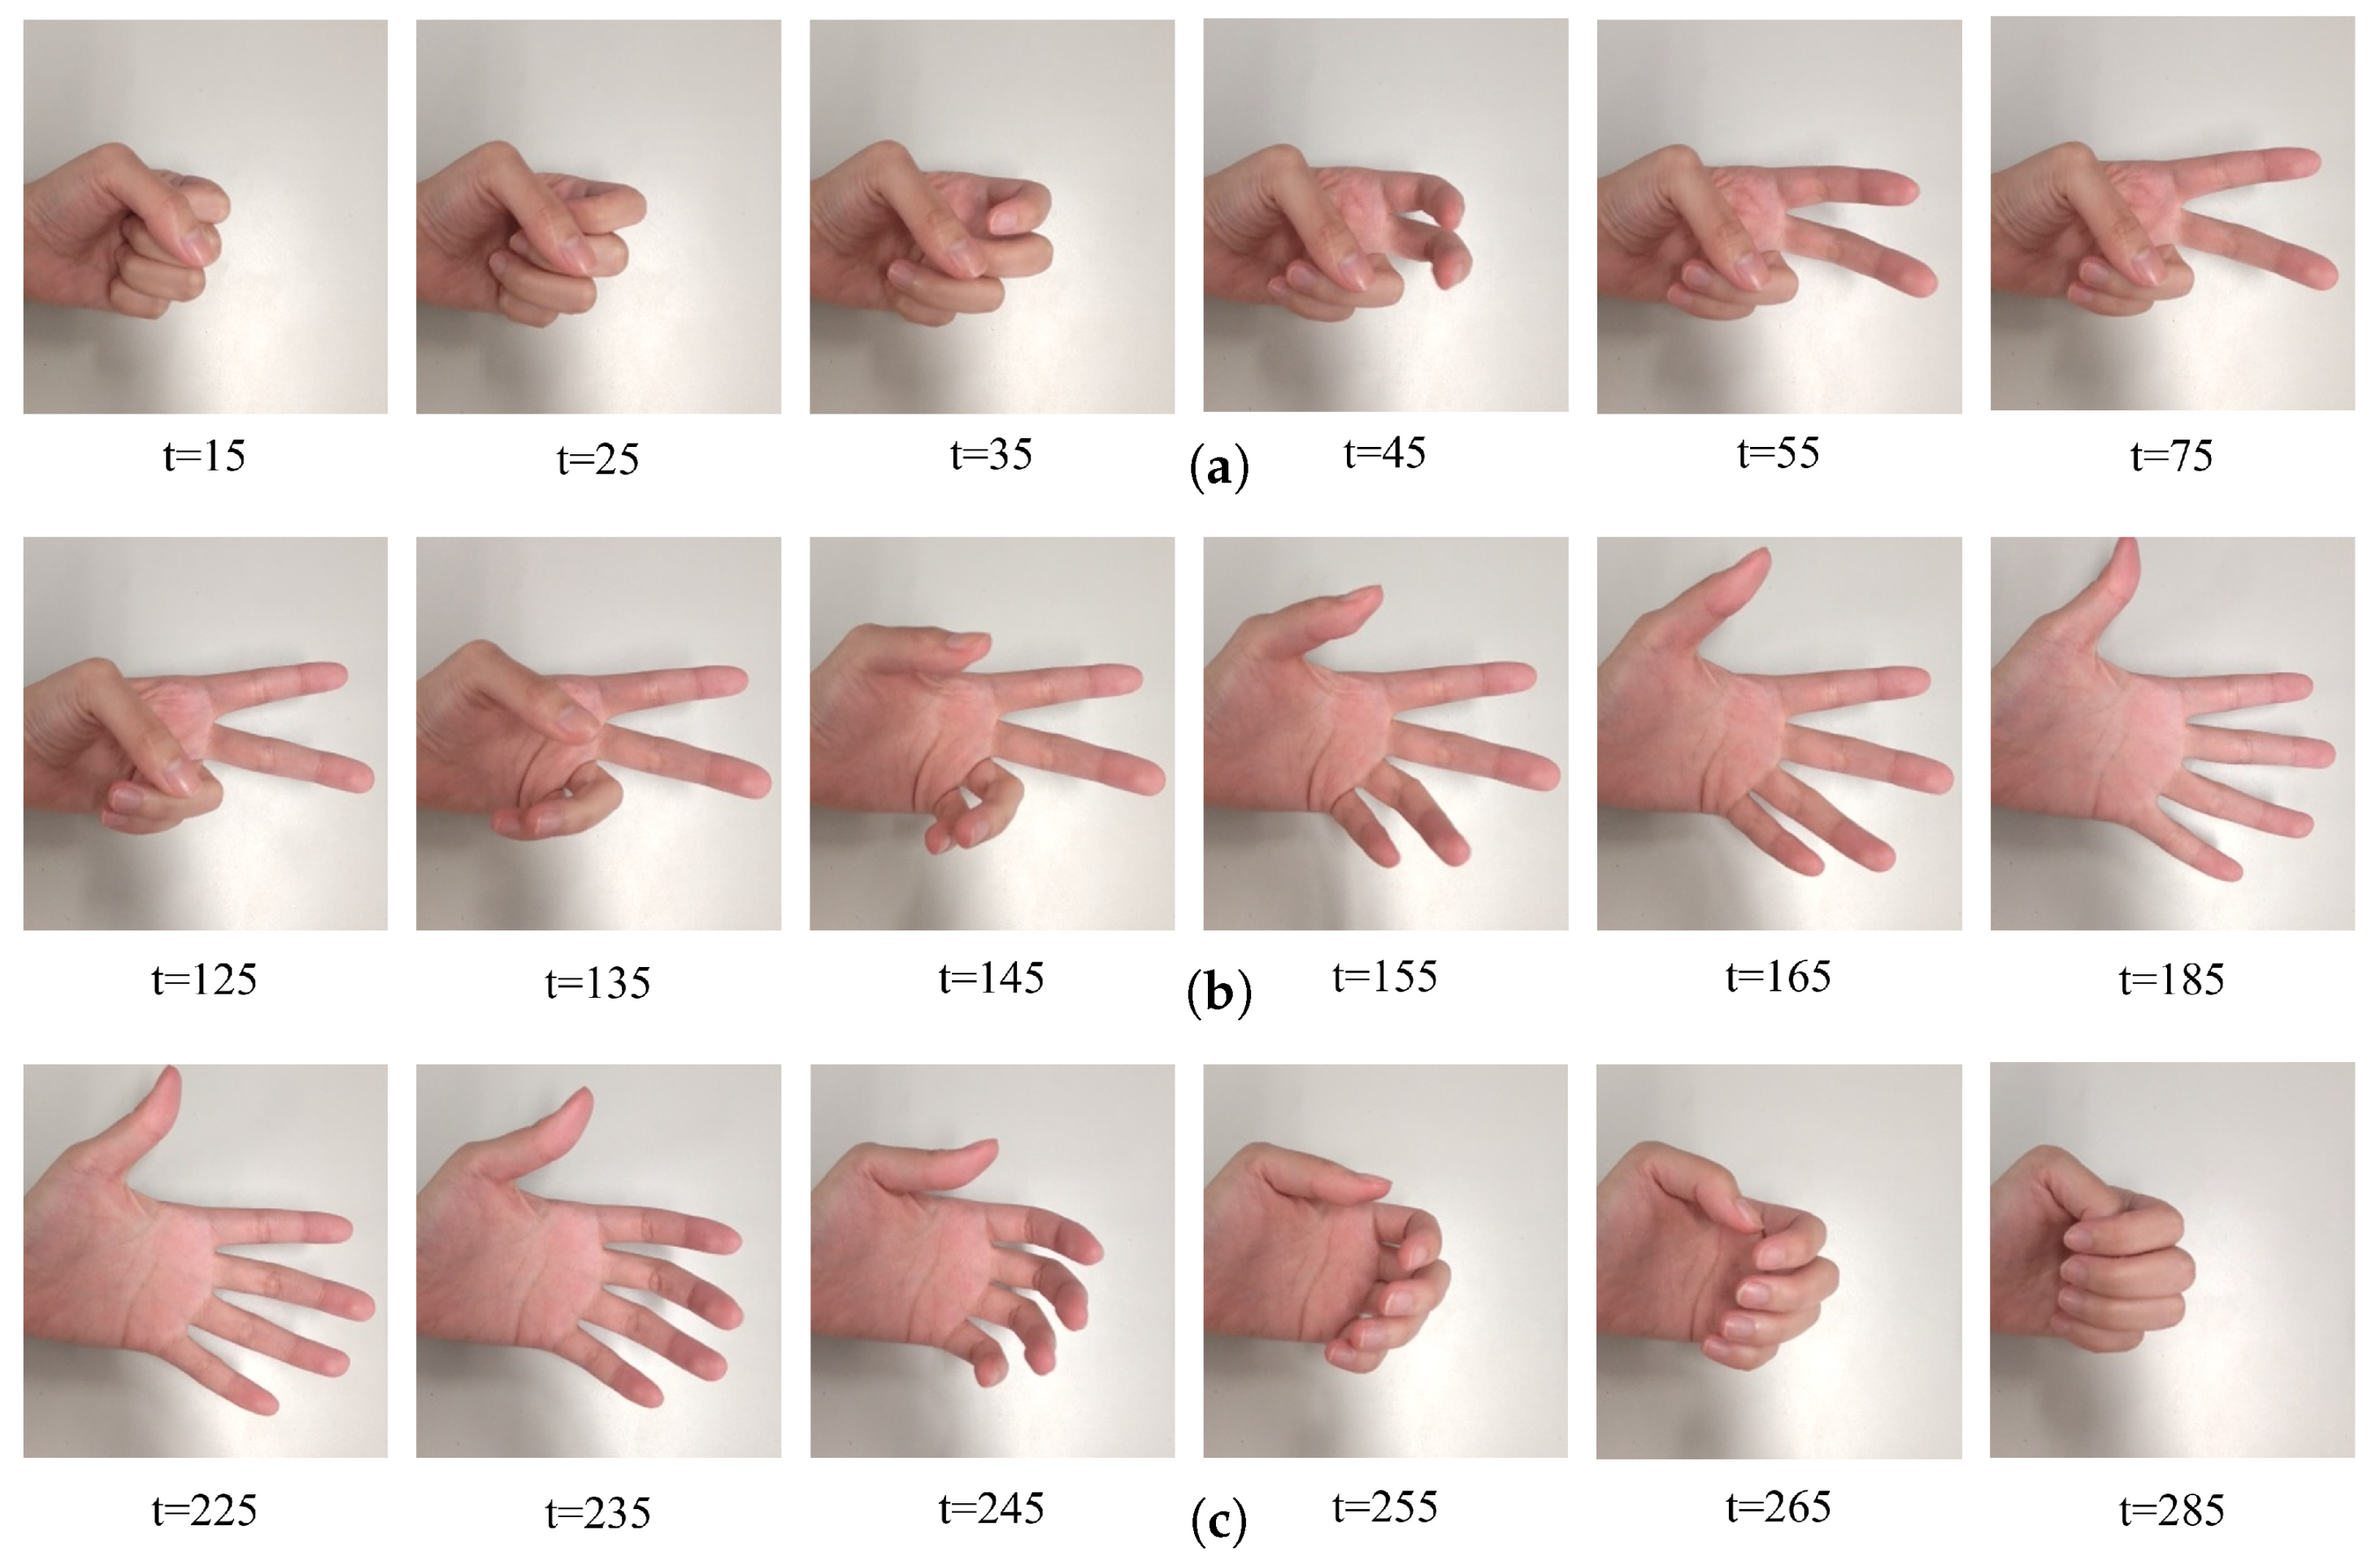
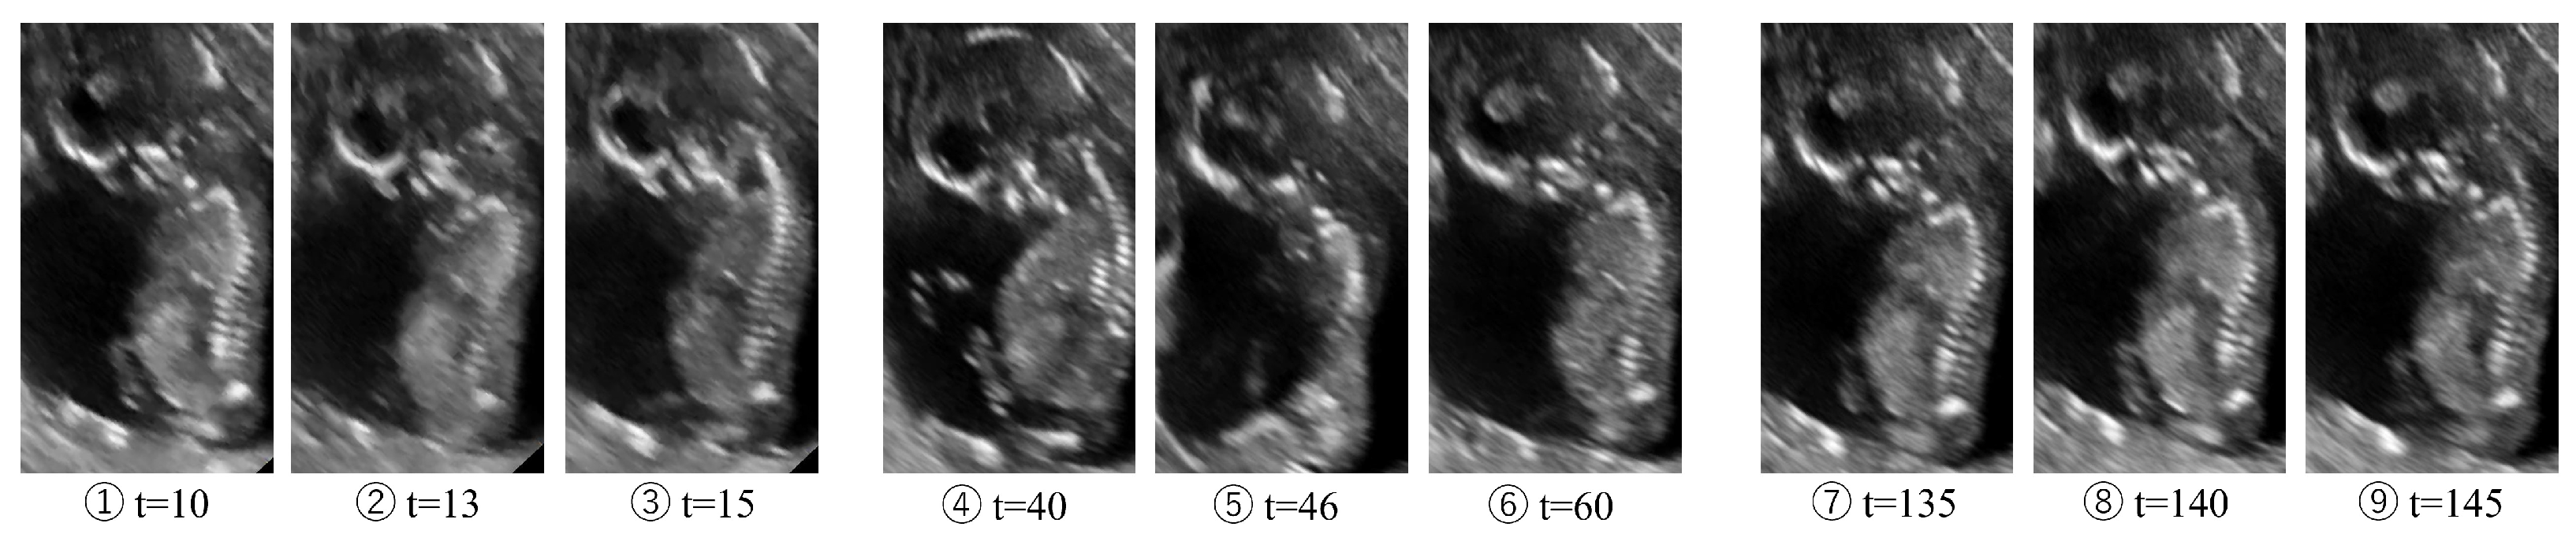
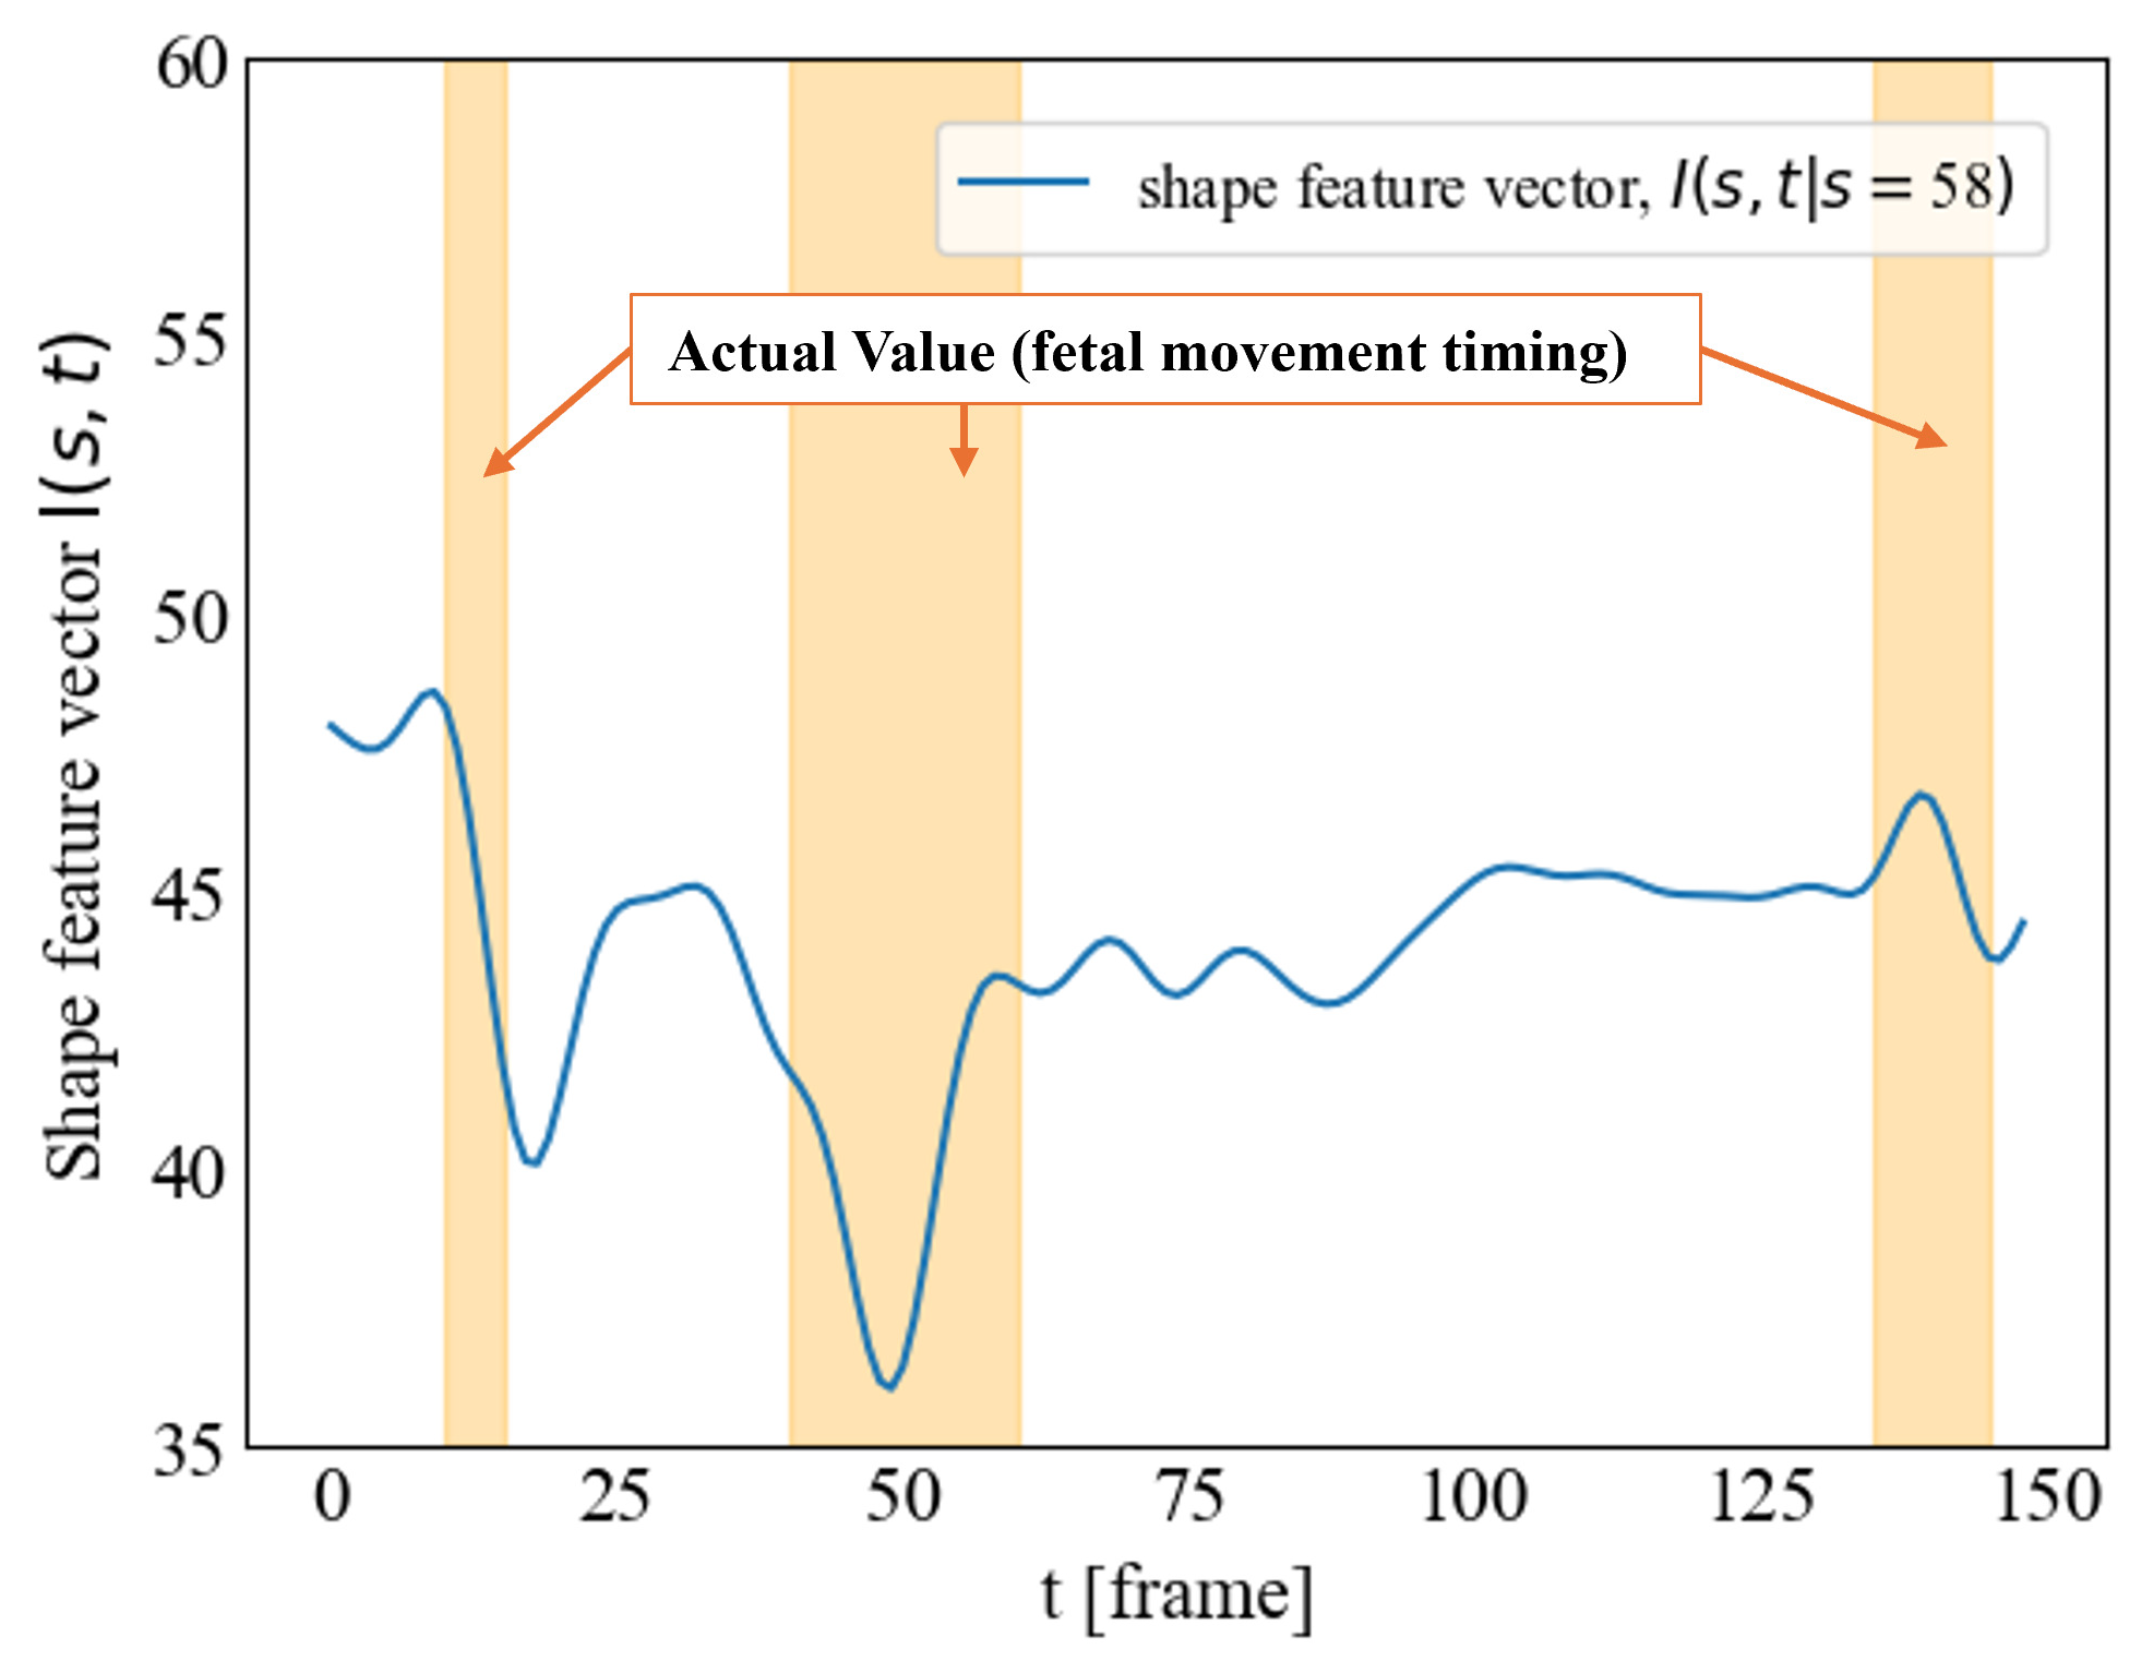
4.4. Application: Intensity of Deformation Estimation

This section details the application of shape feature vectors for shape discrimination. The magnitude of changes in shape feature vectors reflects alterations in the frequency components inherent to a shape. Furthermore, the rate of change in shape variations is considered to be indicative of the extent of deformation. Fetal movement monitoring is a crucial application where quantifying the magnitude of deformation is paramount. Fetal movement serves as a significant indicator of fetal well-being. Studies have demonstrated that women experiencing decreased fetal movements (DFMs) are at an elevated risk of stillbirth and intrauterine growth restriction [22]. While often assessed by the mother, individual variations in proprioceptive ability can lead to discrepancies in maternal perception of fetal movement (FM). Consequently, accelerometer-based and pressure sensor-based fetal movement measurement techniques have been explored [23,24,25,26]. However, these sensor-based approaches are susceptible to noise from respiration and maternal motion. To address this limitation, we propose utilizing shape feature vectors for fetal movement detection, employing fetal ultrasound videos.
Deformation of uncertain shapes is a spatiotemporal phenomenon, encompassing both the shape’s change over time (velocity) and alterations in its spatial frequency content, which reflect changes in local features and details. Our wavelet-based shape feature vectors, capturing spatial characteristics across different scales, are designed to represent this spatiotemporal nature. The temporal evolution of the shape feature vectors at each scale directly reflects the extent of deformation occurring at that specific scale. Specifically, when a shape remains static, the values within the shape feature vectors for each scale exhibit minimal fluctuation over time. Conversely, significant deformations are accompanied by pronounced alterations in these vector values. Consequently, we quantify the magnitude of deformation by measuring the rate of change of the shape feature vectors over time. To quantify the magnitude of deformation, denoted as M ( S p , t ) , The derivative of the shape feature vectors is calculated using the following equation:
M ( S p , t ) = { | Δ I ( s 1 , t ) | , , | Δ I ( s n , t ) | }
Here, n represents the total number of scales. This method can be used to estimate the magnitude of deformation.
We use a shape description feature to quantify the timing and intensity of fetal movements from the ultrasound video. The video dataset used in this application is an ultrasound video where the sagittal plane of the fetus is consistently captured, including forward and backward bending, as shown in Figure 16. The number written at the bottom of each image is the frame number. However, to reduce the influence of background changes caused by the movement of the mother’s fetus itself, the fetal region is cropped using the Oriented Bounding Box (OBB) in YoLo v8. Furthermore, only the center coordinates and angle of the bounding box are updated based on the predetermined image size to ensure that the image size does not change from frame to frame. The frame rate was 15 fps with 150 frames. Fetal movements occurred around 10–15 frames, 40–60 frames, and 135–145 frames. The fetus is 20 weeks, the sagittal plane is shown, and the head and torso are large in all frames, with some extremities. We define fetal movement as a change in forward and backward bending and analyze the timing and intensity of fetal movement based on this definition.
Figure 17 shows the change in wavelet variance. Wavelet variance was calculated up to scale 93 to extract frequency components corresponding to half the image width. The shape description features are indicated by the vertical line in this figure. As a result of this analysis, scale 58 was extracted as a shape description feature.
Scale 58 corresponds to the antero-posterior trunk diameter of the fetus and is the scale that best captures the variability in shape accompanying fetal posture changes. This substantiates that scale 58 was automatically extracted as a feature that significantly contributes to the discrimination of fetal neutral posture and flexed posture. Figure 18 shows the shape feature vector I ( s , t | s = 58 ) at the shape description feature scale. As seen from this figure, the extracted shape feature vector significantly increases and decreases during fetal movement occurrence, indicated by the orange band.
Using the shape feature vector value at shape description feature scale 58, we performed a two-class classification using the k-means method. As a result of this clustering, the center and variance in each class were obtained. Figure 19 shows the shape feature vector that is the representative value for each class. Each corresponds to each posture in the ground truth, and it is confirmed that typical shape features for each posture are captured. Figure 20 shows these class centers (black dotted line), the distribution of the shape feature vectors in the space near the shape description feature, and the distribution range of each class (normal distribution: within-class mean ± 3 × within-class standard deviation). The blue distribution shows the range of the neutral posture, suggesting that the likelihood of the captured shape being a neutral posture decreases as it deviates from the blue distribution.
From the results above, it is confirmed that the shape feature vectors appropriately reflect the two postures, neutral posture and flexed posture, and are useful for posture estimation. In particular, it was confirmed that the obtained representative values correspond to the postures during the time of no fetal movement (neutral posture) and the time of fetal movement occurrence (flexed posture), and that each posture captures the presence or absence of fetal movement. However, such discrete posture discrimination methods have a limitation in that they cannot completely capture uncertain and ambiguous movements of uncertain shapes, such as fetal posture changes within ultrasound videos, or deformations where the shape changes significantly within the same class. To quantify continuous deformations and ambiguous movements of uncertain shapes, we attempted to introduce the magnitude of deformation M ( s , t ) . Figure 21 shows the results. The orange band in the figure represents the fetal movement occurrence time.
The results were normalized and subsequently processed using a 0.1 Hz low-pass filter. The orange area in the figure indicates the time of onset of fetal movement. The red horizontal lines in the figure represent values that are 3 standard deviations from the mean of M ( s , t ) , indicating that data points exceeding these lines lie outside the approximately 99.7% range of the overall distribution. The black dotted line indicates the frame number of the image shown in Figure 16.
In Figure 21, for instance, we observed changes in the value even during time periods not exceeding the red line. This suggests the possibility of detecting time periods corresponding to small deformations (e.g., intra-class movement) that do not involve large inter-class transitions. Such subtle deformations are undetectable by discrete shape discrimination and represent an advantage achieved precisely by calculating the continuous magnitude of deformation.
As shown below, the intensity of the deformation increases near the onset of fetal movement, indicating that the intensity of fetal movement can be estimated. It is also clear that the time of onset of fetal movement can be detected because the timing of the fetal movement can be said to be the timing when the magnitude of the deformation is large. Based on these results, it is clear that shape change recognition can be performed using shape feature vectors. This study was conducted on images in which the shape of the fetus was always visible, but for practical use, features that can be interpolated even if the majority of the fetus is not visible are required.

5. Conclusions

This study proposed a wavelet-based spatiotemporal feature extraction method for recognizing uncertain shapes and their deformations. The method integrates wavelet coefficients across multiple scales to construct shape feature vectors that are robust against geometric transformations.
To validate the proposed method, we conducted experiments evaluating its ability to differentiate between distinct shapes and its robustness to geometric transformations. The results show that the extracted shape feature vectors successfully distinguished an ellipse from a circle, with a statistically significant difference (p < 0.01). Furthermore, the method exhibited strong stability under rotation and translation, with maximum differences of 0.08 and 0.13, respectively, in the shape feature vector.
These findings highlight the effectiveness of wavelet-based features in handling shape uncertainty, making the proposed method particularly suitable for applications where conventional shape recognition techniques struggle with variability and deformation.
Future research will focus on extending this method to more complex and dynamic shape deformations and validating its effectiveness in real-world applications, such as medical image analysis and human motion tracking. Similarly, the inverse problem of estimating the shape itself from the extracted shape features will be the subject of future research. Further research will explore automatic parameter optimization and adaptation to real-time processing, ensuring broader applicability in various fields.

Author Contributions

Conceptualization, H.M., T.K. and T.T.; methodology, H.M.; application and experiment, K.S.; writing—original draft preparation, H.M.; writing—review and editing, T.K. and T.T.; supervision, T.T. All authors have read and agreed to the published version of the manuscript.

Funding

This research received no external funding.

Data Availability Statement

The original contributions presented in this study are included in the article. Further inquiries can be directed to the corresponding author.

Conflicts of Interest

The authors declare no conflicts of interest.

Appendix A

Algorithm A1 Wavelet-Based Shape Feature Extraction
  • Require:
    • Grayscale 2D image i m g of size H × W .
    • s M a x is maximum value of scale to be explored.
  • Ensure: Shape feature vector I of mean convolution responses across scales.
    1:
    function  mexicanHatKernel( p , s )
    2:
        Let x = x / s and y = y / s .
    3:
         ψ ( p , s ) 1 s 2 2 π 0.5 · 1 ( x ) 2 + ( y ) 2 2 exp ( ( x ) 2 + ( y ) 2 ) 2
    4:
        return  ψ ( p , s )
    5:
    end function
    6:
     
    7:
    function extractMultiScaleFeatures( i m g )
    8:
        Let H , W be the height and width of image i m g .
    9:
        Define the coordinate grid G = { ( x , y ) x { ( W / 2 1 ) , , W / 2 } , y { ( H / 2 1 ) , , H / 2 } } .
    10:
        Initialize feature vector I [ ] .
    11:
        Define the set of scales S = { 1 , 2 , , s M a x } .
    12:
      
    13:
        for each scale s S  do
    14:
             K s [ i , j ] = mexicanHatKernel ( g i , j , s ) for g i , j G .
    15:
      
    16:
            Let C s = i m g K s // C s be the convolution of image i m g with kernel K s .
    17:
      
    18:
            Let m s = 1 H · W i = 0 H 1 j = 0 W 1 | C s [ i , j ] |
    19:
      
    20:
             Append ( I , m s )
    21:
        end for
    22:
        return  I
    23:
    end function

References

  1. Linardakis, M.; Varlamis, I.; Papadopoulos, G.T. Survey on Hand Gesture Recognition from Visual Input. arXiv 2025, arXiv:2501.11992. [Google Scholar] [CrossRef]
  2. Lai, J.; Nowlan, N.C.; Vaidyanathan, R.; Shaw, C.J.; Lees, C.C. Fetal movements as a predictor of health. Acta Obstet. Gynecol. Scand. 2016, 95, 968–975. [Google Scholar] [CrossRef] [PubMed]
  3. Belongie, S.; Malik, J.; Puzicha, J. Shape matching and object recognition using shape contexts. IEEE Trans. Pattern Anal. Mach. Intell. 2002, 24, 509–522. [Google Scholar] [CrossRef]
  4. Yan, X.; Ai, T.; Zhang, X. Template Matching and Simplification Method for Building Features Based on Shape Cognition. ISPRS Int. J. Geo-Inf. 2017, 6, 250. [Google Scholar] [CrossRef]
  5. Hummel, J.E.; Biederman, I. Dynamic binding in a neural network for shape recognition. Psychol. Rev. 1992, 99, 480–517. [Google Scholar] [CrossRef]
  6. Osowski, S.; Nghia, D.D. Fourier and wavelet descriptors for shape recognition using neural networks—A comparative study. Pattern Recognit. 2002, 35, 1949–1957. [Google Scholar] [CrossRef]
  7. Mahmud, H.; Hasan, M.K.; Tariq, A.A.; Mottalib, M. Hand Gesture Recognition Using SIFT Features on Depth Image. In Proceedings of the The Ninth International Conference on Advances in Computer-Human Interactions, Venice, Italy, 24–28 April 2016. [Google Scholar]
  8. Piccinini, P.; Prati, A.; Cucchiara, R. Real-time object detection and localization with SIFT-based clustering. Image Vis. Comput. 2012, 30, 573–587. [Google Scholar] [CrossRef]
  9. Poetro, B.S.W.; Maria, E.; Zein, H.; Najwaini, E.; Zulfikar, D.H. Advancements in Agricultural Automation: SVM Classifier with Hu Moments for Vegetable Identification. Indones. J. Data Sci. 2024, 5, 15–22. [Google Scholar] [CrossRef]
  10. Al-Razgan, M.; Ali, Y.A.; Awwad, E.M. Enhancing Fetal Medical Image Analysis through Attention-guided Convolution: A Comparative Study with Established Models. J. Disabil. Res. 2024, 3, 20240005. [Google Scholar] [CrossRef]
  11. Murray, K.T. Recurrent networks recognize patterns with low-dimensional oscillations. arXiv 2023, arXiv:2310.07908. [Google Scholar] [CrossRef]
  12. Bronstein, M.M.; Bruna, J.; Cohen, T.; Veličković, P. Geometric Deep Learning: Grids, Groups, Graphs, Geodesics, and Gauges. arXiv 2021, arXiv:2104.13478. [Google Scholar] [CrossRef]
  13. Yan, X.; Lin, L.; Mitra, N.J.; Lischinski, D.; Cohen-Or, D.; Huang, H. ShapeFormer: Transformer-based Shape Completion via Sparse Representation. arXiv 2022, arXiv:2201.10326. [Google Scholar] [CrossRef]
  14. Jaderberg, M.; Simonyan, K.; Zisserman, A.; Kavukcuoglu, K. Spatial Transformer Networks. arXiv 2016, arXiv:1506.02025. [Google Scholar] [CrossRef]
  15. Maraci, A.; Napolitano, R.; Papageorghiou, A.; Noble, J. Object Classification in an Ultrasound Video Using LP-SIFT Features. In Proceedings of the Medical Computer Vision: Algorithms for Big Data: International Workshop, MCV 2014, Cambridge, MA, USA, 18 September 2014; Springer: Cham, Switzerland, 2014. [Google Scholar] [CrossRef]
  16. Jimoh, K.O.; Ajayi, A.O.; Ogundoyin, I.K. Template Matching Based Sign Language Recognition System for Android Devices. FUOYE J. Eng. Technol. 2020, 5. [Google Scholar] [CrossRef]
  17. Gil Jiménez, P.; Bascón, S.M.; Moreno, H.G.; Arroyo, S.L.; Ferreras, F.L. Traffic sign shape classification and localization based on the normalized FFT of the signature of blobs and 2D homographies. Signal Process. 2008, 88, 2943–2955. [Google Scholar] [CrossRef]
  18. Liu, X.; Li, C.; Tian, L. Hand Gesture Recognition Based on Wavelet Invariant Moments. In Proceedings of the 2017 IEEE International Symposium on Multimedia (ISM), Taichung, Taiwan, 11–13 December 2017; pp. 459–464. [Google Scholar] [CrossRef]
  19. Antoine, J.P.; Barachea, D.; Cesar, R.M.; da Fontoura Costa, L. Shape characterization with the wavelet transform. Signal Process. 1997, 62, 265–290. [Google Scholar] [CrossRef]
  20. Wang, C.H.; Liu, X.L. Study of object recognition with GPR based on STFT. In Proceedings of the 2018 17th International Conference on Ground Penetrating Radar (GPR), Rapperswil, Switzerland, 18–21 June 2018; pp. 1–4, ISSN 2474-3844. [Google Scholar] [CrossRef]
  21. Amolins, K.; Zhang, Y.; Dare, P. Wavelet based image fusion techniques—An introduction, review and comparison. ISPRS J. Photogramm. Remote Sens. 2007, 62, 249–263. [Google Scholar] [CrossRef]
  22. Frøen, J.F.; Heazell, A.E.P.; Tveit, J.V.H.; Saastad, E.; Fretts, R.C.; Flenady, V. Fetal Movement Assessment. Semin. Perinatol. 2008, 32, 243–246. [Google Scholar] [CrossRef]
  23. Mesbah, M.; Khlif, M.S.; East, C.; Smeathers, J.; Colditz, P.; Boashash, B. Accelerometer-based fetal movement detection. In Proceedings of the 2011 Annual International Conference of the IEEE Engineering in Medicine and Biology Society, Boston, MA, USA, 30 August–3 September 2011; pp. 7877–7880, ISSN 1558-4615. [Google Scholar] [CrossRef]
  24. Xu, J.; Zhao, C.; Ding, B.; Gu, X.; Zeng, W.; Qiu, L.; Yu, H.; Shen, Y.; Liu, H. Fetal Movement Detection by Wearable Accelerometer Duo Based on Machine Learning. IEEE Sens. J. 2022, 22, 11526–11534. [Google Scholar] [CrossRef]
  25. Manikandan, K.; Shanmugan, S.; Ashishkumar, R.; Venkat Harish, V.; Jansi Rani, T.; Nishanthi, T. Trans membranous fetal movement and pressure sensing. Mater. Today Proc. 2020, 30, 62–68. [Google Scholar] [CrossRef]
  26. Sterman, M.B. Relationship of intrauterine fetal activity to maternal sleep stage. Exp. Neurol. 1967, 19, 98–106. [Google Scholar] [CrossRef] [PubMed]
Figure 1. The overall flow of the proposed method, where s 0 < s 1 < s 2 .
Electronics 14 02131 g001
Figure 2. Mexican hat mother wavelet. (a) shows a two-dimensional representation as the 1D-kernel of the wavelet and (b) shows a three-dimensional representation as the 2D-kernel. This study uses the 2D-kernel for analyzing images.
Electronics 14 02131 g002
Figure 3. Schematic of translation-invariant and rotation-invariant shape feature extraction. The red, green, and blue boxes indicate, respectively, that the target is located at the center of the kernel, the kernel is rotated, and the target is not aligned with the center.
Electronics 14 02131 g003
Figure 4. Two types of shapes are used for the basic analysis of shape representation. (a,b) illustrate the target shape of an ellipse and a circle, respectively.
Electronics 14 02131 g004
Figure 5. Shape feature vectors for each shape and their difference. (a) displays the shape feature vectors of an ellipse and a circle, represented by blue and red lines, respectively. (b) illustrates the difference in shape feature vectors between the two shapes.
Electronics 14 02131 g005
Figure 6. The target shapes used to analyze the effects of target rotations. (a,b) illustrate a normal ( 0 ° ) and a rotated ( 45 ° ) ellipse, respectively.
Electronics 14 02131 g006
Figure 7. Shape feature vectors and their difference for analyzing the effects of target rotation. (a) displays the shape feature vectors of a normal ( 0 ° ) and a rotated ( 45 ° ) ellipse, represented by blue dots and an orange line, respectively. (b) illustrates the difference in shape feature vectors between a normal and a rotated ellipse.
Electronics 14 02131 g007
Figure 8. The target shapes used to analyze the effects of target translation. (a,b) illustrate a default position and a shifted position (50 pixels toward the upper-right) ellipse, respectively.
Electronics 14 02131 g008
Figure 9. Shape feature vectors and their difference for analyzing the effects of target translations. (a) displays the shape feature vectors of a default positioned and a shited ellipse, represented by blue dots and an orange line, respectively. (b) illustrates the difference in shape feature vectors between a basepositioned and a shifted ellipse.
Electronics 14 02131 g009
Figure 10. An example of identical shape feature vectors for two different shapes. Shape 1 in (a) and shape 2 in (b) share the characteristic of having three spikes on a circle. In (a), the spikes are clustered together, whereas in (b), they are more spaced apart. However, the shape feature vector in (c) successfully represents this shared characteristic.
Electronics 14 02131 g010
Figure 11. Hand-sign dataset: rock, scissors, paper, and deformation in progress. (ac) illustrate examples of transitions from rock to scissors, scissors to paper, and paper to rock, respectively.
Electronics 14 02131 g011
Figure 12. Wavelet variance of the shape feature vectors for all frames by scale.
Electronics 14 02131 g012
Figure 13. Shape feature vectors as shape description features. The blue and the orange lines represent the shape feature I at scales ( s = 9 ) and ( s = 40 ) , respectively. Their combination enables classification. The highlighted red, green, and blue illustrate the shape state of rock, scissors, and paper.
Electronics 14 02131 g013
Figure 14. Shape feature vectors representative of each class.
Electronics 14 02131 g014
Figure 15. Distributions of shape feature vectors for each shape. The red, green, and blue distributions represent the rock, scissors, and paper classes, respectively. (a) illustrates a sequence that includes all shapes and transitions. (bd) depict the transitions from rock to scissors, scissors to paper, and paper to rock, respectively.
Electronics 14 02131 g015
Figure 16. Ultrasound images of frames within the fetal movement onset interval. The variable t represents the frame number in the echo movie.
Electronics 14 02131 g016
Figure 17. Wavelet variance of the shape feature vectors for all frames by scale.
Electronics 14 02131 g017
Figure 18. Shape feature I ( s , t | s = 58 ) ; orange bands indicate annotated onset time of fetal movement.
Electronics 14 02131 g018
Figure 19. Representative shape feature of neutral posture and flexed posture.
Electronics 14 02131 g019
Figure 20. Distribution of a shape feature vector at scale ( s = 58 ) as a classification problem. The blue and orange dots represent the neutral posture class and flexed posture class, respectively.
Electronics 14 02131 g020
Figure 21. Magnitude of deformation at scale ( s = 58 ) . The orange area represents the actual event of fetal movement annotated by a human, and the blue line represents the estimated magnitude of the fetal movement. The numbers correspond to the frame numbers in Figure 16.
Electronics 14 02131 g021
Disclaimer/Publisher’s Note: The statements, opinions and data contained in all publications are solely those of the individual author(s) and contributor(s) and not of MDPI and/or the editor(s). MDPI and/or the editor(s) disclaim responsibility for any injury to people or property resulting from any ideas, methods, instructions or products referred to in the content.

