Article

Efficient Data Reduction Through Maximum-Separation Vector Selection and Centroid Embedding Representation

by
Sultan Alshamrani
Department of Computer Science, Saudi Electronic University, Riyadh 11673, Saudi Arabia
Electronics 2025, 14(10), 1919; https://doi.org/10.3390/electronics14101919
Submission received: 17 March 2025 / Revised: 30 April 2025 / Accepted: 4 May 2025 / Published: 9 May 2025

Abstract

This study introduces two novel data reduction approaches for efficient sentiment analysis: High-Distance Sentiment Vectors (HDSV) and Centroid Sentiment Embedding Vectors (CSEV). By leveraging embedding space characteristics from DistilBERT, HDSV selects maximally separated sample pairs, while CSEV computes representative centroids for each sentiment class. We evaluate these methods on three benchmark datasets: SST-2, Yelp, and Sentiment140. Our results demonstrate remarkable data efficiency, reducing training samples to just 100 with HDSV and two with CSEV while maintaining comparable performance to full dataset training. Notable findings include CSEV achieving 88.93% accuracy on SST-2 (compared to 90.14% with full data) and both methods showing improved cross-dataset generalization, with less than 2% accuracy drop in domain transfer tasks versus 11.94% for full dataset training. The proposed methods enable significant storage savings, with datasets compressed to less than 1% of their original size, making them particularly valuable for resource-constrained environments. Our findings advance the understanding of data requirements in sentiment analysis, demonstrating that strategically selected minimal training data can achieve robust and generalizable classification while promoting more sustainable machine learning practices.

1. Introduction

Sentiment analysis has become an essential tool in natural language processing (NLP), with applications ranging from social media monitoring [1,2] to customer feedback analysis [3] and market intelligence [4]. Traditional approaches to sentiment classification often rely on large-scale labeled datasets for training, which demand considerable computational resources, storage capacity, and energy consumption [5,6]. This dependence presents substantial obstacles for deploying sentiment analysis systems in real-world settings where resources are limited, such as edge devices, mobile applications, or low-power infrastructures [7]. Consequently, improving data efficiency—i.e., achieving strong performance with significantly less training data—has emerged as a critical challenge [8].
Although recent advances in transformer-based architectures, particularly DistilBERT [9], have significantly reduced model size and inference time through knowledge distillation [10], the issue of data overdependence remains. As noted by Wang et al. [11], most efforts have focused on model efficiency, with relatively little attention paid to optimizing the composition of training data itself. The dominant paradigm continues to assume that “more data is better” [12,13], leading to redundant or non-informative samples being used in training, which exacerbates inefficiency without meaningful performance gains.
In this study, we aim to address this gap by introducing two novel data reduction techniques—High-Distance Sentiment Vectors (HDSV) and Centroid Sentiment Embedding Vectors (CSEV)—designed to identify and utilize only the most informative samples within a dataset. Drawing on principles from geometric deep learning [14] and embedding space structure analysis [15], HDSV leverages distance-based selection inspired by active learning [16] to choose maximally separated sentiment examples, while CSEV distills each class into a single representative vector using centroid computation based on intra-class coherence and inter-class separability [17].
This work is guided by the following key objectives:
  • To propose a systematic data reduction framework that enables effective sentiment classification with minimal labeled samples.
  • To demonstrate that models trained on carefully selected subsets (as few as two or 100 samples) can achieve performance comparable to full-dataset training.
  • To show that data-efficient models, by minimizing overfitting to dataset-specific artifacts, can exhibit improved generalization across different domains and datasets.
We evaluate our methods using three benchmark sentiment analysis datasets—SST-2 [18], Yelp Reviews [19], and Sentiment140 [20]—which vary in size, domain, and language complexity [21]. All models are trained with a single epoch using DistilBERT [9], chosen for its favorable trade-off between performance and efficiency. This experimental design isolates the impact of training data selection from model architecture, enabling a clear assessment of our data reduction strategies. By introducing HDSV and CSEV, this work contributes to the development of lightweight, generalizable, and sustainable sentiment analysis systems suited for deployment in real-world, resource-constrained environments.
The remainder of this paper is organized as follows: In Section 2, we review related work in sentiment analysis, data efficiency approaches, and embedding space analysis. Section 3 presents our methodology, detailing the HDSV and CSEV techniques for efficient sentiment classification. Section 4 describes our experimental results across multiple datasets and evaluation metrics. Section 5 provides a comprehensive discussion of our findings, including their implications and limitations. Finally, Section 6 concludes the paper and outlines directions for future research.

2. Related Work

In this section, we review key developments in sentiment analysis and data efficiency research, highlighting limitations in existing approaches and showing our proposed methods HDSV and CSEV within this evolving landscape. We organize the related work into four main areas: early sentiment classification methods, efficiency challenges in transformer-based models, data reduction strategies, and geometric embedding analysis.

2.1. Early Methods for Sentiment Analysis

Traditional sentiment classification approaches relied on handcrafted features and lexicon-based techniques. Tools such as SentiWordNet and domain-specific wordlists were commonly used to identify the polarity of sentiments from text [22]. While these methods were interpretable and resource-efficient, their limited scalability and inability to handle linguistic complexity restricted their effectiveness across domains and contexts.
With the advent of deep learning, sentiment analysis underwent a significant transformation. Early models such as convolutional neural networks for sentence classification [23] and recursive neural networks for tree-structured sentiment representations [18] improved robustness by capturing hierarchical and syntactic structures in text. These models set the stage for the widespread adoption of neural architectures in natural language processing.

2.2. Transformer Models and Data Efficiency Challenges

The introduction of transformer-based models, particularly BERT [5], has redefined the state of the art in sentiment analysis. These models utilize contextualized embeddings and transfer learning to achieve superior performance across diverse datasets and tasks. However, this performance comes at the cost of substantial computational requirements.
Recent studies have highlighted the challenges associated with the scalability of large transformer models. Aquino-Brítez et al. [24] quantified the high energy consumption and prolonged training times needed for state-of-the-art architectures. Similarly, Khalil et al. [25] demonstrated that the computational complexity of these models increases non-linearly with size, raising concerns about accessibility, environmental impact, and feasibility in low-resource environments. While models like DistilBERT [9] have made strides toward architectural efficiency through knowledge distillation [10], they do not address the parallel issue of training data inefficiency, specifically, the assumption that performance always improves with more data [11].

2.3. Data Reduction and Sample Selection Strategies

To mitigate the resource demands of large models, recent work has explored reducing the volume of training data without sacrificing model performance. Few-shot learning and data augmentation approaches [6,26] have shown promise in low-resource settings. However, these methods often depend on massive pre-training corpora and require careful calibration to avoid degrading semantic integrity.
Sample selection strategies offer a more direct path toward data efficiency by prioritizing the most informative examples in the dataset. Active learning frameworks [16] iteratively select uncertain samples for labeling, while core-set selection [27] seeks to preserve dataset diversity through summarization. Although effective, these methods often require multiple passes through the data or iterative feedback loops, which limit their scalability and simplicity. Moreover, they rarely incorporate geometric insights from embedding spaces or sentiment-specific characteristics during selection.

2.4. Embedding Space Geometry and Sentiment Representation

An emerging line of research focuses on understanding the geometry of embedding spaces produced by deep language models. Ethayarajh [15] analyzed the isotropy and clusterability of contextual embeddings, revealing that high-dimensional representations often exhibit stable semantic structures. Building on this, Zhang et al. [17] explored how the structure of the embedding space correlates with downstream task performance, emphasizing the importance of inter-class separation and intra-class cohesion.
These insights align with developments in geometric deep learning [14], which formalize the role of geometry in data representation and decision boundary formation. Despite this progress, sentiment analysis methods have yet to fully leverage these geometric properties for data reduction. Most existing techniques either treat data as unstructured points or apply conventional sampling without considering the underlying spatial relationships within the embedding space.

2.5. Extending Prior Work with Geometric Data Reduction

While existing data reduction approaches have demonstrated potential, they exhibit key limitations that our proposed methods aim to overcome. Active learning [16] relies on iterative labeling and typically prioritizes uncertainty over geometric separation, making it suboptimal for one-shot selection scenarios. Core-set selection [27] focuses on data summarization but lacks explicit mechanisms to maximize inter-class distance. Clustering-based methods [17] compute centroids but do not incorporate sentiment-specific separation metrics such as the CSR score (Equation (7)) to ensure discriminative representation.
In contrast, our approach introduces two novel data reduction strategies that explicitly leverage geometric properties of embedding spaces:
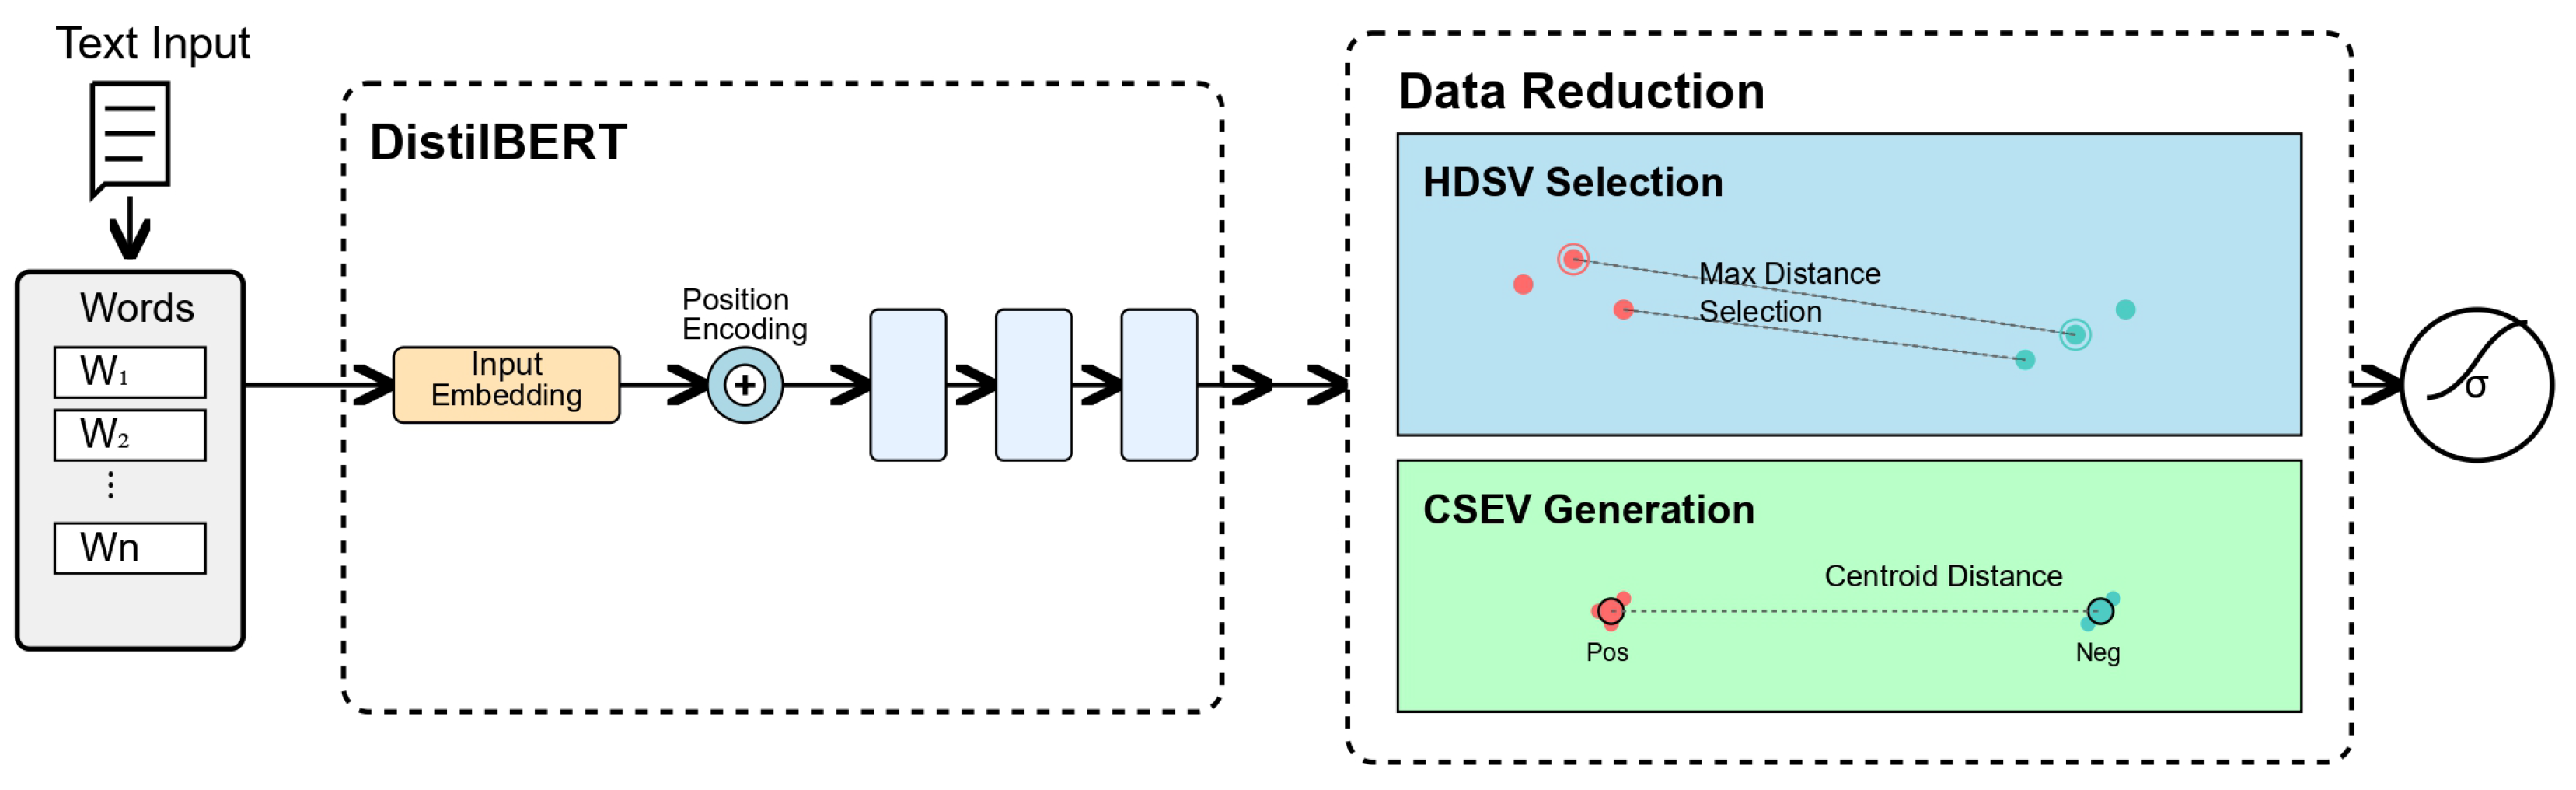
  • HDSV (High-Distance Sentiment Vectors) selects maximally separated sentiment pairs based on pairwise distance in the embedding space, enabling compact yet diverse training sets inspired by active learning but adapted for one-shot use.
  • CSEV (Centroid Sentiment Embedding Vectors) constructs representative class prototypes guided by the CSR metric, which balances inter-class separation and intra-class cohesion to ensure discriminative representation.
By utilizing embedding geometry and sentiment-specific criteria, our methods achieve substantial reductions in training data down to two samples while maintaining or even improving generalization across domains. This offers a new perspective to the field of sentiment analysis, addressing the often overlooked dimension of training data optimization and enabling scalable, sustainable NLP solutions for resource-constrained environments.

3. Methodology

In this section, we present our approach to minimizing the training data requirements for sentiment classification while preserving model performance. As illustrated in Figure 1, our system pipeline consists of three main components: text preprocessing, embedding generation, and data reduction. The input text is first tokenized and processed through DistilBERT’s embedding layers, which include input embedding, position encoding, and attention layers. The resulting embeddings then undergo our novel data reduction techniques: HDSV and CSEV. HDSV identifies 100 maximally separated samples from the original dataset through distance-based selection in the embedding space, while CSEV further reduces the data requirement to just two representative vectors through centroid-based computation. This two-stage reduction process enables efficient sentiment analysis while maintaining classification performance.
Our experimental framework systematically evaluates these approaches across three widely-used sentiment analysis datasets: SST-2 (Stanford Sentiment Treebank), Yelp Reviews, and Sentiment140. These datasets were chosen for their diversity in domain and complexity, allowing us to evaluate the generalizability of our approach. For each dataset, we compare three variants: the full dataset, the HDSV-reduced dataset (100 samples), and the CSEV representation (two samples). Through careful embedding analysis, distance-based sample selection, and centroid computation, we demonstrate that these minimal datasets can achieve comparable performance to their full-size counterparts when fine-tuned using DistilBERT with a single epoch.
To prevent data leakage, embedding-based operations such as HDSV and CSEV, are strictly performed in the training subset. The test set embeddings are never utilized or exposed during the data reduction process. During the training phase, the full dataset is first split into training (85%), validation (15%), and test sets, with the test set completely isolated. Embeddings used for HDSV and CSEV are generated exclusively from the training portion of the data. In the test phase, embeddings for the test set are generated independently and used solely for evaluation after the final model has been selected. This ensures that no information from the validation or test sets leaks into the reduced training data, preserving the integrity and fairness of our evaluation.
The methodology is structured to progressively demonstrate the effectiveness of our data reduction approach, beginning with embedding space analysis, followed by HDSV sample selection, CSEV generation, and concluding with a comprehensive fine-tuning and cross-dataset evaluation process. This systematic reduction in training data requirements, from full datasets to just two samples, represents a significant advancement in efficient sentiment classification model adaptation.

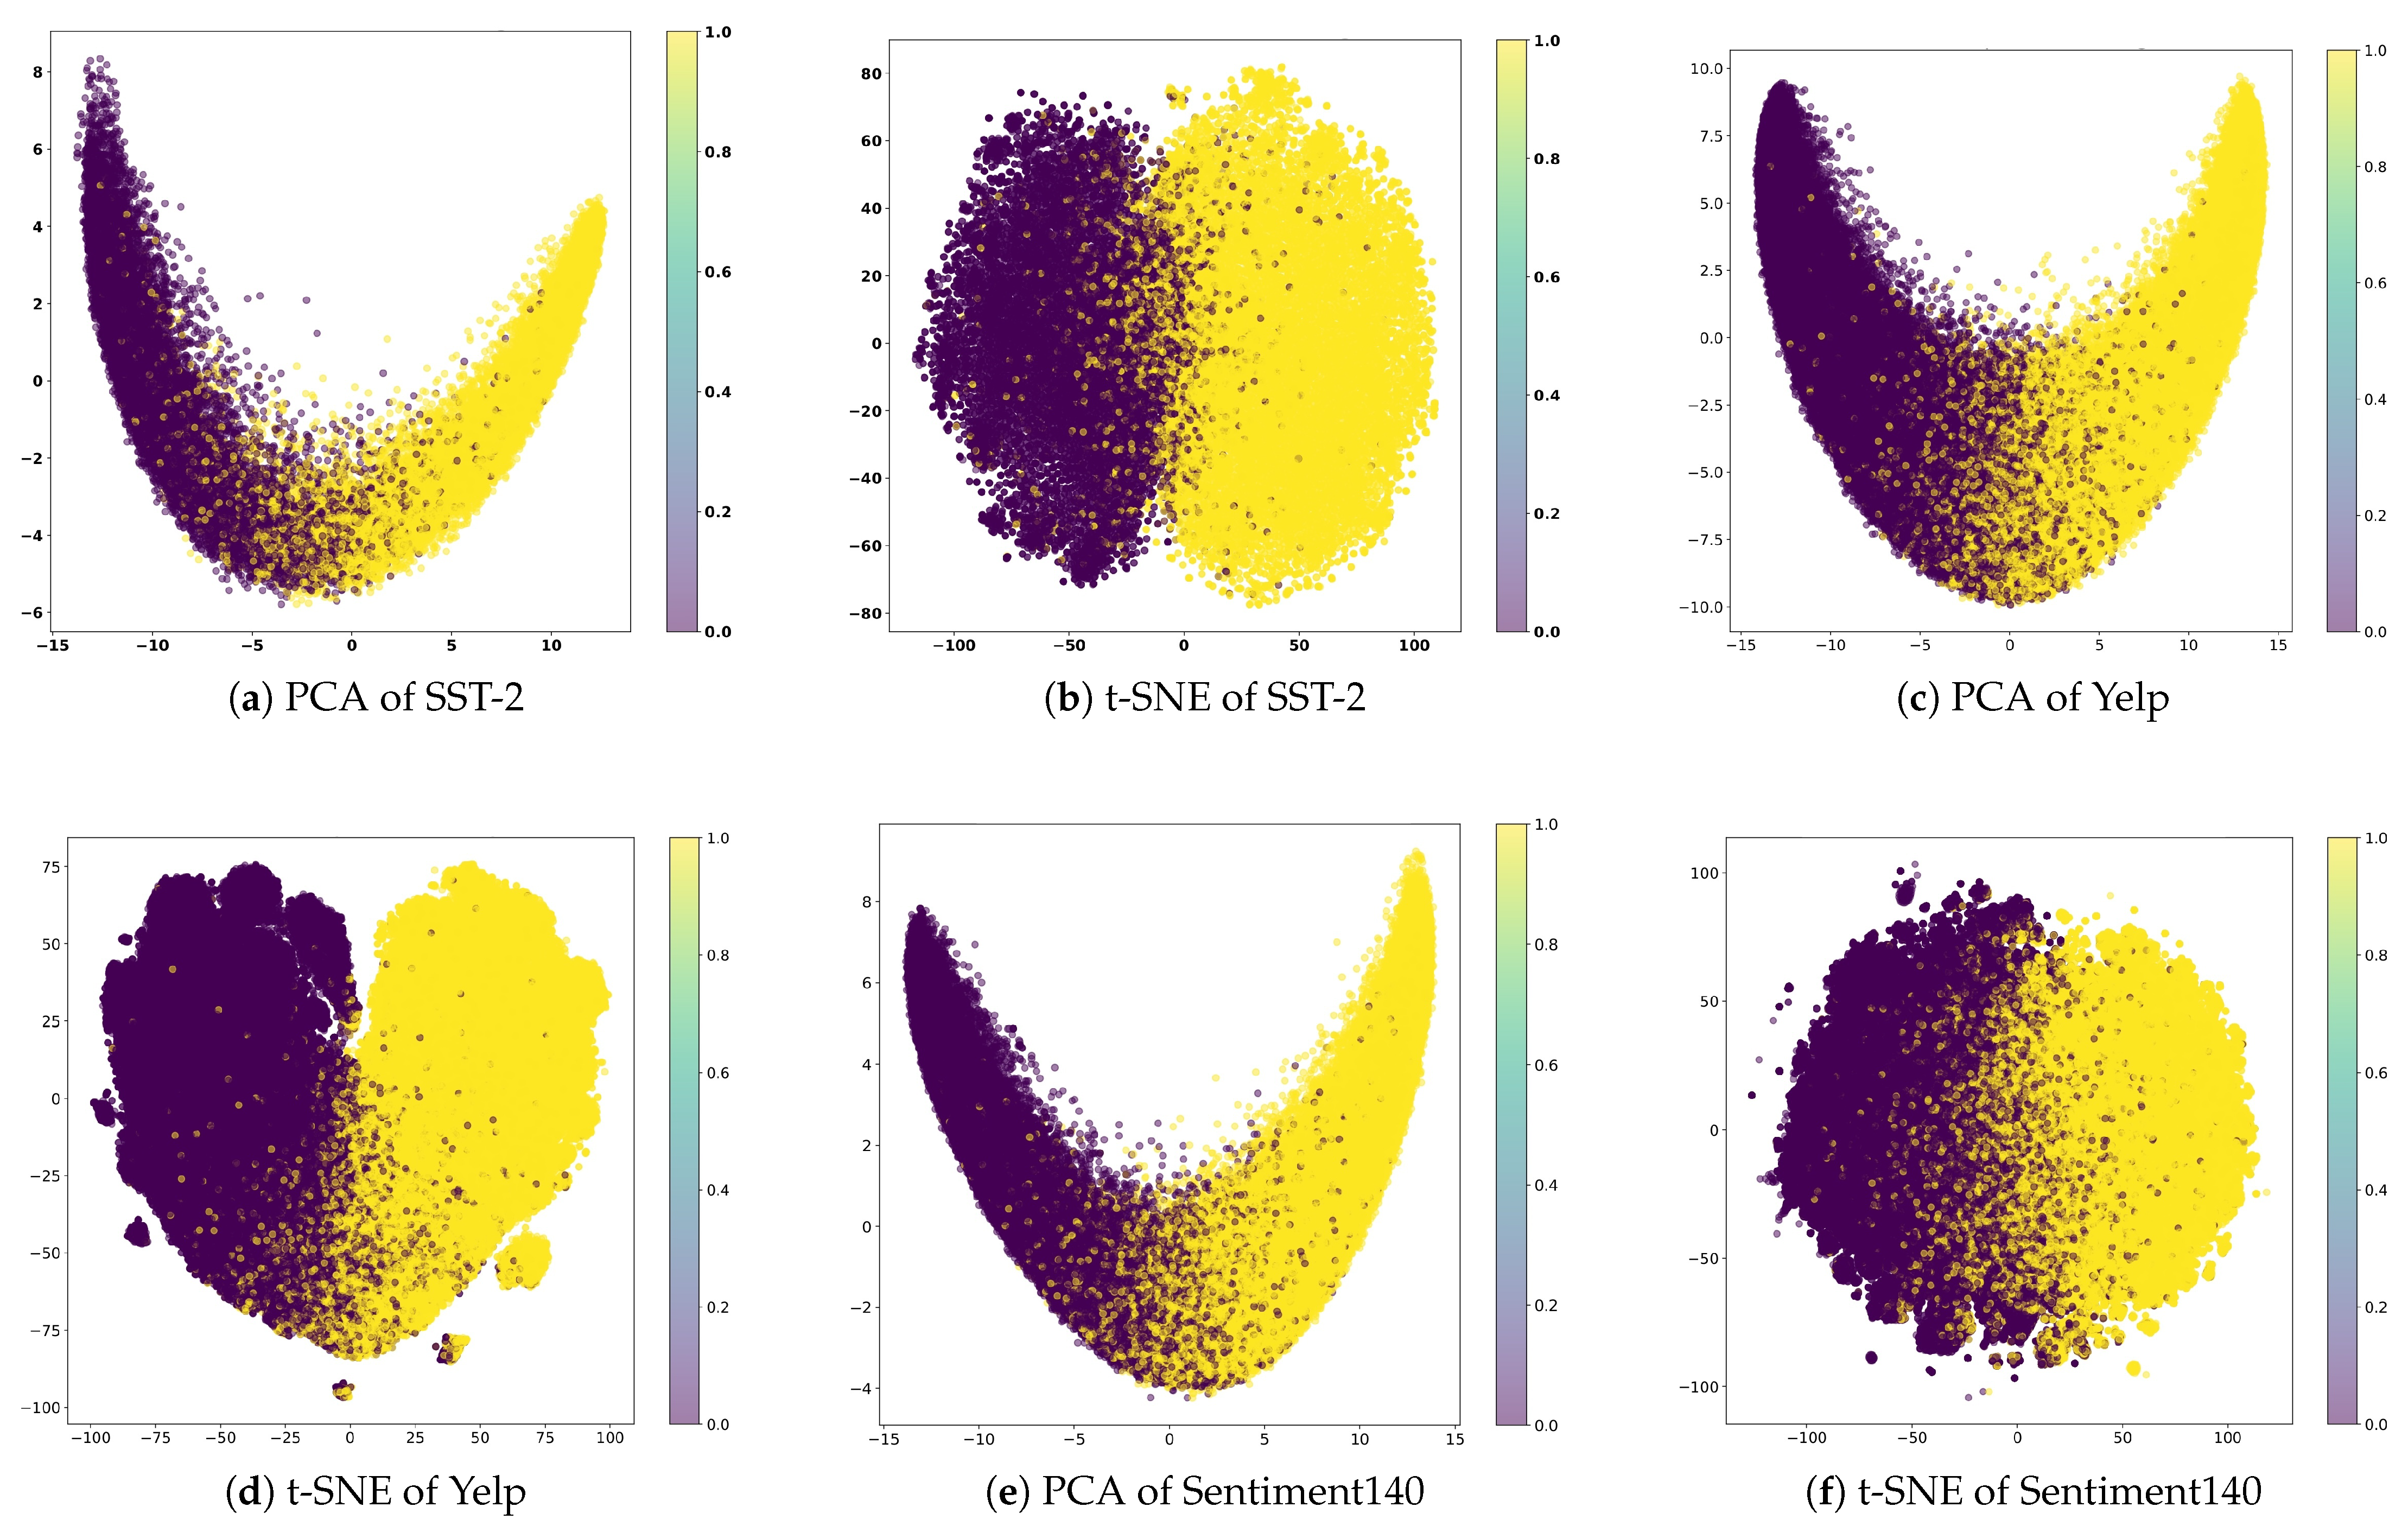
3.1. Embedding Space Analysis

Our initial step involves a comprehensive analysis of the sentence embedding space to understand the underlying structure of sentiment representation. The embedding space analysis is crucial as it provides a geometric perspective on how sentiment information is encoded within the high-dimensional representations generated by the language model. Through Principal Component Analysis (PCA) and t-distributed Stochastic Neighbor Embedding (t-SNE), as shown in Figure 2, we visualize and analyze this high-dimensional space, revealing clusters, patterns, and potential decision boundaries between different sentiment classes. These visualization techniques help us understand the natural separation between positive and negative sentiments in the embedding space and identify regions where sentiment distinctions are most pronounced.
Our visualization analysis reveals interesting patterns across different dimensionality reduction techniques and datasets. PCA consistently produces U-shaped distributions with clear geometric transitions between sentiment polarities, suggesting a natural continuum in the embedding space from negative to positive sentiments. While t-SNE shows more pronounced local clustering, it distorts the global structure of the embedding space, potentially obscuring the smooth transitions between sentiment states that are better preserved by PCA. The consistency of PCA’s U-shaped pattern across all three datasets (SST-2, Yelp, and Sentiment140) indicates that this structure is an inherent characteristic of sentiment embeddings rather than a dataset-specific artifact. Given PCA’s ability to maintain global geometric relationships and provide interpretable visualizations of sentiment transitions, we will use PCA for visualizing our selected samples in subsequent analyses.
We compute several key quantitative metrics in the original high-dimensional embedding space to accurately assess the quality of sentiment separation. These include the Euclidean distance between class centroids ( μ p o s μ n e g 2 ), which measures global class separation, and the average intra-class distances ( σ p o s , σ n e g ) that quantify the compactness of each sentiment cluster. Additionally, we examine the distribution of pairwise distances between samples of opposite sentiments to identify regions of maximum separation. These metrics are computed using the full embedding vectors, while dimensionality reduction techniques like PCA are used solely for visualization to verify our calculations. The computed metrics not only provide insights into the inherent structure of the sentiment embedding space but also guide our subsequent sample selection process by identifying embeddings that maximize inter-class separation while maintaining intra-class coherence. The effectiveness of these distance-based calculations can be visually verified through PCA projections, as shown in Figure 3.

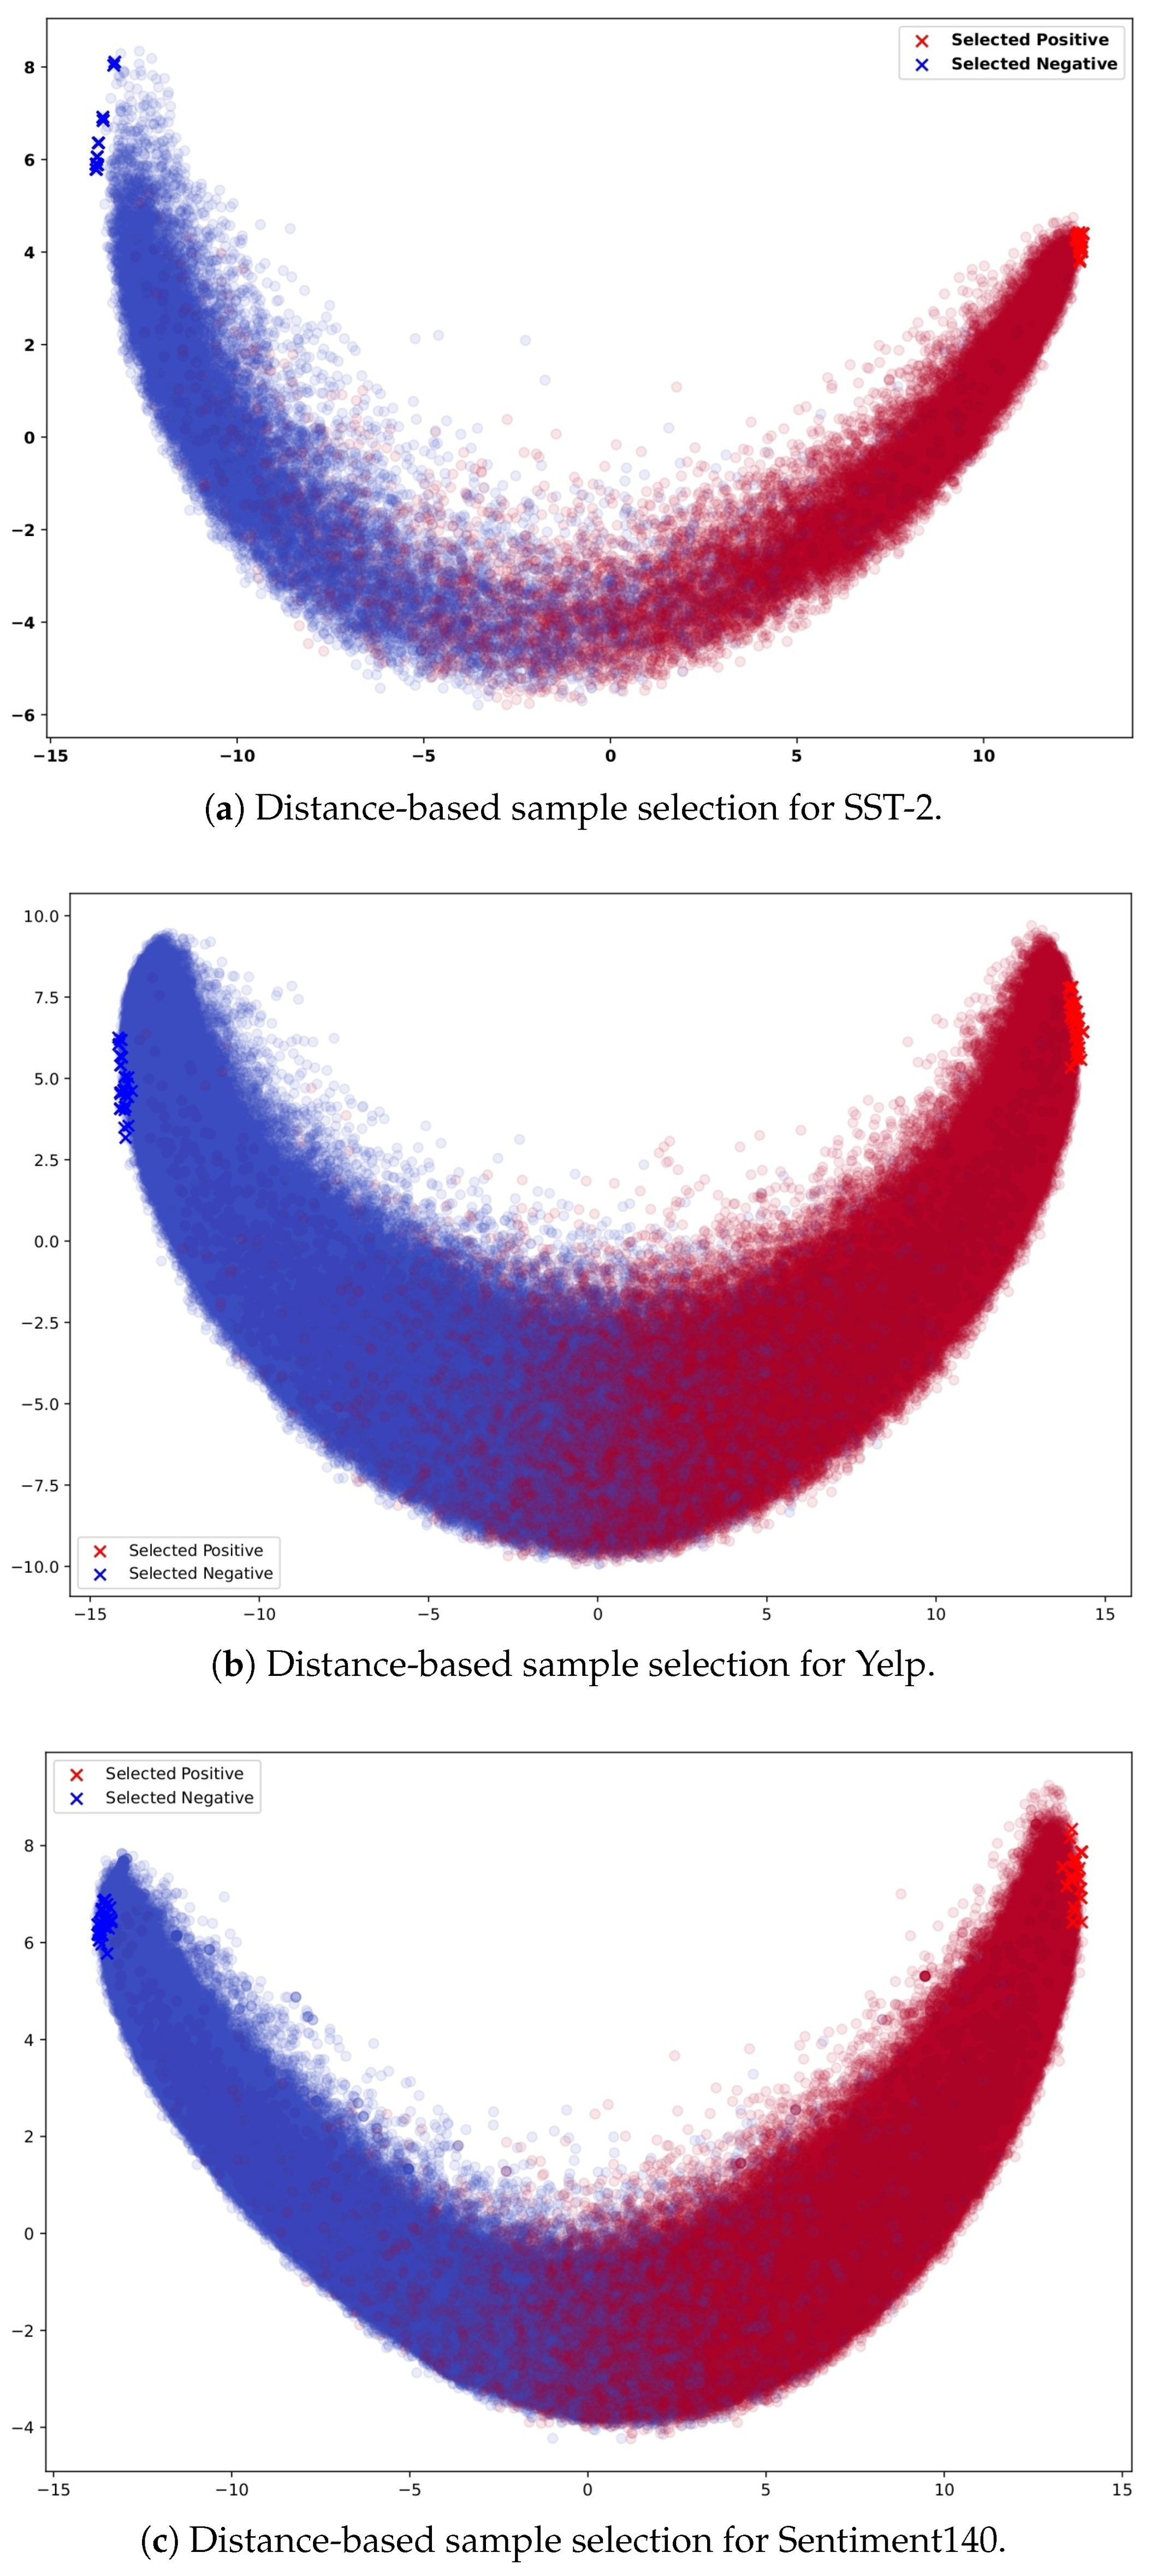
3.2. High-Distance Sentiment Vectors (HDSV)

The HDSV method is grounded in the principles of geometric deep learning as elucidated by Bronstein et al. [14], which emphasize the structural relationships inherent in high-dimensional data representations. At its core, HDSV seeks to identify and utilize sample pairs that are maximally separated in the embedding space. This approach operationalizes the geometric intuition that samples residing near the decision boundaries often encapsulate the most discriminative information, thus playing a critical role in model generalization.
This principle aligns closely with established active learning strategies [16], which prioritize informative sample selection, and also capitalizes on the isotropic properties of contextual embeddings [15], where the inter-class distances meaningfully correspond to semantic dissimilarity. In this context, the pairwise distance metric (Equation (2)) is used to directly encode the geometric separation hypothesis, ensuring that selected sample pairs are spread across the embedding space to capture the full spectrum of sentiment diversity.
The foundation of our approach lies in selecting a minimal set of maximally informative training samples through a systematic distance-based selection process. This methodology is motivated by the observation that not all training samples contribute equally to model performance, and that samples with maximum separation in the embedding space often provide stronger training signals for sentiment classification.
In the case of HDSV, the choice of k = 100 (50 samples per class) reflects a deliberate balance between computational efficiency and performance trade-offs, guided by several key considerations. First, the method involves calculating pairwise distances between positive and negative samples, which scales quadratically with dataset size (O(n2)). A smaller k ensures practical runtime without compromising diversity. Second, prior work in active learning [16] and geometric deep learning [14] suggests that small, strategically chosen subsets often perform comparably to larger random samples. Our selection of k = 100 captures the most discriminative, decision-boundary samples, avoiding redundancy. Lastly, this choice provides a roadmap for efficiency in hardware-constrained settings, enabling robust performance with minimal computational overhead by prioritizing samples that maximize inter-class separation (as formalized in Equation (2)).
Given a dataset D = { ( x i , y i ) } i = 1 n , where x i represents the embedding vector and y i { 0 , 1 } denotes the sentiment label, we first partition the embeddings based on their sentiment labels:
E p o s = { x i y i = 1 } E n e g = { x i y i = 0 }
We then compute the pairwise Euclidean distances between embeddings of positive and negative sentiment samples:
d i j = x i x j 2 , i , j : x i E p o s , x j E n e g ,
where d i j represents the distance between positive sample i and negative sample j. This calculation yields a distance matrix D R n p × n n , where n p and n n are the numbers of positive and negative samples, respectively. To create our HDSV dataset, we select the top-k sample pairs with maximum distances:
S k = max k { d i j x i E p o s , x j E n e g }
where k is determined by our target dataset size. As illustrated in Figure 3, we select 100 samples, with 50 samples for each class, maintaining balanced representation through:
| S p o s | = | S n e g | = n / 2
The selected samples are then split into training and validation sets using an 85:15 ratio, resulting in 85 training samples and 15 validation samples, while maintaining equal representation of both sentiment classes. The test set remains unchanged to enable fair comparison with other approaches. The final HDSV dataset is structured as:
H D S V = { D t r a i n 85 , D v a l 15 , D t e s t o r i g i n a l }
This distance-based selection process serves two crucial purposes: it identifies samples that are maximally separated in the embedding space, suggesting strong sentiment differentiation, and it eliminates redundant or ambiguous samples that might introduce noise during the fine-tuning process. The resulting HDSV dataset provides an ideal foundation for efficient fine-tuning while maintaining the most informative aspects of the original data.

3.3. Centroid Sentiment Embedding Vector (CSEV)

To achieve better data reduction while preserving the distinguishability of sentiment, we developed the CSEV approach, which condenses sentiment information into representative vectors. This novel strategy goes beyond individual sample selection to create centroid-based representations that capture the essential characteristics of each sentiment class. By computing centroids in the embedding space, we effectively distill the collective semantic features that most strongly indicate positive or negative sentiment in a principled manner.
The CSEV method builds on embedding space analysis [17], which demonstrates that class centroids in well-structured embedding spaces effectively summarize intra-class coherence and inter-class separation. The CSR metric (Equation (7)) formalizes this by quantifying the ratio of inter-class distance to intra-class spread, a key theoretical construct in geometric deep learning [14]. By distilling class information into centroids, CSEV capitalizes on the clusterability of sentiment embeddings [15], ensuring that minimal prototypes retain maximal class-discriminative features. For each class c, we compute a CSEV vector:
μ C S E V c = 1 | S c | i S c x i ,
where S c represents the set of indices for class c. These CSEV representations serve as central vectors that capture the average characteristics of their respective sentiment classes, effectively reducing the dimensionality of our representation while maintaining semantic meaningfulness. The effectiveness of these centroid vectors is quantified through the CSEV separation ratio (CSR):
C S R = μ C S E V p o s μ C S E V n e g 2 1 2 ( σ p o s + σ n e g ) ,
where σ c is the average intra-class distance for class c,
The CSR metric serves as a fundamental quality indicator for our CSEV vectors, quantifying both the distinctiveness between sentiment classes and the coherence within each class. By measuring the ratio of inter-class separation to intra-class spread, CSR provides a dimensionless measure of class separability that is crucial for validating our centroid vector generation process. A higher CSR value signifies greater discrimination between sentiment classes relative to their internal variation, suggesting that the CSEV representations effectively capture the distinctive characteristics of each sentiment category. This metric plays a vital role in our methodology, as it directly correlates with the CSEV vectors’ potential effectiveness in the fine-tuning process, where clear sentiment boundaries are essential for model adaptation.

3.4. Fine-Tuning Process

Our fine-tuning process leverages DistilBERT as the base model, selected for its efficient balance between computational requirements and performance. DistilBERT is a distilled version of BERT, offering a reduced model size while maintaining most of the performance benefits of the original transformer architecture. The choice of DistilBERT over BERT or other larger language models is driven by several important factors. First, DistilBERT is designed to be a lighter, faster alternative to BERT, retaining 97% of BERT’s language understanding capabilities but with 60% fewer parameters. This substantial reduction in size significantly decreases memory and computation requirements, which is crucial in low-resource environments where computational power is constrained, and training time must be minimized.
On the other hand, larger models like BERT or RoBERTa, while powerful, require significantly more computational resources, making them less suitable for scenarios where both speed and resource efficiency are important. Another key advantage of DistilBERT is its speed. It provides faster inference and training speeds compared to BERT, which is particularly beneficial in fine-tuning tasks where training time is a limiting factor. This allows for faster experimentation and iteration. Additionally, DistilBERT provides an excellent balance between performance and model size. While larger models such as BERT-large offer state-of-the-art results, their size can be overkill for specific tasks like sentiment analysis, where a relatively smaller model like DistilBERT can achieve nearly the same level of performance but with far fewer computational demands.
The fine-tuning process is conducted using the deufalt set of hyperparameters to ensure robust performance across tasks [9]. We train the model using a learning rate of 5e-5, which has been empirically proven to ensure stable convergence for transformer-based models like DistilBERT [28]. This learning rate provides a good balance between efficient learning and avoiding issues such as overshooting the optimal solution. The optimizer used is AdamW, a variant of the Adam optimizer, which is specifically designed to incorporate weight decay regularization. This helps prevent overfitting and improves the model’s performance in fine-tuning tasks [29].
To ensure statistical reliability, all experiments were conducted with multiple runs (averaged over three trials) using identical hyperparameter configurations. Additionally, we employ a linear learning rate decay strategy where the learning rate gradually decreases from its initial value to zero throughout the training process. This approach ensures dynamic adjustment of the learning rate, facilitating smoother convergence while maintaining stable learning during fine-tuning.
The process is implemented consistently across three dataset variants: the full dataset, HDSV with 100 samples (50 per class), and CSEV with two samples (one per class) representations. The fine-tuning configuration is carefully designed to accommodate our minimal data approach. Sequences are truncated to 64 tokens, a length determined through empirical analysis of our datasets’ sentence distributions and sufficient to capture the essential sentiment information while maintaining computational efficiency.
Our approach employs single-epoch training, which aligns with our research objective of investigating the minimal requirements for effective sentiment classification. For the full dataset, this means one pass through all training samples, while for HDSV, it involves training on just 100 carefully selected samples (85 for training and 15 for validation). The most extreme reduction is seen in CSEV, where we train on just two prototype vectors. This single-epoch constraint creates a rigorous evaluation scenario, making any performance improvements achieved through our data reduction approaches more significant.
The evaluation framework employs multiple complementary metrics: accuracy, precision, recall, F1-score. We implement a comprehensive cross-dataset evaluation strategy where models trained on each dataset (SST-2, Yelp, Sentiment140) are evaluated on the others’ test sets. This cross-evaluation approach is particularly important as it helps validate our hypothesis that carefully selected minimal training data can lead to robust sentiment classifiers capable of generalizing across different domains and data distributions.

4. Results

4.1. Dataset Size Reduction Analysis

Our data reduction approaches, HDSV and CSEV, achieve substantial reductions in both dataset size and sample count across three sentiment datasets. Table 1 presents a comprehensive comparison of storage requirements and training samples across the different dataset variants, demonstrating the remarkable efficiency of our approaches.
The most dramatic reduction is observed in the Sentiment140 dataset, where HDSV reduces the training samples from 1,600,000 to just 85 samples while compressing the storage from 10,608.69 MB to 117.66 MB (1% of the original). CSEV further reduces this to just two training samples with 2.59 MB storage. Similarly, for the Yelp dataset, we achieve reduction from 560,000 to 100 samples with HDSV (117.66 MB, less than 1% of the original 42,153.33 MB), and to two samples with CSEV (2.59 MB). The SST-2 dataset, despite being initially smaller with 67,349 samples, still shows impressive reduction to 100 samples with HDSV (117.66 MB, 19% of the original 613.57 MB) and two samples with CSEV (2.59 MB).
Notably, HDSV maintains a consistent configuration of 100 training samples and 117.66 MB size across all datasets, reflecting our standardized approach of selecting maximally informative samples regardless of the original dataset size. CSEV achieves even more significant reduction, maintaining just two training samples and 2.59 MB size across all datasets through its centroid-based representation. These reductions, particularly the preservation of performance with just two training samples in CSEV, challenge conventional assumptions about minimum data requirements for effective sentiment classification.

4.2. Model Performance Analysis

Our experimental analysis evaluates the performance of three distinct approaches to sentiment classification: training with the full dataset, the HDSV-reduced dataset (100 samples), and the CSEV representation (two samples). The evaluation framework encompasses both direct testing on matched datasets and cross-dataset generalization testing, providing comprehensive insights into model behavior under different training conditions. Figure 4 illustrates the comparative performance across multiple evaluation metrics, revealing patterns that validate our data reduction methodology.

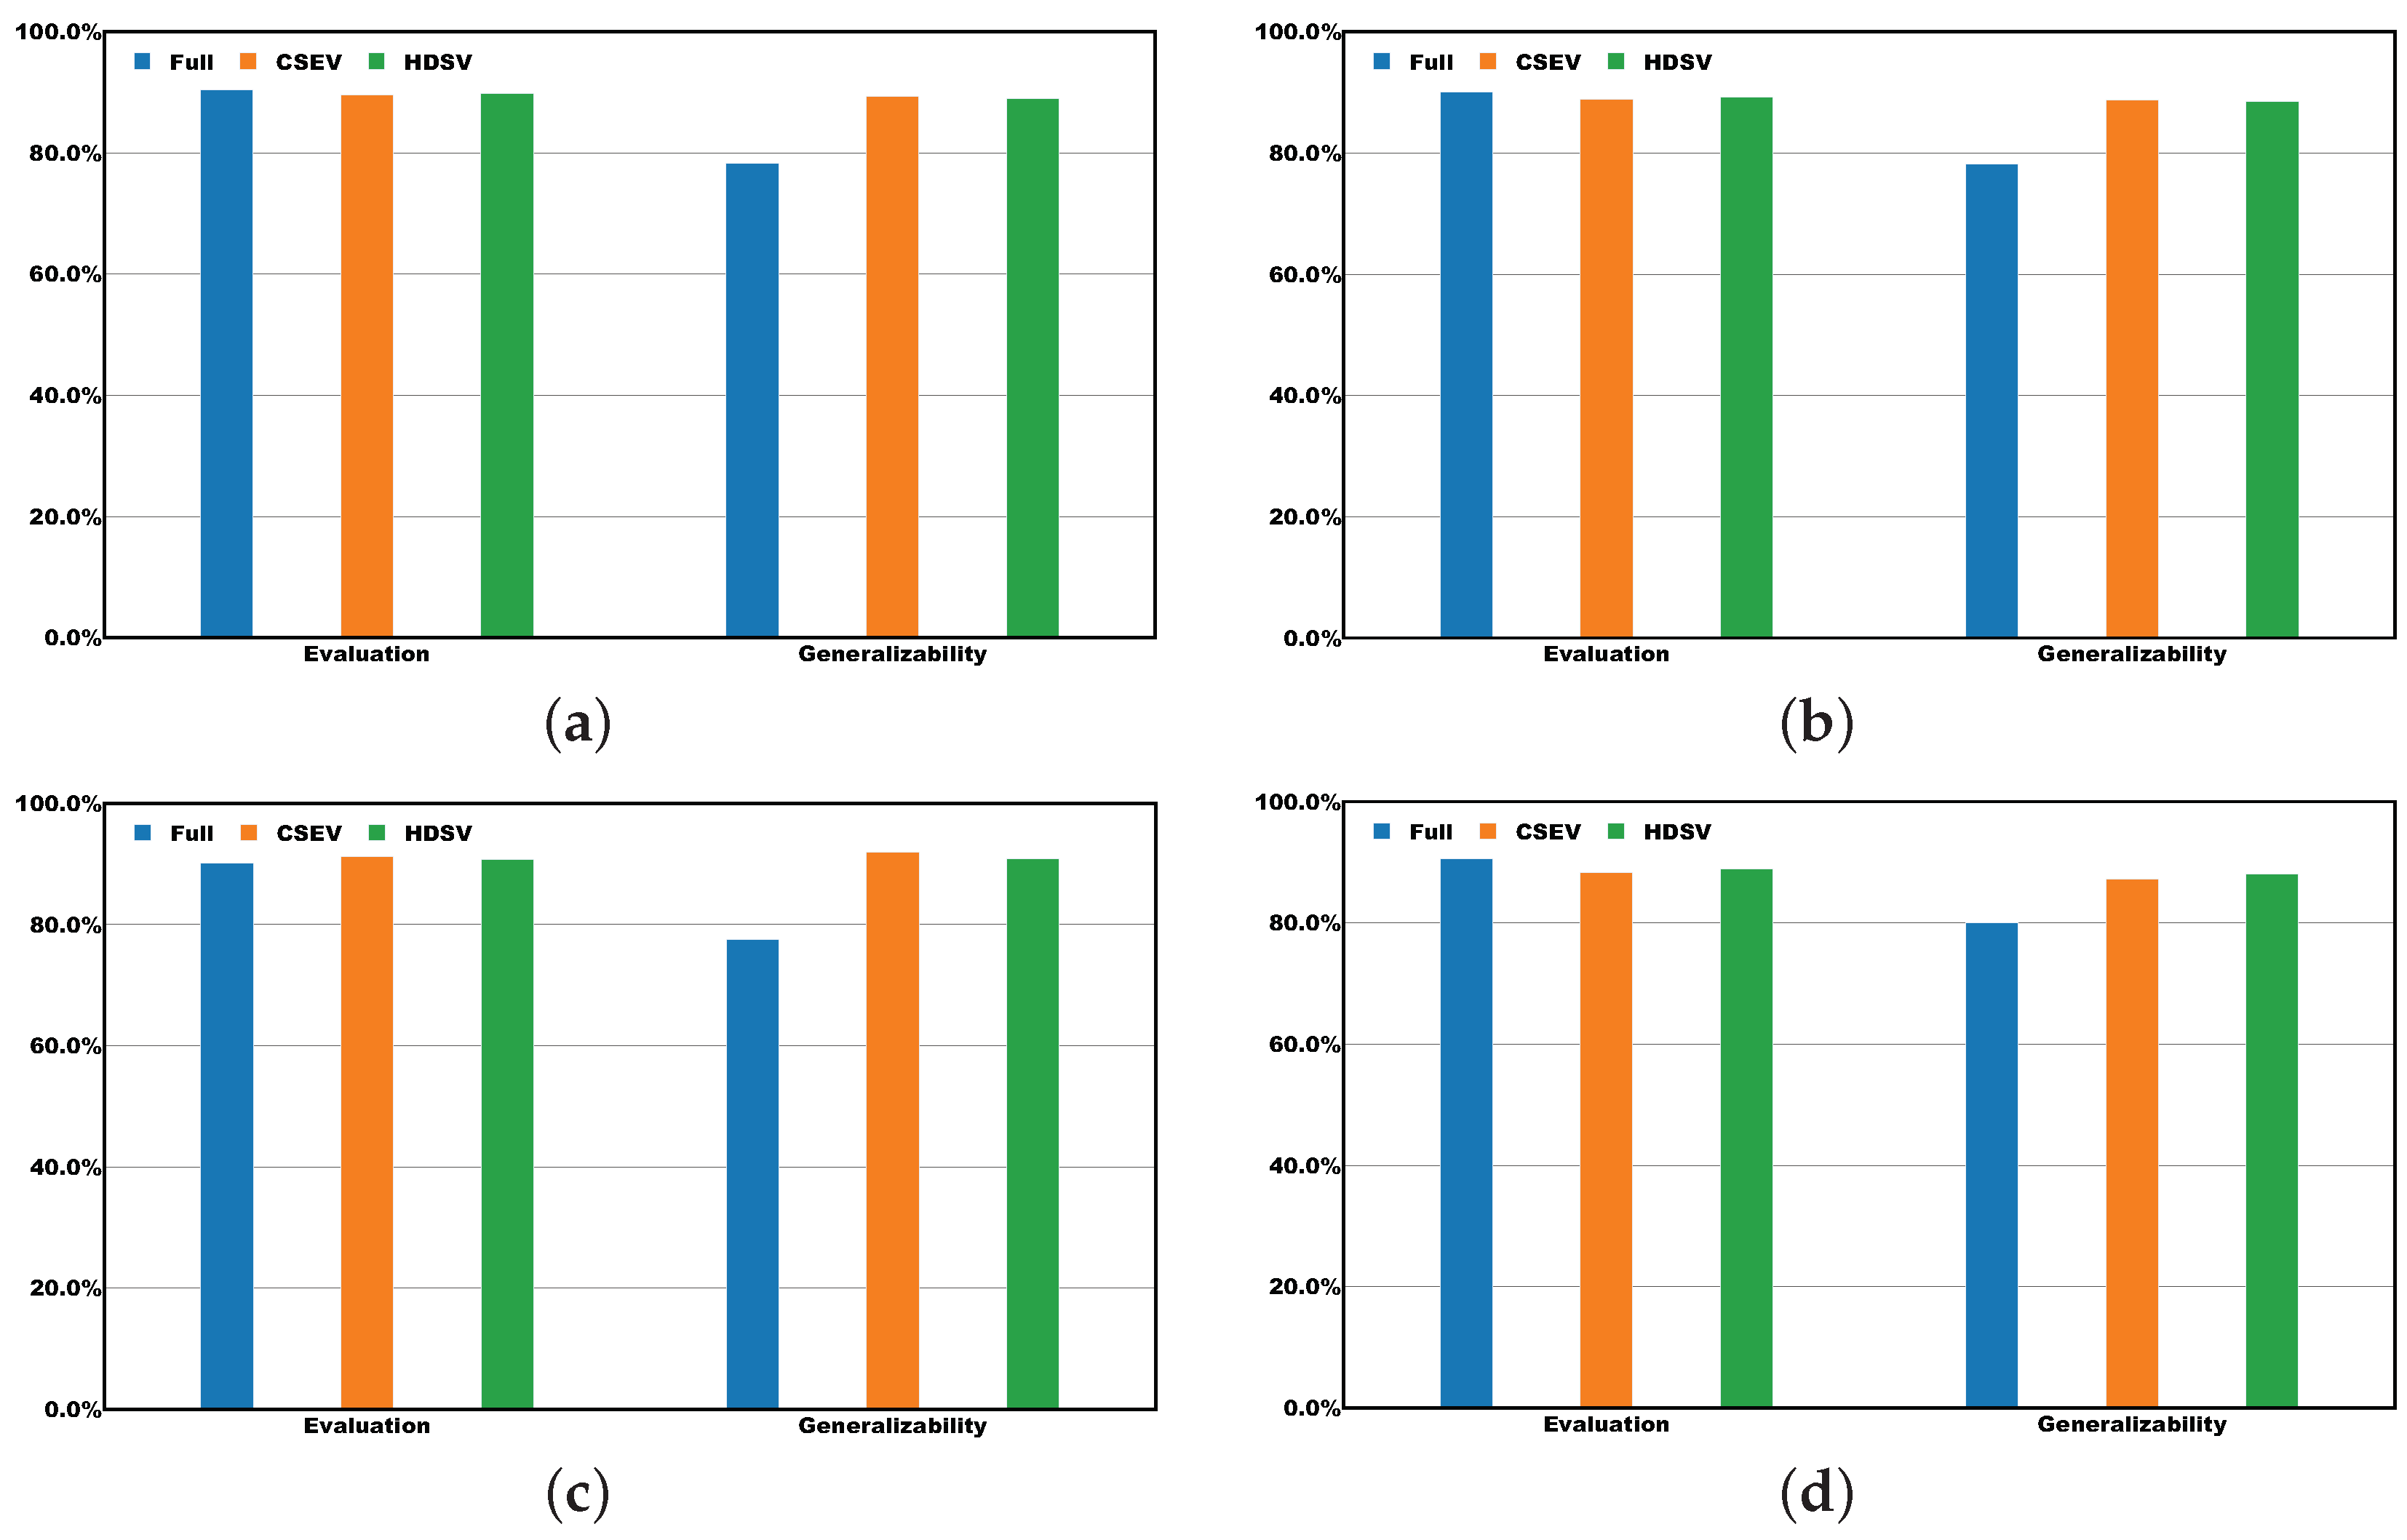
4.2.1. Direct Evaluation Performance

The direct evaluation results demonstrate the robustness of our reduced dataset approaches. The full dataset training achieves 90.14% accuracy and 90.36% F1-score, establishing the baseline performance for our comparison. The HDSV approach, despite using only 100 carefully selected samples, achieves comparable performance with 89.30% accuracy and 89.76% F1-score. This represents a minimal performance reduction of only 0.84 percentage points in accuracy and 0.60 percentage points in F1-score. Similarly, the CSEV approach, utilizing just two representative vectors, maintains strong performance with 88.93% accuracy and 89.55% F1-score, demonstrating a reduction of only 1.21 percentage points in accuracy and 0.81 percentage points in F1-score compared to the full dataset approach. These results are particularly significant given that CSEV achieves this performance with just two training samples, representing a reduction ratio of over 1:10,000 for larger datasets like Yelp.

4.2.2. Generalizability Analysis

The generalizability analysis reveals crucial insights into each approach’s ability to transfer learning across different domains. The full dataset model shows significant performance degradation in cross-dataset evaluation, with accuracy decreasing to 78.20% and F1-score to 78.30%. This substantial drop of 11.94 percentage points in accuracy indicates that the model trained on the full dataset may be overfitting to dataset-specific features. In contrast, CSEV demonstrates remarkable generalization capabilities, maintaining 88.79% accuracy and 89.30% F1-score in cross-dataset testing. The minimal performance variation between direct evaluation and generalizability testing (0.14 percentage points in accuracy) suggests that CSEV effectively captures domain-independent sentiment features. HDSV similarly exhibits strong generalization, achieving 88.56% accuracy and 88.97% F1-score in cross-dataset testing, with a modest performance difference of 0.74 percentage points from direct evaluation.

4.2.3. Metric-Specific Analysis

Detailed examination of individual performance metrics provides deeper insights into each approach. The precision metrics, visualized in Figure 4d, show that the full dataset achieves 90.57% in direct evaluation but experiences a significant drop in generalizability testing. HDSV maintains more stable precision, with 88.94% in direct evaluation and 88.11% in generalizability testing, demonstrating consistent performance across different testing scenarios. CSEV shows similar stability with 88.27% and 87.21%, respectively, indicating reliable positive prediction capabilities despite its minimal training data.
The recall performance, illustrated in Figure 4c, highlights a particular strength of our reduced dataset approaches. CSEV achieves the highest recall rates (91.20% in evaluation, 91.92% in generalizability testing), surpassing even the full dataset approach. This high recall performance suggests that CSEV’s centroid-based representation effectively captures the essential features necessary for identifying positive samples across different domains. HDSV maintains comparable recall stability (90.79% and 90.80%), while the full dataset approach shows a substantial decline from 90.16% to 77.50% in generalizability testing.
The F1-score, shown in Figure 4a, provides a balanced assessment of precision and recall performance. While all approaches achieve F1-scores above 88% in direct evaluation, the stability of these scores varies significantly in generalizability testing. CSEV and HDSV maintain consistent F1-scores across both evaluation scenarios, with variations of less than 0.5 percentage points, while the full dataset shows a marked decrease of 12 percentage points. This stability in F1-scores further validates the effectiveness of our data reduction approaches in maintaining balanced performance across different evaluation contexts.
Further insight is gained from the Matthews Correlation Coefficient (MCC), a more informative metric for binary classification, especially under class imbalance. As shown in Table 2, even though the full dataset achieves the highest MCC of 80.73% in evaluation, it suffers a substantial drop to 57.80% in generalizability testing, revealing a considerable loss in predictive reliability across domains. In contrast, HDSV and CSEV maintain strong MCC scores in both evaluation and generalization settings, with HDSV reaching 79.42% and 78.42%, and CSEV attaining 78.99% and 78.46%, respectively. This consistency reflects the robustness of our geometric-based selection strategies in preserving inter-class separability, even under extreme data reduction. Collectively, these metric-specific results reinforce the practical effectiveness and generalization strength of HDSV and CSEV in sentiment classification tasks.

4.2.4. Comparison with Established Data Reduction Methods

To evaluate the effectiveness of our proposed HDSV and CSEV methods, we conducted a comparative analysis against established data reduction techniques, specifically, random sampling and uncertainty-based sampling. All methods were evaluated using the same data constraints: 100 samples for HDSV and two samples for CSEV, ensuring a controlled and unified comparison. The results are summarized in Table 3.
In the 100-sample setting, HDSV achieved a substantially higher evaluation accuracy of 89.30% and an F1-score of 89.76%, outperforming uncertainty sampling (62.85% accuracy, 71.03% F1) and random sampling (59.38% accuracy, 69.74% F1). Moreover, its generalization accuracy reached 88.56%, with only a 0.74% drop from evaluation demonstrating exceptional stability across domains. This is further visualized in Figure 3, where HDSV-selected samples are shown to span the embedding space widely, capturing sentiment diversity and boundary-defining instances. This outcome reflects the central design of HDSV—by selecting sample pairs that are maximally separated in the embedding space, the method preserves discriminative information crucial for robust decision boundary formation.
Qualitatively, this distance-based selection directly improves generalization by capturing class-separating features rather than merely class-representative ones. As shown in Table 2, HDSV’s evaluation and generalization metrics are nearly indistinguishable, indicating that the geometric diversity of the selected data supports cross-domain consistency. This suggests that, even without explicitly isolating components in a controlled experiment, the effectiveness of HDSV can be inferred through its consistent superiority over random and uncertainty-based sampling—both of which inherently include less discriminative data. This contrast highlights the value of HDSV’s targeted selection strategy for both evaluation and cross-domain generalization.
Under extreme data reduction (two training samples), CSEV also outperformed both baselines by a significant margin. While uncertainty sampling dropped to 52.19% evaluation accuracy and 58.33% F1, and random sampling further degraded to 53.66% evaluation accuracy and 43.65% F1, CSEV retained high performance with 88.93% accuracy and 89.55% F1. Its generalization accuracy, at 88.79%, demonstrates minimal degradation (less than 2%) despite the severe data reduction. This resilience stems from the use of the CSR metric (Equation (7)), which quantifies the balance between inter-class separation and intra-class spread in the embedding space.
By explicitly optimizing this ratio, CSEV constructs centroids that are not only representative of their respective classes but also maximally discriminative. In essence, CSR ensures that centroids are sufficiently far apart (for separability) while maintaining low variance within each class (for consistency). These properties allow CSEV to retain semantic boundaries and sentiment distinctions even when compressing the entire dataset into just two vectors.
Insight into the independent contribution of the CSR metric can also be drawn from the same comparative data. The poor performance of random sampling at the two-sample scale (e.g., 47.86% generalization) effectively illustrates the degradation that occurs when CSR is omitted from centroid construction, resulting in less representative and poorly separated class prototypes. Without a principled separation metric, centroid selection becomes arbitrary, leading to overlap between classes and loss of semantic contrast. Therefore, the performance gap between CSEV and random sampling in Table 3 reflects the implicit contribution of the CSR-guided design.
In summary, both HDSV and CSEV outperform traditional reduction methods by leveraging geometric and sentiment-specific principles. HDSV selects samples that sharpen decision boundaries through maximum embedding separation, while CSEV distills full datasets into compact, CSR-optimized prototypes that preserve essential sentiment structure. These advantages become especially prominent under low-resource constraints, where simple sampling strategies fail to maintain accuracy or generalization.

5. Discussion

This study advances sentiment analysis through two novel data reduction approaches: HDSV and CSEV. Our experimental findings demonstrate significant improvements in efficiency and generalizability while maintaining robust performance. These methods offer novel solutions to long-standing challenges in deploying sentiment analysis systems, particularly in resource-constrained environments. The discussion examines their implications across several key dimensions, supported by recent theoretical and empirical research in the field, while exploring the broader impact on the future of efficient sentiment analysis.

5.1. Data Reduction and Efficiency

The significant reduction in data requirements achieved by HDSV and CSEV addresses a critical challenge in language models—the dependency on large training datasets [30]. Our methods achieve compression rates of less than 1% of original size, substantially outperforming previous data reduction approaches, such as active learning methods [16], which typically require 10–20% of the original data. This efficiency aligns with recent theoretical work by Ethayarajh [15] on embedding space analysis and Bronstein et al. [14] on geometric deep learning.
Our approaches demonstrate exceptional robustness in extracting maximally informative samples through innovative geometric analysis of embedding spaces. HDSV’s distance-based selection strategy operates by identifying key examples that define clear sentiment boundaries in the embedding space, effectively capturing the most distinctive sentiment expressions. Meanwhile, CSEV’s centroid computation takes this reduction further by distilling essential class characteristics into representative vectors. This dual approach ensures comprehensive coverage of sentiment variations while minimizing redundancy. By focusing on embeddings with maximal inter-class separation, both methods ensure critical sentiment features are retained while eliminating redundant data points, making them particularly valuable for edge computing applications where resource constraints are critical [30].

5.2. Performance and Robustness

Despite the significant reduction in data, both approaches maintain performance comparable to full dataset training, demonstrating the effectiveness of geometric-based sample selection. Our methods achieve 88.93% accuracy on SST-2 with just 0.1% of the original data, compared to recent work by Liang et al. [31] requiring 10% for similar performance. This efficiency gain is achieved without compromising classification quality, as demonstrated by consistent performance across multiple evaluation metrics including precision, recall, and F1-score.
The stability of CSEV in recall metrics (91.92% in cross-dataset evaluations) is particularly noteworthy, aligning with theoretical predictions about the preservation of semantic information in geometric embeddings [15]. This consistency across different evaluation scenarios demonstrates the robustness of our centroid-based approach in capturing essential sentiment features, suggesting that the method successfully identifies and preserves the most informative aspects of sentiment expression in the embedding space.
The uniqueness of HDSV and CSEV lies in their dual focus on geometric separation and sentiment-specific metrics. Unlike active learning [16], which prioritizes uncertain samples, HDSV selects samples at decision boundaries (Figure 3), directly encoding sentiment polarity distinctions. CSEV advances centroid-based methods [17] by introducing the CSR metric (Equation (7)), which explicitly balances inter-class separation and intra-class coherence. This innovation addresses limitations in prior work, where centroids often failed to capture sentiment nuances [29]. Our methods’ ability to reduce datasets to less than 1% of their original size (e.g., CSEV) while maintaining performance (Table 1) represents a significant leap beyond core-set [27] and clustering approaches [17], which typically require 1–5% of data.

5.3. Cross-Domain Generalization

The improved cross-domain performance addresses a key challenge identified by Liu et al. [32] regarding domain adaptation in sentiment analysis. Our methods demonstrate remarkable stability across different domains, with less than 2% accuracy drop compared to the 11.94% degradation observed with full datasets. This superior generalization capability supports theoretical work by Ramanujan et al. [33] on data diversity and model robustness, while aligning with recent findings by Zhu et al. [34] on the benefits of representative training examples. The maintenance of performance across domains suggests that our methods capture fundamental sentiment features that transcend domain-specific characteristics, a crucial advancement for practical applications where domain adaptation is often a significant challenge.

5.4. Limitations and Future Work

While promising, several limitations warrant investigation. The assumption of linear separability in embedding space, though supported by Ethayarajh [15], may present challenges in more complex sentiment scenarios [32]. Our current geometric analysis, including the selection strategies employed in HDSV and the CSR-based centroid computation in CSEV, implicitly relies on the notion that sentiment classes can be meaningfully distinguished along linear boundaries in the embedding space. However, this assumption may not hold in the presence of subtle affective states, overlapping emotional categories, or expressions involving irony, sarcasm, or mixed emotions, which tend to introduce non-linear patterns in the data.
This limitation becomes particularly relevant when considering sentiment nuances that defy crisp categorization or lie along a continuum of affect. In such cases, the decision boundaries between sentiment classes may curve or warp in high-dimensional space, requiring more expressive modeling frameworks. Addressing these complexities may necessitate the adoption of non-linear transformation techniques, such as kernel-based classifiers, manifold learning approaches (e.g., t-SNE, UMAP), or non-linear dimensionality reduction methods that can better capture the underlying topology of sentiment-laden text representations. These techniques could potentially reveal non-obvious class structures in the embedding space and support more accurate selection or construction of informative training samples.
The current focus on binary classification raises additional questions about scalability to multi-class or fine-grained sentiment analysis tasks, where recent work suggests more sophisticated embedding analysis may be necessary [35]. Our Centroid Sentiment Embedding Vector (CSEV) method, while effective for binary classification, faces scalability issues in such settings. As the number of sentiment classes increases, so too does intra-class variability, which may render traditional centroid-based representations insufficient for capturing finer distinctions. In this context, alternative strategies such as supervised clustering, graph-based neural networks, or class-conditional prototype learning could enhance inter-class discriminability without sacrificing generalization.
Moreover, while cross-dataset evaluations confirm the generalization ability of our methods for binary classification, results from [36] highlight limitations when dealing with nuanced or multi-class sentiment tasks. These findings suggest that the geometric properties of embeddings may not generalize uniformly across emotional categories, especially when latent affective dimensions are entangled. Despite these limitations, our primary focus remains on efficient binary sentiment classification in low-resource settings, where HDSV and CSEV offer a computationally efficient and principled approach. However, addressing non-linear sentiment relationships, multi-class scalability, and contextual dependencies represents a promising and necessary direction for future work.

5.5. Practical Implications

The efficiency gains have significant implications for sustainable AI deployment, extending beyond mere computational savings to enable new application paradigms. Beyond the immediate benefits of reduced computational requirements, aligned with emerging research on green AI [37], our methods enable new possibilities in resource-constrained environments. The demonstrated effectiveness in real-time applications, from social media monitoring [1] to customer feedback analysis [3], suggests broad practical applicability. The ability to maintain high performance with minimal data requirements opens opportunities for rapid model adaptation and deployment in dynamic environments, where data availability or computational resources may be limited. These advances contribute to more sustainable and scalable machine learning practices while maintaining robust performance, potentially transforming how sentiment analysis systems are deployed across diverse applications.
The minimal data requirements and robust performance characteristics of our methods make them particularly valuable for applications where rapid deployment and adaptation are crucial. This could include emergency response systems, real-time market analysis, and dynamic social media monitoring, where the ability to quickly adapt to new domains while maintaining performance is essential. Furthermore, the reduced storage and computational requirements align well with edge computing scenarios, enabling sophisticated sentiment analysis capabilities on resource-constrained devices.

6. Conclusions

This study presented two approaches for efficient sentiment analysis through data reduction: HDSV and CSEV. Our experimental results across SST-2, Yelp, and Sentiment140 datasets demonstrate that these methods can effectively reduce training data while maintaining robust performance. HDSV achieved significant data reduction to just 100 samples while maintaining 89.30% accuracy, and CSEV further reduced this to just two representative vectors while achieving 88.93% accuracy. A key finding of our work is the improved cross-dataset generalization capabilities, with both HDSV and CSEV maintaining stable performance (less than 2% accuracy variation) compared to full dataset models (11.94% accuracy drop). By reducing dataset sizes to less than 1% of their original size while maintaining performance, our methods enable efficient deployment of sentiment analysis systems in resource-constrained environments. Future work includes extending these approaches to more complex sentiment tasks and exploring non-linear separation techniques.

Funding

This research received no external funding.

Data Availability Statement

The datasets supporting the reported results are publicly available at the following links: Stanford Sentiment Treebank (SST-2): https://huggingface.co/datasets/stanfordnlp/sst2 (accessed on 16 March 2025), Yelp Review Full Dataset: https://huggingface.co/datasets/Yelp/yelp_review_full (accessed on 16 March 2025), and Sentiment140 Dataset: https://huggingface.co/datasets/stanfordnlp/sentiment140 (accessed on 16 March 2025).

Conflicts of Interest

The author declares no conflicts of interest.

References

  1. Kaiser, C.; Ahuvia, A.; Rauschnabel, P.A.; Wimble, M. Social media monitoring: What can marketers learn from Facebook brand photos? J. Bus. Res. 2020, 117, 707–717. [Google Scholar] [CrossRef]
  2. Kim, J.H.; Sabherwal, R.; Bock, G.W.; Kim, H.M. Understanding social media monitoring and online rumors. J. Comput. Inf. Syst. 2021, 61, 507–519. [Google Scholar] [CrossRef]
  3. de Oliveira Santini, F.; Ladeira, W.J.; Pinto, D.C.; Herter, M.M.; Sampaio, C.H.; Babin, B.J. Customer engagement in social media: A framework and meta-analysis. J. Acad. Mark. Sci. 2020, 48, 1211–1228. [Google Scholar] [CrossRef]
  4. Choi, J.; Yoon, J.; Chung, J.; Coh, B.Y.; Lee, J.M. Social media analytics and business intelligence research: A systematic review. Inf. Process. Manag. 2020, 57, 102279. [Google Scholar] [CrossRef]
  5. Devlin, J.; Chang, M.; Lee, K.; Toutanova, K. BERT: Pre-training of Deep Bidirectional Transformers for Language Understanding. In Proceedings of the 2019 Conference of the North American Chapter of the Association for Computational Linguistics: Human Language Technologies, NAACL-HLT 2019, Minneapolis, MN, USA, 2–7 June 2019; Burstein, J., Doran, C., Solorio, T., Eds.; Long and Short Papers. Association for Computational Linguistics: Stroudsburg, PA, USA, 2019; Volume 1, pp. 4171–4186. [Google Scholar] [CrossRef]
  6. Brown, T.; Mann, B.; Ryder, N.; Subbiah, M.; Kaplan, J.D.; Dhariwal, P.; Neelakantan, A.; Shyam, P.; Sastry, G.; Askell, A.; et al. Language models are few-shot learners. Adv. Neural Inf. Process. Syst. 2020, 33, 1877–1901. [Google Scholar]
  7. Lankford, S.; Afli, H.; Way, A. adaptmllm: Fine-tuning multilingual language models on low-resource languages with integrated llm playgrounds. Information 2023, 14, 638. [Google Scholar] [CrossRef]
  8. Ding, N.; Qin, Y.; Yang, G.; Wei, F.; Yang, Z.; Su, Y.; Hu, S.; Chen, Y.; Chan, C.M.; Chen, W.; et al. Parameter-efficient fine-tuning of large-scale pre-trained language models. Nat. Mach. Intell. 2023, 5, 220–235. [Google Scholar] [CrossRef]
  9. Sanh, V. DistilBERT, a distilled version of BERT: Smaller, faster, cheaper and lighter. arXiv 2019, arXiv:1910.01108. [Google Scholar]
  10. Gou, J.; Yu, B.; Maybank, S.J.; Tao, D. Knowledge distillation: A survey. Int. J. Comput. Vis. 2021, 129, 1789–1819. [Google Scholar] [CrossRef]
  11. Wang, S.; Xu, Y.; Fang, Y.; Liu, Y.; Sun, S.; Xu, R.; Zhu, C.; Zeng, M. Training Data is More Valuable than You Think: A Simple and Effective Method by Retrieving from Training Data. In Proceedings of the 60th Annual Meeting of the Association for Computational Linguistics (Volume 1: Long Papers), ACL 2022, Dublin, Ireland, 22–27 May 2022; Muresan, S., Nakov, P., Villavicencio, A., Eds.; Association for Computational Linguistics: Stroudsburg, PA, USA, 2022; pp. 3170–3179. [Google Scholar] [CrossRef]
  12. Raffel, C.; Shazeer, N.; Roberts, A.; Lee, K.; Narang, S.; Matena, M.; Zhou, Y.; Li, W.; Liu, P.J. Exploring the limits of transfer learning with a unified text-to-text transformer. J. Mach. Learn. Res. 2020, 21, 1–67. [Google Scholar]
  13. Peters, M.E.; Neumann, M.; Zettlemoyer, L.; Yih, W. Dissecting Contextual Word Embeddings: Architecture and Representation. In Proceedings of the 2018 Conference on Empirical Methods in Natural Language Processing, Brussels, Belgium, 31 October–4 November 2018; Riloff, E., Chiang, D., Hockenmaier, J., Tsujii, J., Eds.; Association for Computational Linguistics: Stroudsburg, PA, USA, 2018; pp. 1499–1509. [Google Scholar] [CrossRef]
  14. Bronstein, M.M.; Bruna, J.; Cohen, T.; Veličković, P. Geometric deep learning: Grids, groups, graphs, geodesics, and gauges. arXiv 2021, arXiv:2104.13478. [Google Scholar]
  15. Ethayarajh, K. How Contextual are Contextualized Word Representations? Comparing the Geometry of BERT, ELMo, and GPT-2 Embeddings. In Proceedings of the 2019 Conference on Empirical Methods in Natural Language Processing and the 9th International Joint Conference on Natural Language Processing (EMNLP-IJCNLP), Hong Kong, China, 3–7 November 2019; Inui, K., Jiang, J., Ng, V., Wan, X., Eds.; Association for Computational Linguistics: Stroudsburg, PA, USA, 2019; pp. 55–65. [Google Scholar] [CrossRef]
  16. Tharwat, A.; Schenck, W. A survey on active learning: State-of-the-art, practical challenges and research directions. Mathematics 2023, 11, 820. [Google Scholar] [CrossRef]
  17. Zhang, S.; Chen, H.; Ming, X.; Cui, L.; Yin, H.; Xu, G. Where are we in embedding spaces? In Proceedings of the 27th ACM SIGKDD Conference on Knowledge Discovery & Data Mining, Virtual, 14–18 August 2021; pp. 2223–2231. [Google Scholar]
  18. Socher, R.; Perelygin, A.; Wu, J.; Chuang, J.; Manning, C.D.; Ng, A.; Potts, C. Recursive Deep Models for Semantic Compositionality Over a Sentiment Treebank. In Proceedings of the 2013 Conference on Empirical Methods in Natural Language Processing, Seattle, WA, USA, 18–21 October 2013; pp. 1631–1642. [Google Scholar]
  19. Zhang, X.; Zhao, J.; LeCun, Y. Character-Level Convolutional Networks for Text Classification. arXiv 2015, arXiv:1509.01626 [Cs]. [Google Scholar]
  20. Go, A.; Bhayani, R.; Huang, L. Twitter sentiment classification using distant supervision. Cs224N Proj. Rep. Stanf. 2009, 1, 2009. [Google Scholar]
  21. Barnes, J.; Øvrelid, L.; Velldal, E. Sentiment Analysis Is Not Solved! Assessing and Probing Sentiment Classification. In Proceedings of the 2019 ACL Workshop BlackboxNLP: Analyzing and Interpreting Neural Networks for NLP, Florence, Italy, 1 August 2019; Linzen, T., Chrupała, G., Belinkov, Y., Hupkes, D., Eds.; Association for Computational Linguistics: Stroudsburg, PA, USA, 2019; pp. 12–23. [Google Scholar] [CrossRef]
  22. Taboada, M.; Brooke, J.; Tofiloski, M.; Voll, K.; Stede, M. Lexicon-based methods for sentiment analysis. Comput. Linguist. 2011, 37, 267–307. [Google Scholar] [CrossRef]
  23. Kim, J.; Lee, M. Robust lane detection based on convolutional neural network and random sample consensus. In Proceedings of the International Conference on Neural Information Processing, Montreal, QC, Canada, 8–13 December 2014; Springer: Cham, Switzerland, 2014; pp. 454–461. [Google Scholar]
  24. Aquino-Brítez, S.; García-Sánchez, P.; Ortiz, A.; Aquino-Brítez, D. Towards an Energy Consumption Index for Deep Learning Models: A Comparative Analysis of Architectures, GPUs, and Measurement Tools. Sensors 2025, 25, 846. [Google Scholar] [CrossRef]
  25. Khalil, M.; McGough, A.S.; Pourmirza, Z.; Pazhoohesh, M.; Walker, S. Machine Learning, Deep Learning and Statistical Analysis for forecasting building energy consumption—A systematic review. Eng. Appl. Artif. Intell. 2022, 115, 105287. [Google Scholar] [CrossRef]
  26. Xie, Q.; Dai, Z.; Hovy, E.; Luong, T.; Le, Q. Unsupervised data augmentation for consistency training. Adv. Neural Inf. Process. Syst. 2020, 33, 6256–6268. [Google Scholar]
  27. Feldman, D. Core-sets: Updated survey. In Sampling Techniques for Supervised or Unsupervised Tasks; Springer: Cham, Switzerland, 2020; pp. 23–44. [Google Scholar]
  28. Lorenzoni, G.; Portugal, I.; Alencar, P.; Cowan, D. Exploring Variability in Fine-Tuned Models for Text Classification with DistilBERT. arXiv 2024, arXiv:2501.00241. [Google Scholar]
  29. Reyad, M.; Sarhan, A.M.; Arafa, M. A modified Adam algorithm for deep neural network optimization. Neural Comput. Appl. 2023, 35, 17095–17112. [Google Scholar] [CrossRef]
  30. Yang, Y.; Zhou, J.; Ding, X.; Huai, T.; Liu, S.; Chen, Q.; Xie, Y.; He, L. Recent advances of foundation language models-based continual learning: A survey. ACM Comput. Surv. 2025, 57, 112. [Google Scholar] [CrossRef]
  31. Liang, P.; Bommasani, R.; Lee, T.; Tsipras, D.; Soylu, D.; Yasunaga, M.; Zhang, Y.; Narayanan, D.; Wu, Y.; Kumar, A.; et al. Holistic evaluation of language models. arXiv 2022, arXiv:2211.09110. [Google Scholar]
  32. Liu, J.; Zheng, S.; Xu, G.; Lin, M. Cross-domain sentiment aware word embeddings for review sentiment analysis. Int. J. Mach. Learn. Cybern. 2021, 12, 343–354. [Google Scholar] [CrossRef]
  33. Ramanujan, V.; Nguyen, T.; Oh, S.; Farhadi, A.; Schmidt, L. On the connection between pre-training data diversity and fine-tuning robustness. Adv. Neural Inf. Process. Syst. 2024, 36, 66426–66437. [Google Scholar]
  34. Zhu, R.; Guo, D.; Qi, D.; Chu, Z.; Yu, X.; Li, S. A Survey of Trustworthy Representation Learning Across Domains. ACM Trans. Knowl. Discov. Data 2024, 18, 173. [Google Scholar] [CrossRef]
  35. Ma, Y.; Liu, X.; Zhao, L.; Liang, Y.; Zhang, P.; Jin, B. Hybrid embedding-based text representation for hierarchical multi-label text classification. Expert Syst. Appl. 2022, 187, 115905. [Google Scholar] [CrossRef]
  36. Yuan, M.; Mengyuan, Z.; Jiang, L.; Mo, Y.; Shi, X. stce at semeval-2022 task 6: Sarcasm detection in english tweets. In Proceedings of the 16th International Workshop on Semantic Evaluation (SemEval-2022), Virtual, 14–15 July 2022; pp. 820–826. [Google Scholar]
  37. Walker, T.; Wendt, S.; Goubran, S.; Schwartz, T. Artificial Intelligence for Sustainability: An Overview. In Artificial Intelligence For Sustainability: Innovations In Business And Financial Services; Palgrave Macmillan: Cham, Switzerland, 2024; pp. 1–10. [Google Scholar]
Figure 1. System pipeline overview: text preprocessing, DistilBERT embedding generation, followed by HDSV selection and CSEV generation for efficient data reduction.
Electronics 14 01919 g001
Figure 2. Visualization of sentiment embeddings using dimensionality reduction. PCA (a,c,e) shows global sentiment structure and t-SNE (b,d,f) reveals local clusters across SST-2, Yelp, and Sentiment140 datasets, with positive (yellow) and negative (purple) sentiments.
Electronics 14 01919 g002
Figure 3. Visualization of distance-based sample selection process. Red (×) and blue (×) markers indicate selected positive and negative samples, respectively. (a) SST-2: samples concentrated at distribution extremes; (b) Yelp: samples selected from most distinctive regions; (c) Sentiment140: samples positioned at sentiment endpoints. All selections maintain balanced class representation ( | S pos | = | S neg | = n / 2 ) while maximizing inter-class distance.
Electronics 14 01919 g003
Figure 4. Performance metrics comparison across training approaches (Full dataset, HDSV, and CSEV): (a) F1-score, (b) Accuracy, (c) Recall, (d) Precision. Results demonstrate comparable performance of reduced datasets while maintaining better generalizability than the full dataset approach.
Electronics 14 01919 g004
Table 1. Dataset size and sample count comparison across different dataset types.
DatasetTypeSize (MB)Relative Size (%)Training Samples
Sentiment140HDSV117.661%100
CSEV2.59Less than 1%2
Full10,608.69100%1,600,000
SST-2HDSV117.6619%100
CSEV2.59Less than 1%2
Full613.57100%67,349
YelpHDSV117.66Less than 1%100
CSEV2.59Less than 1%2
Full42,153.33100%560,000
Table 2. Performance metrics comparison across different datasets and testing methods.
TypeTesting MethodAccuracyF1-ScorePrecisionRecallMCC
FullEvaluation90.14%90.36%90.57%90.16%80.73%
Generalizability78.20%78.30%80.00%77.50%57.80%
CSEVGeneralizability88.79%89.30%87.21%91.92%78.46%
Evaluation88.93%89.55%88.27%91.20%78.99%
HDSVGeneralizability88.56%88.97%88.11%90.80%78.42%
Evaluation89.30%89.76%88.94%90.79%79.42%
MCC: Matthews Correlation Coefficient.
Table 3. Performance comparison of reduction methods across different sample sizes.
# SamplesReduction MethodTesting MethodAccuracyPrecisionRecallF1
100UncertaintyEvaluation62.85%61.83%84.80%71.03%
SamplingGeneralizability54.63%54.18%96.17%69.77%
100RandomEvaluation59.38%62.00%82.93%69.74%
SamplingGeneralizability53.88%68.89%34.40%25.13%
2UncertaintyEvaluation52.19%54.53%63.93%51.61%
SamplingGeneralizability50.48%52.88%65.78%58.33%
2RandomEvaluation53.66%58.25%59.16%48.78%
SamplingGeneralizability47.86%34.24%54.08%43.65%
Disclaimer/Publisher’s Note: The statements, opinions and data contained in all publications are solely those of the individual author(s) and contributor(s) and not of MDPI and/or the editor(s). MDPI and/or the editor(s) disclaim responsibility for any injury to people or property resulting from any ideas, methods, instructions or products referred to in the content.

